oklahoma state university assessment report 2009-2010 · · 2015-07-29create / innovate / educate...
TRANSCRIPT

create / innovate / educate / GO STATE
Oklahoma State University
Assessment Report 2009-2010
Submitted to The Oklahoma State Regents for Higher Education
January 3, 2011
Jeremy Penn, Ph.D. Director
University Assessment and Testing 107 UAT Building
Oklahoma State University Stillwater, OK 74078-6043
405-744-6687 [email protected]
http://uat.okstate.edu

2009-2010 Assessment Report
Oklahoma State University http://uat.okstate.edu
1
I. Entry-Level Assessment The purpose of entry-level assessment is to assist academic advisors in making placement decisions that will give students the best possible chance of academic success. 1. Three methods are used to assess students’ readiness for college level coursework: the ACT (consisting of four subtests in English, Reading, Mathematics, and Science Reasoning), the Entry-Level Placement Analysis (ELPA, developed by OSU), and the Computer Adaptive Placement and Support System (COMPASS) test published by ACT. 2. All enrolled new students (new freshmen and transfer students with fewer than 24 credit hours) are assessed using a combination of the measures described in I-1. Each student receives a Student Assessment Report that summarizes: The student’s academic summary (ACT scores, high school GPA, high school class
rank) The student’s ELPA results The curricular and performance deficiencies that require remediation, and The recommendations and requirements for course placement based on OSU’s
guidelines as approved by the Oklahoma State Regents for Higher Education. Reports are produced by the Office of Institutional Research and Information Management and are distributed to students by the New Student Orientation Office. Reports are also included in each student’s file and are available to advisors. The assessment process is implemented immediately prior to the spring and fall enrollment periods. 3. The process and measures used in entry-level testing are described below. Students identified with skill deficiencies through this process are required to complete remedial courses within the first 24 hours of college credit. ACT Scores ACT subscores in Reading, English, Mathematics, and Science Reasoning of 19 or above (or SAT equivalent where available) automatically qualify students for college-level coursework (1000-level) in that subject area. The ACT subscore in Reading is also used to indicate readiness for introductory college courses that require extensive reading (Sociology, Political Science, Psychology, History, Economics, and Philosophy). ELPA ELPA is a multiple regression model that uses high school grades (overall and by subject), high school class rank, and ACT composite and subject area scores to predict student grades in selected entry-level OSU courses. The ELPA model is based on the success of past OSU freshmen with similar academic records and is updated regularly. ELPA produces a predicted grade index (PGI) for each student that represents the

2009-2010 Assessment Report
Oklahoma State University http://uat.okstate.edu
2
grade the student is predicted to obtain in selected entry-level courses. A PGI of 2.0 or higher indicates that the student has a 70% chance of making a ‘C’ or better. PGI scores are used in combination with ACT score (when the ACT score is below 19) and students’ grades to make decisions about appropriate course placement. English. UNIV 0133 is required when the English ACT is below 14 or the English ACT is between 14 and 18 and the English PGI is below 2.0. Math. If the student’s PGI is 2.0 or above and high school math grade point average is 3.0 or above, then there are no enrollment restrictions. If the student’s PGI is below 2.0 and high school grade point average is below 3.0, then UNIV 0023 or UNIV 0123 is required. Science. If the student’s ACT is less than 19 and the PGI is greater than 2.0, then there are no enrollment restrictions. If the student’s ACT is less than 19 and the PGI is below 2.0, then UNIV 0113 is required. Students may have the science deficiency removed by completing remedial math and/or reading courses (if required). Reading. For courses that require extensive reading, if the student’s ACT is below 19 but the PGI is greater than 2.0, then there are no enrollment restrictions. If the PGI is below 2.0 then UNIV 0143 is required. COMPASS Students identified as having curricular deficiencies in a particular subject area may choose to take the ACT COMPASS placement test to qualify for college-level courses. The COMPASS tests are provided free of charge to students at the OSU Testing Center and can also be completed at NOC-Stillwater, NOC-Tonkawa, NOC-Enid, OSU-OKC, and OSU-Tulsa. COMPASS tests are available in Mathematics, Reading and English. Qualification for 1000-level science courses is obtained through receipt of passing scores on both the Reading and Mathematics subject tests. A new Science Reading subject test is under development that will be used in combination with the mathematics subject test for science course placement. Cut scores for the COMPASS test are shown in Table I.1.

2009-2010 Assessment Report
Oklahoma State University http://uat.okstate.edu
3
Table I.1. Cut-scores for the COMPASS placement test . Subject Area COMPASS Score Course Placement
Mathematics Algebra 0-54 UNIV 0023 or UNIV 0123 required Algebra 55-71 UNIV 0123 recommended Algebra 72-100 No restrictions
English English 0-55 UNIV 0133 required English 56-100 No restrictions
Reading (or related courses) Reading 0-70 UNIV 0143 required Reading 71-100 No restrictions
Science1 (Biology, Chemistry, Geography, Geology, and Physics)
Reading 0-70 or Algebra 0-54 UNIV 0113 required Reading 71-100 and Algebra 55-100
No restrictions
1. Science reading subject test under development.
Students may take the COMPASS exams twice. Additional COMPASS testing requires approval of the Director of Assessment and Testing. Educational Readiness Other elements of entry-level assessment, including evaluation of educational readiness, educational goals, study skills, values, self-concept and motivation are managed through the advising process. Resources Many resources are available to students for academic support. University Academic Services (UAS) offers free tutoring services. The Math Learning Resource Center provides individual tutoring in mathematics. The Writing Center provides tutors, writing coaches, a grammar hotline, and other assistance. University Counseling provides services to help students improve their study habits, deal with test anxiety, develop better time management skills, and explore careers. Many colleges offer additional resources such as tutoring in science, technology, and math courses, transition programs, and other academic resources. 4. In 2009-2010, a total of 3,598 admitted and enrolled students with fewer than 24 credit hours were assessed using the entry-level assessment process. Table I.2 shows the number of enrolled students who had performance deficiencies in each subject area based on ACT scores and the number of students who were cleared for college-level coursework using ELPA.

2009-2010 Assessment Report
Oklahoma State University http://uat.okstate.edu
4
Table I.2. Number of enrolled new students with ACT scores below 19 in each subject area and the number of students who were cleared for college-level coursework by ELPA in 2009-2010. Subject Area
# of Students
with ACT sub-scores <191
# of Students cleared for college-level coursework
by ELPA English 306 252
Mathematics 481 251
Reading 241 176
Science 148 31
1. Some students had ACT subscores less than 19 in more than one subject area. The following numbers of students were missing ACT subscores in these subject areas: English: 75, mathematics: 76, reading: 76, science: 314.
Students who were not cleared for college-level coursework using ELPA could choose to take a COMPASS placement exam in the area(s) of deficiency. The number of students who took the COMPASS test in each subject area and the number of students who passed are shown in Table I.3.
Table I.3. Number of students who took COMPASS tests for 2009-2010 placement.
Subject Area
# of Enrolled Students who
took a COMPASS test1
# of Students who passed COMPASS and were cleared for college-level coursework
English 18 13
Mathematics 25 1
Reading 22 18
1. Some students took COMPASS tests in more than one area. Cut-scores are shown in Table I.1. Some students took COMPASS test(s) although they were not required by ELPA to take remedial courses.
After all entry-level assessment was completed, 307 students (8.5% of the total new enrolled) were required to take at least one remedial course. Of the 3,598 new students in 2009-2010, 37 (1.0%) were required to enroll in remedial English classes, 202 (5.6%) in remedial math classes, 109 (3.0%) in remedial science classes, and 54 (1.5%) in remedial reading classes. Some students who were required to complete remedial classes satisfied the requirement with transfer courses. For this reason the number of students who completed remedial courses may differ from the number of students required to do so. 5. Annual trends in grades, drops, withdrawals, and failure rates in common freshmen courses are monitored by Institutional Research and Information Management and University Academic Services. Results from the tracking process are shared each semester with the Directors of Student Academic Services and the Instruction Council. The Office of University Assessment and Testing and the Office of Institutional Research and Information Management work cooperatively to evaluate the entry-level

2009-2010 Assessment Report
Oklahoma State University http://uat.okstate.edu
5
assessment process and to track student success in remedial and college-level courses. 6. An analysis of new freshmen who matriculated in 2001-2003 showed that students who received an ACT subscore below 19 and were cleared by ELPA performed as well in college-level courses as students who scored 19 or above. The Directors of Student Academic Services reviewed the cut-scores and determined that no changes were needed in 2009-2010. No changes were made to the entry-level assessment procedures or to COMPASS testing in 2009-2010. A Science Reading COMPASS subject test and related cut scores are under development. 7. Two additional studies of entry-level students were performed in 2008-2009: the Cooperative Institutional Research Program (CIRP) and the National Survey of Student Engagement (NSSE). The NSSE, while not a traditional entry-level measure, does ask first-year students questions about their level of engagement in educationally enriching activities. 8. Detailed information about the CIRP results can be located on the UAT website (http://uat.okstate.edu/index.php?option=com_content&view=article&id=34&Itemid=31). OSU freshmen were more likely than freshmen students at peer institutions to predict a “very good chance” of participating in student government, student clubs or groups, and volunteer or community service work. OSU freshmen were also more likely than freshmen students at peer institutions to take notes during class, vote in student elections, perform community service as part of class, attend school within 100 miles of their hometown, have higher high school grades, and be attending their first choice of college. Detailed information about the NSSE results can be located on the UAT website (http://uat.okstate.edu/index.php?option=com_content&view=article&id=33&Itemid=30). All five of OSU’s NSSE benchmarks for first-year students were significantly higher than they were in 2005 and two of the benchmarks (Student-Faculty Interaction and Supportive Campus Environment) were significantly higher than the average score at participating doctoral / research institutions. 9. The primary purpose of entry-level assessment is to place students in the courses that are most likely to lead to student success. Entry-level assessment data are monitored to ensure theses course placement decisions are accurate and appropriate. The use of the COMPASS Science Reading subject test is under development.

2009-2010 Assessment Report
Oklahoma State University http://uat.okstate.edu
6
II. General Education Assessment 1. General education at Oklahoma State University is intended to: A. Construct a broad foundation for the student’s specialized course of study, B. Develop the student’s ability to read, observe, and listen with comprehension, C. Enhance the student’s skills in communicating effectively, D. Expand the student’s capacity for critical analysis and problem solving, E. Assist the student in understanding and respecting diversity in people, beliefs, and
societies, and F. Develop the student’s ability to appreciate and function in the human and natural
environment. Three approaches are used to evaluate the general education program: Institutional Portfolios, Review of General Education Course Database, and college-, department-, and program-level approaches. Institutional Portfolios Institutional portfolios provide direct evidence of student achievement of the overall goals of the general education program. Institutional portfolios have been developed in five areas that represent the overall goals of the general education program: written communication (B and C), critical thinking (D), math problem solving (D), science problem solving (D), and diversity (E and F). Goal A is not directly assessed through the use of institutional portfolios but is included as a component of program outcomes assessment. Although rubrics for assessment of general education can be directly linked to each of the overall goals, it is recognized that these goals cannot be achieved independently of each other or through completion of only courses with general education designations. For this reason the Institutional Portfolios contain artifacts from general education designated courses and other courses across campus that address one or more of the general education goals. Review of General Education Course Database The General Education Advisory Council (GEAC) periodically evaluates every general education course to ensure alignment with the goals of the general education program. As part of this certification process instructors identify which general education goals are associated with the course, describe the course activities that provide students the opportunity to achieve the goals, and explain how student achievement of the goals is assessed within the course. This process provides oversight for courses receiving the general education designations and ensures students have sufficient opportunity to achieve the goals of the general education program. College-, Department-, and Program-level Approaches Many colleges, departments, and programs include elements from the general education goals in their own assessment efforts. For example, a program may assess students’ ability to write a research paper relevant to the discipline. This integrates elements from the general education program (e.g., written communication) with

2009-2010 Assessment Report
Oklahoma State University http://uat.okstate.edu
7
elements from the discipline and provides additional information on student achievement of this important goal. Colleges and departments may also incorporate elements of the general education goals into their ongoing assessment processes. 2. Institutional Portfolios Since 2001 OSU has collected samples of student work that represent student achievement of the general education goals from courses across campus. These student work samples are then assessed by a panel of faculty members using rubrics. The results from this process provide direct evidence of student achievement of the general education goals. To make the best use of limited resources institutional portfolios are not collected in every area every year. Table II.1 shows the years each area was assessed (three were assessed in 2010: written communication, critical thinking, and diversity). Table II.1. Dates for assessment of general education learning outcomes Portfolio area Years assessed Written communication 2001, 2002, 2003, 2004, 2005, 2006, 2008, 2009, 2010 Math problem solving 2002, 2003, 2005 Science problem solving 2003, 2004, 2005, 2007, 2009 Critical thinking 2005, 2006, 2007, 2008, 2009, 2010 Diversity 2007, 2008, 2009, 2010
Once courses with suitable assignments are identified, student papers are sampled randomly. Since the purpose of general education assessment is to improve the general education program and not to evaluate individual students, all identifying information is removed to protect student anonymity. Review of General Education Course Database Each course with a general education designation is reviewed every three years. College-, Department-, and Program-level Approaches College-, department-, and program-approaches to assessing general education goals are included in the program outcomes assessment portion of this report. 3. Institutional Portfolios Since the institutional portfolio process is integrated within existing courses, students are motivated to provide their best work as required by the demands of the course. Students receive feedback on that work from the course instructor. Review of General Education Course Database The database review process does not directly involve students. Instructors are motivated to provide accurate and complete information since failure to do so could result in loss of the general education designation.

2009-2010 Assessment Report
Oklahoma State University http://uat.okstate.edu
8
College-, Department-, and Program-level Approaches College-, department-, and program-approaches to assessing general education goals are reported in the program outcomes assessment portion of this report. 4. Assessment data from the general education assessment process are used in three ways: A. To implement improvement initiatives B. To monitor recent curricular changes C. To consider and discuss additional modifications to the general education program A. In response to data on student achievement of the general education goals, in the spring of 2008 faculty members Rebecca Damron and Karen High proposed the development of a series of workshops for faculty members on teaching and assessing critical thinking. Recognizing a need to improve in multiple areas, the Provost’s Office, the Office of University Assessment, the General Education Assessment Committee, and the Institute for Teaching and Learning Excellence collaborated to implement the Provost’s Faculty Development Initiative: Focus on General Education. The purpose of the initiative is to develop faculty members’ expertise in teaching and assessing the general education learning goal, in integrating the general education learning goal into existing courses, and in creating high quality assignments that demonstrate students’ achievement of the general education goal. The initiative is implemented by trained facilitators who run two workshops for participants in the fall and a follow-up workshop in the spring semester. Upon successful completion of the workshop series and submission of artifacts from the improved course, faculty members are paid a small stipend. In 2009-2010 workshop series were available in the areas of writing, critical thinking, and diversity. The initiative is underway in 2010-2011 with workshop series available in the same three general education goal areas. A phase-2 initiative, to encourage additional participation from faculty members across campus and develop even higher level assignments, is planned for the spring semester of 2011. B. Assessment data from the general education assessment process are used to monitor recent changes to the general education program. For a number of years data from the general education process highlighted a need to improve student writing. In response the general education designation requirements were changed to increase the amount of writing required in courses receiving general education designations. The phase-in period for the change in writing requirements is now ending and general education assessment data are used to monitor the success of that curricular change.

2009-2010 Assessment Report
Oklahoma State University http://uat.okstate.edu
9
C. Assessment data from the general education assessment process are shared broadly internally and publicly (http://uat.okstate.edu/index.php?option=com_content&view=article&id=55&Itemid=14) to encourage discussion and consideration of additional curricular changes that may result in improvement to the general education assessment program and to student achievement of the general education goals (the 2010 report will be available in early 2011). One example of a local process to discuss possible changes is the joint meeting of three committees (General Education Assessment Committee, General Education Advisory Council, and Assessment and Academic Improvement Council) to discuss assessment results, consider needed changes, and provide recommendations for improvement. Examples of changes discussed include creation of additional capstone courses, modifications to the general education assessment process, and faculty development. 4 (Analyses and Findings). Individual student progress is not tracked as part of the general education assessment process. The purpose of general education assessment process is to assess and improve the general education program – not to evaluate individual students, faculty members, or courses. However, because institutional portfolios are collected regularly the process does allow OSU to detect changes in student achievement of the general education goals over time. 5. Institutional Portfolios – Critical Thinking 112 samples of student work were assessed by a panel of faculty members using a rubric developed and approved by OSU faculty members. The critical thinking rubric has four required characteristics (identification of the problem, presentation of the student’s own perspective and position, use of supporting data / evidence, and discussion of conclusions, implications and consequences) and three optional characteristics (consideration of other salient perspectives, assessment of assumptions and validity of supporting / background information, and consideration of context of the issue). Each characteristic is scored on a scale of 1 to 5 where 1 is low and 5 is high (the rubric is available:http://uat.okstate.edu/images/rubrics/critical%20thinking%20rubric%205-1-10.pdf). 79 samples (71%) were scored as a ‘3’ or above and only 2 samples (1.8%) received a score of ‘1.’ The average of all scores was 2.90 which was slightly lower than last year’s score of 2.94. Reviewers also worked on developing strategies for giving faculty members feedback on the attributes of their critical thinking assignments. Institutional Portfolios – Written Communication 147 samples of student work were assessed by a panel of faculty members using a rubric developed and approved by OSU faculty members. The writing rubric has four required characteristics (content, organization, style and mechanics, and

2009-2010 Assessment Report
Oklahoma State University http://uat.okstate.edu
10
documentation). Each characteristic is scored on a scale of 1 to 5 where 1 is low and 5 is high (http://uat.okstate.edu/images/rubrics/written%20communication%20rubric%206-9-10.pdf). 109 samples (74%) were scored as a ‘3’ or above and only 4 samples (2.7%) received a score of ‘1.’ The average was 3.06 which is the highest average score in this area to date (the 2006 average is second highest at 3.03). Reviewers also spent time setting a goal score for graduating seniors (note that the full sample includes freshmen, sophomores, juniors, and seniors). This score was established as 3.5. Results comparing seniors’ scores to this goal score will be reported in the full general education report in the early spring of 2011. Institutional Portfolios – Diversity 66 samples of student work were assessed by a panel of faculty members using a rubric developed and approved by OSU faculty members. The diversity rubric has four characteristics (conceptual understanding, values diversity, knowledge of historical context, and sources of understanding, value, and knowledge). Each characteristic is scored on a scale of 1 to 5 where 1 is low and 5 is high (http://uat.okstate.edu/images/rubrics/diversity%20rubric%205-1-10.pdf). 33 samples (50%) were scored as a ‘3’ or above and 20 samples (25%) received a score of ‘1.’ The average was 2.33 which is equal to the 2007 average of 2.33 and smaller than the 2008 average of 3.16 and the 2009 average of 2.66. The number of artifacts scored in the diversity area is somewhat lower than in past years because each artifact was double scored on the Association of American Colleges and University’s VALUE rubric for intercultural competence. Use of Findings In response to these findings, the institution has decided to continue to fund the Provost’s Faculty Development Initiative: Focus on General Education in 2010-2011 and further grow the level-2 initiative. The critical thinking study group that formed last year is currently implementing a pilot study on using journaling to enhance students’ critical thinking skills and a survey of faculty members’ approaches to teaching critical thinking. OSU is engaged in a number of initiatives to improve students’ diversity scores (http://diversity.okstate.edu/). Writing continues to be emphasized by GEAC and a number of initiatives are in development to enhance students’ development of writing skills. All results will be shared with faculty members and relevant councils and committees at OSU and publicly on the OSU general education assessment website (http://uat.okstate.edu/index.php?option=com_content&view=article&id=10&Itemid=14). Additional discussions about how to respond to results and take steps to improve will be held during the sharing of results.

2009-2010 Assessment Report
Oklahoma State University http://uat.okstate.edu
11
III. Program Outcomes Assessment 1. Table III.1 summarizes the assessment methods and number of individuals who participated in each assessment method for undergraduate degree programs at OSU. Detailed reports for each program can be obtained on the program outcomes assessment website (http://uat.okstate.edu/index.php?option=com_content&view=article&id=1&Itemid=6). Note that students may have participated in more than one assessment method and some assessment methods may overlap between two degree programs.

2009-2010 Assessment Report
Oklahoma State University http://uat.okstate.edu
12
Table III.1. Undergraduate Program Outcomes Assessment College of Agricultural Sciences and Natural Resources Degree Program Assessment Methods Number Assessed Department of Agricultural Economics
Agribusiness, B.S. Review of written assignments
Review of oral presentations
Exit interview and Alumni survey
35
71
20
Agricultural Economics, B.S. Review of written assignments
Review of oral presentations
Exit interview and Alumni survey
35
71
20
Department of Agricultural Education, Communication, and Leadership
Agricultural Communications, B.S. Portfolio
Alumni survey
29
35
Agricultural Education, B.S.
Oklahoma Subject Area Test Oklahoma Professional Teaching Examination
Panel review of student portfolios
18
28
37
Agricultural Leadership, B.S. Course exams
Focus groups and Alumni survey
Internship portfolio evaluations
Full class
12
13
Department of Animal Science
Animal Science, B.S. Subject area exam
Panel review of Student projects
Panel review of capstone projects
69
35
170
Food Science, B.S. Subject area exam
Oral presentations
Capstone projects
14
35
12
Department of Biochemistry and Molecular Biology
Biochemistry and Molecular Biology, B.S.
Panel review of student papers
Alumni survey Faculty evaluation of student achievement
43
28
43
Department of Entomology and Plant Pathology
Entomology, B.S. Capstone project
Exit exam and alumni survey
Panel review of student papers
No students graduated
5
No students graduated
Department of Horticulture and Landscape Architecture
Horticulture, B.S. Course exams
Exit interviews
Grade point averages
9
9
9
Landscape Architecture, BLA Portfolio and oral presentation
Internship evaluation
Capstone project
17
17
17
Landscape Contracting, B.S. Capstone project 4

2009-2010 Assessment Report
Oklahoma State University http://uat.okstate.edu
13
Degree Program Assessment Methods Number Assessed
Internship evaluation
Alumni survey
3
10
Department of Plant and Soil Science
Natural Resource Ecology and Management, B.S.
Panel review of student papers
Oral presentations
Course projects
94
37
6

2009-2010 Assessment Report
Oklahoma State University http://uat.okstate.edu
14
Table III.1. Undergraduate Program Outcomes Assessment (continued) College of Arts and Sciences Degree Program Assessment Methods Number Assessed Department of Computer Science
Computer Science, B.S.
Rubric evaluation of computer competency
Employer Evaluation
Rubric evaluation of computer theory
46
11 142
Department of Art
Art History, B.A. Panel review of projects
Panel review of analytic skills
Panel review of written communication
10
10
10
Graphic Design, BFA Capstone project
Portfolio
Portfolio
19
19
19
Studio Art, BFA External review of capstone project
External review of capstone project
External review of capstone project
11
11
11
Department of English
English, B.A. Faculty review of reading competence
Faculty review of writing competence
Senior Survey
44
25
27
Department of Foreign Languages and Literature
French, B.A.
Final projects
Standardized test
Alumni survey
18
18
Not reported
German, B.A. Final projects
Standardized test
Alumni survey
10
10
Not reported
Russian Language and Literature, B.A.
Final projects
Standardized test
Alumni survey
6
6
Not reported
Spanish, B.A. Final projects
Licensure test
Alumni survey
102
102
Not reported
Department of Geography
Geography, B.A., B.S. Transcript analysis
Faculty evaluation of students w/ rubric
Exit survey
7
70
20
Department of History
American Studies, B.S. Panel review of student papers
Panel review of student papers
50
50

2009-2010 Assessment Report
Oklahoma State University http://uat.okstate.edu
15
Panel review of student papers
50
History, B.A. Panel review of student papers
Panel review of student papers
Panel review of student papers
50
50
50
Department of Mathematics
Mathematics, B.A., B.S. Panel review of student papers
Panel review of student papers
Panel review of student papers
14
14
14
Department of Philosophy
Philosophy, B.A. Exit exam
Panel review of student papers
Panel review of student papers
11
8
8
Department of Political Science
Political Science, B.A., B.S. Capstone project
Standardized test
Student research paper
Not reported
Not reported
Not reported
Department of Sociology
Sociology, B.S. Panel review of student papers
Panel review of student papers
Panel review of student papers
30
30
19
Department of Statistics
Statistics, B.S. Student survey
Final exam
2
3
Department of Zoology
Physiology, B.S. Student exam
Panel review of student projects
Panel review of student projects
105
22
25
Zoology, B.S. Student exam
Panel review of student projects
Panel review of student projects
105
22
25
Department of Theatre
Theatre, B.A. External review
External review
External review
All students
All students
All students
Department of Botany
Botany, B.S. Standardized national exams
Analysis of GPA
Alumni survey
1
3
1
Department of Psychology
Psychology, B.A., B.S. Department exam
Panel review of student papers
189
111
2009-2010 Assessment Report
Oklahoma State University http://uat.okstate.edu
16
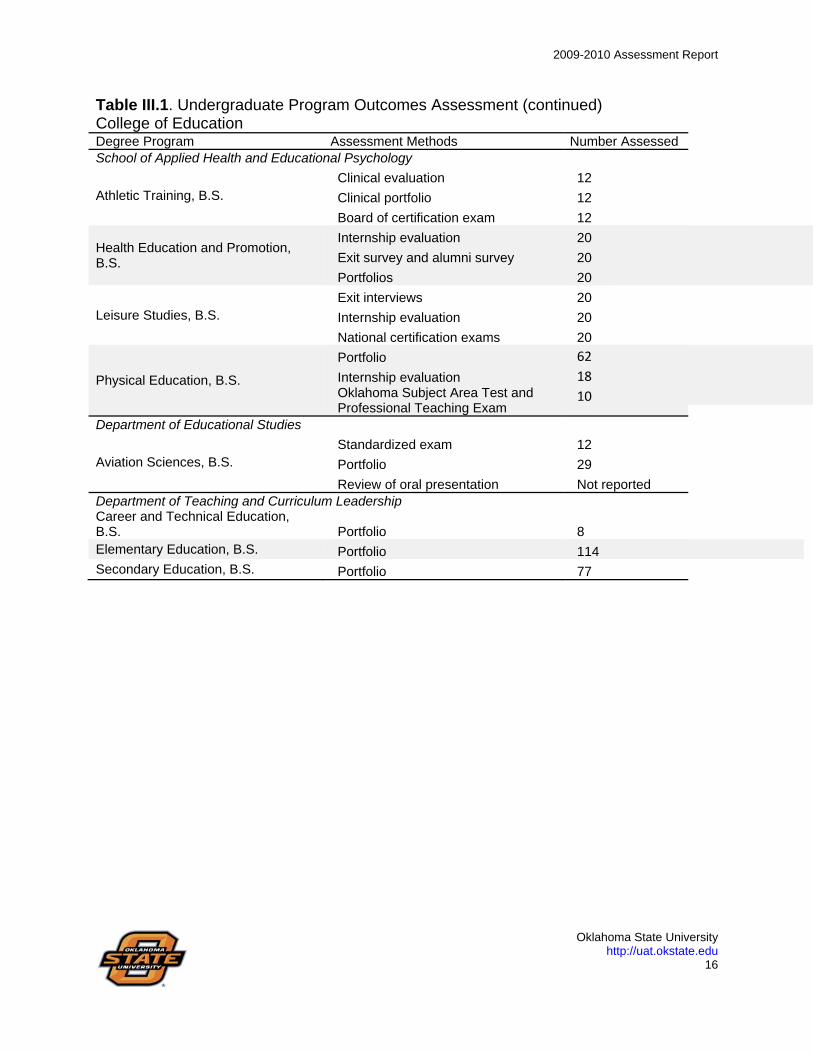
Table III.1. Undergraduate Program Outcomes Assessment (continued) College of Education Degree Program Assessment Methods Number Assessed School of Applied Health and Educational Psychology
Athletic Training, B.S. Clinical evaluation
Clinical portfolio
Board of certification exam
12
12
12
Health Education and Promotion, B.S.
Internship evaluation
Exit survey and alumni survey
Portfolios
20
20
20
Leisure Studies, B.S. Exit interviews
Internship evaluation
National certification exams
20
20
20
Physical Education, B.S.
Portfolio
Internship evaluation Oklahoma Subject Area Test and Professional Teaching Exam
62
18
10
Department of Educational Studies
Aviation Sciences, B.S. Standardized exam
Portfolio
Review of oral presentation
12
29
Not reported Department of Teaching and Curriculum Leadership Career and Technical Education, B.S. Portfolio 8 Elementary Education, B.S. Portfolio 114 Secondary Education, B.S. Portfolio 77

2009-2010 Assessment Report
Oklahoma State University http://uat.okstate.edu
17
Table III.1. Undergraduate Program Outcomes Assessment (continued) College of Engineering, Architecture, and Technology Degree Program Assessment Methods Number Assessed Department of Architecture
Architecture, BAR Exit interview
Oral presentations
Student projects
11
11
11 Department of Biosystems and Ag Engineering
Biosystems Engineering, B.S. Licensure test
Panel review of student projects
Exit interviews
8
5
11 Department of Chemical Engineering
Chemical Engineering, B.S. Licensure test
Student projects
Student papers
Not reported
Not reported
Not reported Department of Electrical and Computer Engineering
Electrical Engineering, B.S. Alumni survey
Course exams
Capstone exam
51
51
51 Department of Engineering Technology
Construction Management Technology, B.S.
Licensure test
Internship evaluation
Practicum evaluation
31
37
37
Electrical Engineering Technology, B.S.
Comprehensive exam
Panel review of capstone projects
Capstone log books
18
18
18
Fire Protection and Safety Technology, B.S.
Capstone project
Capstone project
Capstone project
7
9
7
Mechanical Engineering Technology, B.S.
Student exam
Oral design presentations
Student exam
30
30
30 Department of Industrial Engineering and Management
Industrial Engineering and Management, B.S.
Student exam
Senior design projects
Collection of student projects
23
5
5

2009-2010 Assessment Report
Oklahoma State University http://uat.okstate.edu
18
Table III.1. Undergraduate Program Outcomes Assessment (continued) College of Human Environmental Sciences Degree Program Assessment Methods Number Assessed Department of Design, Housing and Merchandising
Design, Housing and Merchandising, B.S. Exit survey
Internship evaluation
54
54
Department of Hotel and Restaurant Administration
Hotel and Restaurant Administration, B.S.
Faculty review of course assignments Internship evaluation
Faculty review of course assignments
74
74
74
Department of Human Development and Family Sciences
Human Development and Family Sciences, B.S. Exit survey
Internship evaluation
Professional portfolio
157
157
157
Nutritional Sciences Nutritional Sciences, B.S. Exit survey 29

2009-2010 Assessment Report
Oklahoma State University http://uat.okstate.edu
19
Table III.1. Undergraduate Program Outcomes Assessment (continued) William S. Spears School of Business1 Degree Program Assessment Methods Number Assessed Department of Business Administration
Business Administration, B.S., B.A.
2. Undergraduate program outcomes assessment is implemented at the program level. Full details on each program’s analysis of student learning and findings are available online http://uat.okstate.edu/index.php?option=com_content&view=article&id=76&Itemid=52. OSU, through the process for awarding of more than $100,000 in assessment funds (http://uat.okstate.edu/index.php?option=com_content&view=article&id=31&Itemid=28) for program outcomes assessment and through feedback provided to programs by the College Assessment Coordinators and the Director of Assessment and Testing, has been working to move programs toward direct measures of student learning and toward assessment processes with a high likelihood of resulting in program improvement. Program outcomes assessment is also a critical component of each program’s 5-year Academic Program Review. As reported in III-3, program outcomes assessment has resulted in numerous program improvements. Undergraduate and graduate programs reported 362 assessment methods implemented for program outcomes assessment. The most commonly reported assessment methods were: Comprehensive, qualifying, preliminary, standardized, or course exams (84 reports,
23% of the total) Faculty panel or faculty review of student work (70 reports, 20% of the total) Dissertations, theses, or creative components (46 reports, 13% of the total) Surveys of alumni (37 reports, 10% of the total) Oral presentations (33 reports, 9% of the total) Other methods used included portfolios, internship or clinical evaluations, capstone projects, and other performance assessments. 3. Undergraduate and graduate programs reported 335 uses of program outcomes assessment data (each use may represent more than one assessment method and some methods resulted in more than one use). The most common use of program outcomes assessment data was to monitor and ensure student achievement of the learning outcome. Other common uses include: 1 Report from Spears School of Business will be submitted in January

2009-2010 Assessment Report
Oklahoma State University http://uat.okstate.edu
20
Improvements to the assessment process (67 uses, 20% of the total) Curriculum changes (33 uses, 10% of the total) Changes to courses (25 uses, 7% of the total) Discussion and consideration of improvements (12 uses, 4% of the total) Various other uses including changes to advising, faculty development and
instructional improvement, hiring decisions, communication with students, the development of new courses, and student recruitment.
The large number of uses of program outcomes assessment demonstrates that it is an integral and essential element of OSU’s commitment to improving student learning.

2009-2010 Assessment Report
Oklahoma State University http://uat.okstate.edu
21
IV. Student Satisfaction 1. Surveys of alumni are conducted every year – surveys of alumni from undergraduate programs are conducted in even numbered years (last completed in 2010) and surveys of alumni from graduate programs are conducted in odd numbered years (last completed in 2009). Current graduate students’ satisfaction is surveyed in even numbered years (last completed in spring, 2010). Alumni surveys are intended to identify institutional strengths and areas for improvement, to track careers and continuing education of recent graduates, and to provide programs with specific information about their alumni. In addition to a core set of questions developed at the institutional level, each undergraduate and graduate program is asked to submit a list of program-specific questions to be included in the alumni surveys. Participants for the alumni surveys are all students who graduated 1- and 5-years ago. The surveys are conducted online and through use of a phone bank staffed by current undergraduate students. 2010 Survey of Alumni of Undergraduate Programs All alumni who graduated in 2004 and 2008 were contacted for participation in the survey. Contact information was collected from the Alumni Association and the Office of Institutional Research and Information Management. Alumni were contacted through email (when a current email address was available) and over the phone. 7,256 alumni were contacted for participation and 3,149 surveys were completed for a response rate of 43.4%. When adjusted for alumni deemed ‘unreachable,’ (e.g., alumni who did not respond to a survey email and for whom no valid U.S. phone number was available) the response rate for the survey was 73.7%. 2010 Graduate Student Satisfaction Survey All current graduate students were contacted for participation in the survey. Contact information was collected from the Office of Institutional Research and Information Management. Graduate students were contacted through email. 4,260 graduate students were contacted for participation and 2,696 surveys were completed for a response rate of 63%. 2. 2010 Survey of Alumni of Undergraduate Programs The full report is available here: http://uat.okstate.edu/images/alumni/2010%20saup%20final%20report%20institution%20only.pdf 91% of respondents reported they were “satisfied” or “very satisfied” with their overall educational experience at OSU. Only 2.3% of respondents were “dissatisfied” or “very dissatisfied” with their overall educational experience at OSU. 87% were “satisfied” or “very satisfied” with the quality of instruction received in their major and 65% were

2009-2010 Assessment Report
Oklahoma State University http://uat.okstate.edu
22
“satisfied” or “very satisfied” with the quality of the academic advising they received in their major. 64% of the respondents were currently residing in Oklahoma and 11.4% were currently residing in Stillwater. 86% of respondents reported current employment and only 5% of alumni identified themselves as currently seeking employment. Large corporations were the largest employer of graduates. The most frequently reported salary was in the range of $35,000-$45,000 per year for 2004 graduates and $25,000-$35,000 per year for 2008 graduates. 92% of respondents found their OSU education had prepared them “very well” or “adequately” for their current position. Of the alumni who pursued additional education, 42% of them enrolled at OSU. 92% of alumni who pursued additional education found their OSU education had prepared them “very well” or “adequately” for graduate or professional school programs. Each undergraduate program was asked to submit a set of questions in addition to those described above. These program-specific questions covered many topics, depending on the interest area of each program, including advising, student learning outcomes, teaching skills, time-to-degree, satisfaction with specific courses or program components, strengths and weaknesses of the program, suggested curricular changes, and other satisfaction topics. Results of the program-specific questions were summarized and shared with programs. It is not possible to summarize the results of the program-specific questions here because the questions were different for each program. 2010 Graduate Student Satisfaction Survey The full results are available here: http://uat.okstate.edu/images/gss/gsss%202010%20final%20report.pdf 91% of respondents were “very satisfied” or “generally satisfied” with computing and library resources available to them, 88% “agreed” or “agreed somewhat” that their advisor was willing to spend the time with them that they need, and over 89% were “very satisfied” or “generally satisfied” with their overall experience as a graduate student. Opportunities for financial support such as assistantships and scholarships were readily available in their departments according to 22% of Master’s degree students and 36% of doctoral degree students. 75% of Master’s degree students and 80% of doctoral degree students “agreed” or “agreed somewhat” that OSU is a supportive campus toward those with diverse backgrounds. 8% of Master’s degree students and 15% of doctoral degree students reported they experienced discrimination toward them.

2009-2010 Assessment Report
Oklahoma State University http://uat.okstate.edu
23
Nearly 60% of Master’s degree students and nearly 50% of doctoral degree students reported taking one or more hours of credit in a distance learning format. 3. The results from these two 2010 surveys were distributed widely on campus and shared publicly online (http://uat.okstate.edu/index.php?option=com_content&view=article&id=8&Itemid=13). Overall, the results continue to be very positive and show undergraduate alumni are generally very satisfied with their educational experience at OSU and current graduate students are very satisfied with their educational experience at OSU. Although there continue to be conversations about the data from the 2010 surveys at the institution level, programs are the primary users of the Alumni Survey data and the Graduate College is the primary user of the Graduate Student Satisfaction Survey. One way all programs use the alumni survey data is in the development of their 5-year Academic Program Review (APR) report. The APR reports require programs consider and reflect upon results from alumni surveys when developing recommendations for improvement and future plans. Although programs are encouraged to use direct measures of student achievement as the primary source of information in program outcomes assessment, graduate and undergraduate programs may also use the alumni survey data as an element of their program outcomes assessment process. Uses of the alumni survey data for program outcomes assessment purposes are described in the undergraduate and graduate program outcomes assessment sections respectively. Continuation of the Provost’s Faculty Development Initiative: Focus on General Education and the implementation of a critical thinking study group are two approaches OSU is taking to respond to assessment data (these two activities were described in the General Education Assessment section). Results from these surveys are also shared with the Assessment and Academic Improvement Council, the General Education Advisory Council, and the Committee for the Assessment of General Education.

2009-2010 Assessment Report
Oklahoma State University http://uat.okstate.edu
24
V. Graduate Student Assessment 1. The primary method for assessing graduate students’ achievement of learning outcomes is program outcomes assessment. Table V.1 reports the measures used and the number of students assessed with each measure for the graduate programs. Table V.1. Graduate Program Outcomes Assessment College of Agricultural Sciences and Natural Resources Degree Program Assessment Methods Number
Assessed Department of Agricultural Economics
Ag Education / Ag Business, MAG Master's thesis / creative component
Oral defense
Oral presentations
53
53
26
Agricultural Economics, M.S.
Master's thesis / creative component
Oral defense
Oral presentations
53
53
26
Agricultural Economics, Ph.D. Dissertation
Oral presentation
4
7
Department of Agricultural Education, Communication, and Leadership
Ag Education / Ag Leadership, MAG Creative component
Oral presentation
Alumni survey
1
1
18
Agricultural Communications, M.S. Thesis defense
Thesis writing evaluation
Seminar presentation
1
1
1
Agricultural Education, M.S.
Thesis defense
Thesis writing evaluation
Seminar presentation
1
1
1
Agricultural Education, Ph.D. Comprehensive examination
Dissertation
Seminar presentation
1
1
1
Department of Biochemistry and Molecular Biology
Biochemistry and Molecular Biology, M.S.
Preliminary examination
Oral presentation
Not reported
Not reported
Biochemistry and Molecular Biology, Ph.D.
Preliminary examination
Oral presentation
Not reported
Not reported
Department of Entomology and Plant Pathology
Entomology and Plant Pathology, MAG
Seminar presentations
Thesis defense
Exit survey and interviews
2
6
6
Entomology, Ph.D. Seminar presentations
Preliminary examination
2
2

2009-2010 Assessment Report
Oklahoma State University http://uat.okstate.edu
25
Degree Program Assessment Methods Number Assessed
Exit survey and interviews 1
Entomology and Plant Pathology, M.S. Seminar presentations
Thesis defense
Exit survey and interviews
2
6
6
Plant Pathology, Ph.D.
Seminar presentations
Preliminary examination
Dissertation defense
1
1
1
Department of Horticulture and Landscape Architecture
Horticulture, M.S. Preliminary examination
Oral presentation
3
3
Horticulture, MAG Research proposal presentation
Thesis
Alumni survey
3
3
3
Multidisciplinary
Plant Science, Ph.D. Dissertation proposal defense
Qualifying exam
Alumni survey
8
8
4
International Agriculture, MAG Faculty review of performance
Faculty review of placement
21
19
Food Science, M.S. Master's thesis
Oral presentation
Alumni survey
Not reported
Not reported
Not reported
Food Science, Ph.D. Dissertation
Alumni survey
Preliminary examination
Not reported
Not reported
Not reported
Department of Natural Resources, Ecology, and Management
Natural Resources, Ecology, and Management, M.S.
Thesis defense
Alumni survey
10
Not reported
Department of Animal Science
Animal Science, MAG Master's thesis
Oral presentation
Alumni survey
1
1
1
Animal Science, M.S. Master's thesis
Oral presentation
Alumni survey
Not reported
Not reported
Not reported
Animal Breeding and Reproduction, Ph.D.
Dissertation
Alumni survey
Preliminary examination
Not reported
Not reported
Not reported
Animal Nutrition, Ph.D. Dissertation
Alumni survey
Not reported
Not reported

2009-2010 Assessment Report
Oklahoma State University http://uat.okstate.edu
26
Degree Program Assessment Methods Number Assessed
Preliminary examination Not reported

2009-2010 Assessment Report
Oklahoma State University http://uat.okstate.edu
27
Table V.1. Graduate Program Outcomes Assessment (continued) College of Arts and Sciences Degree Program Assessment Methods Number Assessed Department of English
English, M.A. Faculty evaluation of students
Faculty evaluation of students
Exit survey
16
17
4 Department of Geography
Geography, M.S., Ph.D. Rubric evaluation of student papers
Course projects
Course projects
15
21
18 Department of History
History, M.A. Panel review of student papers
Panel review of student papers
Comprehensive exams
12
12
12
History, Ph.D. Panel review of student papers
Panel review of student papers
Comprehensive exams
5
5
5 Department of Mathematics
Mathematics, M.S. Master's thesis
Master's thesis
Oral presentation
1
1
1
Mathematics, Ph.D. Comprehensive exams
Dissertation
Oral presentation
5
5
5 Department of Microbiology and Molecular Genetics
Microbiology, M.S. Student Journal Publications
Student Conference presentations
2
2
Microbiology, Ph.D. Student Journal Publications
Student Conference presentations
21
21 Department of Music
Pedagogy and Performance, M.M. Placement exam
Qualifying exam
Final oral exam and recital
5
7
7 Department of Political Science
Political Science, M.A. Comprehensive exams
Thesis review
8
5 Department of Psychology
Psychology, M.S.
Thesis
Comprehensive examination
Faculty evaluation of students
49
49
49
Psychology, Ph.D. Dissertation
Comprehensive examination 49
49

2009-2010 Assessment Report
Oklahoma State University http://uat.okstate.edu
28
Faculty evaluation of students
49 Department of Sociology
Sociology, M.S. Panel review of student papers
Panel review of student papers
Thesis
13
13
7
Sociology, Ph.D. Comprehensive examination
Comprehensive examination
Methods examination
9
9
7 Department of Theatre Theatre, M.S. Thesis
1
Department of Statistics
Statistics, M.S. Comprehensive exam
Oral presentations
Student projects
2
2
5 Department of Zoology
Zoology, M.S. Thesis
Thesis
Submission of articles
4
4
3
Zoology, Ph.D. Comprehensive exam
Panel review of student papers
Submission of articles
4
4
4 Department of Botany
Botany, M.S.
Advisor review of student aptitude
Course Grades
Assessment of scholarly activities
Not reported
Not reported
Not reported Department of Computer Science
Computer Science, M.S. Ability to conduct literature reviews
Faculty assessment of research
Faculty assessment of research
11
11
10
Computer Science, Ph.D. Ability to conduct literature reviews
Faculty assessment of research
Faculty assessment of research
1
1
1

2009-2010 Assessment Report
Oklahoma State University http://uat.okstate.edu
29
Table V.1. Graduate Program Outcomes Assessment (continued) College of Education Degree Program Assessment Methods Number Assessed School of Applied Health and Educational Psychology
Counseling, M.S. Faculty evaluation of students
Certification exam
Alumni survey
87
3
10
Educational Psychology, Ed.S. Standardized exam
Portfolio
Creative components
4
11
4
Educational Psychology, M.S. Alumni survey
Portfolio
6
6
Educational Psychology, Ph.D. Qualifying portfolio
Alumni survey
5
5
Health and Human Performance, M.S. Thesis
Creative component
Alumni survey
8
1
7
Health, Leisure, and Human Performance, Ph.D.
Dissertation
5
Leisure Studies, M.S. Academic standing
Comprehensive exam
Alumni survey
6
3
Not reported
Department of Educational Studies
Educational Leadership Studies, M.S. Faculty review of student papers
Comprehensive exam
Standardized exam
16
9
6
Educational Technology, M.S. Comprehensive exam
Portfolio
Oral presentation
33
33
33
Higher Education, Ed.D. Comprehensive exam
Qualifying exam
Dissertation defense
6
1
6
School Administration, Ed.D. Comprehensive exam
Qualifying exam
Dissertation defense
6
9
5
Multidisciplinary
Applied Educational Studies, Ed.D. Dissertation defense
Student reports
4
Not reported
Natural and Applied Science, M.S. Oral presentations
Creative component
13
10
Department of Teaching and Curriculum Leadership Education, Ph.D. Qualifying exam 24
Teaching, Learning, & Leadership, M.S. Comprehensive exam 34

2009-2010 Assessment Report
Oklahoma State University http://uat.okstate.edu
30
Table V.1. Graduate Program Outcomes Assessment College of Engineering, Architecture, and Technology Degree Program Assessment Methods Number Assessed Department of Chemical Engineering
Chemical Engineering, M.S. Thesis defense
Faculty review of student achievement
Qualifying exams
Not reported
Not reported
Not reported
Chemical Engineering, Ph.D. Dissertation defense
Faculty review of student achievement
Qualifying exams
Not reported
Not reported
Not reported Department of Electrical and Computer Engineering
Electrical Engineering, M.S. Thesis defense
Oral presentations
Alumni survey and exit survey
Not reported
Not reported
Not reported
Electrical Engineering, Ph.D. Preliminary exams
Dissertation proposal and defense
Alumni survey and exit survey
Not reported
Not reported
Not reported Department of Industrial Engineering and Management
Industrial Engineering and Management, M.S.
Thesis
Seminar presentation
Not reported
Not reported
Industrial Engineering and Management, Ph.D.
Dissertation
Seminar presentation
Not reported
Not reported

2009-2010 Assessment Report
Oklahoma State University http://uat.okstate.edu
31
Table V.1. Graduate Program Outcomes Assessment (continued) College of Human Environmental Sciences Degree Program Assessment Methods Number Assessed Department of Hotel and Restaurant Administration
Hotel and Restaurant Administration, M.S. Creative components
Master’s thesis
5
5
Department of Design, Housing, and Merchandising
Design, Housing, and Merchandising Panel review of papers
Panel review of presentations
10
10
Department of Human Development and Family Sciences
Human Development and Family Sciences, M.S.Research proposal / thesis
Panel review of work
Review of course projects
15
15
15
Department of Nutritional Sciences
Nutritional Sciences, M.S. Panel review of papers
Panel review of presentations
6
6

2009-2010 Assessment Report
Oklahoma State University http://uat.okstate.edu
32
Table V.1. Graduate Program Outcomes Assessment (continued) William S. Spears School of Business2 Degree Program Assessment Methods Number Assessed Department of Accounting
Accounting, M.S.
Business Administration, Ph.D.
Department of Business Administration
M.B.A.
Business Administration, Ph.D.
Department of Economics and Legal Studies
Economics, M.S.
Economics, Ph.D.
Department of Finance
Business Administration, Ph.D.
Quantitative Financial Economics, M.S. Student projects
Oral contest presentation
10
1 Department of Management Sciences and Information Systems Business Administration, Ph.D. Management Information Systems, M.S. Department of Marketing
Business Administration, Ph.D.
Multidisciplinary Telecommunications Management, M.S.
2 Report from Spears School of Business will be submitted in January

2009-2010 Assessment Report
Oklahoma State University http://uat.okstate.edu
33
2. Graduate program outcomes assessment is implemented at the program level. Full details on each program’s analysis of student learning and findings are available online (http://uat.okstate.edu/index.php?option=com_content&view=article&id=76&Itemid=52). OSU, through the process for awarding of more than $100,000 in assessment funds (http://uat.okstate.edu/index.php?option=com_content&view=article&id=31&Itemid=28) for program outcomes assessment and through feedback provided to programs, has been working to move graduate programs toward direct measures of student learning and toward assessment processes with a high likelihood of resulting in program improvement. Program outcomes assessment is also a critical component of each program’s 5-year Academic Program Review. As reported in section III-3, program outcomes assessment has resulted in numerous program improvements. 3. See section III-3 for a full description of the use of results from undergraduate and graduate program outcomes assessment. There are no major changes planned to the graduate assessment program at this time. 4. In 2009-2010, 396 students were provisionally admitted to OSU graduate programs and enrolled at OSU. 301 (79%) of the 383 students who were provisionally admitted and enrolled in 2008-2009 were enrolled in the fall of 2009. Provisional admission may be granted to students in situations where students: Fail to meet the minimum score on an admissions test Fail to achieve a minimum grade point average in prior coursework Have not completed required prerequisite coursework Cannot be admitted under the normal admissions standards Students who are graduates of accredited postsecondary institutions may be admitted provisionally on recommendation of the major department and by concurrence from the Dean of the Graduate College. Failure to meet required academic standards and benchmarks set for progress and grade point average will result in dismissal from the Graduate College.

2009-2010 Assessment Report
Oklahoma State University http://uat.okstate.edu
34
Summary OSU is highly committed to improving student learning through entry-level assessment, general education assessment, program outcomes assessment, and student satisfaction assessment. Assessment activity in 2009-2010 resulted in numerous improvements to courses, programs, departments, and colleges and supported OSU’s vision for advancing the quality of life in Oklahoma by fulfilling the instructional, research, and outreach obligations of a first-class, land-grant educational system.