oklahoma police pension & retirement system 20 asap opprs.pdf · custom blended index history:...
TRANSCRIPT

Preliminary
Asset Class
Market
Value
($000s)
Actual
Allocation
(%)
Target
Allocation
(%)
Over/
Under
(%)
Total Portfolio 2,514,438 100.00 100.00
Equity 1,437,751 57.18 60.00 -2.82 50.00 70.00
US Large Cap Equity 464,887 18.49 15.00 3.49 10.00 20.00
US Small/Mid Cap Equity 144,019 5.73 5.00 0.73 0.00 15.00
Long/Short Equity 226,789 9.02 10.00 -0.98 5.00 15.00
Int'l Developed Markets Equity 256,327 10.19 10.00 0.19 5.00 15.00
Emerging Markets Equity 116,236 4.62 5.00 -0.38 0.00 10.00
Private Equity 229,494 9.13 15.00 -5.87 5.00 20.00
Fixed Income 674,952 26.84 25.00 1.84 15.00 35.00
Core Bonds 253,852 10.10 10.00 0.10 5.00 15.00
Multi-Sector Fixed Income 258,279 10.27 7.50 2.77 2.50 12.50
Absolute Return 162,820 6.48 7.50 -1.02 2.50 12.50
Real Assets 326,441 12.98 15.00 -2.02 10.00 20.00
Core Real Estate 241,206 9.59 10.00 -0.41 5.00 15.00
Opportunistic Real Estate 61,627 2.45 5.00 -2.55 0.00 10.00
Other 23,607 0.94 0.00 0.94 -- --
Cash and Equivalents 75,294 2.99 0.00 2.99
Oklahoma Police Pension & Retirement System
For the Periods Ending April 30, 2020
Range
Min - Max
(%)
18.4
9
5.7
3
9.0
2 10.1
9
4.6
2
9.1
3
10.1
0
10.2
7
6.4
8
9.5
9
2.4
5
0.9
4 2.9
9
15.0
0
5.0
0
10.0
0
10.0
0
5.0
0
15.0
0
10.0
0
7.5
0
7.5
0
10.0
0
5.0
0
0.0
0
0.0
0
0.00
10.00
20.00
US Large CapEquity
US Small/MidCap Equity
Long/ShortEquity
Int'l DevelopedMarkets Equity
EmergingMarkets Equity
Private Equity Core Bonds Multi-SectorFixed Income
Absolute Return Core RealEstate
OpportunisticReal Estate
Other Cash andEquivalents
Actual vs. Target Allocation
Actual Allocation Target Allocation
© 2020 Asset Consulting Group All Rights Reserved1

Preliminary
Market
Value
($000s)
Actual
Allocation
(%)
1
Month
(%)
YTD
(%)
FYTD
(%)
1
Year
(%)
3
Years
(%)
5
Years
(%)
10
Years
(%)
Since
Inception
(%)
Total Portfolio (08/85) 2,514,438 100.00 5.07 -6.56 -1.42 -0.85 4.58 4.61 6.71 7.99Total Portfolio Net of Fees (06/05) * 5.03 -6.69 -1.74 -1.22 4.15 4.18 6.30 --
Total Fund Policy 16.96 -6.61 -0.68 0.39 5.09 4.59 7.04 --
Equity (01/98) 1,437,751 57.18 7.91 -10.21 -2.97 -2.79 5.20 5.56 8.11 6.26
MSCI ACWI 10.76 -12.78 -4.78 -4.43 5.03 4.94 7.52 5.92
Fixed Income (01/98) 674,952 26.84 2.25 -1.05 0.99 2.79 3.47 2.55 4.02 5.48
BloomBar Universal 2.00 3.33 6.00 9.15 4.78 3.79 4.14 5.20
Real Assets (01/98) 326,441 12.98 0.41 1.18 3.22 3.29 5.30 5.03 5.88 5.60
Real Assets Blended Index -0.51 -8.09 -5.85 -5.59 1.04 0.63 5.30 5.39
OK Invest (12/09) 19,331 0.77 0.20 0.81 2.01 2.46 2.18 2.09 2.38 2.43
Cash and Miscellaneous (01/98) 2 55,963 2.23 0.07 0.35 1.22 1.68 1.66 2.24 1.66 2.981
2
Oklahoma Police Pension & Retirement System
For the Periods Ending April 30, 2020
Total Fund Policy: Effective September 2019, the index consists of 60.0% MSCI ACWI, 25.0% BloomBar Universal, 15.0% NFI ODCE Net.
Cash includes holdings in miscellaneous equity securities.
The Fiscal Year End is June.
© 2020 Asset Consulting Group All Rights Reserved2

Preliminary
Market
Value
($000s)
Actual
Allocation
(%)
1
Month
(%)
YTD
(%)
FYTD
(%)
1
Year
(%)
3
Years
(%)
5
Years
(%)
10
Years
(%)
Since
Inception
(%)
Equity (01/98) 1,437,751 57.18 7.91 -10.21 -2.97 -2.79 5.20 5.56 8.11 6.26
MSCI ACWI 10.76 -12.78 -4.78 -4.43 5.03 4.94 7.52 5.92
US Large Cap Equity 464,887 18.49 -- -- -- -- -- -- -- --
Northern Trust Russell 1000 Index Fund (08/98) 1 464,887 18.49 13.21 -9.68 -0.12 0.08 8.68 8.74 11.57 6.77
Russell 1000 13.21 -9.68 -0.11 0.09 8.68 8.74 11.57 6.70
US Small/Mid Cap Equity 144,019 5.73 -- -- -- -- -- -- -- --
Boston Partners (01/98) 69,111 2.75 14.97 -29.70 -22.34 -22.95 -5.50 0.01 6.52 7.62
Russell 2500 Value 13.22 -26.00 -20.67 -21.90 -4.49 0.61 6.37 7.17
Silvercrest (02/14) 74,908 2.98 19.44 -13.08 -7.81 -8.79 6.61 8.68 -- 5.70
Russell 2000 Growth 14.89 -14.71 -8.95 -9.22 4.21 5.19 9.96 5.92
Long/Short Equity (05/12) 226,789 9.02 5.97 -3.04 2.23 1.90 4.98 3.86 -- 6.04
Grosvenor (11/03) 117,667 4.68 3.84 -4.99 0.17 -0.15 4.27 3.43 5.45 4.89
K2 Mauna Kea LLC (04/20) 109,121 4.34 8.58 -- -- -- -- -- -- 8.58
MSCI ACWI 10.76 -12.78 -4.78 -4.43 5.03 4.94 7.52 7.29
HFRI FOF: Strategic 5.05 -7.21 -4.68 -4.36 0.61 0.43 2.09 3.09
Int'l Developed Markets Equity 256,327 10.19 -- -- -- -- -- -- -- --
Barings Focused EAFE Plus Equity (03/12) 139,582 5.55 7.70 -13.15 -6.43 -6.66 2.23 3.18 -- 4.09
MSCI ACWI ex US 7.64 -17.40 -11.50 -11.07 0.24 0.31 3.37 3.13
MSCI EAFE NetDiv 6.46 -17.84 -12.08 -11.34 -0.58 -0.17 3.55 3.57
Mondrian Int'l Value (05/04) 116,745 4.64 4.05 -23.38 -17.09 -18.51 -3.14 -1.64 3.25 4.76
MSCI EAFE Value 5.44 -24.17 -19.55 -19.96 -5.09 -3.09 1.93 3.56
Emerging Markets Equity 116,236 4.62 -- -- -- -- -- -- -- --
AB EM Strategic Core Equity Fund (11/16) 80,620 3.21 7.25 -15.16 -10.08 -9.84 -1.44 -- -- 0.99
MSCI Emerging Markets 9.18 -16.55 -10.44 -11.65 0.94 0.28 1.80 3.33
Wasatch EM Small Cap (09/12) 35,616 1.42 12.22 -12.60 -0.38 1.25 4.73 2.03 -- 3.75
MSCI EM SC 13.97 -21.75 -18.02 -18.93 -5.65 -4.03 0.01 0.70
Private Equity (07/03) 229,494 9.13 -2.51 -0.31 5.07 8.63 11.07 10.28 11.45 11.661
Oklahoma Police Pension & Retirement System
For the Periods Ending April 30, 2020
Performance data prior to October 31, 2014 is reflective of the Mellon Capital Passive Index fund. Due to contributions and withdrawals in this account, the returns may differ from the performance of the fund.
© 2020 Asset Consulting Group All Rights Reserved3

Preliminary
Market
Value
($000s)
Actual
Allocation
(%)
1
Month
(%)
YTD
(%)
FYTD
(%)
1
Year
(%)
3
Years
(%)
5
Years
(%)
10
Years
(%)
Since
Inception
(%)
Fixed Income (01/98) 674,952 26.84 2.25 -1.05 0.99 2.79 3.47 2.55 4.02 5.48
BloomBar Universal 2.00 3.33 6.00 9.15 4.78 3.79 4.14 5.20
Core Bonds 253,852 10.10 -- -- -- -- -- -- -- --
Agincourt (10/99) 253,852 10.10 2.71 5.23 7.96 11.37 5.72 4.28 4.51 5.55
BloomBar US Aggregate 1.78 4.98 7.56 10.84 5.17 3.80 3.96 5.13
Multi-Sector Fixed Income 258,279 10.27 -- -- -- -- -- -- -- --
Oaktree Global Credit Fund (02/98) 1 114,572 4.56 3.26 -12.44 -10.83 -9.32 -0.58 1.36 4.58 6.09
Custom Blended Index 24.42 -9.83 -6.92 -6.20 -1.03 0.08 2.08 4.18
Loomis Sayles (06/08) 82,021 3.26 2.60 -0.20 0.92 4.76 3.79 3.09 3.17 3.46
FTSE World Govt Bond 1.19 3.22 3.73 7.97 4.24 2.98 2.35 2.54
Private Credit (10/16) 61,686 2.45 0.42 2.59 6.58 7.80 9.02 -- -- 7.89
Absolute Return 162,820 6.48 -- -- -- -- -- -- -- --
PAAMCO (10/02) 84,520 3.36 1.46 -6.79 -5.10 -6.19 -0.26 -0.38 2.63 4.23
HFRI FOF: Conservative -0.66 -7.68 -6.23 -5.76 -0.12 0.28 1.69 2.54
Wellington Global Total Return (12/16) 78,300 3.11 1.30 1.82 2.76 3.62 5.12 -- -- 4.24
US T-Bills 90 Day + 4% 0.34 1.90 4.99 6.15 5.87 5.23 4.66 5.71
BloomBar US Aggregate 1.78 4.98 7.56 10.84 5.17 3.80 3.96 5.06
Real Assets (01/98) 326,441 12.98 0.41 1.18 3.22 3.29 5.30 5.03 5.88 5.60
Real Assets Blended Index -0.51 -8.09 -5.85 -5.59 1.04 0.63 5.30 5.39
Bloomberg Commodity -1.54 -24.48 -22.58 -23.18 -8.62 -9.07 -7.07 -0.78
NFI ODCE Net 0.00 0.75 3.13 3.93 5.85 7.48 10.42 7.66
Core Real Estate 241,206 9.59 -- -- -- -- -- -- -- --
JP Morgan (12/07) 154,327 6.14 0.29 1.87 4.65 5.41 6.42 7.90 11.27 5.80
NFI ODCE Net 0.00 0.75 3.13 3.93 5.85 7.48 10.42 4.44
Blackstone Property Partners (01/15) 86,879 3.46 0.00 3.06 5.89 8.01 9.54 11.95 -- 11.87
NFI ODCE Net 0.00 0.75 3.13 3.93 5.85 7.48 10.42 7.62
Opportunistic Real Estate 61,627 2.45 -- -- -- -- -- -- -- --
Private Real Estate (08/11) 56,738 2.26 -0.33 2.67 8.09 10.60 11.01 11.02 -- 9.23
Columbus Square (01/98) 4,889 0.19 0.29 0.81 2.38 3.07 6.43 7.40 10.77 12.77
Other (10/19) 23,607 0.94 -- -- -- -- -- -- -- --
Mount Lucas Composite (01/98) 23,607 0.94 4.58 -11.01 -11.04 -16.02 -6.35 -4.66 -1.60 4.29
Cash and Miscellaneous Securities 75,294 2.99 -- -- -- -- -- -- -- --
OK Invest (12/09) 19,331 0.77 0.20 0.81 2.01 2.46 2.18 2.09 2.38 2.43
Cash and Miscellaneous (01/98) 4 55,963 2.23 0.07 0.35 1.22 1.68 1.66 2.24 1.66 2.981
2
3
4
Custom Blended Index: Effective November 2018, the index consists of 50.0% ICE BofA ML Global HY Const, 50.0% CSFB Leveraged Loan.
Custom Blended Index History: Prior to November 2018, the index consisted of the BloomBar US Aggregate Bond Index.
Performance results prior to June 2004 include previous strategy performance.
Cash includes holdings in miscellaneous equity securities.
Oklahoma Police Pension & Retirement System
For the Periods Ending April 30, 2020
On November 1, 2018 Oaktree's Portfolio transitioned to the Oaktree Global Credit Fund.
© 2020 Asset Consulting Group All Rights Reserved4

Oklahoma Police Pension & Retirement System
Private Equity - Active Funds
For the Period Ending April 30, 2020
Summary of Cash Flows for 6 Months
Cash Outflows Cash Inflows Net Cash Flows
-24,375,253 24,192,854 -182,399
Date
Feb-98
Apr-99 Feb-03 Dec-06
Dec-06
May-07
Apr-08
Sep-08
Oct-11
Apr-12
Feb-14
Apr-15
Dec-15
Jan-16
May-17
Jul-18
Aug-18
Mar-19
Apr-20
May-20
May-20
May-20
Summary of Portfolio Inception to Date (Category totals include active and closed funds)
Inception
Committed
Drawn
to Date
Remaining
Commitment
Distributions
to Date
Adjusted
Ending Value Total Value
Total Value to
Paid-in
Total 800,700,000 606,315,513 220,597,091 673,973,661 229,494,275 1.49x903,467,936
Buyout 278,200,000 207,379,094 85,155,980 262,651,823 63,711,052 1.57x326,362,875
Levine Leichtman 10,000,000 10,612,096 - 18,254,382 63,871 1.73x18,318,253
Thompson Street C.P. II 10,000,000 10,020,777 655,026 19,113,247 2,111,820 2.12x21,225,067
Arsenal Capital Partners II 15,000,000 15,032,366 668,860 36,302,596 - 2.41x36,302,596
Sun Capital Partners V 12,500,000 12,500,000 877,182 11,605,950 3,164,453 1.18x14,770,403
Calera Capital Fund IV 10,000,000 8,835,037 2,727,541 13,709,533 - 1.55x13,709,533
Levine Leichtman IV 10,000,000 9,284,222 1,065,574 15,390,212 889,448 1.75x16,279,660
Thompson Street Capital III 7,500,000 7,662,950 450,168 7,632,084 4,639,728 1.60x12,271,812
Arsenal Capital Partners III 7,500,000 7,649,536 1,268,332 14,464,035 1,949,277 2.15x16,413,312
Apollo Investment Fund VIII 7,500,000 7,702,891 977,563 4,029,903 5,173,173 1.19x9,203,076
Francisco Partners Fund IV 8,000,000 7,796,000 204,000 6,684,419 10,157,130 2.16x16,841,549
CenterOak Equity Fund I 7,500,000 6,430,424 1,657,398 2,082,465 6,637,804 1.36x8,720,269
Thompson Street Capital Partners IV 7,500,000 7,246,307 934,064 1,562,736 8,526,917 1.39x10,089,653
Leonard Green Equity Investors VII 7,500,000 6,382,304 1,184,813 67,117 7,136,199 1.13x7,203,316
Francisco Partners Fund V 10,000,000 5,200,000 4,800,000 - 5,921,521 1.14x5,921,521
Thompson Street Capital V 12,700,000 4,783,460 7,916,540 - 4,431,412 0.93x4,431,412
Apollo Investment Fund IX 13,000,000 2,436,565 10,568,692 24,240 2,108,526 0.88x2,132,766
Leonard Green Jade 10,000,000 799,773 9,200,227 - 799,773 1.00x799,773
Francisco Partners VI 20,000,000 - 20,000,000 - - --
Francisco Partners Agility II 5,000,000 - 5,000,000 - - --
Leonard Green VIII 15,000,000 - 15,000,000 - - --
© 2020 Asset Consulting Group All Rights Reserved 5
Oklahoma Police Pension & Retirement System
Private Equity - Active Funds
For the Period Ending April 30, 2020
Summary of Portfolio Inception to Date (Category totals include active and closed funds)
Inception
Date Committed
Drawn
to Date
Remaining
Commitment
Distributions
to Date
Adjusted
Ending Value Total Value
Total Value to
Paid-in
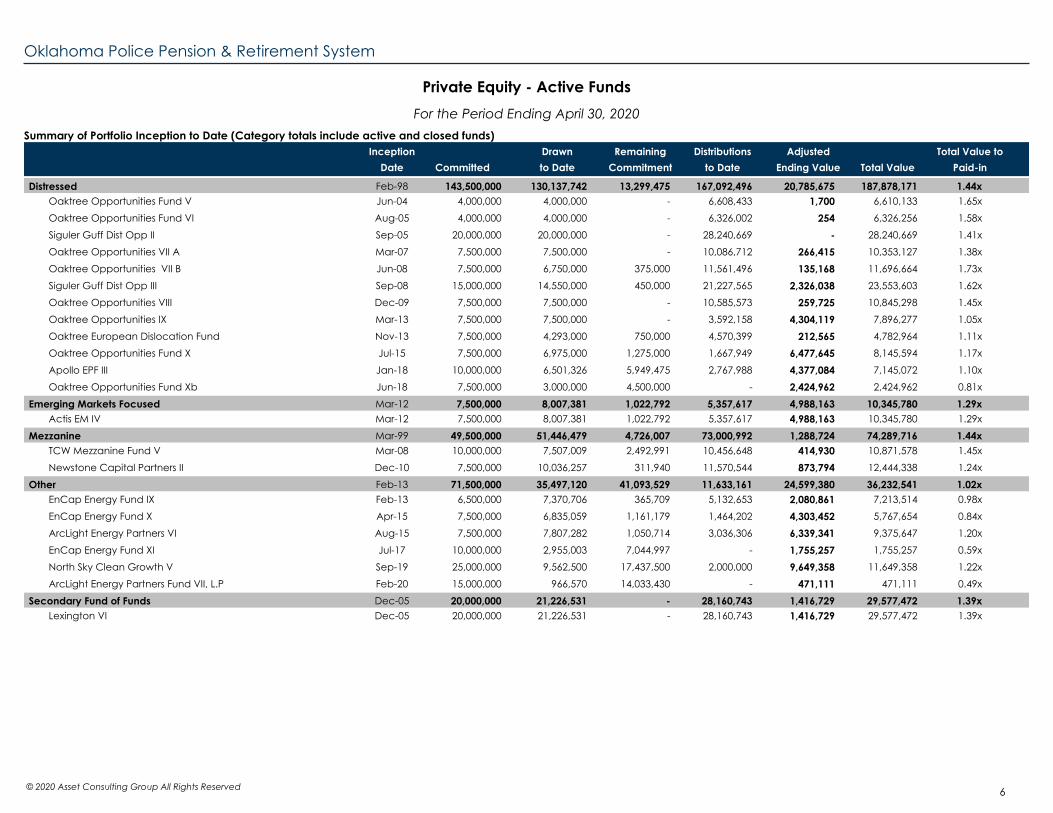
Distressed 143,500,000 130,137,742 13,299,475 167,092,496 20,785,675 1.44x187,878,171Feb-98
Oaktree Opportunities Fund V Jun-04 4,000,000 4,000,000 - 6,608,433 1,700 1.65x6,610,133
Oaktree Opportunities Fund VI Aug-05 4,000,000 4,000,000 - 6,326,002 254 1.58x6,326,256
Siguler Guff Dist Opp II Sep-05 20,000,000 20,000,000 - 28,240,669 - 1.41x28,240,669
Oaktree Opportunities VII A Mar-07 7,500,000 7,500,000 - 10,086,712 266,415 1.38x10,353,127
Oaktree Opportunities VII B Jun-08 7,500,000 6,750,000 375,000 11,561,496 135,168 1.73x11,696,664
Siguler Guff Dist Opp III Sep-08 15,000,000 14,550,000 450,000 21,227,565 2,326,038 1.62x23,553,603
Oaktree Opportunities VIII Dec-09 7,500,000 7,500,000 - 10,585,573 259,725 1.45x10,845,298
Oaktree Opportunities IX Mar-13 7,500,000 7,500,000 - 3,592,158 4,304,119 1.05x7,896,277
Oaktree European Dislocation Fund Nov-13 7,500,000 4,293,000 750,000 4,570,399 212,565 1.11x4,782,964
Oaktree Opportunities Fund X Jul-15 7,500,000 6,975,000 1,275,000 1,667,949 6,477,645 1.17x8,145,594
Apollo EPF III Jan-18 10,000,000 6,501,326 5,949,475 2,767,988 4,377,084 1.10x7,145,072
Oaktree Opportunities Fund Xb Jun-18 7,500,000 3,000,000 4,500,000 - 2,424,962 0.81x2,424,962
Emerging Markets Focused 7,500,000 8,007,381 1,022,792 5,357,617 4,988,163 1.29x10,345,780Mar-12
Actis EM IV Mar-12 7,500,000 8,007,381 1,022,792 5,357,617 4,988,163 1.29x10,345,780
Mezzanine 49,500,000 51,446,479 4,726,007 73,000,992 1,288,724 1.44x74,289,716Mar-99
TCW Mezzanine Fund V Mar-08 10,000,000 7,507,009 2,492,991 10,456,648 414,930 1.45x10,871,578
Newstone Capital Partners II Dec-10 7,500,000 10,036,257 311,940 11,570,544 873,794 1.24x12,444,338
Other 71,500,000 35,497,120 41,093,529 11,633,161 24,599,380 1.02x36,232,541Feb-13
EnCap Energy Fund IX Feb-13 6,500,000 7,370,706 365,709 5,132,653 2,080,861 0.98x7,213,514
EnCap Energy Fund X Apr-15 7,500,000 6,835,059 1,161,179 1,464,202 4,303,452 0.84x5,767,654
ArcLight Energy Partners VI Aug-15 7,500,000 7,807,282 1,050,714 3,036,306 6,339,341 1.20x9,375,647
EnCap Energy Fund XI Jul-17 10,000,000 2,955,003 7,044,997 - 1,755,257 0.59x1,755,257
North Sky Clean Growth V Sep-19 25,000,000 9,562,500 17,437,500 2,000,000 9,649,358 1.22x11,649,358
ArcLight Energy Partners Fund VII, L.P Feb-20 15,000,000 966,570 14,033,430 - 471,111 0.49x471,111
Secondary Fund of Funds 20,000,000 21,226,531 - 28,160,743 1,416,729 1.39x29,577,472Dec-05
Lexington VI Dec-05 20,000,000 21,226,531 - 28,160,743 1,416,729 1.39x29,577,472
© 2020 Asset Consulting Group All Rights Reserved 6
Oklahoma Police Pension & Retirement System
Private Equity - Active Funds
For the Period Ending April 30, 2020
Date
Jul-99 May-01 Dec-04
Nov-05
Mar-07
Oct-07
Apr-11
Aug-11
Nov-12
Feb-14
Jun-14
Dec-15
Dec-16
Apr-17
Jan-18
Mar-19
Dec-19
May-20
May-20
Summary of Portfolio Inception to Date (Category totals include active and closed funds)
Inception
Committed
Drawn
to Date
Remaining
Commitment
Distributions
to Date
Adjusted
Ending Value Total Value
Total Value to
Paid-in
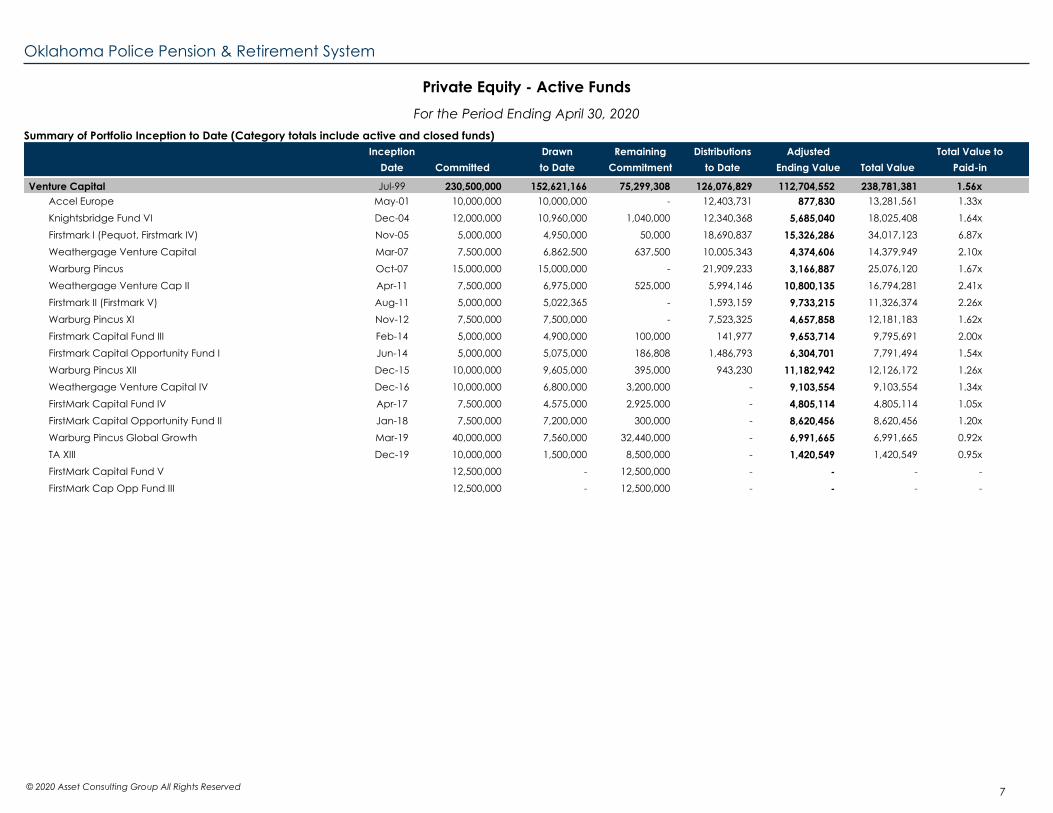
Venture Capital 230,500,000 152,621,166 75,299,308 126,076,829 112,704,552 1.56x238,781,381
Accel Europe 10,000,000 10,000,000 - 12,403,731 877,830 1.33x13,281,561
Knightsbridge Fund VI 12,000,000 10,960,000 1,040,000 12,340,368 5,685,040 1.64x18,025,408
Firstmark I (Pequot, Firstmark IV) 5,000,000 4,950,000 50,000 18,690,837 15,326,286 6.87x34,017,123
Weathergage Venture Capital 7,500,000 6,862,500 637,500 10,005,343 4,374,606 2.10x14,379,949
Warburg Pincus 15,000,000 15,000,000 - 21,909,233 3,166,887 1.67x25,076,120
Weathergage Venture Cap II 7,500,000 6,975,000 525,000 5,994,146 10,800,135 2.41x16,794,281
Firstmark II (Firstmark V) 5,000,000 5,022,365 - 1,593,159 9,733,215 2.26x11,326,374
Warburg Pincus XI 7,500,000 7,500,000 - 7,523,325 4,657,858 1.62x12,181,183
Firstmark Capital Fund III 5,000,000 4,900,000 100,000 141,977 9,653,714 2.00x9,795,691
Firstmark Capital Opportunity Fund I 5,000,000 5,075,000 186,808 1,486,793 6,304,701 1.54x7,791,494
Warburg Pincus XII 10,000,000 9,605,000 395,000 943,230 11,182,942 1.26x12,126,172
Weathergage Venture Capital IV 10,000,000 6,800,000 3,200,000 - 9,103,554 1.34x9,103,554
FirstMark Capital Fund IV 7,500,000 4,575,000 2,925,000 - 4,805,114 1.05x4,805,114
FirstMark Capital Opportunity Fund II 7,500,000 7,200,000 300,000 - 8,620,456 1.20x8,620,456
Warburg Pincus Global Growth 40,000,000 7,560,000 32,440,000 - 6,991,665 0.92x6,991,665
TA XIII 10,000,000 1,500,000 8,500,000 - 1,420,549 0.95x1,420,549
FirstMark Capital Fund V 12,500,000 - 12,500,000 - - --
FirstMark Cap Opp Fund III 12,500,000 - 12,500,000 - - --
© 2020 Asset Consulting Group All Rights Reserved 7

Oklahoma Police Pension & Retirement System
Private Equity - Active Funds
For the Period Ending April 30, 2020
Cash Flow Activity for 1 Month
Fund Name Date Transaction Type Cash Outflows Cash Inflows Net Cash Flows
Total -3,801,028 2,304,147 -1,496,881
Buyout -2,040,293 641,882 -1,398,411
Apollo Investment Fund VIII 4/01/2020 Distribution - 124,652
Apollo Investment Fund VIII 4/01/2020 Capital Call -201,926 -
Apollo Investment Fund VIII 4/01/2020 Base Rate Interest - Paid -10,210 -
Leonard Green Equity Investors VII 4/01/2020 Capital Call -561,960 -
Sun Capital Partners V 4/01/2020 Capital Call -239,183 -
Sun Capital Partners V 4/01/2020 Distribution - 239,183
Thompson Street Capital III 4/01/2020 Capital Call for Fees - No Commitment -15,142 -
Thompson Street Capital III 4/01/2020 Capital Call -113,055 -
Thompson Street Capital Partners IV 4/01/2020 Capital Call for Fees - No Commitment -25,735 -
Thompson Street Capital V 4/01/2020 Capital Call for Fees -73,309 -
Leonard Green Jade 4/15/2020 Capital Call -799,773 -
Francisco Partners Fund IV 4/21/2020 Distribution - 278,047
Distressed -1,689,697 58,898 -1,630,799
Oaktree Opportunities Fund Xb 4/02/2020 Capital Call -1,125,000 -
Apollo EPF III 4/22/2020 Recallable Distribution - 58,898
Apollo EPF III 4/22/2020 Capital Call -527,197 -
Apollo EPF III 4/22/2020 Capital Call for Fees -37,500 -
Mezzanine - 17,767 17,767
Newstone Capital Partners II 4/14/2020 Distribution - 17,767
Other -71,038 - -71,038
EnCap Energy Fund X 4/01/2020 Capital Call -36,487 -
EnCap Energy Fund IX 4/02/2020 Capital Call -16,806 -
EnCap Energy Fund IX 4/02/2020 Capital Call for Fees -17,745 -
Secondary Fund of Funds - 48,178 48,178
Lexington VI 4/29/2020 Distribution - 48,178
Venture Capital - 1,537,422 1,537,422
Weathergage Venture Cap II 4/10/2020 Distribution - 570,725
Warburg Pincus 4/13/2020 Distribution - 461,775
Firstmark II (Firstmark V) 4/29/2020 Distribution - 504,922
© 2020 Asset Consulting Group All Rights Reserved 8

Oklahoma Police Pension & Retirement System
Private Credit - Active Funds
For the Period Ending April 30, 2020
Summary of Cash Flows for 6 Months
Cash Outflows Cash Inflows Net Cash Flows
-21,785,052 5,350,772 -16,434,280
Date
Sep-16
Jan-17 Jan-17 Sep-16 Sep-16 Oct-18
Oct-19
May-20
Summary of Portfolio Inception to Date (Category totals include active and closed funds)
Inception
Committed
Drawn
to Date
Remaining
Commitment
Distributions
to Date
Adjusted
Ending Value Total Value
Total Value to
Paid-in
Total 115,000,000 85,066,417 40,219,664 33,133,841 61,686,107 1.11x94,819,948
Mezzanine 20,000,000 19,966,417 1,493,437 7,233,452 16,631,327 1.20x23,864,779
Newstone Capital Partners III 20,000,000 19,966,417 1,493,437 7,233,452 16,631,327 1.20x23,864,779
Other 95,000,000 65,100,000 38,726,227 25,900,389 45,054,780 1.09x70,955,169
LBC Credit Partners Fund IV 40,000,000 36,000,000 12,826,227 14,661,754 25,613,783 1.12x40,275,537
Apollo Accord II 11,400,000 10,500,000 900,000 11,238,635 450,922 1.11x11,689,557
Apollo Accord III 18,600,000 18,600,000 - - 18,990,075 1.02x18,990,075
Apollo Accord Fund III B 25,000,000 - 25,000,000 - - --
© 2020 Asset Consulting Group All Rights Reserved 9

Oklahoma Police Pension & Retirement System
Private Credit - Active Funds
For the Period Ending April 30, 2020
Cash Flow Activity for 1 Month
Fund Name Date Transaction Type Cash Outflows Cash Inflows Net Cash Flows
Total -47,422 314,509 267,087
Mezzanine -47,422 314,509 267,087
Newstone Capital Partners III 4/14/2020 Distribution - 314,509
Newstone Capital Partners III 4/14/2020 Capital Call -47,422 -
© 2020 Asset Consulting Group All Rights Reserved 10

Oklahoma Police Pension & Retirement System
Private Real Estate - Active Funds
For the Period Ending April 30, 2020
Summary of Cash Flows for 6 Months
Cash Outflows Cash Inflows Net Cash Flows
-8,535,321 2,527,729 -6,007,592
Summary of Portfolio Inception to Date (Category totals include active and closed funds)
Inception
Date Committed
Drawn
to Date
Remaining
Commitment
Distributions
to Date
Adjusted
Ending Value Total Value
Total Value to
Paid-in
Total 130,500,000 97,773,450 44,546,704 78,232,431 56,738,267 1.38x134,970,698Aug-11
Real Estate 130,500,000 97,773,450 44,546,704 78,232,431 56,738,267 1.38x134,970,698Aug-11
Siguler Guff Dist. Real Estate Opp. Aug-11 10,000,000 9,250,000 750,000 12,346,132 4,088,203 1.78x16,434,335
TA Associates Realty X Jan-13 20,000,000 20,000,000 - 30,064,935 2,411,917 1.62x32,476,852
Cerberus Real Estate Fund III Jul-13 20,000,000 25,185,319 4,871,659 25,979,622 9,986,415 1.43x35,966,037
Hall Capital Fund III Nov-14 7,500,000 7,080,261 419,739 2,880,272 5,620,322 1.20x8,500,594
Siguler Guff Dist. Real Estate Opp. II Dec-14 10,000,000 8,715,000 1,285,000 5,231,995 6,797,031 1.38x12,029,026
Cerberus Institutional Real Estate Partners 4 Jun-16 15,000,000 11,563,804 4,999,645 1,563,559 11,722,900 1.15x13,286,459
Siguler Guff Dist. Real Estate Opp. II B Dec-17 10,000,000 5,410,000 4,590,000 - 6,091,380 1.13x6,091,380
Angelo Gordon Realty Value Fund X Jun-19 20,000,000 5,950,000 14,050,000 52,310 5,728,970 0.97x5,781,280
Blackstone Real Estate Partners Fund IX, L.P Sep-19 18,000,000 4,619,066 13,580,661 113,606 4,291,129 0.95x4,404,735
© 2020 Asset Consulting Group All Rights Reserved 11

Oklahoma Police Pension & Retirement System
Private Real Estate - Active Funds
For the Period Ending April 30, 2020
Cash Flow Activity for 1 Month
Fund Name Date Transaction Type Cash Outflows Cash Inflows Net Cash Flows
Total -3,109,251 - -3,109,251
Real Estate -3,109,251 - -3,109,251
Blackstone Real Estate Partners Fund IX, L.P 4/03/2020 Capital Call -138,486 -
Blackstone Real Estate Partners Fund IX, L.P 4/07/2020 Capital Call -1,138,634 -
Angelo Gordon Realty Value Fund X 4/09/2020 Capital Call -1,750,000 -
Blackstone Real Estate Partners Fund IX, L.P 4/23/2020 Capital Call -14,631 -
Blackstone Real Estate Partners Fund IX, L.P 4/29/2020 Capital Call for Fees - No Commitment -67,500 -
© 2020 Asset Consulting Group All Rights Reserved 12

1
Month
(%)
YTD
(%)
FYTD
(%)
1
Year
(%)
3
Years
(%)
5
Years
(%)
10
Years
(%)
Equity Markets - Core
S&P 500 12.82 -9.29 0.62 0.86 9.04 9.12 11.69
Russell 1000 13.21 -9.68 -0.11 0.09 8.68 8.74 11.57
Russell 2000 13.74 -21.08 -15.32 -16.39 -0.82 2.88 7.69
Russell 2500 14.55 -19.50 -13.74 -14.20 1.13 3.62 8.70
Russell Mid Cap 14.36 -16.60 -10.28 -10.00 3.46 4.81 9.83
Equity Markets - Growth
Russell 1000 Growth 14.80 -1.39 10.71 10.84 15.69 13.34 14.41
Russell 2000 Growth 14.89 -14.71 -8.95 -9.22 4.21 5.19 9.96
Russell 2500 Growth 16.03 -10.91 -4.62 -4.03 7.98 7.22 11.37
Russell Mid Cap Growth 15.66 -7.52 -0.63 0.23 11.28 8.88 12.19
Equity Markets - Value
Russell 1000 Value 11.24 -18.49 -11.27 -11.01 1.42 3.91 8.54
Russell 2000 Value 12.34 -27.72 -22.04 -23.84 -6.06 0.30 5.30
Russell 2500 Value 13.22 -26.00 -20.67 -21.90 -4.49 0.61 6.37
Russell Mid Cap Value 13.36 -22.59 -16.66 -16.74 -2.02 1.99 8.09
International Markets
MSCI EAFE 6.54 -17.66 -11.79 -10.89 -0.09 0.32 4.04
MSCI EAFE Value 5.44 -24.17 -19.55 -19.96 -5.09 -3.09 1.93
MSCI EAFE Growth 7.49 -11.23 -4.08 -1.69 4.84 3.59 6.02
MSCI ACWI ex US 7.64 -17.40 -11.50 -11.07 0.24 0.31 3.37
MSCI Emerging Markets 9.18 -16.55 -10.44 -11.65 0.94 0.28 1.80
Fixed Income
ICE BofA ML High Yield Cash Pay 3.80 -9.76 -6.25 -5.21 1.46 3.20 5.66
BloomBar US Aggregate 1.78 4.98 7.56 10.84 5.17 3.80 3.96
FTSE World Govt Bond 1.19 3.22 3.73 7.97 4.24 2.98 2.35
BloomBar Universal 2.00 3.33 6.00 9.15 4.78 3.79 4.14
Market Overview
For the Periods Ending April 30, 2020
© 2020 Asset Consulting Group All Rights Reserved13

This report was prepared by ACG using information from sources that may include the following: client’s custodian(s); client’s investment manager(s); ACG Investment Manager Database and Client ReportingTool; third party data vendors; and other outside sources as may be directed by the client. Index Characteristics utilized in this report are obtained from third party data providers and may be different than indexcharacteristics reported by investment managers/funds due to varied calculation methodologies and data sources. Although the information presented herein has been obtained from and is based uponsources ACG believes to be reliable, no representation or warranty, express or implied, is made as to the accuracy or completeness of that information. Accordingly, ACG does not itself endorse or guarantee,and does not itself assume liability whatsoever for, the accuracy or reliability of any third party data or the financial information contained herein.
The information presented herein is for informational purposes only and is not intended as an offer to sell or the solicitation of an offer to purchase a security.
This report is provided as a management tool for the client’s internal use only. Information contained in this report does not constitute a recommendation by ACG.
This report may contain confidential or proprietary information and may not be copied or redistributed to any party not legally entitled to receive it.
Past performance is not indicative of future results. Any comparison to an index is for comparative purposes only. An investment cannot be made directly into an index. Indices are unmanaged and do notreflect the deduction of advisory fees.
This report is distributed with the understanding that it is not rendering accounting, legal or tax advice. Please consult your legal or tax advisor concerning such matters. No assurance can be given that theinvestment objectives described herein will be achieved and investment results may vary substantially on a quarterly, annual or other periodic basis. There is no representation or warranty as to the currentaccuracy of, nor liability for, decisions based on such information.
© 2020 Asset Consulting Group. All Rights Reserved. Asset Consulting Group is the sole owner of all rights, title, and interest to the materials, methodologies, techniques, and processes set forth herein, including any and all intellectual property rights. No part of this document may be reproduced, stored, or transmitted by any means without the express written consent of Asset Consulting Group.
Disclosures and Legal Notice
14