okky rizkia.pdf
TRANSCRIPT

1564
6.5 Room 4 (Serai): Entrepreneurship II
Business Development Strategy Analysis On Dairy Farm
(Case Study at PT. MSA)
Okky Rizkia Yustian
Faculty of Business and Management, Widyatama University
Abstract
Dairy farm business development in Indonesia (on farm) as well as the processing industry (off farm)
growing rapidly since 1980. The national milk consumption reached 3 million tons per year, 80% of them
were filled with imported milk. Lembang is one of the centers of development of dairy cattle in western
Java Indonesia. PT MSA one of the dairies in the valley of West Java. To overcome the problems in PT.
MSA which resulted in a decrease in the profits of the company needs to design a strategy. This study
uses research methods action research. To formulate strategies used external environment analysis and
internal company through the IFE and EFE as an input stage, then the matching stage analysis using IE
and SWOT matrix, then at the stage of decision stage using Quantitative Strategic Planning Matrix
(QSPM) to determine the best strategy.
Keywords : Business Strategy, IFE, EFE, IE, SWOT, QSPM
1. Introduction
Cows are the most important livestock as a source of protein, cattle produce meat and milk. Cow
produces about 50% (45-55%) of meat in the world, 95% of the milk and 85% of the skin (State Minister
for Research and Technology, 2005). Cows come from the family Bovidae. as well as bison, bison,
buffalo (Bubalus), African buffalo (Syncherus), and dwarf buffalo. Maintenance intensive cattle began
around 400 years BC. Cows are thought to originate from Central Asia, then spread to Europe, Africa and
the entire Asian region. Towards the end of the 19th century, Ongole cattle from India entered into the
island of Sumba and since then the island was used as a pure Ongole cattle breeding. In 1957,
improvements have been made genetic quality of cattle Madura by crossed with cows Red Deen. Another
crossed between local cattle (hybrid Ongole) with Frisian Holstein dairy cow in Grati dairy cows in order
to obtain a new type appropriate to the climate and conditions in Indonesia (State Minister for Research
and Technology, 2005).
In Indonesia, maintenance management cows grouped into two categories, (1) the maintenance
management of beef cattle and (2) the maintenance management of dairy cows. Kind of superior dairy
cattle and most widely cultivated cattle Shorhorn (from the UK), Holstein Friesian (from the Netherlands),
Yersey (from the Channel between England and France), Brown Swiss (from Switzerland), Red Danish
(from Denmark) and Droughtmaster (from Australia). Type of dairy cattle the most suitable and profitable
to be cultivated in Indonesia is Frisien Holstein (State Minister for Research and Technology, 2005).
Dairy farm business development in Indonesia (on farm) as well as the processing industry (off
farm) made progress in 1980 up to 1990, but in 1990 and 1999 production of fresh milk is relatively fixed.
The amount of fresh milk produced per year to approximately 330,000 tons. The production consists of
49% from East Java, 36% of West Java and the remaining 15% of Central Java (1999). In terms of the
development of the dairy cow population in 1970 of about 3000 tails be 193,000 head in 1985, and
became 369,000 head in 1991. This increase occurred due to dairy cattle imports from Australia and New
Zealand (Achjadi, 2001).
Dairy farm system in Indonesia is still a kind of small-scale farms and farms that still use the
traditional system. Dairy farm business success depends on the integration measures, especially in the
field of nurseries (Breeding), feed, (feeding), and governance (management). These three areas seem yet
to be implemented properly therefore arise many problems in the quality of milk, feed, cow health and

1565
management. Impacts of Dairy Processing Industry (Industri pengolahan Susu (IPS)) prefer to absorb the
supply of imported milk than local milk for imported milk quality is also better and cheaper price.
Early development of dairy cattle in Indonesia is concentrated on the island of Java. But as
decentralization and regional autonomy, the development of dairy cattle began to be directed out of the
island of Java to establish new centers that are suitable for the development of this commodity which is
based on agro-climatic conditions are optimal area for growth and production of dairy cows, the
availability of land to support the development and availability of market.
Lembang is one of the centers of development of dairy cattle in West Java. As well as other
communities in Indonesia who developed dairy cattle, dent community is still a kind of small-scale farms
with an average ownership of 1-3 / breeder and still use traditional farming systems (observation). With
this type of small-scale livestock farmers still rely on the existing cooperatives to distribute the results of
their milk to the Dairy Processing Industry (Industri pengolahan Susu (IPS)) such as Frisian Flag or Flag
Milk.
Koperasi Peternak Sapi Bandung Utara (KPSBU) is one of the cooperatives in West Java
Lembang precisely in the district. Most of the dairy farmers to deposit milk products perahannya to
Koperasi Peternak Sapi Bandung Utara (KPSBU) in order to be distributed to the Industri Pengolahan
Susu (IPS) such as Frisian Flag or Susu Bendera.
PT. MSA is one of the members of Koperasi Peternak Sapi Bandung Utara (KPSBU). In one day
PT. MSA can produce more than 500 liters of milk. PT. MSA although as a medium scale farmers but
still use traditional farming systems. Therefore, issues such as the quality of milk, feed, cow health and
management is still often appear. In the last five-year period the supply of milk from the cooperative to
IPS tends to stagnate due to the downward trend in prices in the international market, as well as the
decline in dairy cow population since the last three years. The conditions makes IPS absorb more
imported milk supply due to better quality at lower prices. (GKSI, 2015). Dairy farmers, including PT.
MSA also affected, such as the purchase price of milk is stagnant in the last 5 years while the price of
feed, labor and other costs go up significantly which resulted in a decrease in earnings of PT. MSA and
the achievement of PT. MSA.
Based on the research results Arti Prasad (2009) that the decline in profits due to rising raw
material prices resulted in no achievement of company objectives necessary to the formulation of the new
strategy.
The problem is not the achievement of company objectives in achieving profit based on the
increase in raw material as disclosed on the results of the study showed that conducted a new strategy
formulation. To formulate a new strategy of business development at PT. MSA associated with the need
for analysis of the external environment and internal company through the IFE and EFE as an input stage,
then the matching stage analysis using IE and SWOT matrix, having obtained several alternative
strategies can be chosen the best strategy through Quantitative Strategic Planning Matrix (QSPM) as the
stages of decision stage. In accordance with the opinion of Kotler (2002) that the formulation of the
strategy is indispensable organization to achieve its intended purpose, to achieve competitive advantage
and comparative organization must know the opportunities, threats, strengths and weaknesses and patterns
of organizational reaction to competitors, so it can be formulated an appropriate strategy. Based on the
above problems have to do research on the topic “Business Development Strategy Analysis On Dairy
Farm”
2. Literature Review
2.1 Analysis Strategy Formulation
Analysis of strategy formulation is done by first identifying the aspects of the effect of political,
economic, social, cultural, demographic, and technology. Then analyzing the competition by identifying
the five forces of competition in the industry in which the company moves, namely the threat of new
entrants, threat of substitute products, bargaining power of buyers, bargaining power of suppliers, and
competition between companies in the industry. Results of the analysis will produce a list of opportunities
and threats. Meanwhile, in order to analyze the internal factors carried out on the strengths and

1566
weaknesses of the company. Some analysis tools used are:
2.2 Management Strategy Concept Strategy is defined as a framework or plan that integrates the objectives, policies and programs of
action or organization. The strategy is also interpreted as a plan about what you want to achieve an
organization in the future and how to achieve such a state you want to achieve (Tripomo and Udan, 2005).
Marrus in Umar (2003) states that the strategy is the process of determining the plan's top leaders
that focuses on long-term goals of the organization, along with the preparation of a means or remedy how
that goal can be achieved. According to David (2004), the strategy is the way to achieve these goals and
determine the long-term competitive advantage.
Strategy Management is defined as a set of decisions and actions that resulted in the formulation
(formulation) and execution (implementation) plan designed to achieve the target company (Pearce and
Robinson, 1997). It could also be defined as a continuous process that makes the organization as a whole
in accordance with the environment (Dirgantoro, 2004)
Strategy Management can be defined as the art and science of formulating, implementing, and
evaluating cross-functional decisions that make the organization capable of achieving its objectives. As a
process, the implementation of strategic management consists of three stages: (1) Strategy formulation
stage; (2) Strategy implementation step; (3) Strategy evaluation step. To formulate a strategy, necessary
activities include: (1) Development of company’s mission; (2) Recognize opportunities and external
threats; (3) Determine internal strengths and weaknesses; (4) Determine objective in the long run; (5)
Result alternative strategy; and (6) Determine basic strategies that need to be implemented (David, 2002).
Alternative strategies that can be undertaken by the company can be grouped into 13 actions,
namely forward integration, backward integration, horizontal integration, market penetration, market
development, product development, concentric diversification, diversification conglomerate, horizontal
diversification, joint ventures, savings, divestments, and liquidation as well as a combination of strategy
(David, 2002).
2.3 Mission and Objectives of the Company
The mission of a company can be described as a general statement which formulates core purpose
or the basic philosophy of the company. Mission statement is to answer the question ”why does the
company exist?” The mission statement will clarify their own goals and increase their responsibility
agreements to achieve these goals.
According to Pearce and Robinson (1997), the mission of an enterprise is the goal (purpose) that
uniquely differentiates it from other companies similar and identify the scope of its operations. According
to David (2002), the goal is defined as a certain result is achieved by an organization seeks to support the
principal mission.
2.4 Environmental Analysis Environmental analysis is required in order to assess the organization of environmental
organizations / companies as a whole, which includes factors that are inside (internal) or outside (external)
that could affect the company's progress in achieving its intended purpose. In general, the environmental
company includes two major parts consisting of the external environment and internal environment as
described below.
a. Internal Enviromental All companies have strengths and weaknesses in various businesses functional. Internal
environmental analysis identifies strengths and weaknesses that became the foundation for the company's
strategy (Pearce and Robinson, 1997). None of the companies are equally strong or weak in all areas
(David, 2002). Internal environment are all factors that influence the direction and actions derived from
internal sources.

1567
Strength is the resources, skills, or other advantages relative to competitors and market needs are serviced
or want to be served by the Company. Weekness is the limited or lacks the resources, skills and
capabilities that can seriously undermine the effective performance of the company (Pearce and Robinson,
1997). Internal factors of the company in general is divided into factors: (1) Management, (2) Human
resources, (3) Operational and Production, (4) Marketing and distribution, (5) Capital and financial, and
(6) research and Development (David, 2002).
b. External Enviromental External environment consists of all the circumstances and forces that influence the choice of
strategy and determine the situation of its competitors. Strategy management model shows the external
environment as the three segments that interact: (1) Operational enviromental, (2) Industry, and (3) Other
enviromental (Pearce and Robinson, 1997).
Remote environment is usually not directly related to the operational situation of a company, such
political situasition, economic, socio cultural and demography, and technological development.
Industry environmental analysis performed by concepts Porter's Competitive Strategy that is often
called the Five Forces Competitive. According porter structure of competition in the industry can be seen
as a combination of the five powers, namely the threat of new entrants, threat of substitute products,
bargaining power of buyers, bargaining power of suppliers, and competition between companies in the
industry.
2.5 Internal Factor Evaluation (IFE) dan Eksternal Factor Evaluation (EFE) Matrix
According to David (2002), the purpose of internal analysis in the matrix IFE done by evaluating
the strengths and weaknesses in functional areas, including management, marketing, finance, production,
education and development, and computer information systems. Meanwhile, EFE matrix analysis is to
develop a list of limited opportunities that can be exploited and the threat to be avoided by the company.
The external analysis covering economic, social, cultural, demographic, environmental, political,
government, law, technology and competition.
Internal identification is intended to measure the extent of the strengths and weaknesses of the
company. Steps are summarized in an internal assessment is to use a matrix of IFE. This strategy
formulation tool summarizes and evaluates the main strengths and weaknesses in a business function, and
is also the basis of identification and evaluation of the relationship between existing functions. The use of
intuition is required in preparing the IFE matrix, so that there is a scientific approach should not be
interpreted to mean IFE as an excellent engineering (David, 2002).
2.6 Internal – external (I-E) Matrix IE matrix using the parameters of internal strength and external influences that each of the
elements identified in the external and internal through IFE and EFE matrix. Intended use of the IE matrix
is to acquire the company's business strategy in more detail level (Rangkuti, 2000).
In IE matrix, the total score of the weight of the IFE on the x axis and the total score on the y-axis
weight EFE. On the x-axis of the matrix IE, the total weight of the IFE score of 1.00 to 1.99 depict a
weak internal position, a score of 2.00 to 2.99 are considered average, and a score of 3.00 to 4.00 is strong.
Similarly, the y-axis, the total score of the weight of 1.00 to 1.99 is considered low, intermediate score of
2.00 to 2.99, and a score of 3.00 to 4.00 is high
2.7 SWOT Matrix
SWOT stands for Strengths (powers), Weakneses (weakness), Opportunities (chances /
opportunities) and Threats (threats) (Rangkuti, 2000).
Strength can be described as a positive side the company who can guide the direction of the
broader opportunities, so it can be used for development. Weakness is any deficiency in terms of expertise
and resources of the company. Consideration should be given to how this can be treated, for example with
the takeover, merger or training and development.
1568
Chance / opportunity depict events in the external environment that allows perusahaani benefit.
This case seems to arise from changes in technology, markets and products, legislation and so on. Threat
is the danger or problem that can destroy the position of the company. For example, the launch of new
products by competitors, changes in safety standards, changes in the model, or the problems that arise
with suppliers of raw materials or problems with customers.
SWOT analysis is a model in formulating an alternative strategy that combined data from internal and
external companies. Alternative strategies are: (1) strength-opportunity strategy / SO strategy; (2)
weaknesses-opportunities strategy / WO strategy; (3) weaknesses-threats strategies / WT strategy; and (4)
strength-threat strategy / ST strategy.
The steps in making a SWOT matrix is: Put factors opportunities, threats, strengths, and weaknesses in
the available space.
2.8 Quantitative Strategic Planning Matrix (QSPM)
Formulation of a strategy, which is the last stage, which select and define the best strategy and the
most appropriate analytical approach QSPM. Quantitative Strategic Planning Matrix or Quantitative
Strategic Planning Matrix (QSPM) is a tool to evaluate alternative strategies objectively option, specify
the relative attractiveness of alternative actions are feasible, based on information from the input stage
and integration stage to decide which strategy is best (David, 2002).
Among other advantages QSPM: (1) that the strategy can be checked sequentially or
simultaneously, (2) there is no limit to the number of strategies that can be evaluated or examined at once,
(3) This tool requires strategists to integrate external factors and internal related to the decision process (4)
develop QSPM make key factors are less likely to be neglected or not given appropriate weight. While the
lack QSPM include: (1) This process always requires intuitive judgments and assumptions are taken into
account, (2) rank and attractiveness value requires subjective judgments, however the process must use
objective information, and (3) This concept can only be as good as the information required and analysis
of pairing it rests.
1569
Figure 1: Framework scheme
3. Research Methods
3.1 Research Design
This research included in this type of research action research. This research method is the
method used to strengthen local communities or their representatives by involving well as to encourage
the public or individuals to identify potential and existing problems in the village, community or their
businesses, so that communities, groups or individuals that took the initiative to take action settlement of
the problem itself. Research action research is research aimed at developing new skills, new strategy or a
new approach to solving problems with direct application in the world of work or other actual world
(Surya Subrtata, dalam Aries, S, Erna Febru 2010:3). Action research emerged as a reaction to the
External
Environmental
Internal
Environmental
Environmental Analysis
EFE Matrix and IFE Matrix
Alternative Strategies
Identification of
Strategies (Matriks I-E
Matrix and SWOT
Matrix)
PT.MSA
Decision Making
Strategies (QSPM
Matrix)
Business Strategy
Input Stage
Matching Stage
Decision Stage
Vision and Mision of the
Company

1570
awareness of the failure of top-down development, popularized mainly by Conway and Chambers (1992),
and most recently by Korten (1996).
Which distinguishes between action researches with conventional research is the involvement of
the research object actively and intentionally in the research process. While conventional research object
of study only used as a neutral spectator (Chalmers dama Basuno, 2005)
As a research method, in action research must do two things: to observe what others have done to
the object of research and at the same time have to find out how existing solutions and can be done jointly
between researchers and the community. Action research approach offers a structured research and
action that could encourage the parties to take the lessons and experiences through observation cycle-
planning-action-reflection (CIFOR, YGB, PSHK-ODA, 2006)
3.2 Data and Data Sources
In this study, using primary data and secondary data, both qualitative and quantitative. Primary
data obtained through interviews and questionnaires by the owner and manager of PT. MSA that includes
expert judgment and direct observation in the field. While secondary data obtained from library materials
and relevant literature.
3.3 Collecting data Method
The data collection process using action research approach.Action research through several stages
of the preconditions, the stage of data collection and data validation stage. Stage pre-condition starts with
designing the process by which owners, managers of companies involved in this research.Then together
identify potential have the opportunity to thrive. This phase is done by using a focus group involving
experts when necessary.
The second phase of this research is data collection. Starting with the search for information on
the history and activities of PT. MSA is done at this time, knowing the future expectations, knowing the
vision, mission and objectives PT. MSA with future scenario technique with the help of visual aids in the
form of the tree of life. Another aid tool is the flow chart of production and marketing.
For the next stage is the stage of identification of opportunities, threats, strengths and weaknesses
are summarized in strategic factors internal and external present in the matrix of IFE and EFE then match
it into IE matrix. In this process owners and managers used as an expert (expert) to the weight and the
rating on the strategic factors are produced. In an alternative strategy using SWOT analysis. In this stage
more use of FGD and simulation techniques.
In the data collection phase of the study, the last step is to perform weighting and peratingan
SWOT factors to alternative strategies using Quantitative Strategic Planning Matrix (QSPM). At this
process owners and managers of PT. MSA used as experts to give weight, ratings in the assessment
Attractive Score (AS) and select the main strategies through QSPM method.
The last stage in the research is the action research data validation phase, a process for cross-
checking and verification of the correctness of data that have been collected in the data collection phase
has been done before. This process uses the method FGD
3.4 Data Analysis
For processing and statistical analysis of quantitative data in this study using the software
Microsoft Excel 2003. Quantitative analysis starts from performing weighting and calculates a score for
each strategic factors internal and external environment, to perform calculations Attractive Score (AS) of
each alternative strategy derived from IE matrix analysis and SWOT matrix. Weighting calculation is first
made to each respondent expert, then put together to determine the average.
The process of data analysis carried out through three stages. The first stage or input stage of data
collection by using the matrix factor Internal Evaluation (IFE) and External Factor Evaluation (EFE). The
second stage is matching or matching stage using an internal matrix - External (IE) and SWOT matrix.
The third stage or stage Decision that decision by using Quantitative Strategic Planning Matrix (QSPM).
1571
4.Discussion
4.1 Environmental Analysis Dairy Farm PT. MSA
a. Analysis of External Factors
In a study using participatory methods is the analysis done jointly with the owners and managers of a
dairy farm PT. MSA. If the difference viewpoints in analyzing a factor it will be sought a middle way.
b. Identification of Opportunities, Threats, Strengths and Weaknesses Dairy Farm PT. MSA.
Based on the analysis of external environment then obtained the opportunities and threats faced by PT.
MSA. Opportunities and threats come from the macro environment, micro environment, and
environmental industries. While based on internal analysis obtained strengths and weaknesses. The
strengths and weaknesses derived from the functional PT. MSA in the form of human resources,
production and operations, finance and marketing.
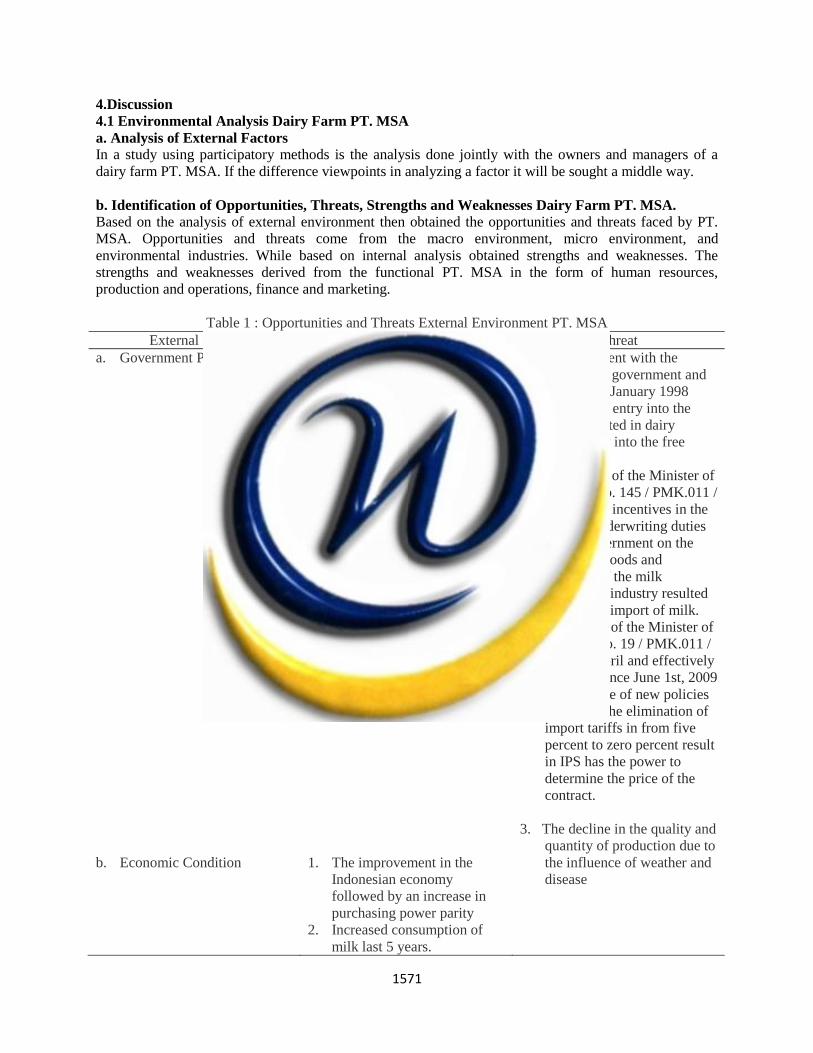
Table 1 : Opportunities and Threats External Environment PT. MSA
External Factor Opportunity Threat
a. Government Policy
b. Economic Condition
1. The improvement in the
Indonesian economy
followed by an increase in
purchasing power parity
2. Increased consumption of
milk last 5 years.
1. An agreement with the
Indonesian government and
the IMF in January 1998
Indonesia's entry into the
MEA resulted in dairy
commodity into the free
market.
2. Regulation of the Minister of
Finance No. 145 / PMK.011 /
2008 fiscal incentives in the
form of underwriting duties
by the government on the
import of goods and
materials if the milk
processing industry resulted
IPS free to import of milk.
3. Regulation of the Minister of
Finance No. 19 / PMK.011 /
2009 in April and effectively
enforced since June 1st, 2009
the issuance of new policies
regarding the elimination of
import tariffs in from five
percent to zero percent result
in IPS has the power to
determine the price of the
contract.
3. The decline in the quality and
quantity of production due to
the influence of weather and
disease

1572
c. Social, Cultural and
Demographic
c. Teknology
d. New Entrance
e. Subtitution product
f. Bargaining power of buyers
g. Bargaining power of supplier
3. Processing of fresh milk to
be a new product.
4. The increasing number of
population.
5. The use of pasteurization
technology.
6. Use of technology cow
milker.
6. Distribution of fresh milk
directly to consumers
7. Establish a contract with
supplier
3. Higher technological
imported milk.
4. Increasing the number of
new competitors in the
market.
5. Changes in Community
consumption.
6. Uncertainty feed supply
7. Decrease Margin
List the strengths and weaknesses of PT. MSA contained in the table below. Strategic factors of
external and internal assessment results of the research and the management of PT. MSA respondents.
Then, these factors were weighted and rating to measure its effect on the PT. MSA.
Table 2 : Strengths and Weaknesses Internal Environment PT. MSA
Internal Factor Strenght Weekness
a. Production and Operation
b. Human Resources
c. Financial
1. Good milking procedures
and appropriate SOP.
2. Maintenance of a good dairy
cow.
3. Quality good milk.
3. Labour has competence in
their field.
4. Workers who have loyalty.
5. A good working
environment.
6. Procurement regular training.
7. The management of PT.
MSA who have competence
in farm and business
management.
8. Have the financial recording
system
1. Milking dairy manually by
hand.
2. Provision of drugs and
medical personnel depend on
the cooperative.
3. Do not have fresh milk
processing technology
further.
4. The level of education of
workers are still low.
4. The recording system is not
yet appropriate financial
accounting standards

1573
d. Sales and Marketing
9. Have a regular customer.
10. Good relationships with
business partners.
11. A strategic location.
5. The power of determining
prices is weak because it
depends on the customer.
6. Never carry out promotional
products.
4.2 Input Stage
a. Eksternal Factor Evaluation Matrix (EFE)
Based on the identification of external factors attempt by PT. MSA obtained a number of
opportunities and threats are referred to as external strategic factor of business. Strategic external factors
are then weighted and ranked by granting the owner and manager of PT. MSA.
Total score of 2,763 EFE matrix indicates the position of PT. MSA medium / average in respond
to opportunities to address existing threats from PT. MSA. The main opportunities are owned by PT.
MSA is the use of technology milker cow with a score of 0288. Second place is the use of pasteurization
technology with a score of 0277. Furthermore diurutan to three with a score of 0273 is fresh milk for
processing into products.
While the main threat perceived decrease in the margin with a score of 0103. The second order is
for the government agreement with the IMF dairy commodities entering a free market with a score of
0.119. Further regulation of the Minister of Finance profitable milk imports IPS ranks third with a score
of 0133.
b. Internal Factor Evaluation Matrix (IFE)
Based on the identification of internal factors that exist by PT. MSA obtained a number of
strengths and weaknesses of the so-called internal strategic factor of business. Strategic internal factors
are then weighted and ranked by granting the owner and manager of PT. MSA.
Seen from the total score of 3096 indicates IFE matrix PT. MSA is at a high enough position to
utilize its strengths to overcome weaknesses. The main strength of which is owned by PT. MSA is the
management who have the competence fields of animal husbandry and business management with a score
of 0.256. Followed by milking procedure in accordance with the SOP in second with a score of 0240.
Ranked third with a score of 0234 is the maintenance of a good dairy cow.
4.3 Matching Stage
a. Matrix Internal and Eksternal Analysis (I-E)
IE matrix generated by combining information obtained from EFE and IFE matrix to obtain
information about the company's position in order to facilitate the provision of strategic alternatives. EFE
matrix values for 2763 show PT. MSA has average ability to take advantage of opportunities and avoid
threats. While the IFE matrix values for 3096 show PT. MSA has internal factor is quite high in
harnessing the strength to overcome internal weaknesses that exist.
Based on the value of the matrix EFE and IFE, obtained the competitive position of PT. MSA in
quadrant IV. At that position, the best strategy is carried Build. Quadrant IV.In principle referred to grow
and get up (growth and build) tsrategi intensive (market penetration, market development, and product
development) or integrative (backward integration, forward integration and horizontal integration). With
so a strategy that fits with PT. MSA is creating a new market share by improving quality and market
penetration, market development and product development.

1574
Figure 2 : I-E PT. MSA Matrix
IFE TOTAL SCORE
E
Strong Average Weak
F
4.0 3.0 2.0 1.0
E High
I II III
T
O
3.0
T
IV
V VI A Medium
L
2.0
S
VII VIII IX
C
O Low
R
1.0
E
b. SWOT Matrix Analysis
SWOT matrix analysis done by systematically comparing the results of the strengths and
weaknesses of the internal environment with opportunities and threats of the external environment is
measured to generate the appropriate business development strategy, as shown in Table SWOT matrix
analysis.
Table 3 : SWOT Matrix of PT. MSA
Strengths :
1. Milking procedure in
accordance with SOP
2. Maintenance of a good
dairy cow
3. The quality of milk is
good
4. Workers who have
competence in their field
5. Workers who have loyalty
6. A good working
environmentPengadaan
pelatihan secara rutin
7. Management with
competence fields of
animal husbandry and
business management
8. Have a financial recording
Weakness :
1. Milking dairy manually
using a hand
2. Provision of drugs and
medical personnel rely on
cooperative
3. The power of pricing is
weak because it depends
on the customer
4. Never carry out
promotional products

1575
system
9. Have a regular customer
10. Good relationships with
business partners
11. The strategic location
Opportunities :
1. The improvement in the
Indonesian economy
followed by an increase in
purchasing power
2. Increased consumption of
milk last 5 years
3. Processing of fresh milk to
be a new product
4. The increasing number of
population.
5. The use of pasteurization
technology.
6. Use of technology cow
milker.
7. Establish a contract
dengan pemasok.
S-O Strategy
1. Increase the amount of
fresh milk production.
2. Use a tool to improve the
quality of milk
pasteurization.
3. Make a contract with a
business partner
W-O Strategy
1. The use of technology
cow milker
2. Creating new customers
with fresh milk
processing into new
products.
Threats :
1. The government
agreement with the IMF
dairy commodity market
entry is free.
2. Regulation of the Minister
of Finance profitable IPS
milk imports.
3. Regulation of the Minister
of Finance made the IPS is
free to determine the price
of the contract with the
cooperative
4. The influence of weather
and disease
5. Technology high import
milk
6. Increasing the number of
new competitors in the
market
7. Changes in consumption
8. Uncertainty feed supply
9. Decrease Margin
S-T Strategy
1. Providing quality fresh
milk
2. Improve the synergism
and partnerships.
W-T Strategy
1. Working with more than
one feed suppliers and
customers.
2. Procurement of medical
drugs.
3. Promoting the product.
4.4 Phase Decision (Decision Stage) with QSPM Analysis
QSPM analysis was used to evaluate the attractiveness of the (relative attractiveness) of the
analysis produced by the SWOT matrix, such as adding fresh milk production, the use of tools to improve
the quality of milk pasteurization, making contracts with business partners, the use of technology milker,
1576
creating new customers by processing milk into new products, providing quality fresh milk, improve the
synergism and partnerships, in collaboration with more than one supplier and customer, the procurement
of medicines and medical personnel, and product promotions.
After the weight given by the expert and the data processing through QSP matrix, obtained the
highest score out of ten alternative strategies WAS generated. Strategies which occupies the first position,
namely SO2 is the strategy of using technology to improve the quality of milk pasteurization with a value
that is 5889. Then WO2 with value 5859 occupied the second position that is creating new customers by
processing fresh milk into new products. The third position ST1 alternative strategy to provide quality
fresh milk has a value of 5578. As for the latter strategy chosen was SO1 is add fresh milk production
with a value of 5004.
The election strategy of using pasteurization technology and create new customers by processing
fresh milk into new products according to the analysis of the matrix of IE which states that the best
strategy is the strategy Build or in principle referred to grow and get up (growth and build) market
penetration strategy, market development, and product development. This strategy is consistent with the
problems of PT. MSA which decreased margins and the dependence on one customer. By doing
pasteurized fresh milk, PT. MSA is more flexible in terms of sales of milk because the milk quality will
increase. Then by processing fresh milk into products that will make PT. MSA can expand its market
share with that number of subscribers PT. MSA can be increased and the bargaining position of PT. MSA
will be increased in terms of determining the selling price of milk. By executing this strategy
simultaneously PT. MSA can maximize the strengths and cover the weaknesses to exploit existing
opportunities.
5. Conclusions and Suggestions
5.1 Conclusions
The conclusion of this study is:
1. Strategic factors internal power PT. MSA is as follows: (1) the milking procedure in accordance with
the SOP, (2) Maintenance of a good dairy cow, (3) quality of milk is good, (4) Workers who have
competence in their field, (5) Workers who have loyalty, (6 ) A good working environment, (7)
Procurement of regular training, (8) management with competence fields of animal husbandry and
business management, (9) has a financial recording system, (10) having teteap customers, (11) A
good relationship with a partner business, (12) the strategic location. While the strategic factors of
internal weakness PT. MSA namely: (1) Milking milk manually using a hand, (2) provision of drugs
and medical personnel rely on the cooperative, (3) The power of pricing is weak because it depends
on the customer, (4) Never do promotional products.
2. Factors PT strategic opportunities. MSA is: (1) The improving economic condition in Indonesia was
followed by an increase in purchasing power, (2) Increased consumption of milk last 5 years, (3)
Processing of fresh milk into new products, (4) Increasing the number of population, (5) use of
technology pasteurization, (6) the use of technology milker, (7) Establish a contract with a supplier.
While the threat of strategic faktro PT. MSA namely: (1) the government agreement with the IMF
dairy commodities entering a free market, (2) Regulation finance minister profitable IPS milk imports,
(3) Regulation finance minister made the IPS is free to determine the price of the contract with the
cooperative, (4) the effect of weather and disease, (5) Technology high import milk, (6) Increasing
the number of new competitors in the market, (7) Changes in consumer spending, (8) uncertainty of
supply of feed, (9) Decrease in margin.
3. From the analysis conducted. Input stage through EFE and IFE matrix shows the ability of PT. MSA
in taking advantage of opportunities to address the threat still average, ie a score matrix EFE 2763 is
still at an interval of 2:00 to 2.99. The ability of PT. MSA in using force to cover up weaknesses
fairly high with the score matrix IFE 3096 in the interval 3.0 to 4.0.
4. In Matching stage internal matrix analysis external (IE) indicates the position of PT. MSA entered in
quadrant IV, so that a suitable strategy of IE matrix analysis is Build. From the results of SWOT
analysis, obtained by alternative strategies include adding fresh milk production, the use of tools to
1577
improve the quality of milk pasteurization, making contracts with business partners, the use of
technology milker, creating new customers by processing milk into new products, providing quality
fresh milk, improve the synergism and partnerships, in collaboration with more than one supplier and
customer, the procurement of medicines and medical personnel, and product promotions.
5. After analyzing the decision-making stage with QSPM, the alternative chosen strategy is the use of
pasteurization technology and create new customers by processing fresh milk into new products. Each
one has a score of 5889 and 5859 WAS.
5.2 Suggestions From the conclusions obtained, the suggestions are as follows:
1. In developing its business, PT. MSA should be able to maximize the strengths and weaknesses cover
to take advantage of existing opportunities. Weakness PT. MSA that rely solely on any one customer
can be resolved with the use of pasteurization technology that allows PT. MSA can sell the milk in
addition to the cooperative for quality improvement. PT. MSA by using pasteurization technology can
process the milk into a product that is new, so PT. MSA can add customers and provide benefits in
terms of determining the selling price of milk.
2. In the creation of new products, PT. MSA recommended conducting further experiments to create a
new product that is truly wanted and needed by the community.
6. References
Achjadi K R.1991. Penanggulangan Gangguan Reproduksi Dasar Pendekatan Dan
Pelaksanaan di Lapangan. Disampaikan Pada pertemuan Evaluasi Nasional
Pelaksa naan IB dan Pertimbangan Pemuliabiakan Ternak. Bandung.
Artiprasetyo, Ahdhiat. 2009. Analisis Strategi Terhadap Penurunan Penjualan dan Laba
Pada Perusahaan Jamu Kemasan. Institute Pertanian Bogor. Bogor.
Basuno, 2005. Kaji Tindak (Action Research) Pemberdayaan Masyarakat Pertanian Di
Wilayah Tertinggal. Laporan Penelitian. Pusat Penelitian dan Pengembangan
Sosial Ekonomi Pertanian. IPB, Bogor.
CIFOR. 2004. Pelatihan dan Lokakarya Penelitian Aksi Partisipatif dalam Proses
Kebijakan Pengelolaan dan Pengaturan Hutan.
David, F. R.2002. Manajemen Strategy; Konsep Edisi Tujuh. Prenhalindo. Jakarta
Dirgantoro, C. 2004. Manajemen Strategik. Grasindo. Jakarta.
Kotler, Philip. 2002. Manajemen Pemasaran; Edisi Milenium.Prenhalindo. Jakarta.
Pearce, J. A. and Richard B. R. 1997.Manajemen Strategik: Formulasi, Implementasi,
dan Pengendalian. Binarupa Aksara. Jakarta.
Rangkuti, Freddy.2000. Analisis SWOT Teknis membedah Kasus Bisnis. Penerbit
Gramedia. Jakarta.
State Minister for Research and Technology. 2005. Jakarta.
Tripomo, Tedjo dan Udan (2005).Manajemen Strategi. Rekayasa Sains. Bandung
Umar, H. 2003. Strategic Managemen In Action. Gramedia Pustaka Utama. Jakarta.