oirp.ncsu.edu · web viewnc state university 2014 & 2004 staff well being survey s: annotated...
TRANSCRIPT

NC State University2014 & 2004 Staff Well Being Surveys:Annotated Questionnaire
Section A: Overall Satisfaction
A1. Please indicate the extent to which you agree or disagree with the following statements. Year N Mean Stdev
4: Strongly
Agree3: Agree 2:
Disagree1:
Strongly Disagree
a. In general I like the people with whom I work most closely
2014 3,152 3.4 0.59 46.9% 49.1% 3.4% 0.6%
2008 3,224 3.4 0.59 49.1% 47.4% 2.8% 0.7%
b. I feel valued in my department2014 3,15
0 3.1 0.78 30.9% 49.9% 15.3% 3.9%
2008 3,217 3.1 0.76 32.8% 51.2% 12.6% 3.4%
c. I would recommend my department as a good place to work 2014 3,14
9 3.1 0.77 33.0% 50.0% 13.4% 3.6%
2008 3,212 3.2 0.74 34.3% 52.0% 10.6% 3.1%
d. In general, I look forward to coming to work2014 3,14
6 3.1 0.72 29.8% 55.2% 12.2% 2.9%
2008 3,205 3.1 0.69 30.0% 56.6% 11.2% 2.2%
e. I am proud to say I work at NC State University2014 3,14
3 3.5 0.63 52.1% 42.6% 4.2% 1.1%
2008 3,219 3.4 0.61 50.2% 45.1% 4.0% 0.7%
f. I feel like I make a difference here2014 3,15
0 3.2 0.68 37.0% 51.7% 10.0% 1.3%
2008 3,207 3.2 0.71 37.4% 50.5% 10.3% 1.9%
g. I expect to work at NC State for at least the next three years
2014 3,146 3.2 0.82 39.6% 43.0% 13.1% 4.3%
2008 3,202 3.3 0.80 44.0% 41.0% 11.2% 3.8%
h. I feel like I “fit” in my department (e.g., like I belong, am comfortable)
2014 3,149 3.2 0.74 36.7% 48.8% 12.0% 2.4%
2008 3,203 3.2 0.74 38.5% 48.3% 10.5% 2.7%
i. I find my day-to-day work enjoyable2014 3,14
8 3.2 0.66 31.4% 56.9% 10.2% 1.5%
2008 NA NA NA NA NA NA NA
j. My work gives me a sense of purpose2014 3,14
8 3.2 0.70 34.7% 52.8% 10.5% 2.0%
2008 NA NA NA NA NA NA NA
2014 SWBS Annotated Questionnaire Page 1 of 51

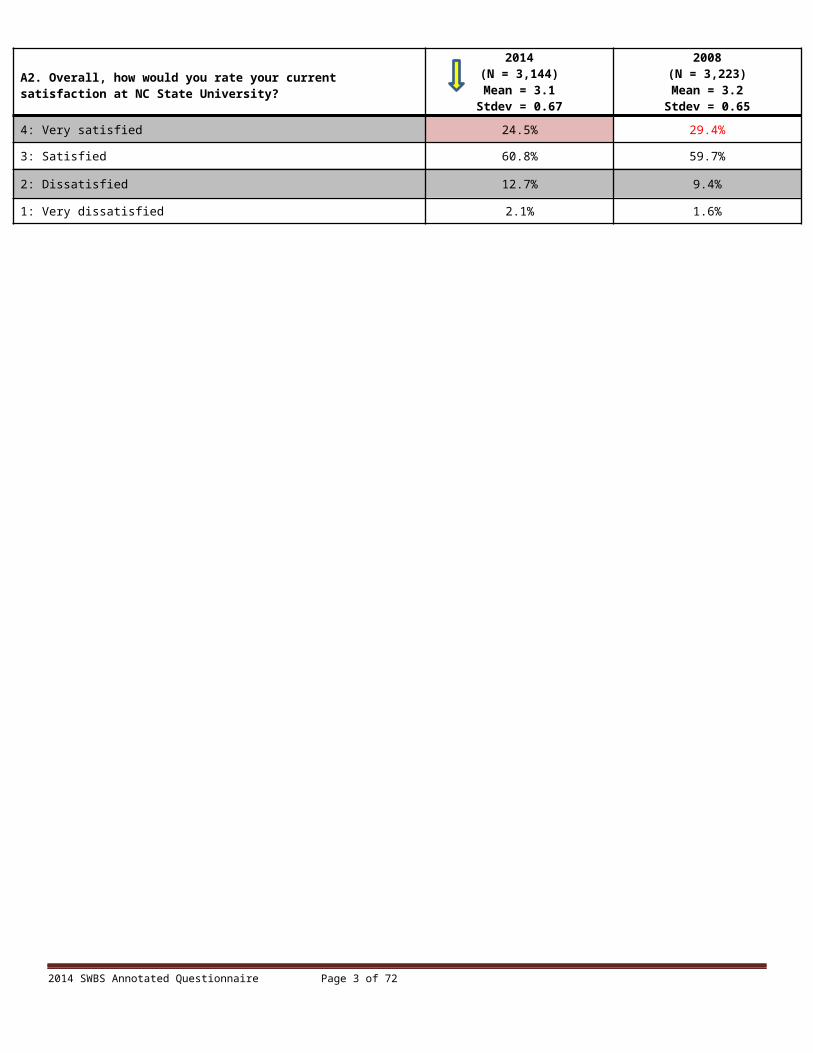
A2. Overall, how would you rate your current satisfaction at NC State University?
2014(N = 3,144)Mean = 3.1
Stdev = 0.67
2008(N = 3,223)Mean = 3.2
Stdev = 0.65
4: Very satisfied 24.5% 29.4%
3: Satisfied 60.8% 59.7%
2: Dissatisfied 12.7% 9.4%
1: Very dissatisfied 2.1% 1.6%
2014 SWBS Annotated Questionnaire Page 2 of 51
A3. Would you say you are more or less satisfied at NC State now than you were three years ago (or, if you’ve been here less than three years, when you first arrived)?
2014 (N = 3,155)Mean = 3.0
Stdev = 1.15
2008(N = 3,225)Mean = 3.4
Stdev = 1.13
5: A lot more satisfied now 12.5% 17.8%
4: Somewhat more satisfied now 21.6% 29.0%
3: About the same 32.1% 31.2%
2: Somewhat less satisfied now 24.6% 15.8%
1: A lot less satisfied now 9.3% 6.2%
A4. During the past year or two, have you applied for a different job within NC State?
2014(N = 3,156)
2008(N = 3,220)
Yes—applied and changed jobs 9.7% 11.7%
Yes—applied but did not change jobs 16.2% 15.2%
No—did not apply for a different job 74.1% 73.0%
A5. What would you say was the most important reason you were looking to change jobs within the university?
2014(N = 816)
2008(N = 852)
Opportunity for advancement 58.3% 56.2%
Better work environment 15.7% 22.8%
Just wanted a change 4.3% 3.5%
Other (please briefly explain) 21.7% 17.5%
A6. During the past year or two, have you considered leaving NC State for reasons other than retirement?
2014(N = 3,144) 2008
(N = 3,207)
Yes—very seriously 17.1% 13.8%
Yes—somewhat seriously 19.7% 20.0%
Yes—but not very seriously 20.9% 16.0%
No—have not considered leaving NC State in the past couple of years 42.3% 50.2%
A7. During the past year or two when considering leaving NC State, did you apply for a job(s) outside the university?
2014(N = 1,146) 2008
(N = 1,066)
Yes 64.0% 58.8%
No 36.0% 41.2%
2014 SWBS Annotated Questionnaire Page 3 of 51

A8. Please briefly describe why you considered leaving NC State.
Section B: Working RelationshipsB1. Overall, how would you rate the quality of relations between: Year N Mean Stdev 4:
Excellent3:
Good 2: Fair 1: Poor Don’t Know
2014 SWBS Annotated Questionnaire Page 4 of 51

a. Staff in your work unit and the work units’ immediate supervisor
2014 3,130 3.1 0.87 36.7% 42.5% 14.3% 6.5% 0.7% (of 3,151)
2008 3,143 3.1 0.84 37.4% 43.6% 13.6% 5.4% 0.7% (of 3,166)
b. Staff in your department and upper administration in your department
2014 3,063 2.8 0.90 23.5% 45.5% 20.9% 10.0% 2.7% (of 3,149)
2008 3,067 2.9 0.85 23.7% 48.5% 20.7% 7.1% 2.7% (of 3,153)
c. Staff in your department and upper administration in your college/division
2014 2,766 2.7 0.87 15.5% 47.1% 25.8% 11.5% 12.1% (of 3,145)
2008 2,750 2.8 0.84 17.6% 50.9% 22.4% 9.1% 12.6% (of 3,145)
d. Staff at NC State University as a whole and the upper administration in theuniversity
2014 2,598 2.6 0.83 11.9% 48.4% 28.8% 11.0% 17.4% (of 3,147)
2008 2,574 2.7 0.79 14.0% 52.5% 26.3% 7.2% 18.2% (of 3,147)
2014 SWBS Annotated Questionnaire Page 5 of 51

2014 SWBS Annotated Questionnaire Page 6 of 51
B2. I am treated with respect by: Year N Mean Stdev4:
Strongly Agree
3: Agree
2: Disagree
1: Strongly Disagree
Doesn’t Apply
a. Co-workers in my work unit2014 3,121 3.4 0.62 48.3% 46.7% 4.1% 1.0% 0.8% (of
3,146)
2008 3,154 3.4 0.61 48.6% 47.1% 3.3% 1.0% 0.6% (of 3,173)
b. Other staff in my department (whom I do not supervise)
2014 2,993 3.3 0.62 41.3% 53.0% 4.6% 1.1% 4.5% (of 3,133)
2008 3,003 3.4 0.60 41.1% 53.9% 4.3% 0.8% 4.9% (of 3,157)
c. Staff I supervise2014 1,526 3.5 0.58 50.3% 46.3% 2.7% 0.7% 51.1% (of
3,119)
2008 1,537 3.4 0.59 47.8% 48.6% 2.9% 0.7% 50.5% (of 3,107)
d. My supervisor2014 3,123 3.4 0.75 49.8% 40.2% 6.6% 3.4% 0.4% (of
3,137)
2008 3,133 3.4 0.72 48.7% 42.8% 5.7% 2.8% 0.6% (of 3,153)
e. Upper administration in my department
2014 3,012 3.2 0.73 35.1% 53.2% 8.2% 3.5% 3.9% (of 3,133)
2008 3,029 3.2 0.71 35.0% 54.1% 8.0% 2.8% 3.7% (of 3,146)
f. Upper administration in my college/division
2014 2,576 3.1 0.70 26.9% 60.4% 9.1% 3.6% 17.9% (of 3,137)
2008 2,614 3.2 0.66 29.1% 60.9% 7.6% 2.4% 16.4% (of 3,128)
g. Students2014 2,206 3.4 0.56 38.9% 57.9% 2.6% 0.5% 29.6% (of
3,134)
2008 2,178 3.3 0.56 36.4% 59.8% 3.2% 0.6% 30.4% (of 3,131)
h. Faculty2014 2,481 3.2 0.60 29.1% 64.3% 5.1% 1.5% 21.0% (of
3,139)
2008 2,462 3.2 0.60 29.2% 62.8% 7.0% 1.1% 21.5% (of 3,135)
i. Customers or clients with whom I interact
2014 2,851 3.4 0.55 41.2% 56.4% 1.9% 0.4% 9.2% (of 3,141)
2008 2,895 3.4 0.53 41.8% 56.4% 1.5% 0.3% 8.2% (of 3,154)
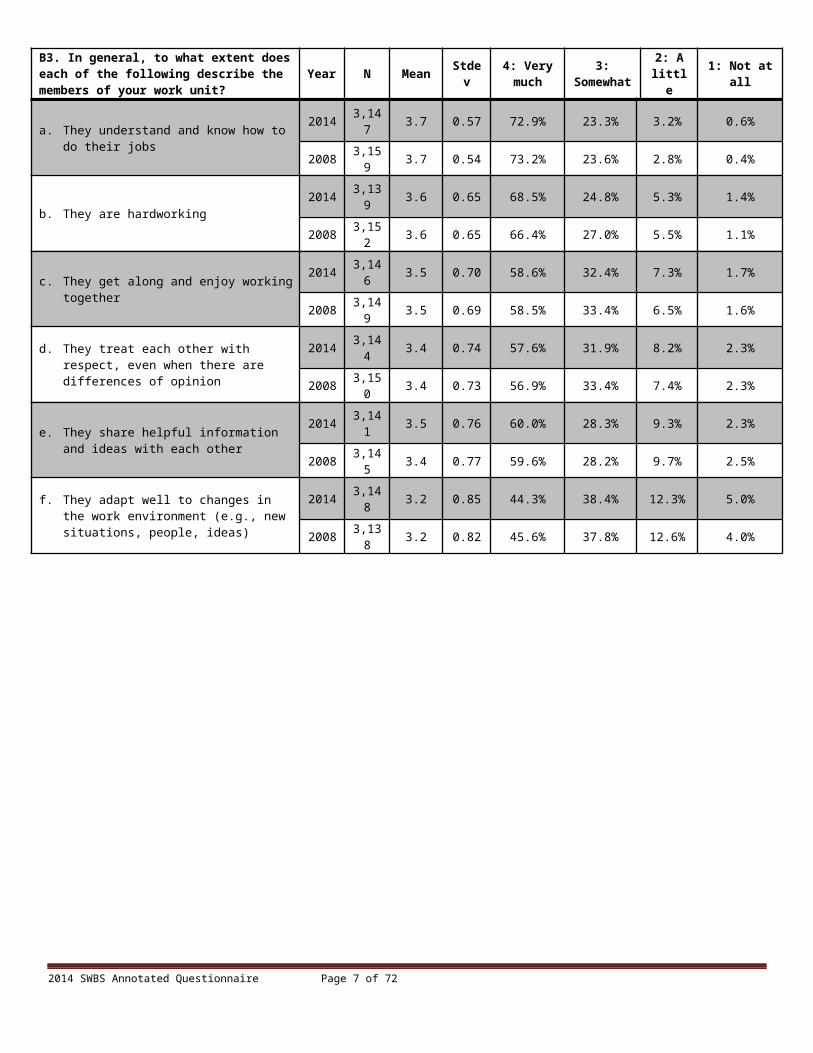
B3. In general, to what extent does each of the following describe the members of your work unit?
Year N Mean Stdev 4: Very much
3: Somewhat
2: A little 1: Not at all
a. They understand and know how to do their jobs
2014 3,147 3.7 0.57 72.9% 23.3% 3.2% 0.6%
2008 3,159 3.7 0.54 73.2% 23.6% 2.8% 0.4%
b. They are hardworking2014 3,139 3.6 0.65 68.5% 24.8% 5.3% 1.4%
2008 3,152 3.6 0.65 66.4% 27.0% 5.5% 1.1%
c. They get along and enjoy working together2014 3,146 3.5 0.70 58.6% 32.4% 7.3% 1.7%
2008 3,149 3.5 0.69 58.5% 33.4% 6.5% 1.6%
d. They treat each other with respect, even when there are differences of opinion
2014 3,144 3.4 0.74 57.6% 31.9% 8.2% 2.3%
2008 3,150 3.4 0.73 56.9% 33.4% 7.4% 2.3%
e. They share helpful information and ideas with each other
2014 3,141 3.5 0.76 60.0% 28.3% 9.3% 2.3%
2008 3,145 3.4 0.77 59.6% 28.2% 9.7% 2.5%
f. They adapt well to changes in the work environment (e.g., new situations, people, ideas)
2014 3,148 3.2 0.85 44.3% 38.4% 12.3% 5.0%
2008 3,138 3.2 0.82 45.6% 37.8% 12.6% 4.0%
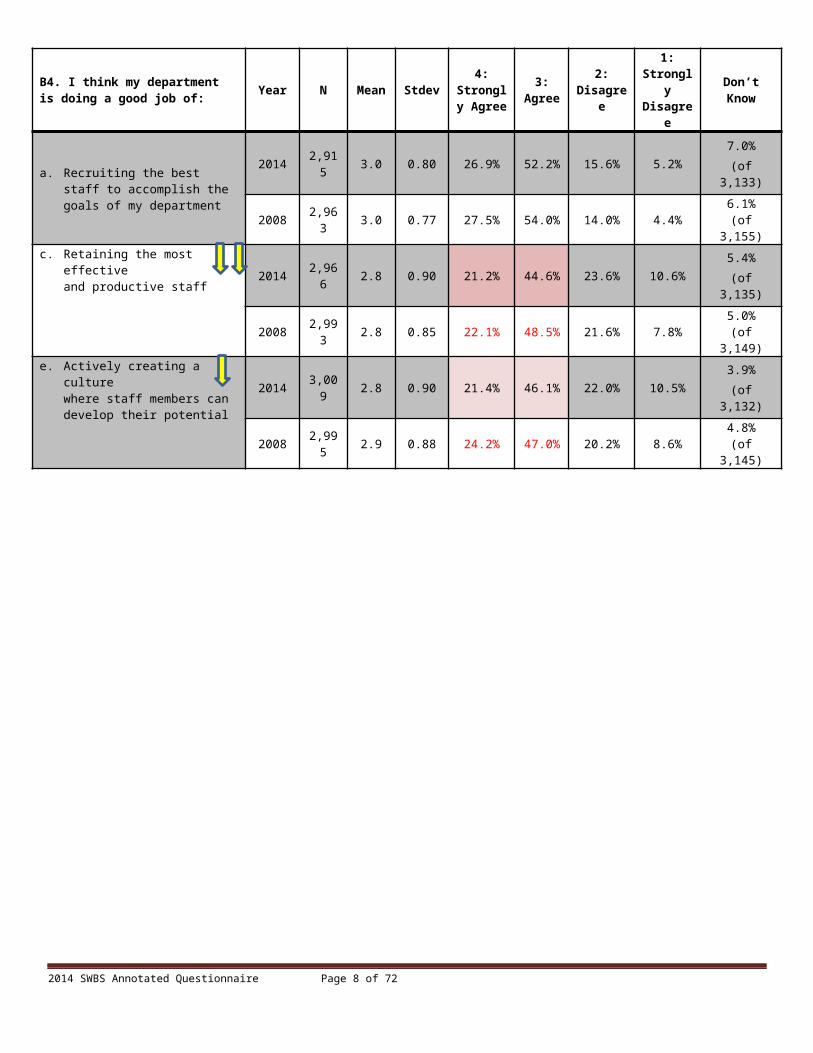
B4. I think my department is doing a good job of: Year N Mean Stdev
4: Strongly
Agree3:
Agree2:
Disagree1:
Strongly Disagree
Don’t Know
a. Recruiting the best staff to accomplish the goals of my department
2014 2,915 3.0 0.80 26.9% 52.2% 15.6% 5.2%7.0%
(of 3,133)
2008 2,963 3.0 0.77 27.5% 54.0% 14.0% 4.4% 6.1%(of 3,155)
c. Retaining the most effectiveand productive staff 2014 2,966 2.8 0.90 21.2% 44.6% 23.6% 10.6%
5.4%(of 3,135)
2008 2,993 2.8 0.85 22.1% 48.5% 21.6% 7.8% 5.0%(of 3,149)
e. Actively creating a culturewhere staff members can develop their potential
2014 3,009 2.8 0.90 21.4% 46.1% 22.0% 10.5%3.9%
(of 3,132)
2008 2,995 2.9 0.88 24.2% 47.0% 20.2% 8.6% 4.8%(of 3,145)
2014 SWBS Annotated Questionnaire Page 7 of 51
B5. How would you rate communication between each of the following?
Year N Mean Stdev
4: Excellent
3: Good 2: Fair 1:
PoorDon’t Know Doesn’t
Apply
a. You and your co-workers in your work unit
2014 3,096 3.2 0.78 37.0% 46.5% 13.2% 3.2%0.1%
(of 3,116)
0.5%(of 3,116)
2008 3,127 3.2 0.76 39.2% 46.8% 10.9% 3.1%0.0%
(of 3,142)
0.4%(of 3,142)
c. Staff in your work unit and staff in the rest of your department
2014 3,015 2.9 0.79 19.2% 53.1% 21.8% 5.8%0.7%
(of 3,110)
2.3%(of 3,110)
2008 3,044 2.9 0.81 20.7% 51.0% 22.1% 6.2%0.8%
(of 3,128)
1.9%(of 3,128)
e. Staff in your departmentand upper administrationin your department
2014 2,916 2.6 0.90 16.0% 44.1% 27.3% 12.6%4.0%
(of 3,108)
2.2%(of 3,108)
2008 2,911 2.7 0.88 17.2% 47.4% 24.4% 11.1%3.9%
(of 3,114)
2.6%(of 3,114)
g. Staff in your departmentand upper administrationin your college/division
2014 2,528 2.5 0.89 11.2% 42.5% 30.1% 16.2%10.7%
(of 3,105)
7.9%(of 3,105)
2008 2,480 2.6 0.88 13.1% 45.4% 28.3% 13.1%11.7%
(of 3,106)
8.5%(of 3,106)
i. Staff at NC State University as a whole and the upper administration in theuniversity
2014 2,372 2.5 0.85 8.8% 42.4% 34.3% 14.5%16.8%
(of 3,098)
6.6%(of 3,098)
2008 2,234 2.6 0.84 11.3% 45.1% 31.6% 12.0%18.6%
(of 3,104)
9.5%(of 3,104)
k. Staff in your department and your customers/clients
2014 2,820 3.2 0.69 30.6% 56.5% 10.9% 2.1%2.3%
(of 3,107)
7.0%(of 3,107)
2008 2,837 3.2 0.67 30.9% 57.0% 10.5% 1.6%2.2%
(of 3,112)
6.6%(of 3,112)
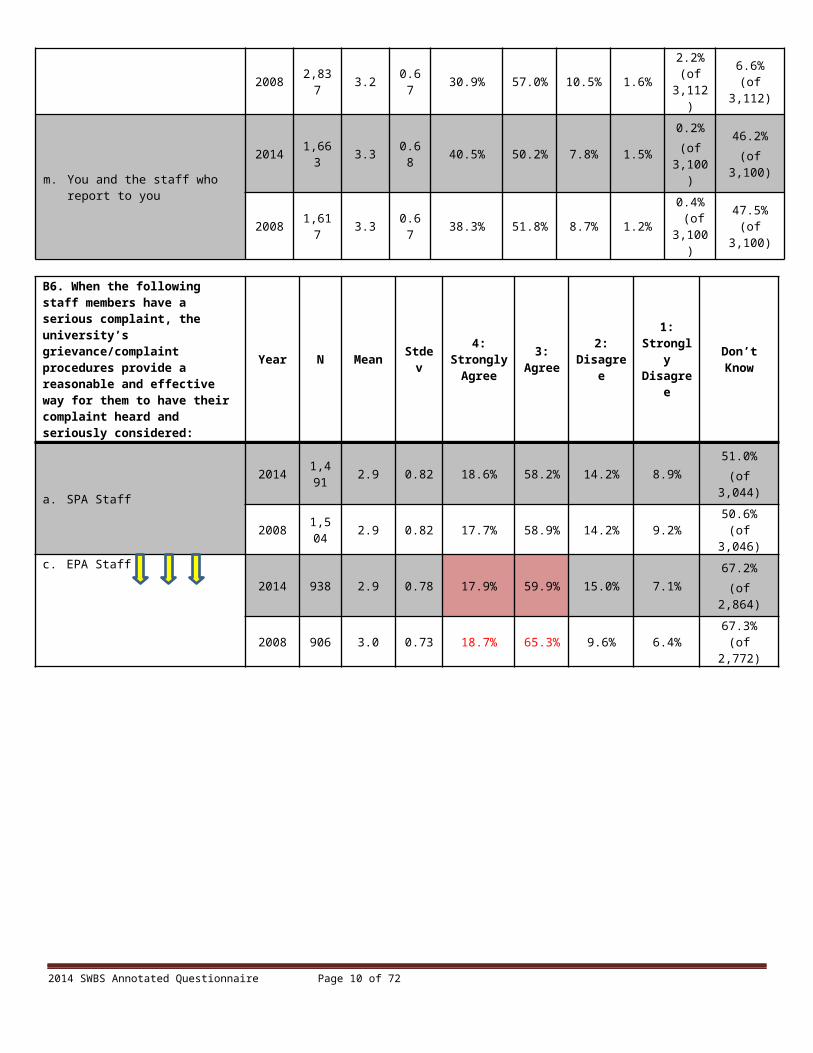
m. You and the staff who report to you
2014 1,663 3.3 0.68 40.5% 50.2% 7.8% 1.5%0.2%
(of 3,100)
46.2%(of 3,100)
2008 1,617 3.3 0.67 38.3% 51.8% 8.7% 1.2%0.4% (of
3,100)
47.5%(of 3,100)
2014 SWBS Annotated Questionnaire Page 8 of 51

B6. When the following staff members have a serious complaint, the university’s grievance/complaint procedures provide a reasonable and effective way for them to have their complaint heard and seriously considered:
Year N Mean Stdev4:
Strongly Agree
3: Agree
2: Disagree
1: Strongly Disagree
Don’t Know
a. SPA Staff2014 1,49
1 2.9 0.82 18.6% 58.2% 14.2% 8.9%51.0%
(of 3,044)
2008 1,504 2.9 0.82 17.7% 58.9% 14.2% 9.2% 50.6%
(of 3,046)c. EPA Staff
2014 938 2.9 0.78 17.9% 59.9% 15.0% 7.1%67.2%
(of 2,864)
2008 906 3.0 0.73 18.7% 65.3% 9.6% 6.4% 67.3%(of 2,772)
2014 SWBS Annotated Questionnaire Page 9 of 51
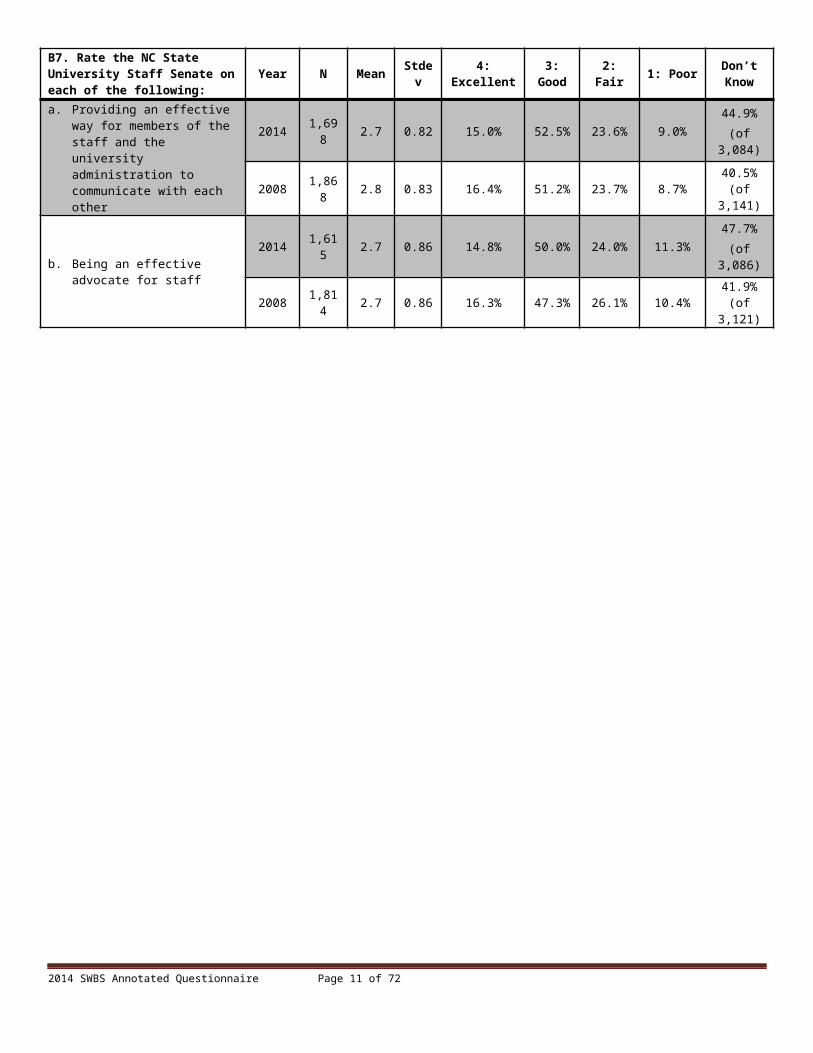
B7. Rate the NC State University Staff Senate on each of the following:
Year N Mean Stdev 4: Excellent 3: Good 2: Fair 1: Poor Don’t
Know
a. Providing an effective way for members of the staff and the university administration to communicate with each other
2014 1,698 2.7 0.82 15.0% 52.5% 23.6% 9.0%44.9%
(of 3,084)
2008 1,868 2.8 0.83 16.4% 51.2% 23.7% 8.7% 40.5%(of 3,141)
b. Being an effective advocate for staff
2014 1,615 2.7 0.86 14.8% 50.0% 24.0% 11.3%47.7%
(of 3,086)
2008 1,814 2.7 0.86 16.3% 47.3% 26.1% 10.4% 41.9%(of 3,121)
2014 SWBS Annotated Questionnaire Page 10 of 51
Section C: LeadershipC1. In your opinion, how well does your immediate supervisor do each of the following with/for your work unit?
Year N Mean Stdev 4: Excellent
3: Good 2: Fair 1: Poor Don’t
Know
a. Listen to staff in your work unit2014 3,032 3.2 0.91 45.5% 33.9% 14.1% 6.5%
0.4%(of 3,043)
2008 3,067 3.2 0.89 44.2% 36.1% 13.5% 6.2% 0.7%(of 3,088)
b. Give a straight answer when asked a reasonable question
2014 3,033 3.1 0.97 44.0% 31.8% 14.9% 9.2%0.4%
(of 3,044)
2008 3,067 3.1 0.94 41.1% 36.2% 14.1% 8.6% 0.4%(of 3,079)
c. Use ideas from staff in his/her decision-making
2014 2,976 3.1 0.91 41.9% 35.5% 15.8% 6.8%2.1%
(of 3,040)
2008 2,981 3.1 0.91 38.3% 39.1% 15.2% 7.3% 2.9%(of 3,071)
d. Appropriately distribute work assignments to members of your work unit
2014 2,944 3.0 0.96 36.7% 36.8% 17.1% 9.4%3.0%
(of 3,035)
2008 2,960 3.0 0.90 33.8% 41.0% 17.6% 7.6% 3.5%(of 3,066)
e. Treat all members of the work unit consistently (i.e., does not show favoritism)
2014 2,991 3.0 1.04 41.3% 31.0% 14.3% 13.3%1.6%
(of 3,039)
2008 3,020 3.0 1.02 39.9% 33.2% 14.6% 12.4%1.9% (of
3,079)
f. Encourage teamwork in your work unit whenever possible
2014 2,991 3.2 0.93 46.1% 32.6% 13.9% 7.4%1.5%
(of 3,036)
2008 3,013 3.1 0.92 40.8% 37.6% 13.8% 7.7% 1.9%(of 3,072)
g. Set short- and long-term goals and objectives for your work unit
2014 2,928 2.9 1.00 34.6% 34.5% 19.1% 11.7%3.6%
(of 3,036)
2008 2,958 2.9 0.96 31.4% 39.8% 18.3% 10.6% 3.7%(of 3,071)
h. Set appropriate goals that are reachable
2014 2,936 3.0 0.91 34.8% 40.4% 16.9% 7.9%3.1%
(of 3,030)
2008 2,937 3.0 0.91 32.2% 42.4% 16.9% 8.5% 3.9%(of 3,057)
i. Set clear priorities for your work unit2014 2,984 2.9 0.96 32.6% 38.3% 18.7% 10.5%
1.6%(of 3,033)
2008 2,992 2.9 0.95 31.2% 40.5% 18.0% 10.3% 2.4%(of 3,067)
j. Resolve internal conflicts in your work unit quickly and effectively
2014 2,754 2.8 1.05 32.0% 32.9% 19.3% 15.8%9.0%
(of 3,028)
2008 2,759 2.8 0.99 27.2% 38.5% 20.8% 13.5% 10.2%(of 3,073)
k. Provide the essential resources your work unit needs to do its job
2014 2,995 3.1 0.88 40.1% 39.1% 14.7% 6.2%1.1%
(of 3,029)
2008 3,025 3.1 0.86 38.7% 41.5% 14.2% 5.5% 1.3%(of 3,066)
2014 SWBS Annotated Questionnaire Page 11 of 51
C1. In your opinion, how well does your immediate supervisor do each of the following with/for your work unit? (continued)
Year N Mean Stdev 4: Excellent
3: Good 2: Fair 1: Poor Don’t
Know
l. Distribute resources to your work unit in a way that is understandable and justifiable
2014 2,923 3.1 0.88 38.8% 40.6% 14.0% 6.6%3.6%
(of 3,033)
2008 2,979 3.1 0.84 35.1% 45.3% 14.0% 5.6% 2.7%(of 3,063)
m. Appreciate the role your contributions play in the success of the work unit
2014 3,012 3.2 0.95 46.6% 32.3% 12.6% 8.5%0.8%
(of 3,036)
2008 3,022 3.2 0.93 44.6% 34.8% 12.7% 7.9% 1.5%(of 3,068)
n. Serve as an advocate for your work unit within your department
2014 2,942 3.2 0.96 46.6% 32.6% 11.8% 8.9%3.0%
(of 3,032)
2008 2,926 3.1 0.94 44.2% 34.6% 13.0% 8.2% 4.2%(of 3,053)
o. Make rational, understandable decisions
2014 3,012 3.1 0.92 40.3% 36.6% 15.5% 7.6%0.8%
(of 3,035)
2008 3,012 3.1 0.89 37.1% 40.7% 15.1% 7.0% 1.6%(of 3,062)
p. Be supportive of staff members when personal issues arise
2014 2,975 3.4 0.85 57.6% 28.3% 9.1% 4.9%2.2%
(of 3,043)
2008 2,976 3.3 0.85 53.1% 32.1% 9.6% 5.2% 3.0%(of 3,067)
q. Be approachable and easy to talk to2014 3,037 3.3 0.91 54.3% 27.6% 11.9% 6.3%
0.2%(of 3,043)
2008 3,051 3.3 0.90 51.8% 30.3% 11.8% 6.1% 0.6%(of 3,068)
r. Be available when you need him/her
2014 3,033 3.2 0.90 49.9% 31.1% 13.0% 6.0%0.4%
(of 3,044)
2008 3,048 3.2 0.90 45.7% 34.1% 14.2% 6.0% 0.5%(of 3,063)
s. Set a good example for the staff through his/her own work habits, professionalism, and high standards
2014 3,025 3.2 0.98 50.6% 28.7% 11.2% 9.6%0.5%
(of 3,041)
2008 NA NA NA NA NA NA NA NA
C2. Staff management styles and expectations for job performance vary greatly in my department, depending on who one has as a direct supervisor:
2014(N = 2,409)Mean = 3.0
Stdev = 0.82
2008(N = 2,437)Mean = 3.1
Stdev = 0.82
4: Strongly Agree 31.4% 32.9%
3: Agree 44.2% 45.1%
2: Disagree 20.3% 18.0%
1: Strongly Disagree 4.1% 4.0%
Don’t Know 11.4% (of 3,019) 10.7% (of 3,042)
Doesn’t Apply 8.8% (of 3,019) 9.1% (of 3,042)
2014 SWBS Annotated Questionnaire Page 12 of 51

C3. In your opinion, how well does the upper administration in your department do each of the following for/with your department as a whole:
Year N Mean Stdev 4: Excellent
3: Good 2: Fair 1: Poor Don’t
Know
a. Listen to staff in the department2014 2,726 2.8 0.94 24.1% 41.6% 22.4% 11.8%
7.9%(of 2,959)
2008 2,780 2.8 0.91 22.4% 45.1% 21.7% 10.8% 9.0%(of 3,055)
b. Give a straight answer when asked a reasonable question
2014 2,724 2.7 0.98 24.1% 39.6% 22.2% 14.1%7.9%
(of 2,959)
2008 2,779 2.8 0.93 21.9% 43.6% 22.7% 11.8% 8.9%(of 3,050)
c. Use ideas from staff in his/her decision-making
2014 2,504 2.7 0.95 22.2% 40.7% 23.9% 13.2%15.2%
(of 2,952)
2008 2,570 2.7 0.92 19.6% 44.3% 24.0% 12.1% 15.6%(of 3,044)
d. Treat all members of the department consistently (i.e., does not show favoritism)
2014 2,585 2.7 1.03 25.1% 37.1% 20.0% 17.8%12.5%
(of 2,953)
2008 2,656 2.7 1.00 22.8% 40.5% 20.0% 16.8% 12.8%(of 3,047)
e. Encourage teamwork in your department whenever possible
2014 2,653 3.0 0.91 31.0% 41.9% 18.8% 8.3%10.1%
(of 2,952)
2008 2,704 2.9 0.90 26.0% 46.1% 18.7% 9.2% 11.2%(of 3,044)
f. Set short-term and long-term goals and objectives for the department
2014 2,492 2.8 0.95 25.1% 41.5% 21.3% 12.1%15.4%
(of 2,946)
2008 2,536 2.8 0.89 22.6% 46.5% 21.1% 9.8% 16.3%(of 3,030)
g. Set appropriate goals that are reachable
2014 2,469 2.8 0.89 22.5% 46.7% 21.1% 9.8%16.0%
(of 2,939)
2008 2,534 2.8 0.89 22.3% 46.7% 21.5% 9.6% 16.5%(of 3,036)
h. Set clear priorities for the department 2014 2,556 2.8 0.94 23.2% 43.2% 21.1% 12.5%
13.3%(of 2,948)
2008 2,641 2.8 0.87 21.5% 48.7% 20.8% 9.0% 13.1%(of 3,039)
i. Resolve internal conflicts in your work unit quickly and effectively
2014 2,276 2.6 1.02 20.3% 37.5% 22.9% 19.3%22.9%
(of 2,952)
2008 2,358 2.6 0.97 17.8% 40.5% 24.4% 17.2% 22.4%(of 3,039)
j. Provide the essential resources your work unit needs to do its job
2014 2,665 2.9 0.91 26.2% 43.7% 20.6% 9.5%9.6%
(of 2,949)
2008 2,747 2.8 0.88 23.4% 46.9% 21.0% 8.8% 9.1%(of 3,023)
k. Distribute resources to your work unit in a way that is understandable and justifiable
2014 2,561 2.8 0.92 25.3% 42.8% 21.5% 10.3%13.2%
(of 2,951)
2008 2,656 2.8 0.89 21.2% 47.2% 21.6% 10.0% 12.4%(of 3,032)
2014 SWBS Annotated Questionnaire Page 13 of 51

C3. In your opinion, how well does the upper administration in your department do each of the following for/with your department as a whole:(continued)
Year N Mean Stdev 4: Excellent
3: Good 2: Fair 1: Poor Don’t
Know
l. Appreciate the role your contributions play in the success of the work unit
2014 2,651 2.9 0.99 30.1% 38.8% 17.9% 13.2%10.0%
(of 2,946)
2008 2,711 2.8 0.95 26.7% 42.0% 19.9% 11.4% 10.4%(of 3,027)
m. Serve as an advocate for your department to the college/division
2014 2,485 3.0 0.95 35.6% 39.3% 15.5% 9.7%15.7%
(of 2,948)
2008 2,502 3.0 0.90 30.2% 44.4% 16.8% 8.6% 17.1%(of 3,019)
n. Make rational, understandable decisions
2014 2,634 2.8 0.93 26.5% 42.5% 20.5% 10.6%10.7%
(of 2,949)
2008 2,653 2.8 0.89 22.5% 46.8% 20.8% 9.9% 12.1%(of 3,017)
o. Be approachable if/when your immediate supervisor is not responding to your needs
2014 2,363 2.9 0.96 30.9% 40.0% 17.9% 11.2%19.8%
(of 2,946)
2008 2,334 2.9 0.94 27.6% 44.2% 17.0% 11.2% 22.1%(of 2,995)
p. Set a good example for the staff through his/her own work habits, professionalism, and high standards
2014 2,657 3.0 0.91 35.2% 41.4% 15.2% 8.1%10.0%
(of 2,951)
2008 NA NA NA NA NA NA NA NA
C4. Overall, how well does the upper administration at NC State (e.g., Chancellor, Provost, Vice Chancellors, Vice Provosts) do each of the following:
Year N Mean Stdev 4: Excellent 3: Good 2: Fair 1: Poor Don’t
Know
a. Listen to ideas from staff2014 1,471 2.7 0.88 16.5% 47.6% 24.1% 11.9%
50.4%(of 2,964)
2008 1,494 2.7 0.89 16.7% 45.9% 25.9% 11.6% 51.0%(of 3,048)
b. Give a straight answer when asked a reasonable question
2014 1,543 2.6 0.91 15.9% 45.6% 24.3% 14.2%47.8%
(of 2,958)
2008 1,552 2.6 0.88 14.8% 45.9% 27.0% 12.4% 49.0%(of 3,043)
c. Establish clear prioritiesfor the university 2014 1,939 2.9 0.80 23.5% 52.3% 18.4% 5.8%
34.4%(of 2,954)
2008 1,874 2.9 0.79 19.7% 53.0% 21.7% 5.6% 38.3%(of 3,035)
d. Distribute resources in a way that is understandable and justifiable
2014 1,719 2.6 0.90 14.7% 46.4% 24.7% 14.2%41.9%
(of 2,958)
2008 1,720 2.6 0.88 13.7% 45.1% 28.5% 12.7% 43.3%(of 3,036)
e. Serve as an advocate forthe university to external customers
2014 1,716 3.2 0.79 36.6% 47.4% 12.1% 4.0%42.0%
(of 2,961)
2008 1,663 3.0 0.80 28.8% 50.9% 15.5% 4.8% 45.1%(of 3,030)
2014 SWBS Annotated Questionnaire Page 14 of 51

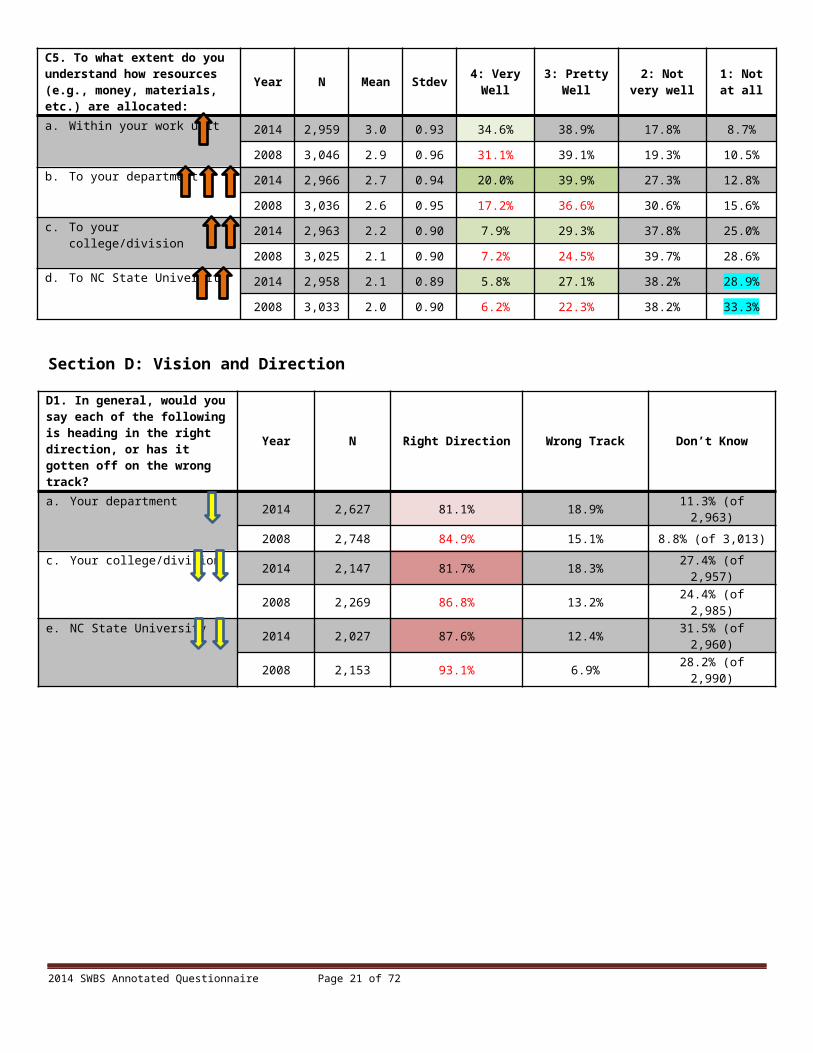
C5. To what extent do you understand how resources (e.g., money, materials, etc.) are allocated:
Year N Mean Stdev 4: Very Well
3: Pretty Well
2: Not very well
1: Not at all
a. Within your work unit 2014 2,959 3.0 0.93 34.6% 38.9% 17.8% 8.7%
2008 3,046 2.9 0.96 31.1% 39.1% 19.3% 10.5%
b. To your department 2014 2,966 2.7 0.94 20.0% 39.9% 27.3% 12.8%
2008 3,036 2.6 0.95 17.2% 36.6% 30.6% 15.6%c. To your college/division 2014 2,963 2.2 0.90 7.9% 29.3% 37.8% 25.0%
2008 3,025 2.1 0.90 7.2% 24.5% 39.7% 28.6%d. To NC State University 2014 2,958 2.1 0.89 5.8% 27.1% 38.2% 28.9%
2008 3,033 2.0 0.90 6.2% 22.3% 38.2% 33.3%
Section D: Vision and Direction
D1. In general, would you say each of the following is heading in the right direction, or has it gotten off on the wrong track?
Year N Right Direction Wrong Track Don’t Know
a. Your department 2014 2,627 81.1% 18.9% 11.3% (of 2,963)
2008 2,748 84.9% 15.1% 8.8% (of 3,013)c. Your college/division 2014 2,147 81.7% 18.3% 27.4% (of 2,957)
2008 2,269 86.8% 13.2% 24.4% (of 2,985)e. NC State University 2014 2,027 87.6% 12.4% 31.5% (of 2,960)
2008 2,153 93.1% 6.9% 28.2% (of 2,990)
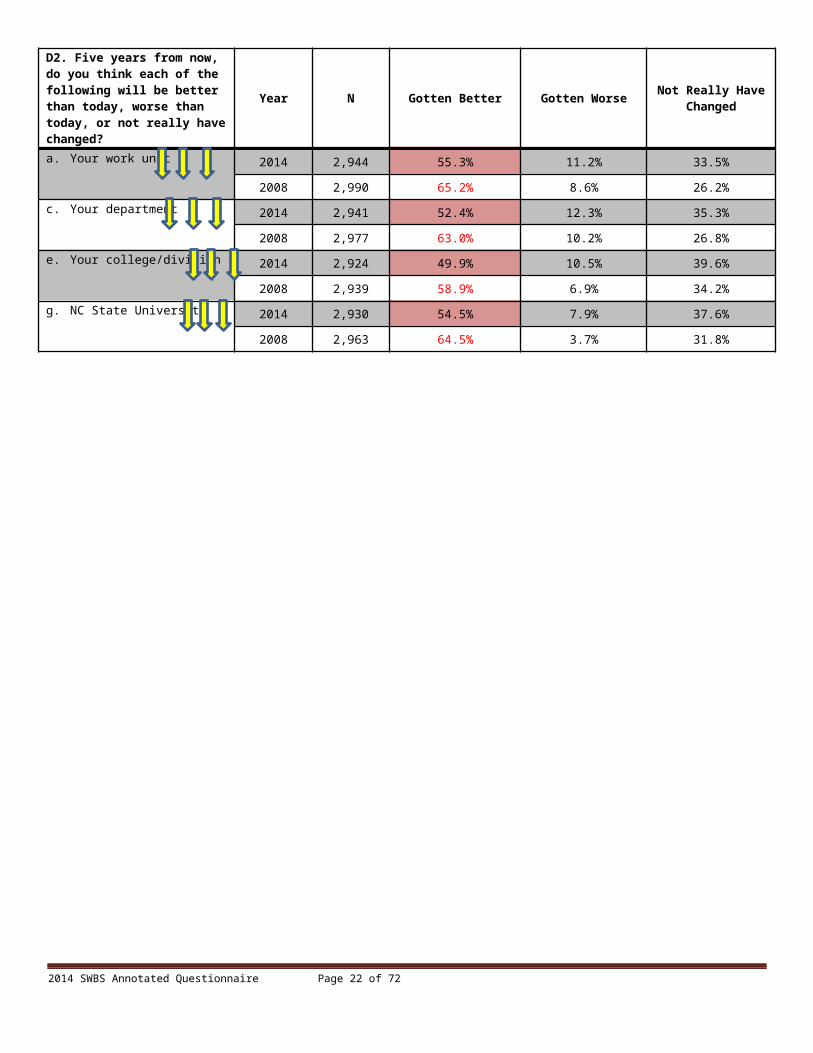
D2. Five years from now, do you think each of the following will be better than today, worse than today, or not really have changed?
Year N Gotten Better Gotten Worse Not Really Have Changed
a. Your work unit 2014 2,944 55.3% 11.2% 33.5%
2008 2,990 65.2% 8.6% 26.2%c. Your department 2014 2,941 52.4% 12.3% 35.3%
2008 2,977 63.0% 10.2% 26.8%e. Your college/division 2014 2,924 49.9% 10.5% 39.6%
2008 2,939 58.9% 6.9% 34.2%g. NC State University 2014 2,930 54.5% 7.9% 37.6%
2008 2,963 64.5% 3.7% 31.8%
2014 SWBS Annotated Questionnaire Page 15 of 51

D3. In general, how successful do you think your department is in meeting its goals?
2014(N = 2,777)Mean = 3.3
Stdev = 0.66
2008(N=2,821)Mean=3.3
Stdev=0.63
4: Very successful 42.8% 40.6%
3: Somewhat successful 49.3% 52.9%
2: Not very successful 6.6% 5.4%
1: Not at all successful 1.4% 1.2%
Don't know 6.0% (of 2,953) 6.4% (of 3,014)
D4. Which of the following statements best describes your departments' goals for the future?*
2014(N = 2,488)
2008(N = 2,579)
a. My department has a clear set of goals for the future, and we are actively working toward meeting those goals. 50.9% 49.3%
b. My department has set goals for the future, but progress seems slow 33.2% 37.6%
My department doesn't appear to have a clear set of goals for the future 15.9% 13.1%
d. I don't know enough to say 15.4% (of 2,940) 13.8% (of 2,992)* 2008 wording was, “Which of the following statements best describes your department’s vision for the future”.
D5. To what extent is your job description/work plan consistent with the goals of the department?*
2014(N = 2,026)Mean = 3.6
Stdev = 0.64
2008(N = 2,134)Mean = 3.5
Stdev = 0.65
e. 4: Very much 62.4% 59.0%
3: Somewhat 31.2% 34.8%
g. 2: A little 5.4% 4.9%
h. 1: Not at all 1.0% 1.3%
Don’t know 2.0% (of 2,090) 3.6% (of 2,230)
Do not have a job description/work plan 1.1% (of 2,090) 0.7% (of 2,230)*2008 wording was, “To what extent is your job description/work plan consistent with your department’s vision”.
2014 SWBS Annotated Questionnaire Page 16 of 51

Section E: Diversity and MulticulturalismE1. The work environment in my department is accepting and respectful of differences in:
Year N Mean Stdev4:
Strongly Agree
3: Agree
2: Disagree
1: Strongly Disagree
Don’t Know
a. Age2014 2,862 3.4 0.65 51.4% 43.0% 4.2% 1.4%
2.4%(of 2,932)
2008 2,897 3.4 0.64 48.4% 45.9% 4.2% 1.4% 2.9%(of 2,984)
c. Disability status2014 2,527 3.5 0.60 52.4% 44.2% 2.4% 0.9%
13.8%(of 2,930)
2008 2,535 3.4 0.62 48.6% 46.7% 3.4% 1.3% 14.6%(of 2,967)
e. Gender2014 2,838 3.5 0.63 51.8% 43.1% 3.8% 1.3%
3.2%(of 2,933)
2008 ,828 3.4 0.62 47.7% 47.1% 4.2% 1.0% 4.4%(of 2,958)
g. Military/Veteran status2014 2,272 3.5 0.54 55.7% 42.8% 1.0% 0.4%
22.4%(of 2,926)
2008 2,328 3.5 0.56 51.1% 47.0% 1.1% 0.7% 21.3%(of 2,957)
i. Nationality/Ethnic origin2014 2,764 3.5 0.61 52.8% 43.2% 2.9% 1.1%
5.8%(of 2,933)
2008 2,760 3.4 0.61 48.9% 47.0% 3.1% 1.0% 6.9%(of 2,964)
k. Race and color2014 2,809 3.5 0.64 52.5% 42.2% 4.0% 1.3%
4.1%(of 2,930)
2008 2,837 3.4 0.64 48.8% 46.1% 3.6% 1.5% 4.7%(of 2,977)
m. Religion2014 2,620 3.5 0.61 51.9% 43.9% 3.0% 1.1%
10.7%(of 2,933)
2008 2,642 3.4 0.63 47.5% 47.5% 3.5% 1.5% 11.1%(of 2,973)
o. Sexual orientation2014 2,496 3.5 0.61 52.4% 44.2% 2.1% 1.2%
14.8%(of 2,931)
2008 ,407 3.4 0.66 48.0% 45.7% 4.5% 1.8% 18.9%(of 2,968)
q. Gender Identity2014 2,278 3.5 0.61 51.4% 45.2% 2.1% 1.3%
22.2%(of 2,927)
2008 NA NA NA NA NA NA NA NA
2014 SWBS Annotated Questionnaire Page 17 of 51

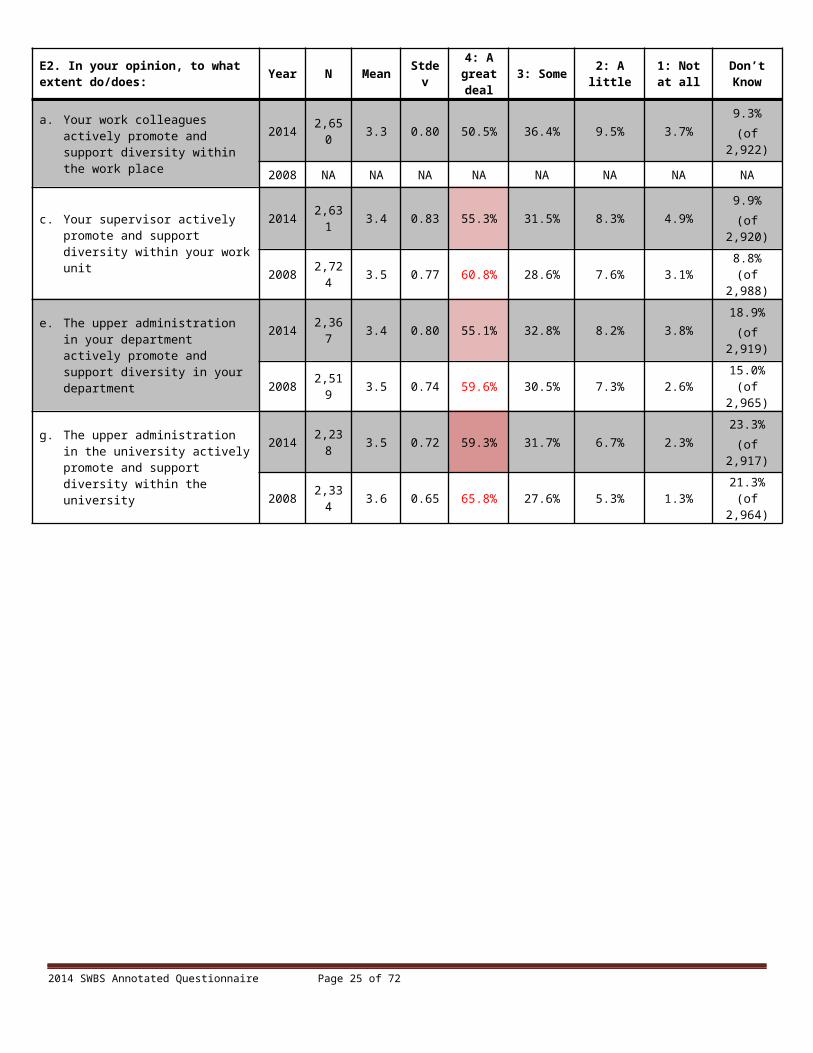
E2. In your opinion, to what extent do/does: Year N Mean Stdev
4: A great deal
3: Some 2: A little 1: Not at all
Don’t Know
a. Your work colleagues actively promote and support diversity within the work place
2014 2,650 3.3 0.80 50.5% 36.4% 9.5% 3.7%9.3%
(of 2,922)
2008 NA NA NA NA NA NA NA NA
c. Your supervisor actively promote and support diversity within your work unit
2014 2,631 3.4 0.83 55.3% 31.5% 8.3% 4.9%9.9%
(of 2,920)
2008 2,724 3.5 0.77 60.8% 28.6% 7.6% 3.1% 8.8%(of 2,988)
e. The upper administration in your department actively promote and support diversity in your department
2014 2,367 3.4 0.80 55.1% 32.8% 8.2% 3.8%18.9%
(of 2,919)
2008 2,519 3.5 0.74 59.6% 30.5% 7.3% 2.6% 15.0%(of 2,965)
g. The upper administration in the university actively promote and support diversity within the university
2014 2,238 3.5 0.72 59.3% 31.7% 6.7% 2.3%23.3%
(of 2,917)
2008 2,334 3.6 0.65 65.8% 27.6% 5.3% 1.3% 21.3%(of 2,964)
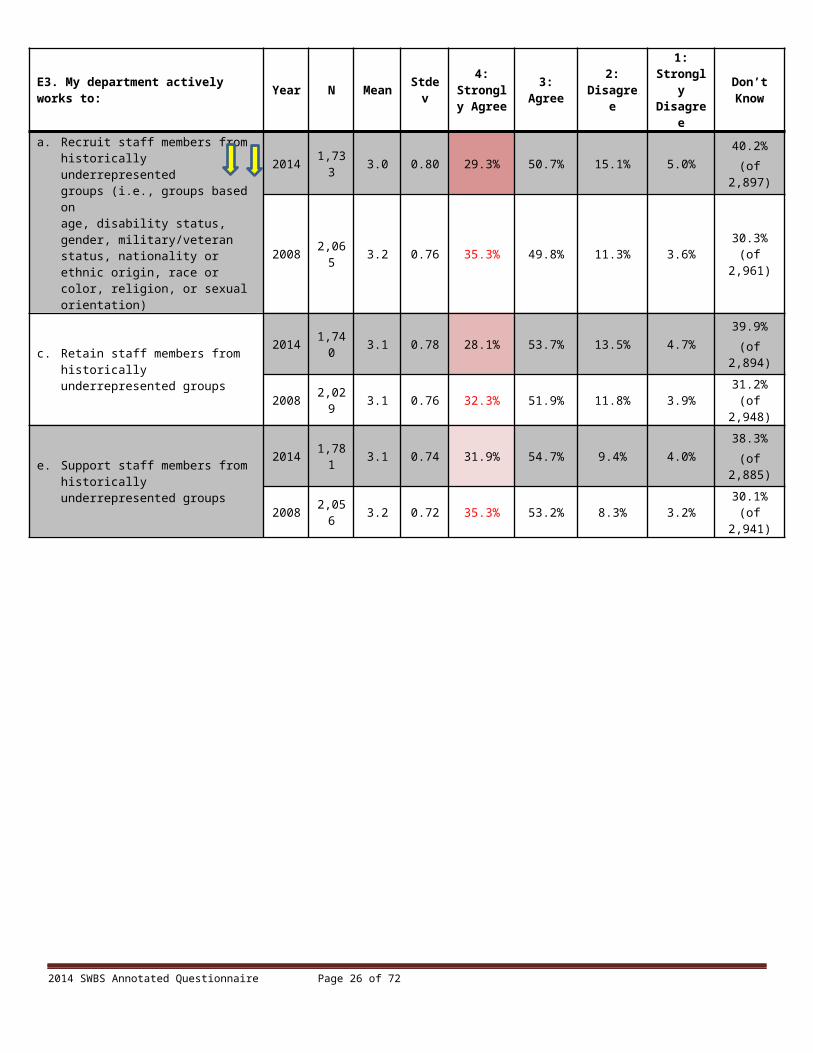
E3. My department actively works to: Year N Mean Stdev4:
Strongly Agree
3: Agree 2: Disagree
1: Strongly Disagree
Don’t Know
a. Recruit staff members from historically underrepresentedgroups (i.e., groups based onage, disability status, gender, military/veteran status, nationality or ethnic origin, race or color, religion, or sexual orientation)
2014 1,733 3.0 0.80 29.3% 50.7% 15.1% 5.0%40.2%
(of 2,897)
2008 2,065 3.2 0.76 35.3% 49.8% 11.3% 3.6% 30.3%(of 2,961)
c. Retain staff members from historically underrepresented groups
2014 1,740 3.1 0.78 28.1% 53.7% 13.5% 4.7%39.9%
(of 2,894)
2008 2,029 3.1 0.76 32.3% 51.9% 11.8% 3.9% 31.2%(of 2,948)
e. Support staff members from historically underrepresented groups
2014 1,781 3.1 0.74 31.9% 54.7% 9.4% 4.0%38.3%
(of 2,885)
2008 2,056 3.2 0.72 35.3% 53.2% 8.3% 3.2% 30.1%(of 2,941)
2014 SWBS Annotated Questionnaire Page 18 of 51

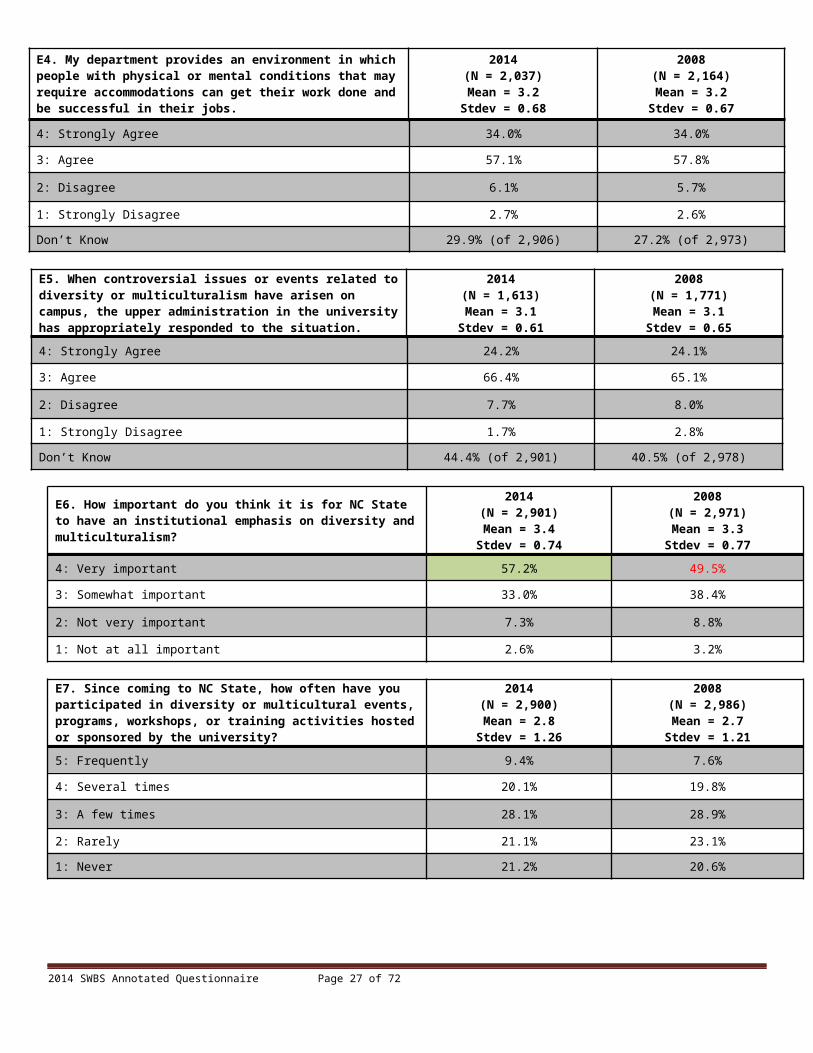
E4. My department provides an environment in which people with physical or mental conditions that may require accommodations can get their work done and be successful in their jobs.
2014(N = 2,037)Mean = 3.2
Stdev = 0.68
2008(N = 2,164)Mean = 3.2
Stdev = 0.67
4: Strongly Agree 34.0% 34.0%
3: Agree 57.1% 57.8%
2: Disagree 6.1% 5.7%
1: Strongly Disagree 2.7% 2.6%
Don’t Know 29.9% (of 2,906) 27.2% (of 2,973)
E5. When controversial issues or events related to diversity or multiculturalism have arisen on campus, the upper administration in the university has appropriately responded to the situation.
2014(N = 1,613)Mean = 3.1
Stdev = 0.61
2008(N = 1,771)Mean = 3.1
Stdev = 0.65
4: Strongly Agree 24.2% 24.1%
3: Agree 66.4% 65.1%
2: Disagree 7.7% 8.0%
1: Strongly Disagree 1.7% 2.8%
Don’t Know 44.4% (of 2,901) 40.5% (of 2,978)
E6. How important do you think it is for NC State to have an institutional emphasis on diversity and multiculturalism?
2014(N = 2,901)Mean = 3.4
Stdev = 0.74
2008(N = 2,971)Mean = 3.3
Stdev = 0.77
4: Very important 57.2% 49.5%
3: Somewhat important 33.0% 38.4%
2: Not very important 7.3% 8.8%
1: Not at all important 2.6% 3.2%
E7. Since coming to NC State, how often have you participated in diversity or multicultural events, programs, workshops, or training activities hosted or sponsored by the university?
2014(N = 2,900)Mean = 2.8
Stdev = 1.26
2008(N = 2,986)Mean = 2.7
Stdev = 1.21
5: Frequently 9.4% 7.6%
4: Several times 20.1% 19.8%
3: A few times 28.1% 28.9%
2: Rarely 21.1% 23.1%
1: Never 21.2% 20.6%
2014 SWBS Annotated Questionnaire Page 19 of 51

E8. Why have you not participated in diversity/multicultural activities at NC State University more often? (mark all that apply)
2014(N=1,228)
2008(N=1,305)
a. Not aware of activities 41.5% 41.2%
b. Not convenient (e.g., schedule, location) 48.8% 48.6%
c. Not interested in participation 32.1% 34.3%
d. Supervisor does not allow me to participate during work hours 4.1% 5.4%
e. Other (please briefly explain): 14.5% NA
E9. To what extent have language barriers made it difficult for you to function to your best ability in your job at NC State?
2014(N = 2,889)Mean = 1.4
Stdev = 0.63
2008(N = 2,981)Mean = 1.5
Stdev = 0.73
4: A great deal 0.9% 1.8%
3: Somewhat 5.7% 9.0%
2: A little 22.1% 24.1%
1: Not at all 71.3% 65.1%
E10. In the above question you responded ‘somewhat’ or ‘a great deal.’ Is that primarily because of:
2014(N = 189)
2008(N =312)
Your own ability to understand, speak and/or read English 9.1% 9.0%
The ability of others to understand, speak and/or read English 90.9% 91.0%
Section F: Work Activities
F1. Do you have a formal job description for your position? 2014(N = 2,770)
2008(N = 2,819)
Yes 94.4% 94.1%
No 5.6% 5.9%
Don’t know 4.0% (of 2,885) 4.5% (of 2,952)
F2. To what extent do the actual tasks or assignments you do for NC State on a day-to-day basis match what is outlined in the job description for your position?
2014(N = 2,878)Mean = 3.4
Stdev = 0.67
2008(N = 2,959)Mean = 3.4Stdev = 0.67
4: Very closely 50.4% 50.8%
3: Fairly closely 41.5% 40.8%
2: Not very closely 6.9% 7.4%
1: Not at all 1.3% 1.0%
2014 SWBS Annotated Questionnaire Page 20 of 51
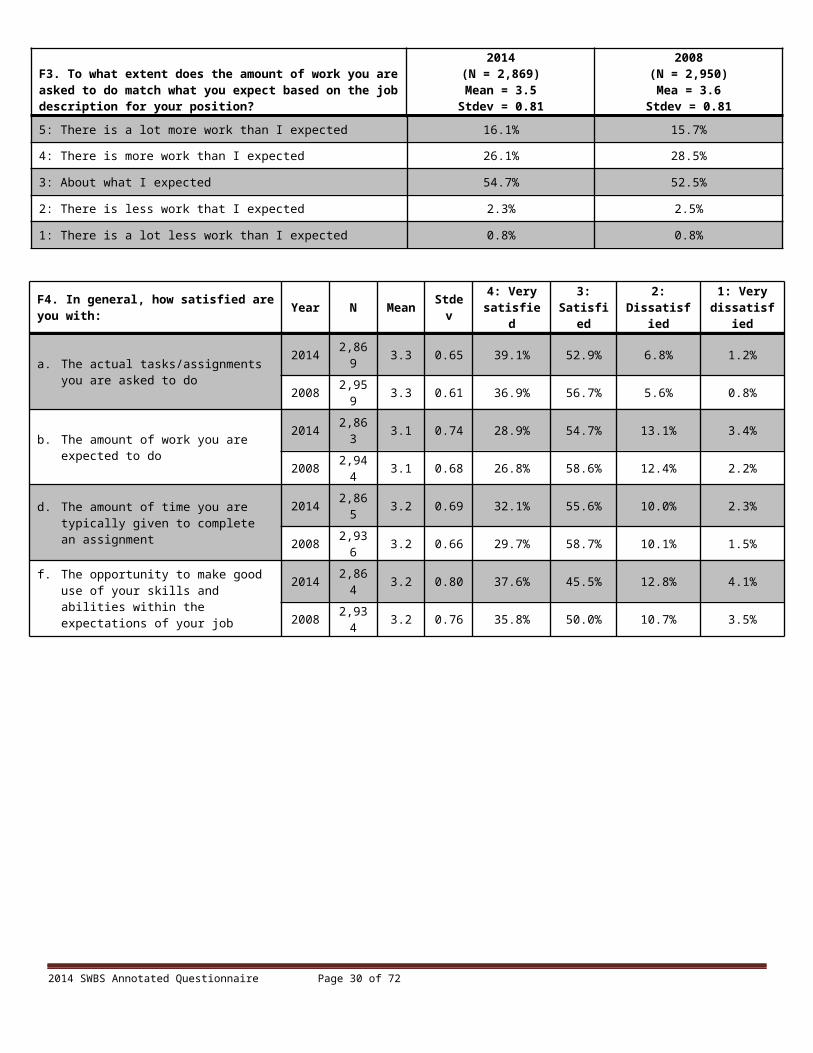
F3. To what extent does the amount of work you are asked to do match what you expect based on the job description for your position?
2014(N = 2,869)Mean = 3.5
Stdev = 0.81
2008(N = 2,950)Mea = 3.6
Stdev = 0.81
5: There is a lot more work than I expected 16.1% 15.7%
4: There is more work than I expected 26.1% 28.5%
3: About what I expected 54.7% 52.5%
2: There is less work that I expected 2.3% 2.5%
1: There is a lot less work than I expected 0.8% 0.8%
F4. In general, how satisfied are you with: Year N Mean Stdev 4: Very satisfied
3: Satisfied
2: Dissatisfied
1: Very dissatisfied
a. The actual tasks/assignments you are asked to do
2014 2,869 3.3 0.65 39.1% 52.9% 6.8% 1.2%
2008 2,959 3.3 0.61 36.9% 56.7% 5.6% 0.8%
b. The amount of work you are expected to do
2014 2,863 3.1 0.74 28.9% 54.7% 13.1% 3.4%
2008 2,944 3.1 0.68 26.8% 58.6% 12.4% 2.2%
d. The amount of time you are typically given to complete an assignment
2014 2,865 3.2 0.69 32.1% 55.6% 10.0% 2.3%
2008 2,936 3.2 0.66 29.7% 58.7% 10.1% 1.5%
f. The opportunity to make good use of your skills and abilities within the expectations of your job
2014 2,864 3.2 0.80 37.6% 45.5% 12.8% 4.1%
2008 2,934 3.2 0.76 35.8% 50.0% 10.7% 3.5%
F5. My supervisor provides me with the appropriate opportunities to have input on each of the following:
Year N Mean Stdev 4: Strongly Agree 3: Agree 2: Disagree 1: Strongly
Disagree
a. Planning my work2014 2,868 3.4 0.70 54.3% 37.2% 6.5% 2.0%
2008 2,958 3.4 0.69 50.9% 40.3% 7.2% 1.5%
c. How I accomplish my work2014 2,864 3.5 0.67 56.8% 36.6% 5.0% 1.6%
2008 2,952 3.5 0.66 53.9% 39.4% 5.4% 1.3%
e. Making decisions that affect my work2014 2,858 3.4 0.75 51.6% 37.3% 8.6% 2.4%
2008 2,945 3.4 0.71 49.5% 40.4% 8.3% 1.7%
g. Solving problems related to my work2014 2,862 3.4 0.70 53.4% 38.2% 6.6% 1.9%
2008 2,952 3.4 0.69 51.3% 40.5% 6.4% 1.9%
i. Assessing my performance2014 2,846 3.3 0.76 47.1% 41.3% 8.3% 3.3%
2008 2,933 3.3 0.74 43.6% 44.8% 8.7% 2.9%
2014 SWBS Annotated Questionnaire Page 21 of 51
F6. When you do work that is above and beyond that which is outlined in your work plan/job description, the additional work is formally documented (e.g., in a performance review, etc.).
2014(N = 2,607)Mean = 2.7
Stdev = 0.91
2008(N = 2,653)Mean = 2.7
Stdev = 0.89
4: Strongly Agree 18.3% 17.0%
3: Agree 45.8% 44.7%
2: Disagree 23.7% 26.8%
1: Strongly Disagree 12.2% 11.4%
Does not apply 8.5% (of 2,848) 9.9 (of 2,945)
F7. Are there the right number of qualified people in your work unit to do the work expected of you as a group?
2014(N = 2,862) 2008
(N = 2,927)
No—we need additional qualified people 52.1% 44.6%
Yes—the right amount 46.1% 53.6%
No—there are more people who are qualified for the work than needed 1.8% 1.8%
F8. How often in the past year have you voluntarily put in effort beyond what is really expected of your job simply because you enjoy the work you do?
2014(N = 2,870)Mean = 3.5
Stdev = 0.68
2008(N = 2,966)Mean = 3.4
Stdev = 0.71
1: Never 1.6% 2.0%
2: Seldom 6.0% 7.0%
3: Sometimes 38.0% 39.2%
4: Often 54.4% 51.8%
F9. How often in the past year have you taken a day off simply because you did not want to come in to work?
2014(N = 2,864)
2008(N = 2,960)
Never 68.1% 67.1%
Once or Twice 25.1% 27.3%
3-5 times 5.1% 4.3%
6 or more times 1.6% 1.3%
2014 SWBS Annotated Questionnaire Page 22 of 51

F10. I work in an environment that enables me to successfully balance my work and personal life.
2014(N = 2,854)Mean = 3.1
Stdev = 0.80
2008N = (2,956)Mean = 3.2
Stdev = 0.73
4: Strongly Agree 34.7% 32.3%
3: Agree 47.6% 53.9%
2: Disagree 13.2% 10.8%
1: Strongly Disagree 4.5% 3.0%
F11. NC State University provides programs and services that enable its employees to successfully balance their work and personal lives.
2014(N = 2,810)Mean = 2.9
Stdev = 0.70
2008(N = 2,902)Mean = 2.9
Stdev = 0.66
4: Strongly Agree 17.8% 14.7%
3: Agree 61.3% 63.7%
2: Disagree 17.3% 18.7%
1: Strongly Disagree 3.6% 2.9%
2014 SWBS Annotated Questionnaire Page 23 of 51

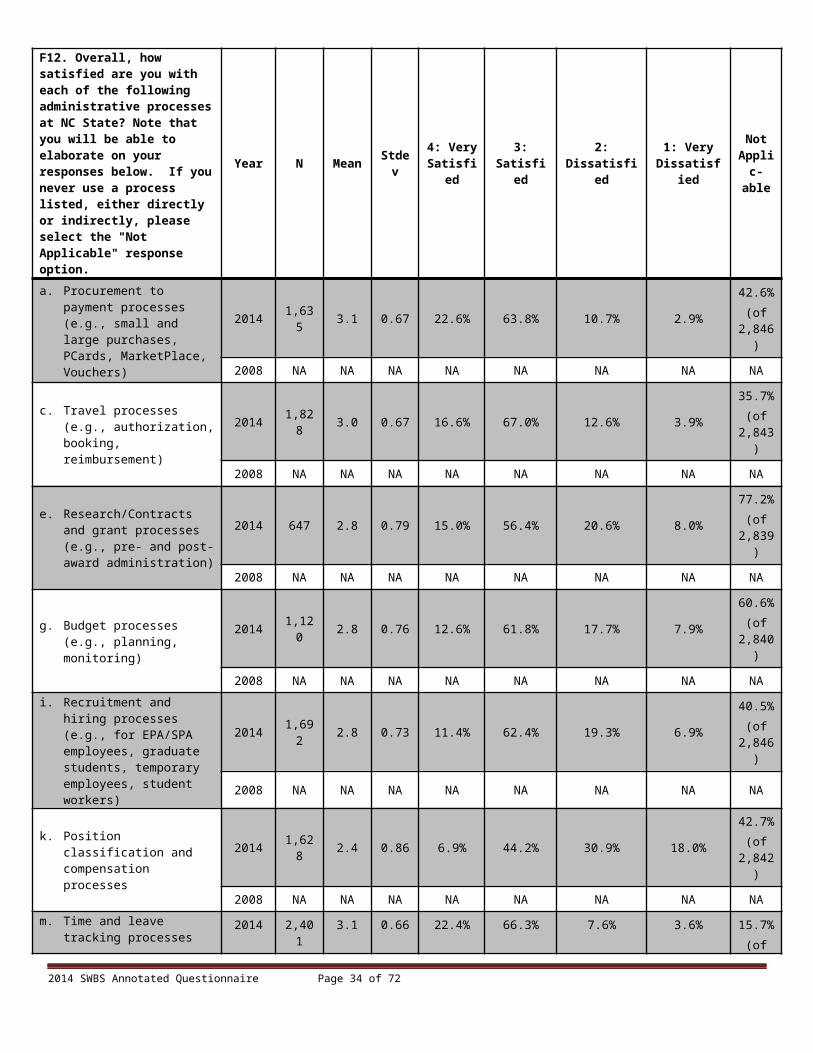
F12. Overall, how satisfied are you with each of the following administrative processes at NC State? Note that you will be able to elaborate on your responses below. If you never use a process listed, either directly or indirectly, please select the "Not Applicable" response option.
Year N Mean Stdev 4: Very Satisfied
3: Satisfied
2: Dissatisfied
1: Very Dissatisfied
Not Applic-able
a. Procurement to payment processes (e.g., small and large purchases, PCards, MarketPlace, Vouchers)
2014 1,635 3.1 0.67 22.6% 63.8% 10.7% 2.9%42.6%
(of 2,846)
2008 NA NA NA NA NA NA NA NA
c. Travel processes (e.g., authorization, booking, reimbursement)
2014 1,828 3.0 0.67 16.6% 67.0% 12.6% 3.9%35.7%
(of 2,843)
2008 NA NA NA NA NA NA NA NA
e. Research/Contracts and grant processes (e.g., pre- and post-award administration)
2014 647 2.8 0.79 15.0% 56.4% 20.6% 8.0%77.2%
(of 2,839)
2008 NA NA NA NA NA NA NA NA
g. Budget processes (e.g., planning, monitoring)
2014 1,120 2.8 0.76 12.6% 61.8% 17.7% 7.9%60.6%
(of 2,840)
2008 NA NA NA NA NA NA NA NAi. Recruitment and hiring
processes (e.g., for EPA/SPA employees, graduate students, temporary employees, student workers)
2014 1,692 2.8 0.73 11.4% 62.4% 19.3% 6.9%40.5%
(of 2,846)
2008 NA NA NA NA NA NA NA NA
k. Position classification and compensation processes
2014 1,628 2.4 0.86 6.9% 44.2% 30.9% 18.0%42.7%
(of 2,842)
2008 NA NA NA NA NA NA NA NA
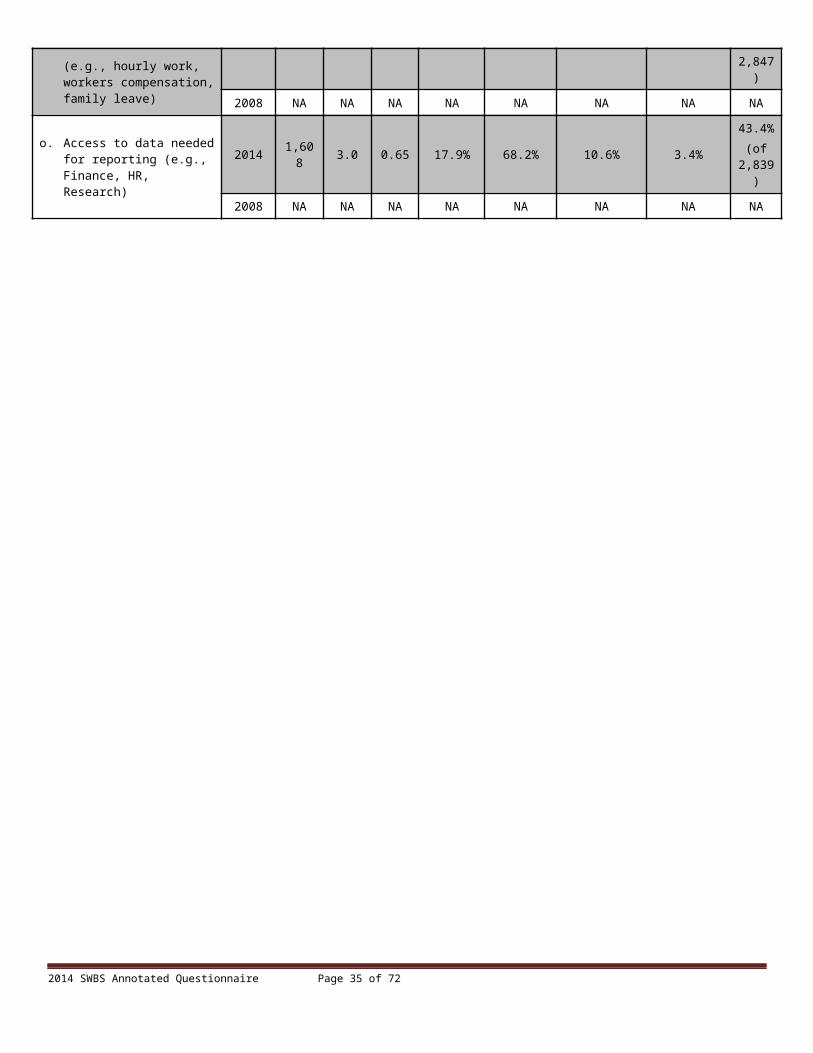
m. Time and leave tracking processes (e.g., hourly work, workers compensation, family leave)
2014 2,401 3.1 0.66 22.4% 66.3% 7.6% 3.6%15.7%
(of 2,847)
2008 NA NA NA NA NA NA NA NA
o. Access to data needed for reporting (e.g., Finance, HR, Research)
2014 1,608 3.0 0.65 17.9% 68.2% 10.6% 3.4%43.4%
(of 2,839)
2008 NA NA NA NA NA NA NA NA
2014 SWBS Annotated Questionnaire Page 24 of 51
F13. In thinking about your experience with administrative processes at NC State over the past few years, what would you suggest are the one or two changes that should be made to improve those processes? Please be sure to indicate at what level in the institution you think the changes need to be made (e.g., department, college/division, university, state).
F14. In thinking about your experience with administrative processes at NC State over the past few years, what are the one or two things that you think are working particularly well? Again, please be sure to indicate at what level in the institution you think these processes are working well (e.g., department, college/division, university, state).
F15. Overall, how comfortable are you with using the various areas of MyPack Portal to get and/or provide information? If you are unfamiliar with a particular area, please select the 'not applicable' response option.
Year N Mean Stdev4: Very
Comfort-able
3: Somewhat Comfort-
able
2: Not Very Comfort-
able
1: Not At All
Comfort-able
Not Applic-
able
a. Employee Self Service (e.g., Time Reporting, Payroll and Compensation, Learning and Development)
2014 2,799 3.7 0.56 70.4% 26.5% 2.4% 0.7%1.0%
(of 2,826)
2008 NA NA NA NA NA NA NA NA
c. Financial Systems (e.g., MarketPlace, Purchasing, Training, Travel)
2014 2,168 3.3 0.79 45.2% 40.6% 10.6% 3.6%23.0%
(of 2,816)
2008 NA NA NA NA NA NA NA NA
e. Human Resources Systems (e.g., Commitment Accounting, Manager Self Service, Reporting Tools, Job Data)
2014 1,570 3.1 0.90 37.1% 39.7% 16.1% 7.1%44.3%
(of 2,819)
2008 NA NA NA NA NA NA NA NA
g. Student Information Systems (e.g., Student Admissions, Records and Enrollment, Curriculum Management)
2014 1,103 3.3 0.86 49.2% 34.2% 11.4% 5.2%60.8%
(of 2,816)
2008 NA NA NA NA NA NA NA NA
2014 SWBS Annotated Questionnaire Page 25 of 51
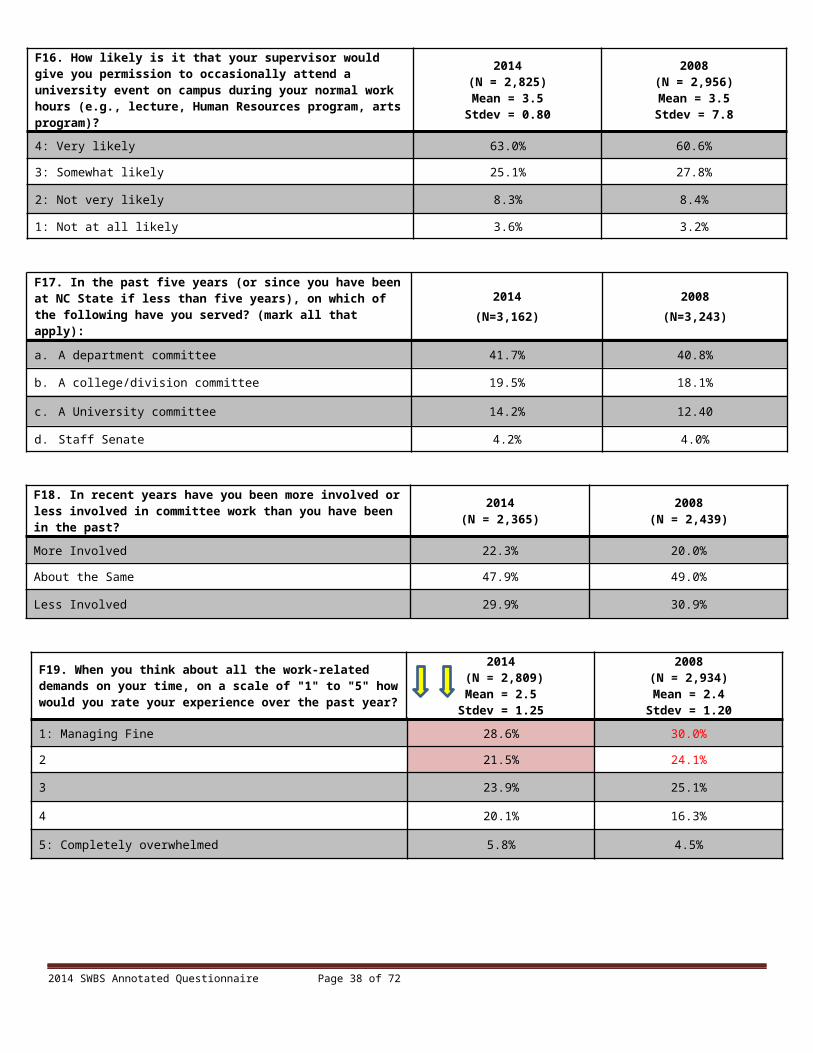
F16. How likely is it that your supervisor would give you permission to occasionally attend a university event on campus during your normal work hours (e.g., lecture, Human Resources program, arts program)?
2014(N = 2,825)Mean = 3.5
Stdev = 0.80
2008(N = 2,956)Mean = 3.5Stdev = 7.8
4: Very likely 63.0% 60.6%
3: Somewhat likely 25.1% 27.8%
2: Not very likely 8.3% 8.4%
1: Not at all likely 3.6% 3.2%
F17. In the past five years (or since you have been at NC State if less than five years), on which of the following have you served? (mark all that apply):
2014(N=3,162)
2008(N=3,243)
a. A department committee 41.7% 40.8%
b. A college/division committee 19.5% 18.1%
c. A University committee 14.2% 12.40
d. Staff Senate 4.2% 4.0%
F18. In recent years have you been more involved or less involved in committee work than you have been in the past?
2014(N = 2,365)
2008(N = 2,439)
More Involved 22.3% 20.0%
About the Same 47.9% 49.0%
Less Involved 29.9% 30.9%
F19. When you think about all the work-related demands on your time, on a scale of "1" to "5" how would you rate your experience over the past year?
2014 (N = 2,809)Mean = 2.5
Stdev = 1.25
2008(N = 2,934)Mean = 2.4
Stdev = 1.20
1: Managing Fine 28.6% 30.0%
2 21.5% 24.1%
3 23.9% 25.1%
4 20.1% 16.3%
5: Completely overwhelmed 5.8% 4.5%
2014 SWBS Annotated Questionnaire Page 26 of 51
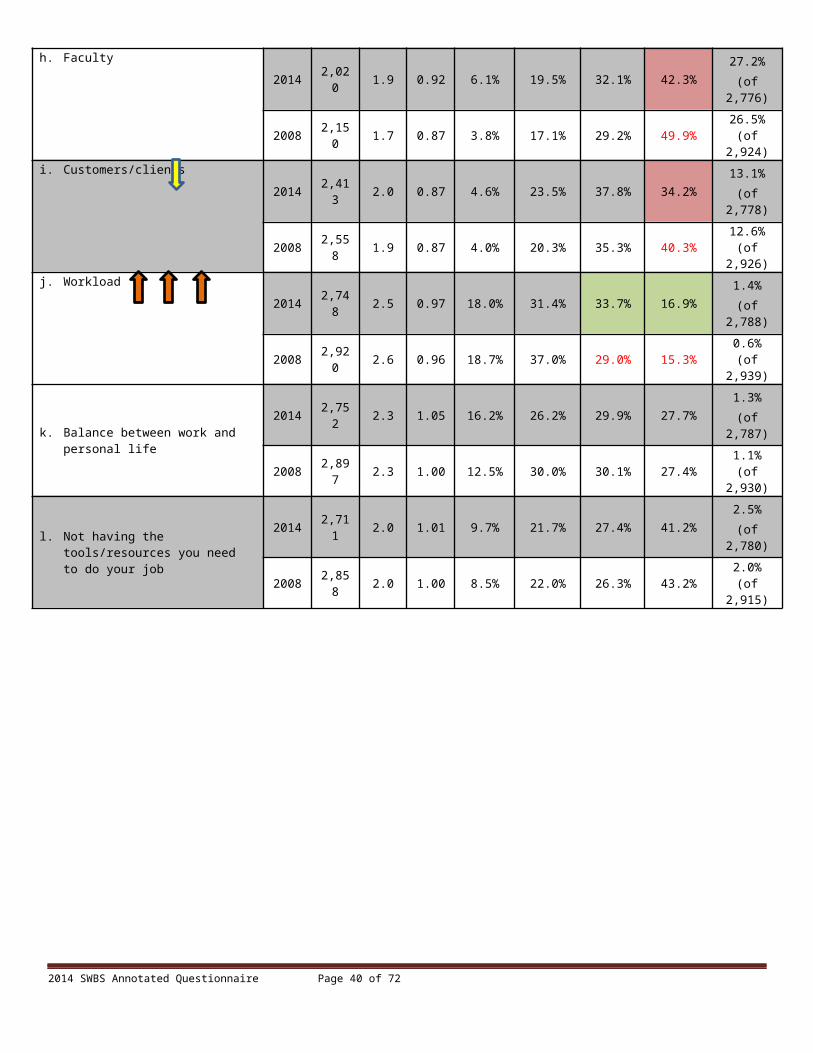
F20. Over the past couple of years, how much stress have you experienced as a result of each of the following as related to your work at NC State:
Year N Mean Stdev4: A
Great Deal
3: Some 2: A Little
1: Not at all
Does Not Apply
a. Other staff in your work unit2014 2,706 2.3 1.00 12.2% 30.6% 29.3% 27.8%
3.0%(of 2,789)
2008 2,838 2.3 1.01 13.1% 30.7% 28.5% 27.7% 3.6%(of 2,943)
b. Other staff in your department (whom you do not supervise)
2014 2,541 2.2 0.99 10.4% 27.8% 29.6% 32.2%8.6%
(of 2,781)
2008 2,664 2.1 1.01 10.8% 25.5% 28.7% 35.1% 8.9%(of 2,923)
c. Staff you supervise2014 1,244 2.1 0.98 8.8% 24.9% 29.9% 36.3%
55.1%(of 2,773)
2008 1,381 2.1 1.00 9.9% 23.7% 28.7% 37.7% 52.6%(of 2,915)
d. Your immediate supervisor2014 2,732 2.1 1.06 13.5% 20.5% 26.9% 39.1%
1.6%(of 2,776)
2008 2,864 2.1 1.03 11.9% 21.3% 28.4% 38.4% 1.7%(of 2,915)
e. Upper administration inyour department 2014 2,533 2.1 1.04 11.5% 22.8% 25.5% 40.2%
8.8%(of 2,778)
2008 2,671 2.0 1.01 10.1% 19.5% 28.0% 42.4% 8.4%(of 2,917)
f. Upper administration inyour college/division 2014 2,192 1.9 1.00 8.3% 18.8% 22.4% 50.5%
21.0%(of 2,776)
2008 2,323 1.7 0.94 6.4% 15.2% 22.0% 56.4% 20.2%(of 2,912)
g. Students2014 1,727 1.7 0.86 4.0% 14.6% 27.3% 54.1%
37.5%(of 2,765)
2008 1,983 1.6 0.83 3.2% 12.9% 25.1% 58.8% 32.3%(of 2,927)
h. Faculty2014 2,020 1.9 0.92 6.1% 19.5% 32.1% 42.3%
27.2%(of 2,776)
2008 2,150 1.7 0.87 3.8% 17.1% 29.2% 49.9% 26.5%(of 2,924)
i. Customers/clients2014 2,413 2.0 0.87 4.6% 23.5% 37.8% 34.2%
13.1%(of 2,778)
2008 2,558 1.9 0.87 4.0% 20.3% 35.3% 40.3% 12.6%(of 2,926)
j. Workload2014 2,748 2.5 0.97 18.0% 31.4% 33.7% 16.9%
1.4%(of 2,788)
2008 2,920 2.6 0.96 18.7% 37.0% 29.0% 15.3% 0.6%(of 2,939)
k. Balance between work and personal life
2014 2,752 2.3 1.05 16.2% 26.2% 29.9% 27.7%1.3%
(of 2,787)
2008 2,897 2.3 1.00 12.5% 30.0% 30.1% 27.4% 1.1%(of 2,930)
l. Not having the tools/resources you need to do your job
2014 2,711 2.0 1.01 9.7% 21.7% 27.4% 41.2%2.5%
(of 2,780)
2008 2,858 2.0 1.00 8.5% 22.0% 26.3% 43.2% 2.0%(of 2,915)
2014 SWBS Annotated Questionnaire Page 27 of 51

F20. Over the past couple of years, how much stress have you experienced as a result of each of the following as related to your work at NC State: (continued)
Year N Mean Stdev4: A
Great Deal
3: Some 2: A Little
1: Not at all
Does Not Apply
m. Your physical workspace environment
2014 2,723 1.8 1.00 8.6% 17.2% 23.2% 51.1%2.1%
(of 2,781)
2008 2,888 1.9 1.01 9.3% 18.7% 24.2% 47.9% 1.4%(of 2,929)
n. Institutional procedures2014 2,544 2.1 0.96 9.5% 25.0% 35.1% 30.4%
8.2%(of 2,771)
2008 2,722 2.0 0.95 7.6% 22.4% 31.7% 38.3% 6.7%(of 2,919)
o. Committee work2014 1,803 1.6 0.80 2.6% 12.4% 29.7% 55.4%
35.2%(of 2,784)
2008 2,082 1.5 0.76 1.7% 11.2% 24.4% 62.7% 28.2%(of 2,901)
p. Self-assessment activities (e.g., performance review)
2014 2,534 1.7 0.85 3.7% 14.7% 30.3% 51.3%8.8%
(of 2,780)
2008 2,709 1.7 0.87 4.3% 14.7% 27.6% 53.4% 6.8%(of 2,908)
q. Planning and assessment activities in your department
2014 2,226 1.8 0.87 4.1% 16.9% 33.1% 45.9%19.8%
(of 2,777)
2008 2,311 1.7 0.86 3.7% 15.7% 28.9% 51.7% 19.8%(of 2,881)
r. Administrative processes (e.g., "bureaucracy" or "red tape")
2014 2,391 2.4 0.98 16.0% 29.7% 34.1% 20.2%13.9%
(of 2,777)
2008 NA NA NA NA NA NA NA NA
s. Other (please specify)2014 384 2.7 1.36 44.3% 13.5% 6.0% 36.2%
70.4%(of 1,299)
2008 416 2.4 1.32 31.7% 18.5% 7.0% 42.8% 53.5%(of 895)
2014 SWBS Annotated Questionnaire Page 28 of 51

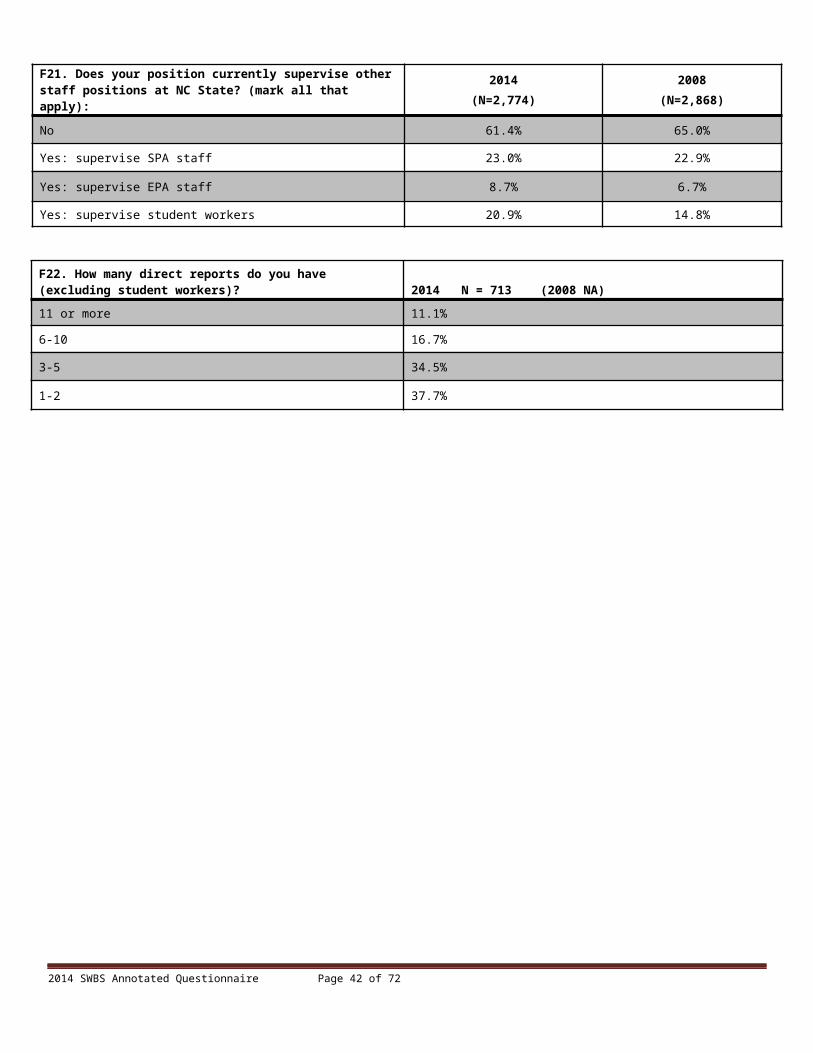
F21. Does your position currently supervise other staff positions at NC State? (mark all that apply):
2014(N=2,774)
2008(N=2,868)
No 61.4% 65.0%
Yes: supervise SPA staff 23.0% 22.9%
Yes: supervise EPA staff 8.7% 6.7%
Yes: supervise student workers 20.9% 14.8%
F22. How many direct reports do you have (excluding student workers)? 2014 N = 713 (2008 NA)
11 or more 11.1%
6-10 16.7%
3-5 34.5%
1-2 37.7%
2014 SWBS Annotated Questionnaire Page 29 of 51
Section G: Support and Professional Development
G1. How well do you understand what is expected of you in your current job?
2014(N = 2,786)Mean = 3.7
Stdev = 0.52
2008(N = 2,913)Mean = 3.7
Stdev = 0.52
4: Very well 71.4% 71.4%
3: Fairly well 26.2% 26.3%
2: Not very well 2.3% 2.1%
1: Not at all 0.1% 0.3%
G2. How useful are each of the following in helping you to understand what is expected of you in your current job?
Year N Mean Stdev4:
Very Useful
3: Somewhat
Useful
2: Not Very
Useful
1: Not At All
UsefulDoes Not
Apply
a. Co-workers in your college/division2014 2,567 3.1 0.84 36.5% 44.1% 14.0% 5.4%
7.6%(of 2,777)
2008 2,674 3.1 0.83 35.7% 45.8% 13.2% 5.3% 6.8%(of 2,869)
c. Regular conversations with your supervisor
2014 2,743 3.4 0.79 55.9% 32.8% 7.5% 3.8%1.4%
(of 2,783)
2008 2,844 3.5 0.75 57.8% 32.4% 6.8% 3.0% 1.4%(of 2,883)
e. Unit or department meetings2014 2,561 3.0 0.89 31.5% 43.9% 17.1% 7.5%
7.9%(of 2,780)
2008 2,617 3.0 0.85 31.7% 46.0% 15.9% 6.3% 9.0%(of 2,875)
g. Your job description or work plan2014 2,717 3.1 0.85 33.5% 45.9% 14.5% 6.0%
2.2%(of 2,778)
2008 2,819 3.1 0.83 35.0% 45.2% 14.8% 5.0% 2.1%(of 2,880)
i. (SPA ONLY) Your Interim Appraisal (typically conductedin December)
2014 1,698 2.9 0.93 28.9% 42.7% 18.3% 10.2%16.3%
(of 2,028)
2008 2,424 3.0 0.88 31.4% 43.9% 17.6% 7.2% 14.9%(of 2,849)
k. (SPA ONLY) Your AnnualAppraisal (typically conductedin May)
2014 1,694 3.0 0.91 31.9% 43.9% 15.1% 9.1%15.7%
(of 2,010)
2008 2,497 3.1 0.86 34.0% 44.7% 14.7% 6.5% 12.5%(of 2,854)
m. (EPA ONLY) YourPerformance Review 2014 975 2.9 0.88 27.2% 47.0% 17.7% 8.1%
43.0%(of 1,711)
2008 1,009 3.1 0.81 32.3% 50.0% 12.0% 5.6% 46.6%(of 1,891)
2014 SWBS Annotated Questionnaire Page 30 of 51

G3. I have the essential materials and equipment I need to do my work.
2014(N = 2,783)Mean = 3.3
Stdev = 0.66
2008(N = 2,886)Mean = 3.3
Stdev = 0.66
4: Strongly Agree 39.1% 37.1%
3: Agree 52.9% 53.8%
2: Disagree 6.5% 7.5%
1: Strongly Disagree 1.6% 1.6%
G4. I know how to use the materials and equipment necessary to do my work.
2014(N = 2,781)Mean = 3.6
Stdev = 0.53
2008(N = 2,885)Mean = 3.6
Stdev = 0.53
4: Strongly Agree 62.0% 59.7%
3: Agree 36.4% 39.1%
2: Disagree 1.3% 0.9%
1: Strongly Disagree 0.3% 0.2%
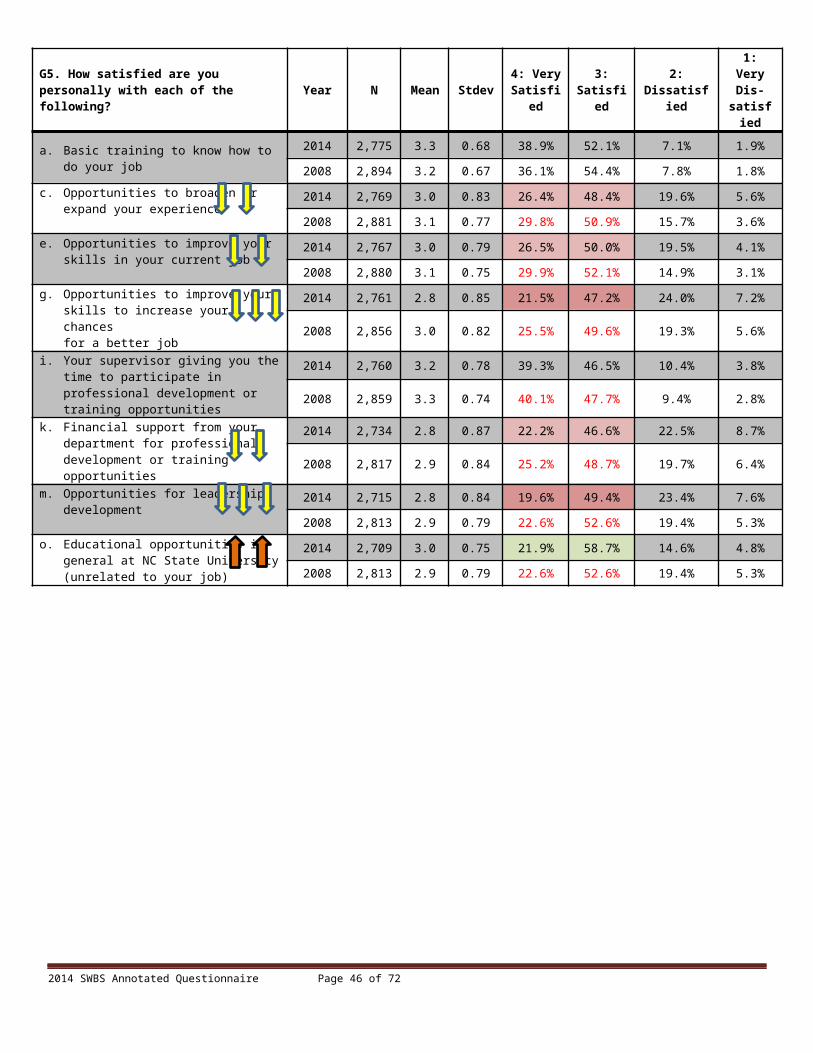
G5. How satisfied are you personally with each of the following? Year N Mean Stdev 4: Very
Satisfied3:
Satisfied2:
Dissatisfied1: Very
Dis-satisfied
a. Basic training to know how to do your job
2014 2,775 3.3 0.68 38.9% 52.1% 7.1% 1.9%
2008 2,894 3.2 0.67 36.1% 54.4% 7.8% 1.8%c. Opportunities to broaden or
expand your experience2014 2,769 3.0 0.83 26.4% 48.4% 19.6% 5.6%
2008 2,881 3.1 0.77 29.8% 50.9% 15.7% 3.6%e. Opportunities to improve your
skills in your current job2014 2,767 3.0 0.79 26.5% 50.0% 19.5% 4.1%
2008 2,880 3.1 0.75 29.9% 52.1% 14.9% 3.1%g. Opportunities to improve your
skills to increase your chancesfor a better job
2014 2,761 2.8 0.85 21.5% 47.2% 24.0% 7.2%
2008 2,856 3.0 0.82 25.5% 49.6% 19.3% 5.6%
i. Your supervisor giving you the time to participate in professional development or training opportunities
2014 2,760 3.2 0.78 39.3% 46.5% 10.4% 3.8%
2008 2,859 3.3 0.74 40.1% 47.7% 9.4% 2.8%
k. Financial support from yourdepartment for professional development or trainingopportunities
2014 2,734 2.8 0.87 22.2% 46.6% 22.5% 8.7%
2008 2,817 2.9 0.84 25.2% 48.7% 19.7% 6.4%
m. Opportunities for leadership development
2014 2,715 2.8 0.84 19.6% 49.4% 23.4% 7.6%
2008 2,813 2.9 0.79 22.6% 52.6% 19.4% 5.3%o. Educational opportunities in
general at NC State University (unrelated to your job)
2014 2,709 3.0 0.75 21.9% 58.7% 14.6% 4.8%
2008 2,813 2.9 0.79 22.6% 52.6% 19.4% 5.3%
2014 SWBS Annotated Questionnaire Page 31 of 51

G6. To what extent does your department: Year N Mean Stdev
4: A Great Deal
3: Somewhat
2: A Little
1: Not At All
Don’t Know
a. Support employees’ efforts to find more efficient and effective ways to get things done
2014 2,654 3.1 0.91 41.1% 37.2% 14.8% 6.9%4.3%
(of 2,773)
2008 2,742 3.2 0.87 43.4% 37.3% 13.7% 5.5%5.4%
(of 2,897)
c. Recognize/appreciate employees’ efforts to find more efficient and effective ways to get things done
2014 2,641 2.9 1.01 32.3% 36.1% 18.7% 13.0%4.7%
(of 2,771)
2008 2,717 2.9 0.99 34.2% 36.0% 18.2% 11.6%5.7%
(of 2,882)
G7. Were you assigned a mentor or “buddy” when you first came to NC State?
2014(N = 2,773)
2008(N = 2,881)
Yes 13.7% 13.7%
No 82.4% 82.2%
Don’t Know 3.9% 4.1%
G8. How helpful do you think it would be for new employees to be assigned a mentor or ‘buddy’ when they first come to NC State?
2014(N = 2,752)Mean = 3.3
Stdev = 0.71
2008(N = 2,854)Mean = 3.3
Stdev = 0.72
4: Very helpful 41.5% 42.2%
3: Somewhat helpful 47.3% 45.6%
2: Not very helpful 9.3% 10.5%
1: Not at all helpful 1.9% 1.7%
2014 SWBS Annotated Questionnaire Page 32 of 51

Section H: Performance Evaluation
H1. How important are each of the following in helping you to understand how well you are performing your job?
Year N Mean Stdev 4: Very Important
3: Somewhat Important
2: Not Very
Important
1: Not At All
Important
Don’t Know“Does
not apply” (2008)
a. Staff in your work-unit
2014 2,678 3.2 0.79 43.0% 42.2% 11.0% 3.8%2.8%
(of 2,754)
2008 2,723 3.2 0.78 42.5% 43.3% 11.0% 3.3%4.7%
(of 2,857)
c. Staff in your department (whom you don’t supervise)
2014 2,533 3.0 0.87 30.9% 44.6% 17.8% 6.8%7.5%
(of 2,738)
2008 2,558 3.0 0.83 29.4% 47.1% 18.0% 5.5%10.2%
(of 2,847)
e. Staff you supervise
2014 1,443 3.3 0.90 49.1% 35.4% 7.6% 7.9%45.8%
(of 2,663)
2008 1,225 3.4 0.73 51.7% 38.6% 7.3% 2.4%56.6%
(of 2,824)
g. Your immediate supervisor
2014 2,732 3.6 0.65 71.3% 23.2% 3.6% 1.9%0.8%
(of 2,753)
2008 2,826 3.6 0.63 71.5% 23.5% 3.4% 1.6%0.9%
(of 2,852)
i. Upper administration in your department
2014 2,568 3.1 0.90 37.3% 40.2% 15.4% 7.0%6.4%
(of 2,745)
2008 2,652 3.1 0.87 36.7% 42.4% 14.9% 6.1%6.5%
(of 2,835)
k. Upper administration in your college/division
2014 2,321 2.7 0.98 24.3% 38.6% 22.9% 14.1%15.0%
(of 2,732)
2008 2,417 2.7 0.96 22.9% 38.6% 25.7% 12.7%14.6%
(of 2,830)
m. Your customers or clients
2014 2,457 3.6 0.69 65.0% 28.7% 3.7% 2.6%10.4%
(of 2,741)
2008 2,451 3.5 0.71 62.3% 30.0% 5.1% 2.5%13.7%
(of 2,839)
2014 SWBS Annotated Questionnaire Page 33 of 51
H1. How important are each of the following in helping you to understand how well you are performing your job? (continued)
Year N Mean Stdev 4: Very Important
3: Somewhat Important
2: Not Very
Important
1: Not At All
Important
Don’t Know“Does
not apply” (2008)
o. Students
2014 1,968 3.0 1.06 41.4% 31.9% 11.9% 14.8%27.8%
(of 2,727)
2008 1,784 3.1 0.92 39.7% 38.3% 14.1% 7.8%37.1%
(of 2,835)
q. Faculty
2014 2,088 3.0 0.99 35.9% 38.9% 12.9% 12.3%23.3%
(of 2,721)
2008 1,982 3.1 0.85 36.1% 44.2% 13.6% 6.1%29.8%
(of 2,824)
H2. How satisfied are you with the incentives, recognition and/or rewards offered by your department for excellent job performance?
2014(N = 2,407)Mean = 2.2
Stdev = 0.91
2008(N = 2,473)Mean = 2.4
Stdev = 0.90
4: Very satisfied 6.8% 9.5%
3: Satisfied 35.8% 42.7%
2: Dissatisfied 32.2% 29.5%
1: Very dissatisfied 25.2% 18.2%
Don’t know 13.0% (of 2766) 13.3% (of 2,853)
H3. Over the past 12 months, about how often has your supervisor publicly acknowledged or expressed appreciation for the work you have done?
2014(N = 2,771)Mean = 2.7
Stdev = 1.11
2008(N = 2,862)Mean = 2.7
Stdev = 1.11
4: Frequently 30.2% 31.3%
3: Sometimes 27.0% 27.4%
2: Occasionally 22.0% 21.5%
1: Seldom/Never 20.8% 19.8%
2014 SWBS Annotated Questionnaire Page 34 of 51
H4. Over the past 12 months, about how often have people other than your supervisor (e.g., customers, faculty, etc.) publicly acknowledged or expressed appreciation for the work you have done?
2014(N = 2,731)Mean = 2.9
Stdev = 1.03
2008(N = 2,813)Mean = 2.9
Stdev = 1.02
4: Frequently 33.1% 34.0%
3: Sometimes 33.4% 33.3%
2: Occasionally 19.7% 20.2%
1: Seldom/Never 13.8% 12.5%
Does not apply 1.4% (of 2,769) 2.0% (of 2,870)
H5. How well do you understand the process that your department uses to evaluate your performance during the year?
2014(N = 2,679)Mean = 3.1
Stdev = 0.86
2008(N = 2,802)Mean = 3.0
Stdev = 0.81
4: Very well 36.6% 29.2%
3: Somewhat well 43.6% 47.3%
2: Not very well 13.7% 19.3%
1: Not at all 6.1% 4.2%
Don’t know 3.0% (of 2,762) 2.5% (of 2,875)
H6. In general, I think the performance evaluation process is fair and reasonable.
2014(N = 2,704)Mean = 2.9
Stdev = 0.74
2008(N = 2,812)Mean = 2.9
Stdev = 0.70
4: Strongly agree 17.3% 15.2%
3: Agree 59.8% 64.6%
2: Disagree 17.4% 15.6%
1: Strongly disagree 5.4% 4.6%
2014 SWBS Annotated Questionnaire Page 35 of 51
QUESTIONS H7-H11 ASKED ONLY OF SPA
H7. Have you had an Annual Appraisal in your current position at NC State University? (SPA ONLY)
2014(N = 1,876)
2008(((N = 2,055))
Yes 81.2% 83.8%
No (Skip to next section) 14.1% 12.0%
Don’t know (Skip to next section) 4.7% 4.1%
H8. How much input do you have on your Annual Appraisal? (SPA ONLY)
2014(N = 1,515)Mean = 2.9
Stdev = 0.99
2008(N = 1,777)Mean = 2.9Stdev = NA
4: A Great Deal 31.7% 30.7%
3: Some 40.3% 41.5%
2: A Little 14.9% 14.0%
1: None At All 13.0% 13.8%
H9. How useful are each of the following in helping you to understand how well you are performing your job? (SPA ONLY)
Year N Mean Stdev 4: Very Useful
3: Somewhat
Useful
2: Not Very
Useful
1: Not At All
Useful
Doesn’t not apply—did not get/have
a. The numeric ratings onyour Annual Appraisals 2014 1,473 2.8 0.87 22.2% 48.6% 20.2% 9.0%
2.6%(of 1,513)
2008 1,682 3.0 0.83 28.1% 50.1% 15.7% 6.2% 1.1%(of 1,700)
c. Written comments on your Annual Appraisals
2014 1,499 3.4 0.78 53.5% 35.8% 6.7% 4.0%1.1%
(of 1,515)
2008 1,680 3.4 0.75 53.9% 36.1% 7.0% 3.0% 1.5%(of 1,705)
e. Talking with your supervisor about your Annual Appraisal
2014 1,497 3.5 0.82 61.5% 27.1% 6.6% 4.7%1.3%
(of 1,516)
2008 1,689 3.5 0.78 61.8% 27.8% 6.6% 3.8% 0.7%(of 1,701)
2014 SWBS Annotated Questionnaire Page 36 of 51

H10. In general, do you think your Annual Appraisals: (SPA ONLY) Year N Mean Stdev
4: Strongly
Agree3: Agree 2: Disagree 1: Strongly
Disagree
a. Are appropriately based on your job description/work plan
2014 1,507 3.1 0.68 26.5% 60.1% 11.0% 2.4%
2008 1,701 3.1 NA 28.5% 58.6% 10.5% 2.5%c. Are helpful to your career
development2014 1,507 3.1 0.68 26.5% 60.1% 11.0% 2.4%
2008 1,697 2.7 NA 16.4% 47.7% 29.5% 6.4%e. Are helpful to your career
planning 2014 1,508 2.6 0.81 12.7% 43.4% 35.8% 8.0%
2008 1,690 2.7 NA 15.0% 45.0% 33.4% 6.7%
g. Help you to identify what you have done well
2014 1,507 3.1 0.72 25.3% 58.7% 12.5% 3.5%
2008 1,696 3.1 NA 27.4% 58.7% 11.1% 2.8%
i. Help you to identify areas youneed to improve on 2014 1,509 3.0 0.68 21.8% 61.8% 13.7% 2.7%
2008 1,700 3.1 NA 25.7% 61.6% 10.5% 2.2%
k. Reflect how well you think you are doing
2014 1,508 3.0 0.72 21.0% 57.7% 18.0% 3.4%
2008 1,694 3.0 NA 23.6% 56.3% 16.0% 4.2%
m. Are provided to you in a timely fashion
2014 1,506 3.1 0.74 26.0% 58.2% 11.4% 4.5%
2008 1,693 3.0 NA 24.7% 57.7% 11.9% 5.7%
H11. To what extent do your Annual Appraisals appropriately reflect: (SPA ONLY) Year N Mean Stdev
4: A Great Deal
3: Somewha
t2: A Little 1: Not At
All
a. Your key responsibilities2014 1,507 3.4 0.74 51.8% 37.2% 8.6% 2.3%
2008 1,185 3.3 0.82 47.9% 38.9% 8.1% 5.1%
c. Your competencies2014 1,503 3.2 0.85 42.3% 40.8% 11.4% 5.5%
2008 1,162 3.1 0.90 38.8% 42.0% 11.1% 8.1%
2014 SWBS Annotated Questionnaire Page 37 of 51
QUESTIONS H12-H15 ASKED ONLY OF EPA IN 2014
H12. Have you been in your current position at NC State University at least one year? (EPA ONLY)
2014(N = 895)
2008(N = 797)
Yes 87.6% 85.7%
No (Skip to end of section) 12.4% 14.3%
H13. Have you had a performance review for your current position at NC State University? (EPA ONLY)
2014(N = 782)
2008(N = 654)
5: Yes—every year I have been in this position 74.7% 80.7%
4: Yes—most, but not every year 9.2% 7.2%
3: Yes—some years 4.5% 3.7%
2: Yes—but only rarely 4.1% 2.1%
1: No—never (Skip to end of section) 7.5% 6.3%
H14. How much input do you have during the review process for your performance review? (EPA ONLY)
2014(N = 721)
Mean = 3.5Stdev = 0.75
2008(N = 626)
Mean = 3.5Stdev = NA
4: A great deal 62.6% 59.1%
3: Some 27.5% 31.6%
2: A little 7.1% 5.4%
1: None at all 2.9% 3.8%
2014 SWBS Annotated Questionnaire Page 38 of 51

H15. In general, do you think your performance reviews: (EPA ONLY) Year N Mean Stdev 4: Strongly
Agree 3: Agree 2: Disagree
1: Strongly Disagree
a. Are appropriately based onyour job description/work plan
2014 718 3.2 0.68 33.3% 55.0% 10.0% 1.7%
2008 596 3.2 NA 31.5% 60.2% 7.0% 1.2%c. Are helpful to your career
development2014 715 2.8 0.79 17.8% 45.3% 32.6% 4.3%
2008 589 2.9 NA 20.2% 50.8% 24.6% 4.4%e. Are helpful to your career
planning 2014 714 2.7 0.80 16.1% 41.6% 37.1% 5.2%
2008 582 2.8 NA 19.2% 46.6% 28.5% 5.7%
g. Help you to identify what you have done well
2014 713 3.1 0.69 29.9% 55.7% 12.9% 1.5%
2008 601 3.1 NA 27.0% 60.7% 9.7% 2.7%
i. Help you to identify areasyou need to improve on 2014 717 3.0 0.70 23.0% 57.9% 16.9% 2.2%
2008 593 3.1 NA 24.5% 61.0% 12.3% 2.2%
k. Reflect how well you think youare doing 2014 716 3.1 0.71 25.6% 57.1% 14.9% 2.4%
2008 599 3.1 NA 24.0% 61.9% 10.5% 3.5%
m. Are provided to you in a timely fashion 2014 713 3.1 0.76 26.6% 56.4% 12.3% 4.6%
2008 598 3.1 NA 23.7% 62.5% 10.4% 3.3%
o. Are appropriately basedon agreed uponobjectives
2014 708 3.1 0.71 25.3% 58.8% 12.9% 3.1%
2008 600 3.2 NA 30.8% 60.5% 7.0% 1.7%
2014 SWBS Annotated Questionnaire Page 39 of 51
Section I: Pay and Compensation
I1. My current salary is reasonably competitive, when compared with employees doing the same or similar work:
Year N Mean Stdev4:
Strongly Agree
3: Agree
2: Disagree
1: Strongly Disagree
Don’t Know
a. In my department2014 2,274 2.5 0.93 12.8% 45.7% 23.8% 17.7%
17.6%(of 2,760)
2008 2,135 2.7 0.86 16.2% 51.6% 21.1% 11.1% 25.1%(of 2,850)
b. In my college/division2014 1,830 2.4 0.91 9.3% 41.1% 29.6% 20.0%
33.5%(of 2,751)
2008 1,631 2.6 0.87 12.8% 45.7% 28.8% 12.7% 42.2%(of 2,821)
c. In other colleges/divisions at NC State 2014 1,577 2.3 0.92 8.6% 33.1% 34.7% 23.6%
42.7%(of 2,754)
2008 1,382 2.4 0.89 10.7% 39.2% 33.2% 16.9% 51.1%(of 2,824)
d. At other Raleigh-areaemployers 2014 1,937 1.8 0.86 4.5% 16.4% 35.8% 43.3%
29.8%(of 2,759)
2008 1,334 1.9 0.86 4.5% 20.4% 38.8% 36.3% 34.4%(of 2,035)
e. At other universities2014 1,468 2.1 0.92 7.1% 24.3% 36.2% 32.4%
46.7%(of 2,754)
2008 1,310 2.2 0.91 8.5% 30.3% 37.7% 23.4% 53.6%(of 2,823)
I2. I know how to find the information I need to understand the benefits available to me.
2014(N = 2,761)Mean = 3.2
Stdev = 0.58
2008(N = 2,856)Mean = 3.2
Stdev = 0.58
4: Strongly agree 30.3% 29.8%
3: Agree 62.7% 63.5%
2: Disagree 6.4% 5.9%
1: Strongly disagree 0.6% 0.8%
I3. I can make informed decisions about my benefits based on the information available to me.
2014(N = 2,759)Mean = 3.2
Stdev = 0.58
2008(N = 2,842)Mean = 3.2
Stdev = 0.56
4: Strongly agree 29.4% 28.0%
3: Agree 63.5% 65.4%
2: Disagree 6.4% 6.1%
1: Strongly disagree 0.8% 0.5%
2014 SWBS Annotated Questionnaire Page 40 of 51

I4. Healthcare benefits (e.g., medical, dental, vision, medical flex spending) provided through the State of North Carolina for State employees, including university faculty and staff, are reasonably competitive with other employers for whom I could work.
2014(N = 2,349)Mean = 2.8
Stdev = 0.81
2008(N = 2,458)Mean = 2.8
Stdev = 0.82
4: Strongly agree 18.7% 18.9%
3: Agree 54.8% 54.1%
2: Disagree 19.2% 18.9%
1: Strongly disagree 7.3% 8.0%
Don’t know 15.0% (of 2,765) 13.9% (of 2,856)
I5. Retirement contributions to the Teachers and State Employees Retirement System (TSERS) or the Optional Retirement Program (ORP) that are provided through the state of North Carolina for State employees, including university faculty and staff, are reasonably competitive with other employers for whom I could work.
2014 (N = 2,176)Mean = 3.0
Stdev = 0.70
2008(N = 2,219)Mean = 2.9
Stdev = 0.77
4: Strongly agree 19.9% 17.6%
3: Agree 62.8% 58.3%
2: Disagree 13.2% 17.5%
1: Strongly disagree 4.0% 6.7%
Don’t know 21.3% (of 2,764) 22.2% (of 2,852)
I6. The voluntary benefit programs (e.g., voluntary retirement/deferred compensation plans, voluntary life insurance, supplemental disability plans, auto/home owners insurance, prepaid legal) offered directly by NC State University are reasonably competitive with other employers for whom I could work.
2014(N = 1,869)Mean = 3.0
Stdev = 0.61
2008(N = 1,874)Mean = 3.0
Stdev = 0.62
4: Strongly agree 18.4% 16.3%
3: Agree 69.6% 70.1%
2: Disagree 9.6% 10.7%
1: Strongly disagree 2.4% 2.9%
Don’t know 32.3% (of 2,760) 34.2% (of 2,849)
2014 SWBS Annotated Questionnaire Page 41 of 51
I7. In general, I am satisfied with my compensation (salary + benefits) at NC State University.
2014(N = 2,753)Mean = 2.4
Stdev = 0.80
2008(N = 2,839)Mean = 2.6
Stdev = 0.74
4: Strongly agree 6.3% 7.9%
3: Agree 44.1% 54.0%
2: Disagree 36.0% 30.7%
1: Strongly disagree 13.5% 7.4%
I8. How important do you think it is for NC State to provide the following benefits to employees?
Year N Mean Stdev 4: Very Important
3: Somewhat Important
2: Not Very
Important
1: Not At All
Important
a. Flexible working hours2014 2,762 3.7 0.54 71.7% 25.5% 2.2% 0.6%
2008 2,854 3.7 0.53 73.2% 24.4% 2.0% 0.5%c. Access to a quality childcare facility
on or near campus at competitive cost2014 2,735 3.2 0.90 46.2% 37.5% 8.4% 7.9%
2008 2,827 3.3 0.86 50.2% 36.5% 6.7% 6.6%
e. Tuition waiver or benefit for dependents of employees
2014 2,747 3.6 0.69 65.6% 27.6% 4.5% 2.2%
2008 2,832 3.7 0.61 71.0% 24.5% 3.0% 1.5%g. Domestic partner benefits 2014 2,720 3.2 0.98 51.4% 30.3% 7.9% 10.4%
2008 2,800 3.1 1.02 45.0% 32.0% 10.7% 12.3%
i. Employee assistance programs (e.g., for personal issues like coping with family, financial, or substance-abuse problems)
2014 2,754 3.5 0.68 55.3% 36.9% 6.4% 1.3%
2008 2,835 3.4 0.70 50.9% 40.4% 6.7% 2.0%
k. Proactive wellness programs (e.g., weight loss, healthy lifestyle education, smoking cessation)
2014 2,757 3.4 0.71 52.0% 38.3% 7.8% 1.9%
2008 2,843 3.4 0.71 53.7% 37.3% 7.2% 1.8%
m. Campus Health Services (e.g., appointments for minor care; physical therapy; pharmacy)
2014 2,740 3.3 0.79 50.0% 36.6% 9.9% 3.4%
2008 NA NA NA NA Na NA NA
o. Telecommuting options2014 2,730 3.4 0.77 52.7% 35.4% 9.0% 2.9%
2008 2,806 3.3 0.77 49.6% 38.1% 9.3% 2.9%
2014 SWBS Annotated Questionnaire Page 42 of 51

I9. In thinking about your own situation over the next five years, how likely would you be to use:*
Year N Mean Stdev 4: Very Likely
3: Somewhat
Likely
2: Not Very
Likely
1: Not At All Likely
Not Applicable
a. A campus childcare facility if it were available at a cost comparable to what you could find elsewhere in your community
2014 1,355 2.4 1.26 28.6% 19.6% 12.6% 39.1%50.8%
(of 2,754)
2008 1,552 1.8 0.89 32.6% 18.7% NA 48.7% 45.1%(of 2,829)
c. A tuition waiver or benefit for your dependent children or spouse to attend NC State if it were available
2014 2,043 3.2 1.06 53.6% 23.4% 9.9% 13.1%25.8%
(of 2,754)
2008 2,176 2.4 0.80 57.3% 22.7% NA 20.0% 23.0%(of 2,827)
I10. In thinking about your own situation over the next few years, how much interest do you think you would have in participating in or using:
Year N Mean Stdev 4: A Great Deal 3: Some 2: A Little 1: None At
All
a. Informal or individual proactive wellness programs available through NC State (e.g., individual nutrition/wellness coaching and/or programs that you participate in on your own time)
2014 2,754 2.7 1.05 28.6% 35.0% 19.1% 17.3%
2008 NA NA NA NA NA NA NA
c. Formal proactive wellness programs, in a group setting, available through NC State (e.g., weight loss, healthy lifestyle education, smoking cessation)
2014 2,754 2.4 1.14 22.3% 28.4% 19.2% 30.1%
2008 NA NA NA NA NA NA NA
e. Campus Health Services for yourself (e.g., appointment for minor care; physical therapy; pharmacy), assuming there would be a small fee similar to your co-pay
2014 2,746 2.7 1.17 33.6% 26.4% 15.8% 24.2%
2008 NA NA NA NA NA NA NA
g. A computer purchase program that allows you to use a payroll deduction plan to buy a new computer through the NC State Bookstore
2014 2,748 2.8 1.13 34.0% 28.5% 16.7% 20.9%
2008 NA NA NA NA NA NA NA
2014 SWBS Annotated Questionnaire Page 43 of 51

Section J: Campus Infrastructure and Physical Environment
J1. There is sufficient clerical/secretarial/administrative support in my department to get our work done.
2014(N = 2,600)Mean = 2.9
Stdev = 0.85
2008(N = 2,686)Mean = 3.0
Stdev = 0.80
4: Strongly agree 21.3% 23.2%
3: Agree 51.3% 54.9%
2: Disagree 18.5% 15.6%
1: Strongly disagree 8.8% 6.3%
Does not apply 5.6% (of 2,754) 5.2% (of 2,833)
J2. There is sufficient technical support in my department to get our work done.
2014(N = 2,663)Mean = 2.9
Stdev = 0.80
2008(N =2,711)Mean = 2.9
Stdev = 0.73
4: Strongly agree 20.7% 18.8%
3: Agree 55.7% 59.5%
2: Disagree 16.9% 17.2%
1: Strongly disagree 6.6% 4.4%
Does not apply 3.3% (of 2,755) 4.0% (of 2,823)
2014 SWBS Annotated Questionnaire Page 44 of 51

J3. In general, how satisfied are you with: Year N Mean Stdev 4: Very
Satisfied3:
Somewhat Satisfied
2: Dis-satisfied
1: Very Dis-
satisfiedDon’t Know
Does Not
Apply
a. Your office, lab,or work spacearea in general
2014 2,674 3.1 0.78 31.1% 53.0% 10.9% 5.0%0.4%
(of 2,752)
2.4%(of
2,752)
2008 2,752 3.0 0.83 28.4% 51.7% 13.2% 6.8% 0.5%(of 2,840)
2.6%(of
2,840)
c. Your access to a computer at work to check email, get information posted on the NC State web site, etc.
2014 2,712 3.6 0.60 61.7% 35.1% 1.9% 1.3%0.2%
(of 2,751)
1.2%(of
2,751)
2008 2,753 3.5 0.63 60.7% 34.8% 2.8% 1.6% 0.8%(of 2,841)
2.3%(of
2,841)
e. Maintenance of the building(s) where you typically work
2014 2,673 3.1 0.81 31.5% 49.7% 13.3% 5.5%0.3%
(of 2,751)
2.5%(of
2,751)
2008 2,747 3.0 0.78 27.9% 53.6% 13.8% 4.7% 0.4%(of 2,832)
2.6%(of
2,832)
g. Condition of the infrastructure in the building(s) where you typically work
2014 2,668 3.0 0.85 28.7% 48.8% 15.6% 6.9%0.5%
(of 2,748)
2.4%(of
2,748)
2008 2,718 2.9 0.82 23.5% 52.6% 17.0% 6.8% 0.9%(of 2,823)
2.8%(of
2,823)
i. Availability of up-to-date equipment to do your job
2014 2,704 3.2 0.71 34.8% 52.8% 10.1% 2.3%0.1%
(of 2,748)
1.5%(of
2,748)
2008 2,777 3.2 0.72 31.9% 53.9% 11.5% 2.7% 0.4%(of 2,832)
1.6%(of
2,832)
k. Availability of basic supplies you need to do your job
2014 2,718 3.3 0.63 41.0% 53.1% 4.7% 1.3%0.1%
(of 2,746)
0.9%(of
2,746)
2008 2,781 3.3 0.62 38.0% 55.8% 4.9% 1.3% 0.2%(of 2,829)
1.5%(of
2,829)
2014 SWBS Annotated Questionnaire Page 45 of 51
J3. In general, how satisfied are you with: (continued)
Year N Mean Stdev 4: Very Satisfied
3: Somewhat Satisfied
2: Dis-satisfied
1: Very Dis-
satisfiedDon’t Know
Does Not
Apply
m. Availability ofrooms oncampus to have small meetings, workshops, etc.
2014 2,064 3.2 0.65 30.4% 59.6% 8.1% 1.9%2.3%
(of 2,752)
22.7%(of
2,752)
2008 2,205 3.1 0.70 27.7% 58.3% 11.2% 2.9% 2.7%(of 2,827)
19.3%(of
2,827)o. Availability of
rooms on campusto have large meetings, workshops, etc.
2014 1,906 3.1 0.71 27.8% 57.8% 11.2% 3.2%3.7%
(of 2,750)
26.9%(of
2,750)
2008 2,048 3.0 0.75 25.3% 56.3% 13.9% 4.4% 4.4%(of 2,822)
23.0%(of
2,822)q. Availability of
informal placesto relax on campus (e.g., during lunch, your breaks, etc.)
2014 2,190 2.9 0.79 22.2% 54.7% 17.0% 6.1%2.1%
(of 2,749)
18.2%(of
2,749)
2008 2,292 2.7 0.87 14.5% 48.1% 25.4% 12.0% 2.4%(of 2,821)
16.3%(of
2,821)s. Dining options on
campus 2014 2,070 2.9 0.76 18.6% 56.7% 19.3% 5.3%3.4%
(of 2,747)
21.3%(of
2,747)
2008 2,032 2.7 0.78 12.7% 54.4% 25.2% 7.6% 5.2%(of 2,816)
22.7%(of
2,816)u. Availability
ofparking
2014 2,349 2.5 0.93 12.6% 45.3% 24.1% 18.0% 0.7%(of 2,743)
13.7%(of
2,743)
2008 2,510 2.4 0.96 11.1% 39.7% 25.9% 23.4% 0.8%(of 2,820)
10.2%(of
2,820)
w. Cost of parking
2014 2,250 2.0 0.88 4.6% 24.3% 36.3% 34.8% 1.1%(of 2,749)
17.1%(of
2,749)
2008 2,292 2.0 0.93 7.2% 21.4% 35.0% 36.4% 1.3%(of 2,818)
17.4%(of
2,818)y. Wolfline bus
(e.g., timingand routes of the campus bus system)
2014 1,097 3.1 0.60 20.5% 69.8% 7.6% 2.1% 11.3%(of 2,746)
48.8%(of
2,746)
2008 1,260 2.9 0.65 14.7% 69.3% 12.2% 3.8% 15.5%(of 2,803)
39.5%(of
2,803)
2014 SWBS Annotated Questionnaire Page 46 of 51

J3. In general, how satisfied are you with: (continued)
Year N Mean Stdev 4: Very Satisfied
3: Somewhat Satisfied
2: Dis-satisfied
1: Very Dis-
satisfiedDon’t Know
Does Not
Apply
aa. Safety of your immediate work environment
2014 2,586 3.3 0.60 33.1% 61.4% 4.2% 1.3% 0.7%(of 2,747)
5.1%(of
2,747)
2008 2,628 3.1 0.61 22.5% 67.9% 7.3% 2.2% 0.9%(of 2,819)
5.9%(of
2,819)cc. Campus safety
overall 2014 2,298 3.1 0.57 23.4% 68.8% 6.6% 1.2% 2.0%(of 2,744)
14.2%(of
2,744)
2008 2,327 2.9 0.60 12.9% 71.8% 12.4% 2.8% 3.2%(of 2,814)
14.1%(of
2,814)
ee. Upkeep of campus grounds
2014 2,346 3.4 0.54 38.5% 59.0% 2.2% 0.3% 1.0%(of 2,749)
13.6%(of
2,749)
2008 2,440 3.2 0.54 23.9% 70.7% 4.4% 1.0% 1.3%(of 2,818)
12.1%(of
2,818)gg. The amount
of “greenspace”(trees, grassyareas) on campus
2014 2,331 3.3 0.61 33.3% 59.8% 5.8% 1.0% 1.5%(of 2,744)
13.6%(of
2,744)
2008 2,441 3.0 0.71 19.8% 61.3% 14.8% 4.1% 1.6%(of 2,815)
11.7%(of
2,815)
J4. How important do you think it is for NC State University to have a commitment to the environment and sustainability: 2014 N = 2,724 Mean = 3.7 Stdev = 0.51 (2008 NA)
4: Very important 75.5%
3: Somewhat important 22.7%
2: Not very important 1.3%
1: Not at all important 0.6%
2014 SWBS Annotated Questionnaire Page 47 of 51
Section K: Campus Activities
K2. About how often in the past year have you:
Year NOnce a
Week or More
Once or Twice per
Month
Every Few
Months
Once or Twice per
YearNever
a. Participated in physical recreation activities on campus
2014 2,744 10.7% 4.5% 6.4% 13.8% 64.6%
2008 NA NA NA NA NA NA
c. Used outdoor physical recreational space on campus (e.g., fields, tennis courts, greenway)
2014 2,733 8.6% 9.0% 9.0% 13.8% 59.7%
2008 2,547 3.3% 5.2% 6.8% 11.5% 73.1%
e. Participated in proactive wellness programs on campus (e.g., weight loss, healthy lifestyle education, smoking cessation)
2014 2,731 1.9% 2.5% 4.0% 11.4% 80.2%
2008 NA NA NA NA NA NA
g. Attended an ARTS NC STATE program (i.e., Center State, Crafts Center, Dance Program, Gregg Museum of Art & Design, Music Department, University Theatre performances, exhibitions, programs)
2014 2,742 1.3% 2.8% 8.9% 20.3% 66.7%
2008 2,531 1.1% 3.2% 9.0% 18.6% 68.1%
i. Attended a cultural activity on campus, excluding ARTS NC STATE programs (e.g., festival, speaker, film)
2014 2,740 1.1% 2.6% 9.7% 22.1% 64.5%
2008 NA NA NA NA NA NA
k. Attended an NC States Wolfpack athletics event2014 2,739 4.0% 8.1% 14.6% 31.1% 42.1%
2008 2,549 3.0% 7.3% 12.7% 23.1% 53.8%
2014 SWBS Annotated Questionnaire Page 48 of 51
K1. In general, how satisfied are you with: Year N Mean Stdev 4: Very
Satisfied3:
Satisfied2: Dis-
satisfied1: Very
Dis-satisfied
Don’t Know
a. Physical recreation activities available on campus
2014 1,639 3.1 0.59 22.8% 68.6% 7.0% 1.6%40.4%
(of 2,749)
2008 NA NA NA NA NA NA NA NA
c. Physical recreational space around campus (e.g., fields, tennis courts, greenway, etc.)
2014 1,758 3.2 0.54 24.1% 70.1% 5.1% 0.7%36.0%
(of 2,745)
2008 1,243 3.1 0.50 18.0% 76.6% 4.3% 1.0% 53.5%(of 2,675)
e. Formal, proactive wellness programs available through NC State (e.g., weight loss, healthy lifestyle education, smoking cessation)
2014 1,443 3.0 0.56 14.6% 73.0% 11.1% 1.3%47.5%
(of 2,748)
2008 NA NA NA NA NA NA NA NA
g. ARTS NC STATE programs (i.e., Center Stage, Crafts Center, Dance Program, Gregg Museum of Art & Design, Music Department, University Theatre performances, exhibitions, programs)
2014 1,473 3.2 0.49 22.5% 73.7% 3.3% 0.4%46.3%
(of 2,745)
2008 1,244 3.1 0.52 19.7% 75.2% 3.9% 1.3% 53.5%(of 2,675)
i. Other cultural activities available on campus, excluding ARTS NC STATE programs (e.g., festivals, speakers, films)
2014 1,449 3.1 0.50 18.5% 75.8% 4.9% 0.8%47.2%
(of 2,743)
2008 NA NA NA NA NA NA NA NA
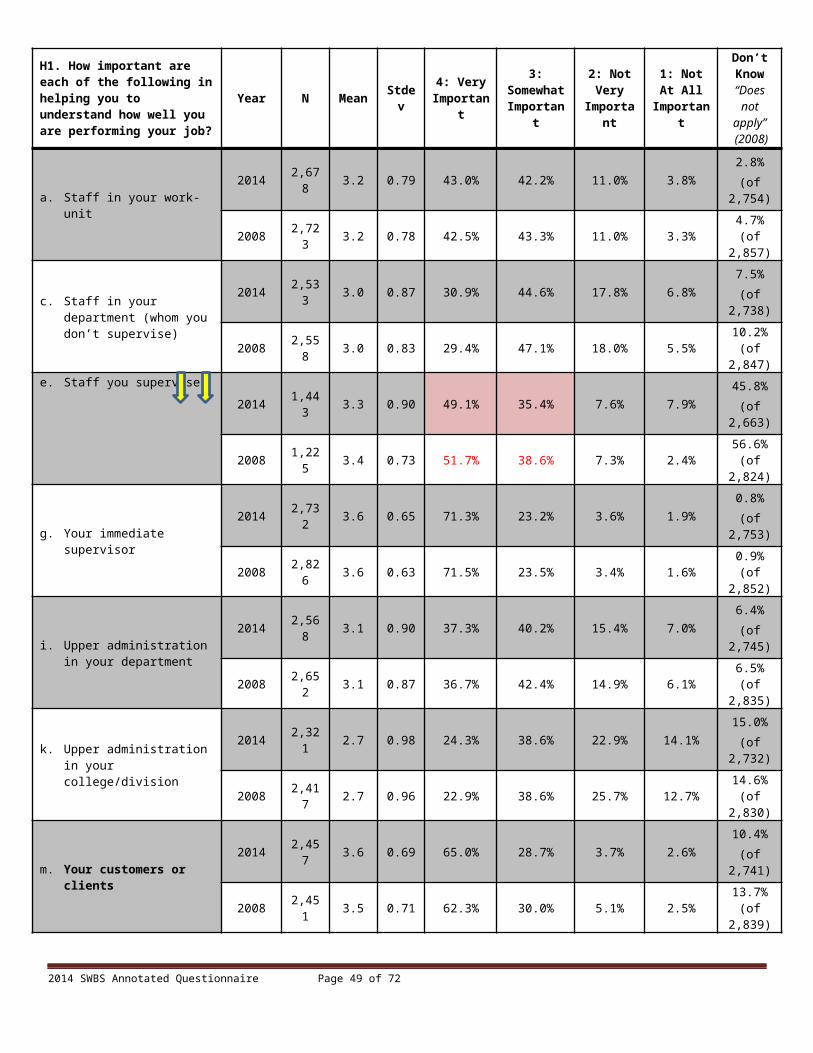
K3. To what extent does your work location limit your ability to participate in activities on campus that you would like to do?
2014(N = 2,501)Mean = 2.5
Stdev = 1.19
2008(N = 2,444)Mean = 2.5
Stdev = 1.20
4: A great deal 28.4% 28.6%
3: Some 27.3% 25.9%
2: A little 14.8% 14.6%
1: Not at all 29.6% 31.0%
Does not apply—generally not interested in participating in such activities 9.1% (of 2,750) 11.7% (of 2,767)
Section L: Demographics
L1. On which part of campus do you spend most of you work time?
2014(N = 2,693)
2008(N = 2,717)
a. Centennial campus 15.6% 9.6%
b. North campus (north of the train tracks) 24.2% 27.1%
c. Central campus (between the train tracks and Western Blvd) 24.2% 24.1%
d. South campus (south of Western Blvd [not including Centennial campus]) 6.0% 8.3%
e. College of Veterinary Medicine (on Hillsborough St.) 6.8% 6.5%
f. Carter Finley stadium/arena area 0.7% 0.9%
g. Off campus in Wake County 3.3% 4.3%
h. Outside of Wake County 14.4% 14.1%
i. Do not work in any one particular area 4.8% 5.1%
L2. Do you have a spouse/partner that currently works at NC State University?
2014(N = 2,737)
2008(N = 2,817)
Yes 8.1% 9.0%
No 91.9% 91.0%
L3. Are you and/or your spouse a protected veteran? 2014 N = 2,705 (2008 NA)
Yes, I am a protected veteran 3.8%
Yes, I am the spouse of a protected veteran 2.3%
Yes, both my spouse and I are protected veterans 0.2%
No 93.7%
2014 SWBS Annotated Questionnaire Page 49 of 51
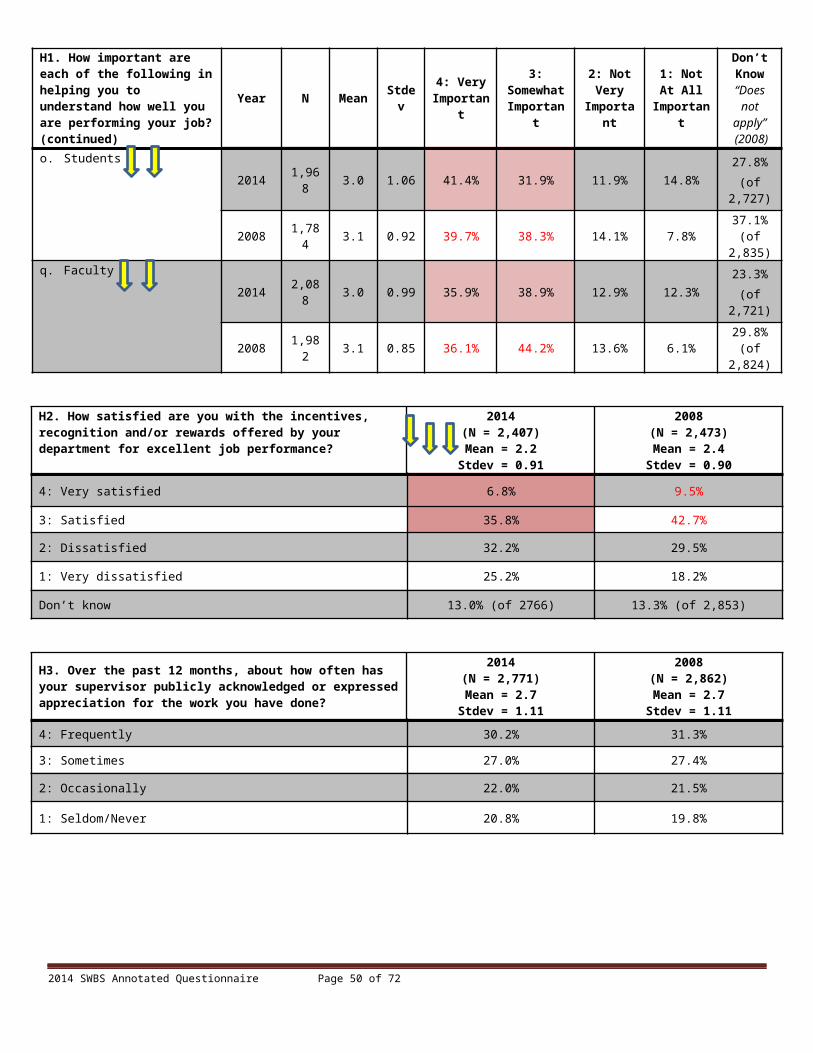
L4. Do you have a qualifying disability covered by the Americans with Disabilities Act (ADA)?
2014(N = 2,594)
2008(N = 2,813)
Yes 2.5% 2.1%
No 97.5% 94.0%
Don’t Know 5.2% (of 2,735) 3.9%
L5. (Paper Survey only) Do you self-identify as a member of the gay, lesbian, bisexual, transgender community? 2014 N = 269 (2008 NA)
Yes 0.7%
No 99.3%
L5a. (Online Survey only) Do you self-identify as a member of the gay, lesbian, bisexual, queer (GLBQ) community? 2014 N = 2,464 (2008 NA)
Yes 4.2%
No 93.8%
Prefer not to answer 2.0%
L5b. (Online Survey only) Do you self-identify as a member of the transgender community? 2014 N = 2,463 (2008 NA)
Yes 0.0%
No 98.3%
Prefer not to answer 1.6%
Do you personally identify as a member of the Gay, Lesbian, Bisexual, Transgender (GLBT) community? 2008 N = 2,807 (2014 NA)
Yes 3.4%
No 96.6%
L6. Is English your native language? 2014(N = 2,742)
2008(N = 2,828)
Yes 94.2% 93.4%
No 5.8% 6.6%
2014 SWBS Annotated Questionnaire Page 50 of 51

Section M: Final Comments
M1. When you think about your own personal experiences at NC State University, what would you say are the most positive aspects of being a staff member here?
M2. What do you think are the most significant changes that should be made at NC State University to improve or enhance the quality of your work life here?
2014 SWBS Annotated Questionnaire Page 51 of 51