oil spill risk frequency report - tullow oil
TRANSCRIPT
Annex C
Oil Spill Risk Frequency Report

Protecting life by shaping design and operation of hazardous facilities
10497 Town & Country Way, Suite 800, Houston, Texas, 77024, USA t: 713 647 7929, f: 713 467 9757, Email: [email protected], Web: www.ircrisk.com
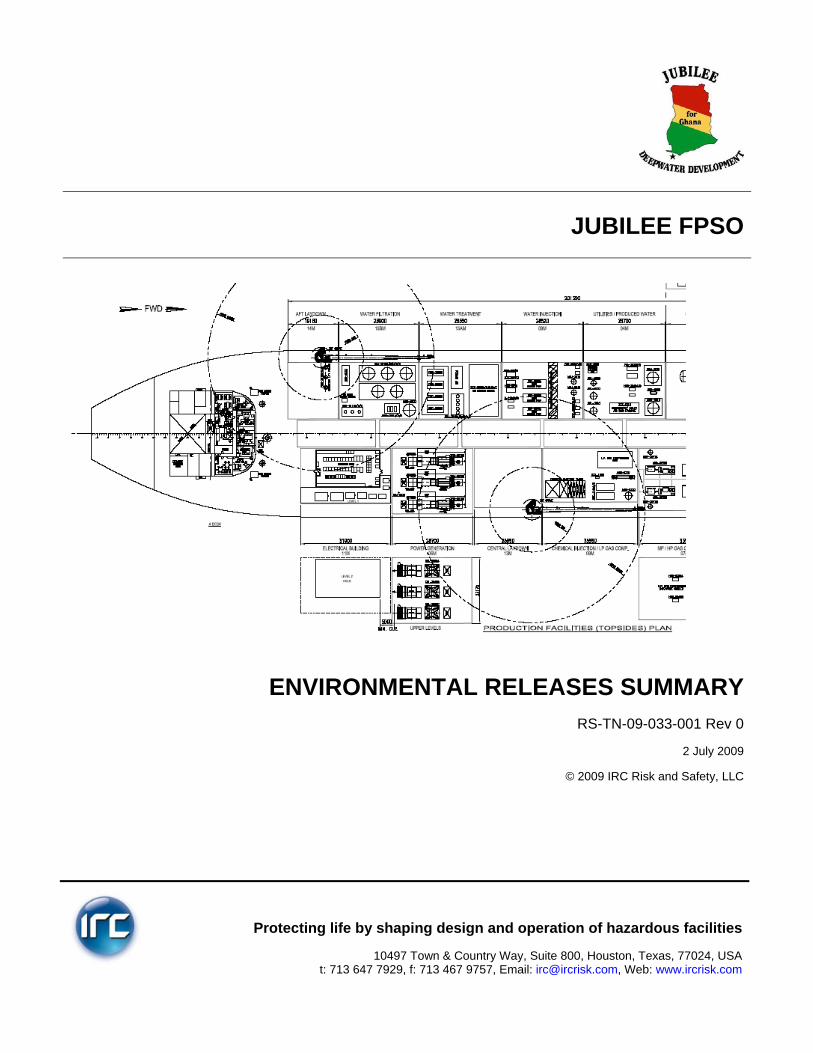
JUBILEE FPSO
ENVIRONMENTAL RELEASES SUMMARYRS-TN-09-033-001 Rev 0
2 July 2009
© 2009 IRC Risk and Safety, LLC

Tullow Oil Jubilee FPSO: Environmental Releases Summary Document: RS-TN-09-033-001 Rev 0 Date: 2 July 09
Page 1
Title:
Jubilee FPSO: Environmental Releases Summary
Report Number:
RS-TN-09-033-001 Rev 0
Client:
Tullow Oil
IRC Office:
Houston
Keywords: FPSO, Frequency, Exceedance
Country: Ghana
Document Revision Status
Revision Description Author Review Approval Date
A Draft C Hafner J Goddard 2 July 09
0 Issued for Use C Hafner J Kill J Kill 2 July 09
This report has been prepared for use by, and is confidential to Tullow Oil for the specific purpose to which it refers. No responsibility is accepted to any third party. This report is copyrighted, and neither the whole nor any part of this report or the information contained in it may be published or disclosed to third parties without the prior written approval of IRC and/or Tullow Oil.
Tullow Oil Jubilee FPSO: Environmental Releases Summary Document: RS-TN-09-033-001 Rev 0 Date: 2 July 09
Page 2
Table of Contents
ABBREVIATIONS .................................................................................................................................... 3
1 INTRODUCTION ........................................................................................................................ 4 1.1 Background ................................................................................................................................. 4
1.2 Objective ..................................................................................................................................... 4
1.3 Scope .......................................................................................................................................... 4
2 METHOD .................................................................................................................................... 5 2.1 Method Overview ........................................................................................................................ 5
2.2 Release Scenarios ...................................................................................................................... 5
2.3 Assumptions ............................................................................................................................... 5
3 ENVIRONMENTAL RELEASE SCENARIOS ............................................................................ 8 3.1 Turret Leak .................................................................................................................................. 8
3.2 Riser Leak ................................................................................................................................. 12
3.3 Wellhead, Manifold, Flowline Leak ........................................................................................... 15
3.4 Ship Collisions .......................................................................................................................... 18
3.5 Transfer Hose Release ............................................................................................................. 22
3.6 Bunkering .................................................................................................................................. 26
3.7 FPSO Hull Damage .................................................................................................................. 30
3.8 Cargo Tank Explosion ............................................................................................................... 32
4 SUMMARY OF RESULTS ........................................................................................................ 34
5 REFERENCES ......................................................................................................................... 39

Tullow Oil Jubilee FPSO: Environmental Releases Summary Document: RS-TN-09-033-001 Rev 0 Date: 2 July 09
Page 3
ABBREVIATIONS
FPSO Floating Production Storage and Offloading
HAZID Hazard Identification
SCSSV Surface Controlled Subsea Safety Valve
Tullow Oil Jubilee FPSO: Environmental Releases Summary Document: RS-TN-09-033-001 Rev 0 Date: 2 July 09
Page 4
1 INTRODUCTION
1.1 Background
Phase I of the Jubilee Field Development includes initial development plans focused on a subsea development of 9 production wells, 6 water injection wells and 2 gas injection wells tied back to the Jubilee Floating Production Storage and Offloading vessel (FPSO). The FPSO is moored in position via an external turret and thus weathervanes with the prevailing sea conditions. Current plans forecast the initial subsea infrastructure to be installed between the fourth quarter of 2009 and the first quarter of 2010. The modularized production facilities for the Jubilee FPSO are anticipated to process 160,000 barrels per day of gross liquids, 120,000 of which are crude oil. Associated gas will be dehydrated and initially reinjected into the reservoir with a future option to export via a gas pipeline.
The development of the Jubilee Field operated by Tullow Ghana Limited will cross two lease blocks offshore Ghana, West Africa. The Deep Water Tano Block is operated by Tullow Ghana Limited and the West Cape Three Points Block is operated by Kosmos Energy. The FPSO facility will be designed for operation in approximately 1,300 meters of water depth and is designed for a service life of 20 years.
Tullow has contracted IRC Risk and Safety (IRC) to conduct an assessment of potential environmental releases.
1.2 Objective
The objective of this report is to summarize the frequencies and sizes of oil releases from the Jubilee FPSO calculated in the Environmental Releases Assessment [1].
1.3 Scope
The scope of this study includes the following facilities:
• Jubilee FPSO
• Export Tanker
• Passing Vessels
• Attendant Vessels
• Fishing Vessels
• Wellheads
• Subsea Manifolds

Tullow Oil Jubilee FPSO: Environmental Releases Summary Document: RS-TN-09-033-001 Rev 0 Date: 2 July 09
Page 5
• Risers
• Production Flowlines
2 METHOD
2.1 Method Overview
This assessment considered a number of environmental release scenarios. The methodology is different for each scenario and is based on the source of the release. Methodologies for individual scenarios are presented in the scenario summary sheets in Section 3.
2.2 Release Scenarios
This assessment considers a number of environmental release scenarios derived from the Environmental hazard identification (HAZID) study [2] as well as scenarios provided by ERM [3]. The scenarios considered are:
• Turret leak
• Riser leak
• Wellhead / manifold leak / flowline leak
• Ship collisions
• Transfer hose release
• Bunkering hose release
• Blowouts
• FPSO hull damage
• Cargo tank explosion
2.3 Assumptions
Table 2.1 presents the assumptions made for the calculations.

Tullow Oil Jubilee FPSO: Environmental Releases Summary Document: RS-TN-09-033-001 Rev 0 Date: 2 July 09
Page 6
Table 2.1: Assumptions
Assumptions Basis
General Assumptions
Oil density of 800kg/m3 Typical for stabilized crude
6.3bbls/m3 of oil Generic conversion [4]
Turret Leak
Probability of detecting 10mm leak in 2 minutes is 0.01 Small leaks take longer to detect as they may not cause a process upset or picked up by gas detection Probability of detecting 10mm leak in 360 minutes is 0.99
Probability of detecting 30mm or 100mm leak in 2 minutes is 1.0
A 30mm leak would be detected quickly by gas detection or a process upset
Riser inventory of 160m3 Isolation at the riser base as fail open actuated valve could be closed
Riser Leak
Probability of detecting 10mm leak in 2 minutes is 0.01 Small leaks take longer to detect as they may not cause a process upset or picked up by gas detection Probability of detecting 10mm leak in 360 minutes is 0.99
Probability of detecting 30mm or 100mm leak in 2 minutes is 1.0
A 30mm or 100mm leak would be likely detected quickly by a process upset.
Riser inventory of 160m3 Isolation at the riser base as fail open actuated valve could be closed
For 10mm leaks, only 25% of inventory of subsea risers and flowlines releases to the sea
For small leaks it is likely that the facility would isolate the well and de-inventory the lines topsides instead of isolating subsea allowing the entire inventory to release to the sea
Wellhead, Manifold, Flowline Leak
Probability of detecting 10mm leak in 360 minutes is 0.01 Small leak from 1100m underwater can remain undetected for a long period of time, until visible oil sheen appears on water surface
Probability of detecting 10mm leak in 1440 minutes is 0.99
Probability of detecting 30mm or 100mm leak in 2 minutes is 1.0
A 30mm leak would be detected quickly by gas detection or a process upset
Riser inventory of 160m3 Isolation at the riser base as fail open actuated valve could be closed

Tullow Oil Jubilee FPSO: Environmental Releases Summary Document: RS-TN-09-033-001 Rev 0 Date: 2 July 09
Page 7
Assumptions Basis
For 10mm leaks, only 25% of inventory of subsea risers and flowlines releases to the sea
For small leaks it is likely that the facility would shut in the well and de-inventory the lines topsides instead of isolating subsea allowing the entire inventory to release to the sea
Ship Collision
Fishing vessel impacts do not lead to a release No evidence of fishing vessels large enough to damage the FPSO
Export tanker will not drift impact FPSO during offloading operations
Safeguards in place and the environmental conditions make this a non-credible event
Blowouts
Development wells = 5 Assumed number that could be drilled in a year
Completions = 4 Assumed number that could be completed in a year
Wireline activities = 5 Assumed one per well
Workovers = 1 Assumed one per year
Transfer Hose Releases
Small release = 3bbls Quick disconnect coupling minimizes spilt volume
Medium release = 49bbls Minor hose damage leads to release of 10% of hose volume
Large release = 902bbls Hose rupture releases 100% of hose volume plus amount of transfer rate until the operation is stopped
Transfer can be stopped in 30 seconds Centrifugal pumps can be shut off quickly
FPSO Hull Damage
Frequencies and spill sizes Based on historical data [10]
Cargo Tank Explosion
Frequencies and spill sizes Based on historical data [10]
Bunkering
Frequencies and spill sizes Based on historical data [14] [15]
Tullow Oil Jubilee FPSO: Environmental Releases Summary Document: RS-TN-09-033-001 Rev 0 Date: 2 July 09
Page 8
3 ENVIRONMENTAL RELEASE SCENARIOS
3.1 Turret Leak
3.1.1 Scenario Description
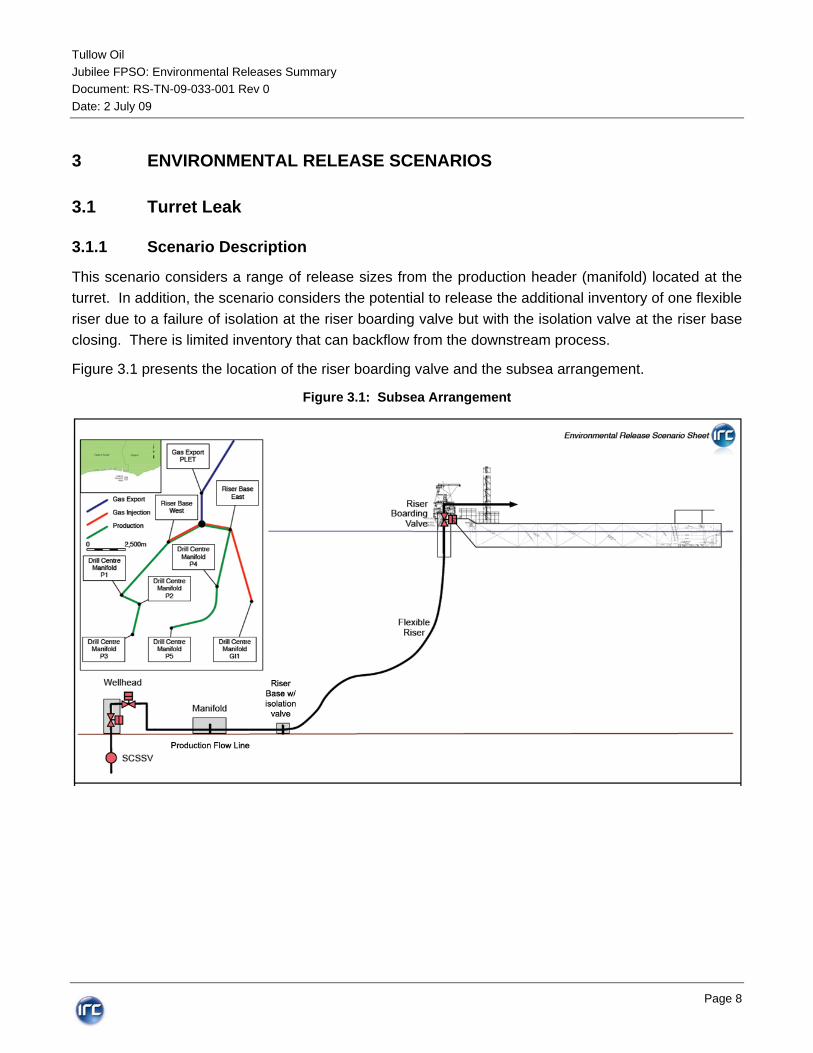
This scenario considers a range of release sizes from the production header (manifold) located at the turret. In addition, the scenario considers the potential to release the additional inventory of one flexible riser due to a failure of isolation at the riser boarding valve but with the isolation valve at the riser base closing. There is limited inventory that can backflow from the downstream process.
Figure 3.1 presents the location of the riser boarding valve and the subsea arrangement.
Figure 3.1: Subsea Arrangement

Tullow Oil Jubilee FPSO: Environmental Releases Summary Document: RS-TN-09-033-001 Rev 0 Date: 2 July 09
Page 9
3.1.2 Calculation Basis
The size and frequency of release is determined by the following [1]:
Where,
R = Total oil released (bbls)
X = Manifold inventory (bbls)
Y = Flexible riser Inventory (bbls)
PSD = Probability of failure of Process Shutdown Valve
Q = Leak flow rate (bbls/min)
T = Time to detect leak (min)
Release sizes are taken from the FRA [5] and Riser SSIV Study [6] as follows:
• 10mm (<20mm)
• 30mm (20mm – 60mm)
• 100mm (>60mm)
3.1.3 Results

Tullow Oil Jubilee FPSO: Environmental Releases Summary Document: RS-TN-09-033-001 Rev 0 Date: 2 July 09
Page 10
Figure 3.2 presents the frequencies of different oil spill sizes for releases from the turret.

Tullow Oil Jubilee FPSO: Environmental Releases Summary Document: RS-TN-09-033-001 Rev 0 Date: 2 July 09
Page 11
Figure 3.2: Turret Release Exceedances
Turret Leak Exceedance Chart
1
10
100
1,000
10,000
1.00E-04 1.00E-03 1.00E-02 1.00E-01 1.00E+00
Frequency / Yr of Exceeding Spill Size
Spill
Siz
e (b
bls)
Tullow Oil Jubilee FPSO: Environmental Releases Summary Document: RS-TN-09-033-001 Rev 0 Date: 2 July 09
Page 12
3.2 Riser Leak
3.2.1 Scenario Description
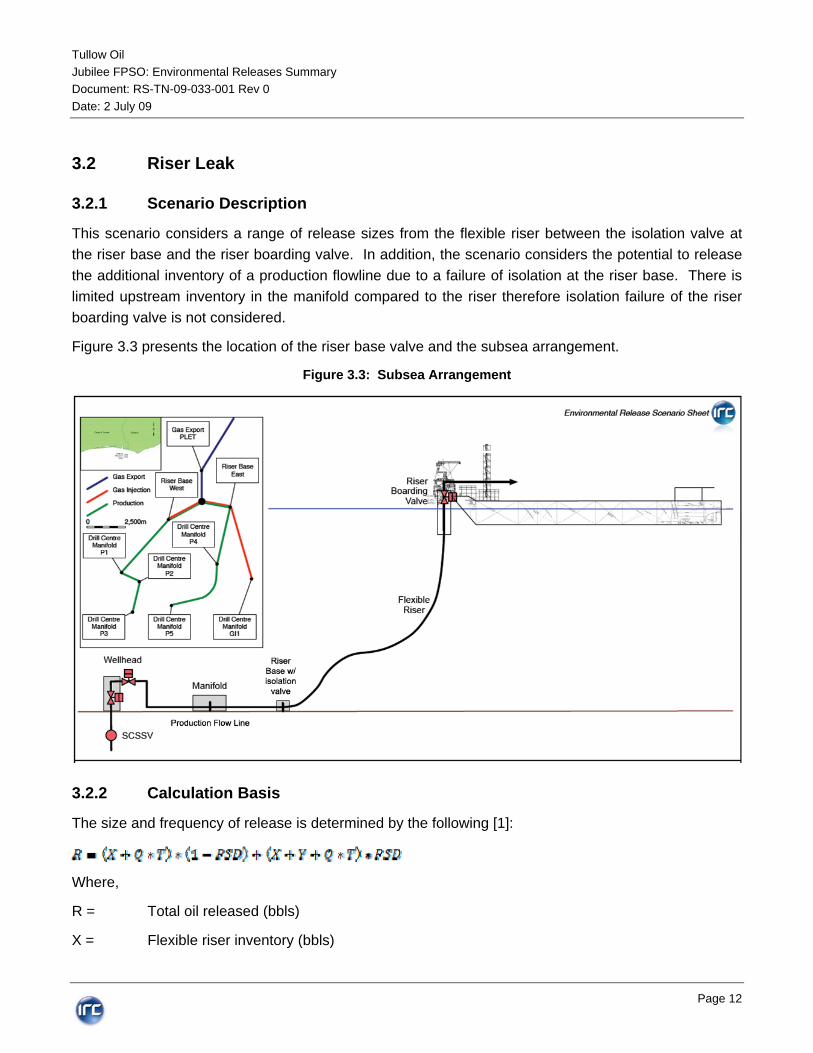
This scenario considers a range of release sizes from the flexible riser between the isolation valve at the riser base and the riser boarding valve. In addition, the scenario considers the potential to release the additional inventory of a production flowline due to a failure of isolation at the riser base. There is limited upstream inventory in the manifold compared to the riser therefore isolation failure of the riser boarding valve is not considered.
Figure 3.3 presents the location of the riser base valve and the subsea arrangement.
Figure 3.3: Subsea Arrangement
3.2.2 Calculation Basis
The size and frequency of release is determined by the following [1]:
Where,
R = Total oil released (bbls)
X = Flexible riser inventory (bbls)

Tullow Oil Jubilee FPSO: Environmental Releases Summary Document: RS-TN-09-033-001 Rev 0 Date: 2 July 09
Page 13
Y = Production flowline Inventory (bbls)
H = Leak Hole size (10mm, 30mm, 100mm)
PSD = Probability of failure of Process Shutdown Valve
Q = Leak flow rate (bbls/min)
T = Time to detect leak (min)
Release sizes are taken from the FRA [5] and Riser SSIV Study [6] as follows:
• 10mm (<20mm)
• 30mm (20mm – 60mm)
• 100mm (>60mm)
3.2.3 Results
Figure 3.4 presents the frequencies of different oil spill sizes for releases from the riser.

Tullow Oil Jubilee FPSO: Environmental Releases Summary Document: RS-TN-09-033-001 Rev 0 Date: 2 July 09
Page 14
Figure 3.4 Riser Release Exceedances
Riser Leak Exceedance Chart
1
10
100
1,000
10,000
1.00E-05 1.00E-04 1.00E-03 1.00E-02 1.00E-01 1.00E+00
Frequency / Yr of Exceeding Spill Size
Spill
Siz
e (b
bls)

Tullow Oil Jubilee FPSO: Environmental Releases Summary Document: RS-TN-09-033-001 Rev 0 Date: 2 July 09
Page 15
3.3 Wellhead, Manifold, Flowline Leak
3.3.1 Scenario Description
This scenario considers a range of release sizes from the wellhead, manifold and production flowline between the wellhead and the isolation valve at the riser base. In addition, the scenario considers the potential to release the additional inventory of a flexible riser due to a failure of isolation at the riser base. Isolation failure at the wellhead is considered a very low frequency event with three isolation valves at the wellhead including the surface controlled sub-sea safety valve (SCSSV). Further, blowout events (loss of all wellhead isolation) are considered separately.
Figure 3.3 presents the location of the riser base valve and the subsea arrangement.
Figure 3.5: Subsea Arrangement
3.3.2 Calculation Basis
The size and frequency of release is determined by the following [1]:
Where,
R = Total oil released (bbls)
Tullow Oil Jubilee FPSO: Environmental Releases Summary Document: RS-TN-09-033-001 Rev 0 Date: 2 July 09
Page 16
X = Wellhead, manifold and production flowline inventory (bbls)
Y = Flexible Riser Inventory (bbls)
H = Leak Hole size (10mm, 30mm, 100mm)
PSD = Probability of failure of Process Shutdown Valve
Q = Leak flow rate (bbls/min)
T = Time to detect leak (min)
Release sizes are taken from the FRA [5] and Riser SSIV Study [6] as follows:
• 10mm (<20mm)
• 30mm (20mm – 60mm)
• 100mm (>60mm)
3.3.3 Results
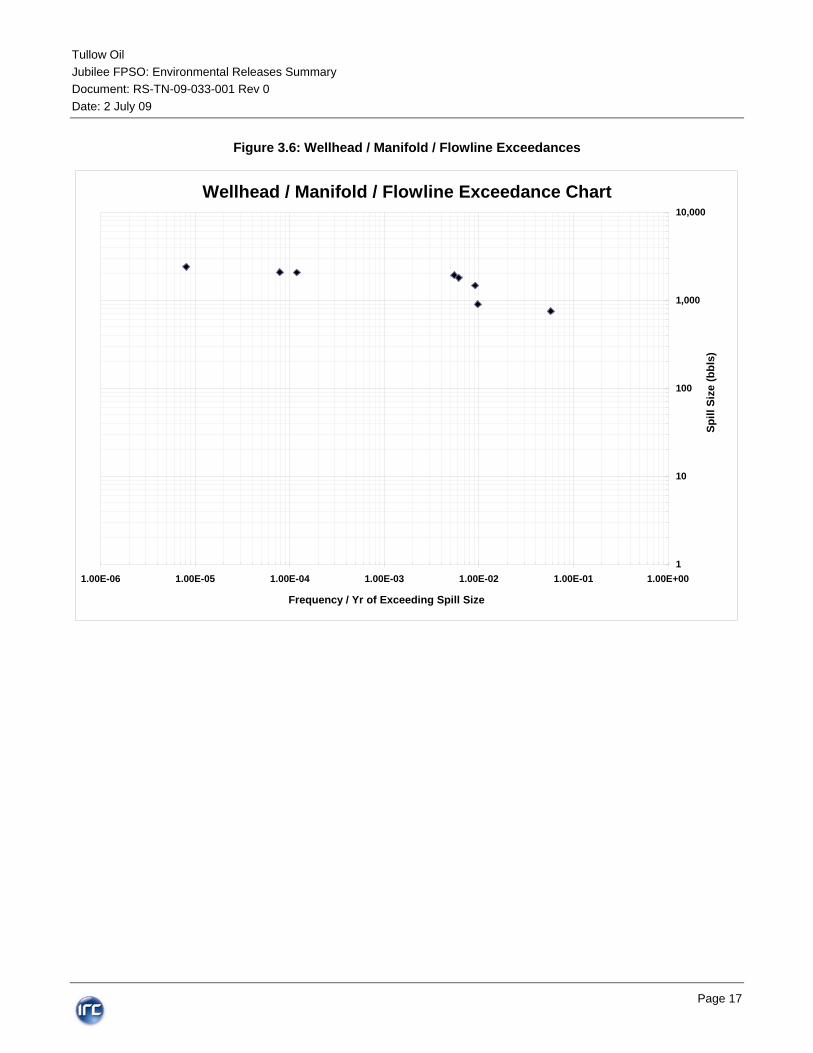
Figure 3.6 presents the frequencies of different oil spill sizes for releases from the wellhead, manifold and flowline.
Tullow Oil Jubilee FPSO: Environmental Releases Summary Document: RS-TN-09-033-001 Rev 0 Date: 2 July 09
Page 17
Figure 3.6: Wellhead / Manifold / Flowline Exceedances
Wellhead / Manifold / Flowline Exceedance Chart
1
10
100
1,000
10,000
1.00E-06 1.00E-05 1.00E-04 1.00E-03 1.00E-02 1.00E-01 1.00E+00
Frequency / Yr of Exceeding Spill Size
Spill
Siz
e (b
bls)

Tullow Oil Jubilee FPSO: Environmental Releases Summary Document: RS-TN-09-033-001 Rev 0 Date: 2 July 09
Page 18
3.4 Ship Collisions
3.4.1 Scenario Description
This scenario considers ship collisions from merchant vessels (cargo carriers, tanker carriers and Very Large Cargo Carriers (VLCC)), support vessels, fishing vessels and a collision between the FPSO and the export tanker during offloading operations. Vessel collisions that impart 40MJ or more of impact energy into the hull of the FPSO will result in a release.
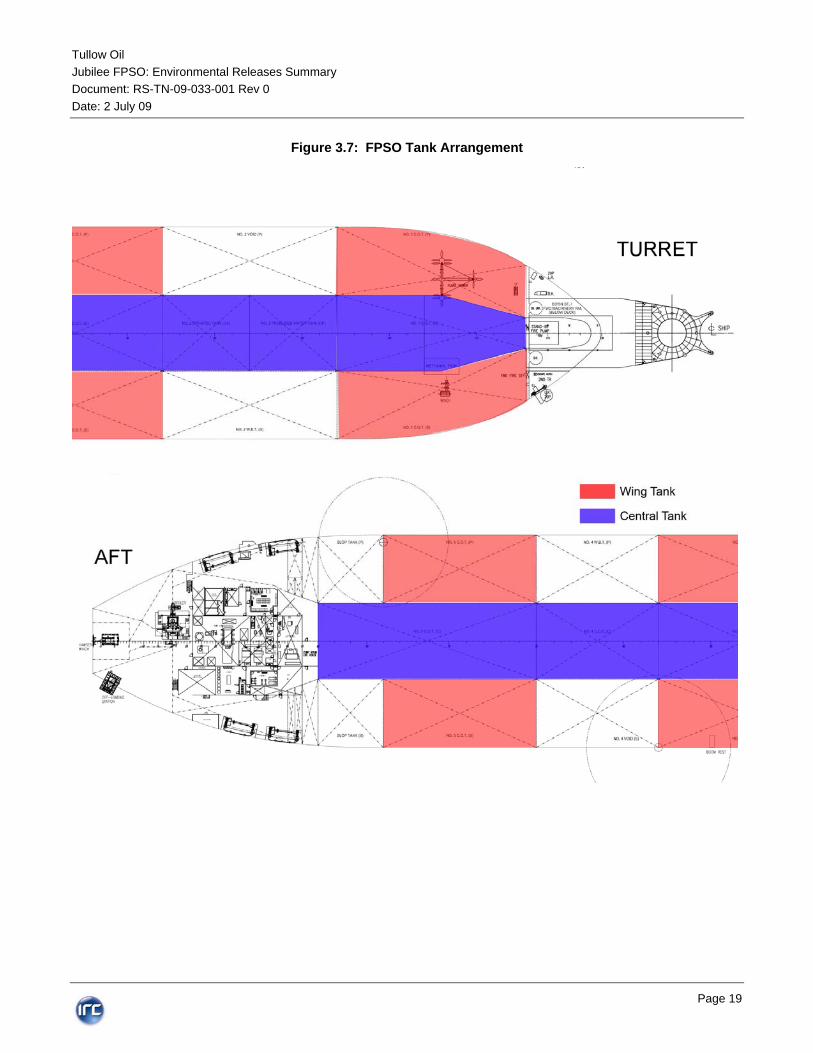
Figure 3.7 shows the arrangement of the cargo tanks of the FPSO.
The sizes of the resulting oil spills are dependent several factors that include:
• Mass (displacement) of the vessels in tonnes
• Speed of the vessels (powered or drifting)
• Ability of facility to detect and react to vessels on a collision course
• Number of cargo tanks that lose cargo
• Fill level of the cargo tanks
While merchant vessels and support vessels pose a credible risk to the FPSO, local fishing vessels and the export tanker do not. Local fishing vessels are not considered credible as they are not considered to have enough mass to allow them to impart the 40MJ required to impair the hull of the FPSO. In addition, an enforcement vessel will be on station full time to ensure that local fishing vessels do not enter the exclusion zone.
The export tanker drifting into the FPSO during transfer operations is not considered a credible scenario due to the number of safeguards in place. The export tanker will always approach the FPSO from the downwind / down current position, making it impossible for environmental conditions to push the export tanker towards the FPSO. In addition, a mooring master will board the export tanker prior to it entering the exclusion zone and will pilot the vessel in, a hold back tug will be moored to the export tanker and us sufficient bollard pull to keep it on station, a tension mooring system will be used to monitor the tension on the hawser mooring line between the export tanker and FPSO and the Multi Purpose Vessel (MPV) will be utilized as a back-up vessel and is of sufficient bollard pull to keep the export tanker on station in the event of a failure of the hold-back tug [7].
Figure 3.8 shows a diagram of the offloading operation.
Tullow Oil Jubilee FPSO: Environmental Releases Summary Document: RS-TN-09-033-001 Rev 0 Date: 2 July 09
Page 19
Figure 3.7: FPSO Tank Arrangement

Tullow Oil Jubilee FPSO: Environmental Releases Summary Document: RS-TN-09-033-001 Rev 0 Date: 2 July 09
Page 20
Figure 3.8: Offloading Operation
3.4.2 Calculation Basis
The size and frequency of release is determined by the following [1]:
Where,
R = Total oil released (bbls)
X = Inventory in affected cargo tanks (bbls)
Pfill = Probability of cargo tank fill level
Fcoll = Frequency of ship collision
The frequency of ship collision, impact energy imparted on the FPSO and quantities of oil spilt are taken from the Jubilee FPSO Ship Collision Study [8].

Tullow Oil Jubilee FPSO: Environmental Releases Summary Document: RS-TN-09-033-001 Rev 0 Date: 2 July 09
Page 21
3.4.3 Results
Figure 3.9 presents the frequencies of different oil spill sizes for releases from ship collisions.
Figure 3.9: Ship Collision Exceedances
Ship Collision Exceedance Chart
1
10
100
1,000
10,000
100,000
1,000,000
10,000,000
1.00E-06 1.00E-05 1.00E-04 1.00E-03
Frequency / Yr of Exceeding Spill Size
Spill
Siz
e (b
bls)

Tullow Oil Jubilee FPSO: Environmental Releases Summary Document: RS-TN-09-033-001 Rev 0 Date: 2 July 09
Page 22
3.5 Transfer Hose Release
3.5.1 Scenario Description
This scenario considers a release from the transfer between the FPSO and the export tanker hose during offloading operations. During cargo offloading, crude oil is transferred from the FPSO to the export tanker through a floating high integrity hose. The hose from the FPSO is a 20” 310m long portion connected to two 16” 53m portions that connect to the export tanker with, a dry quick disconnect coupling between [9].
Figure 3.10 presents a diagram of the offloading arrangement.
Figure 3.10: Offloading Operation
3.5.2 Calculation Basis
Release frequencies [1] are based on historical data of transfer hose releases from FPSOs [10]. This data categorizes releases into three sizes:
• <10bbls
• 10 – 100bbls
• 100 – 1,000bbls

Tullow Oil Jubilee FPSO: Environmental Releases Summary Document: RS-TN-09-033-001 Rev 0 Date: 2 July 09
Page 23
The sizes of oil spills are based on the quantity of oil in the transfer hose, the transfer rate, the safeguards in place and the likely failure modes that would lead to a release. These release sizes correspond with the release sizes from the historical data.
The calculation considers the following release sizes:
Small release (3bbls)
This release represents the transfer hoses breaking apart at the quick disconnect coupling. The coupling is designed to minimize the amount of fluid spilt, and 3bbls is assumed to be a conservative amount considering the design and operation of this type of coupling.
Figure 3.11 presents how a quick disconnect coupling minimizes the amount fluid spilled during disconnection [11].
Figure 3.11: Quick Disconnect Coupling
Tullow Oil Jubilee FPSO: Environmental Releases Summary Document: RS-TN-09-033-001 Rev 0 Date: 2 July 09
Page 24
Medium Release (49bbls)
This scenario represents a release due to minor damage to the transfer hose. The offloading operation is a manned operation and it is very likely that any release from the hose will be quickly detected and response procedures initiated. Upon detection of a release, the transfer hose will be flushed with seawater into the slop tank of the export tanker [12]. It is assumed that this scenario would result in a release of approximately 10% of the volume of the transfer hose.
Large Release (902bbls)
This scenario represents a release due to a rupture of the transfer hose. Under this scenario, the volume of oil in the transfer hose would be released in addition to an amount of equal to the transfer rate of the oil for the duration it takes to stop the transfer operation. It is assumed that it would take 30 seconds to stop the transfer pumps from pumping.
Thus, the calculation for the quantity of oil spilled from a large release is determined by the following [1]:
R = V + (t*x)
Where,
R = size of release (bbls)
V = volume of oil in the transfer hose (bbls)
t = time to stop transferring oil
x = transfer rate
3.5.3 Results
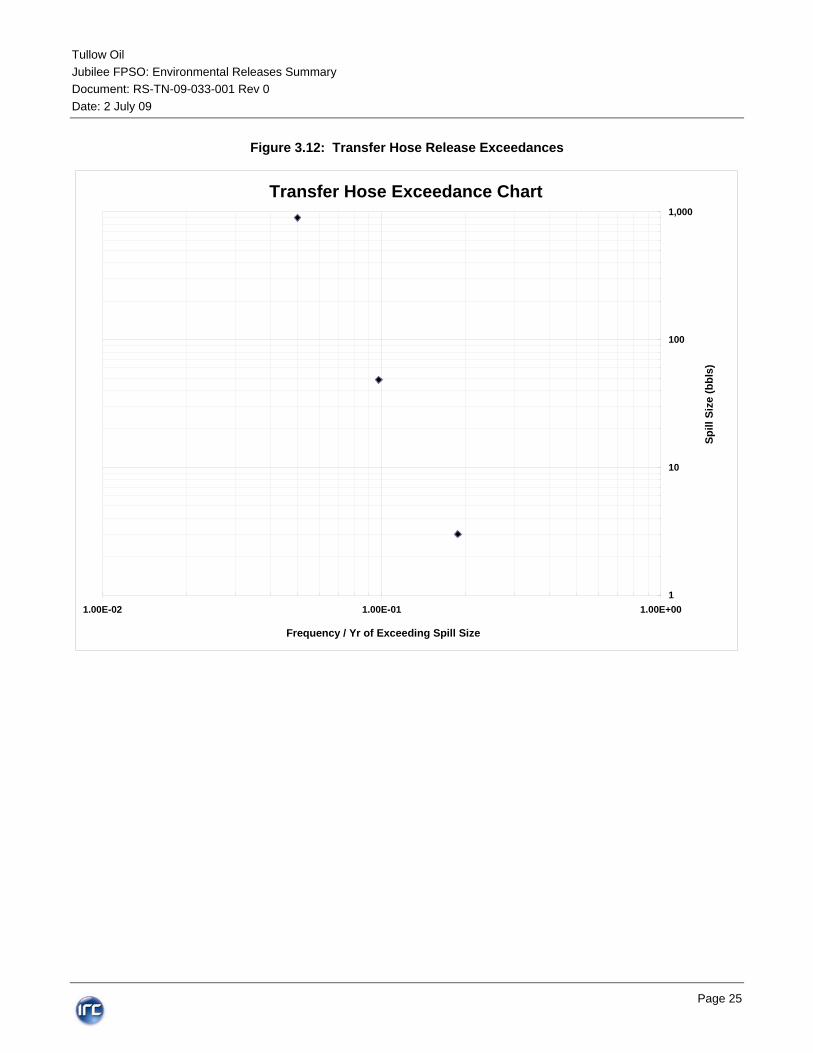
Figure 3.12 presents the frequencies of different oil spill sizes for releases from transfer hose releases.
Tullow Oil Jubilee FPSO: Environmental Releases Summary Document: RS-TN-09-033-001 Rev 0 Date: 2 July 09
Page 25
Figure 3.12: Transfer Hose Release Exceedances
Transfer Hose Exceedance Chart
1
10
100
1,000
1.00E-02 1.00E-01 1.00E+00
Frequency / Yr of Exceeding Spill Size
Spill
Siz
e (b
bls)
Tullow Oil Jubilee FPSO: Environmental Releases Summary Document: RS-TN-09-033-001 Rev 0 Date: 2 July 09
Page 26
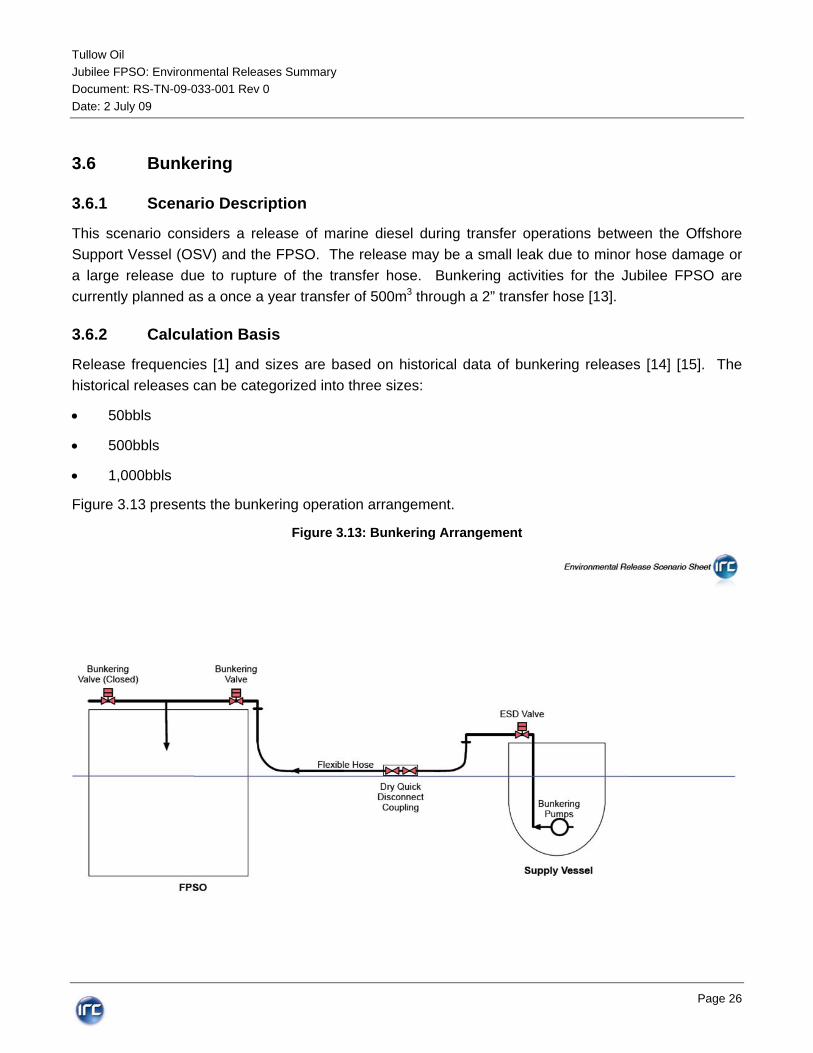
3.6 Bunkering
3.6.1 Scenario Description
This scenario considers a release of marine diesel during transfer operations between the Offshore Support Vessel (OSV) and the FPSO. The release may be a small leak due to minor hose damage or a large release due to rupture of the transfer hose. Bunkering activities for the Jubilee FPSO are currently planned as a once a year transfer of 500m3 through a 2” transfer hose [13].
3.6.2 Calculation Basis
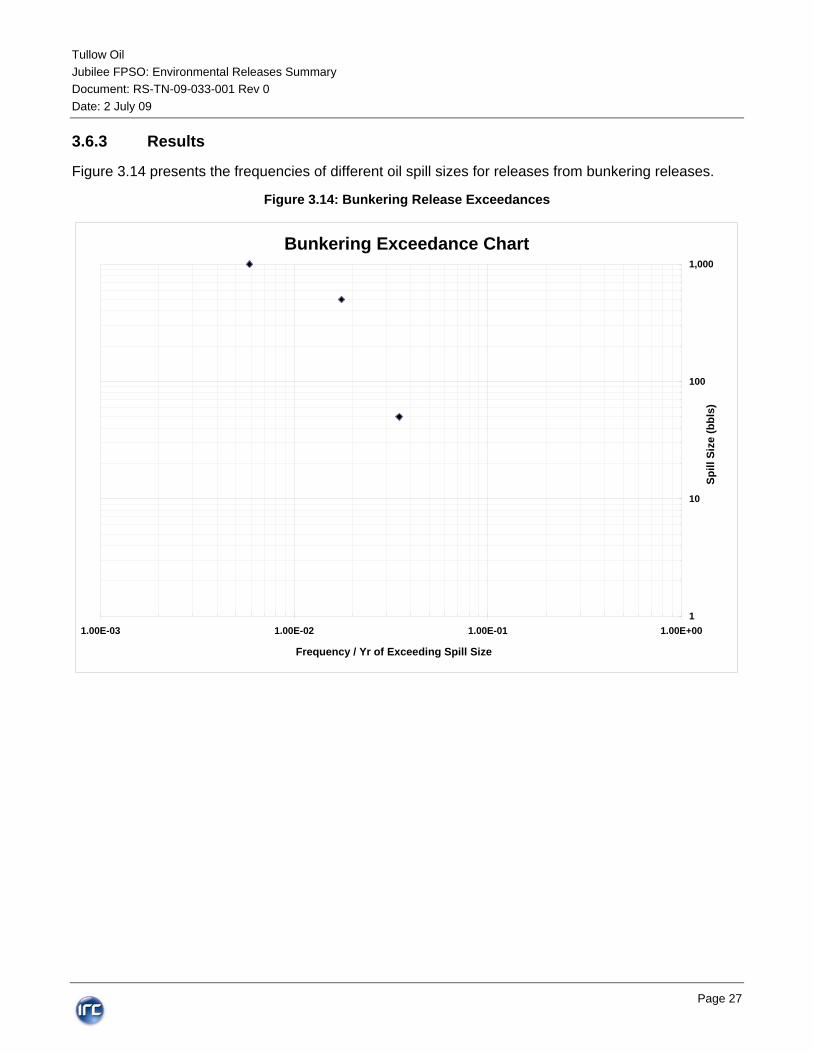
Release frequencies [1] and sizes are based on historical data of bunkering releases [14] [15]. The historical releases can be categorized into three sizes:
• 50bbls
• 500bbls
• 1,000bbls
Figure 3.13 presents the bunkering operation arrangement.
Figure 3.13: Bunkering Arrangement
Tullow Oil Jubilee FPSO: Environmental Releases Summary Document: RS-TN-09-033-001 Rev 0 Date: 2 July 09
Page 27
3.6.3 Results
Figure 3.14 presents the frequencies of different oil spill sizes for releases from bunkering releases.
Figure 3.14: Bunkering Release Exceedances
Bunkering Exceedance Chart
1
10
100
1,000
1.00E-03 1.00E-02 1.00E-01 1.00E+00
Frequency / Yr of Exceeding Spill Size
Spill
Siz
e (b
bls)
Tullow Oil Jubilee FPSO: Environmental Releases Summary Document: RS-TN-09-033-001 Rev 0 Date: 2 July 09
Page 28
3.7 Blowouts
3.6.4 Scenario Description
This scenario considers a reservoir blowout at the wellhead. Blowouts may occur during drilling, completion, production, wireline operations or workovers and last from only a few minutes to several days.
3.6.5 Calculation Basis
The size of releases from blowouts is determined by the following [1]:
R = (x*d)
Where,
R = size of release
x = release rate (bbls/day)
d = duration of release
The calculation considers several durations of blowouts:
• Less than 10 minutes (5 minutes)
• 10 minutes to 40 minutes
• 40 minutes to 2 hours
• 2 hours to 12 hours
• 12 hours to 5 days
• Greater than 5 days (28 days)
The frequency of blowouts is based on historical data [16] which gives a frequency of blowout per well for each operation (development, production, workover, wireline and completion). The frequency of blowouts for each operation is determined by:
F = h* n
Where,
F = frequency of blowouts
h = historical blowout frequency
n = number of wells drilled or operations
The following inputs are used for the number of wells / operations:

Tullow Oil Jubilee FPSO: Environmental Releases Summary Document: RS-TN-09-033-001 Rev 0 Date: 2 July 09
Page 29
• Development drilling: 5 wells
• Completion: 4 wells
• Production: 9 wells
• Wireline: 5 operations
• Workovers: 1 operation
3.6.6 Results
The results are broken down into releases from drilling operations and releases from production operations.
Figure 3.15 presents the frequencies of different oil spill sizes for releases from blowouts.
Figure 3.15: Blowout Exceedances
Blowout Exceedance Chart
1
10
100
1,000
10,000
100,000
1,000,000
1.00E-04 1.00E-03 1.00E-02
Frequency / Yr of Exceeding Spill Size
Spill
Siz
e (b
bls)
Drilling
Production

Tullow Oil Jubilee FPSO: Environmental Releases Summary Document: RS-TN-09-033-001 Rev 0 Date: 2 July 09
Page 30
3.7 FPSO Hull Damage
3.7.1 Scenario Description
This scenario considers releases due to damage to the hull of the FPSO, excluding ship collision. Examining historical data of FPSO releases [10], the causes of these type of releases from FPSOs have been from foundering and ballast tank explosions.
3.7.2 Calculation Basis
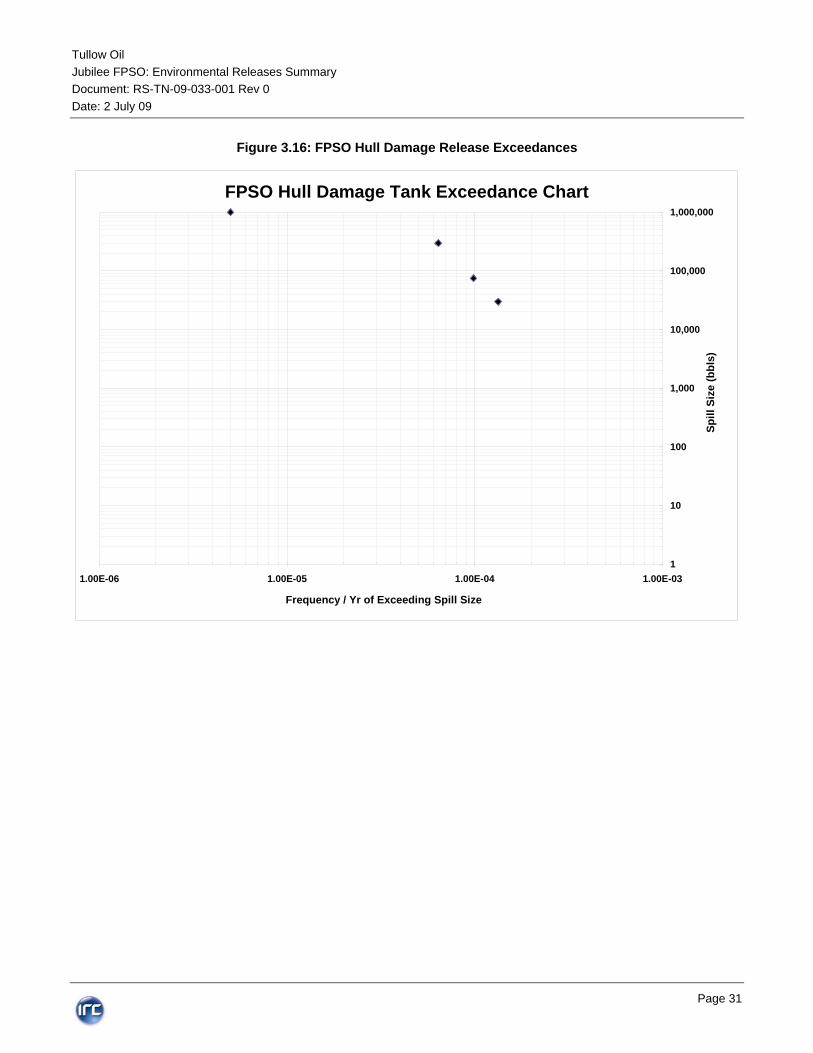
Release frequencies [1] are based on historical data of FPSO foundering and ballast tank explosions [10]. This data categorizes releases into three sizes:
• 10,000 – 50,000bbls
• 50,000 – 100,000bbls
• 100,000 – 500,000bbls
• 1,000,000bbls
3.7.3 Results
Figure 3.16 presents the frequencies of different oil spill sizes for releases due to FPSO hull damage.
Tullow Oil Jubilee FPSO: Environmental Releases Summary Document: RS-TN-09-033-001 Rev 0 Date: 2 July 09
Page 31
Figure 3.16: FPSO Hull Damage Release Exceedances
FPSO Hull Damage Tank Exceedance Chart
1
10
100
1,000
10,000
100,000
1,000,000
1.00E-06 1.00E-05 1.00E-04 1.00E-03
Frequency / Yr of Exceeding Spill Size
Spill
Siz
e (b
bls)

Tullow Oil Jubilee FPSO: Environmental Releases Summary Document: RS-TN-09-033-001 Rev 0 Date: 2 July 09
Page 32
3.8 Cargo Tank Explosion
3.8.1 Scenario Description
This scenario considers releases due to an explosion in one of the cargo tanks. Examining historical data of FPSO releases [10], the causes of these type of releases from FPSOs have been from foundering and ballast tank explosions.
3.8.2 Calculation Basis
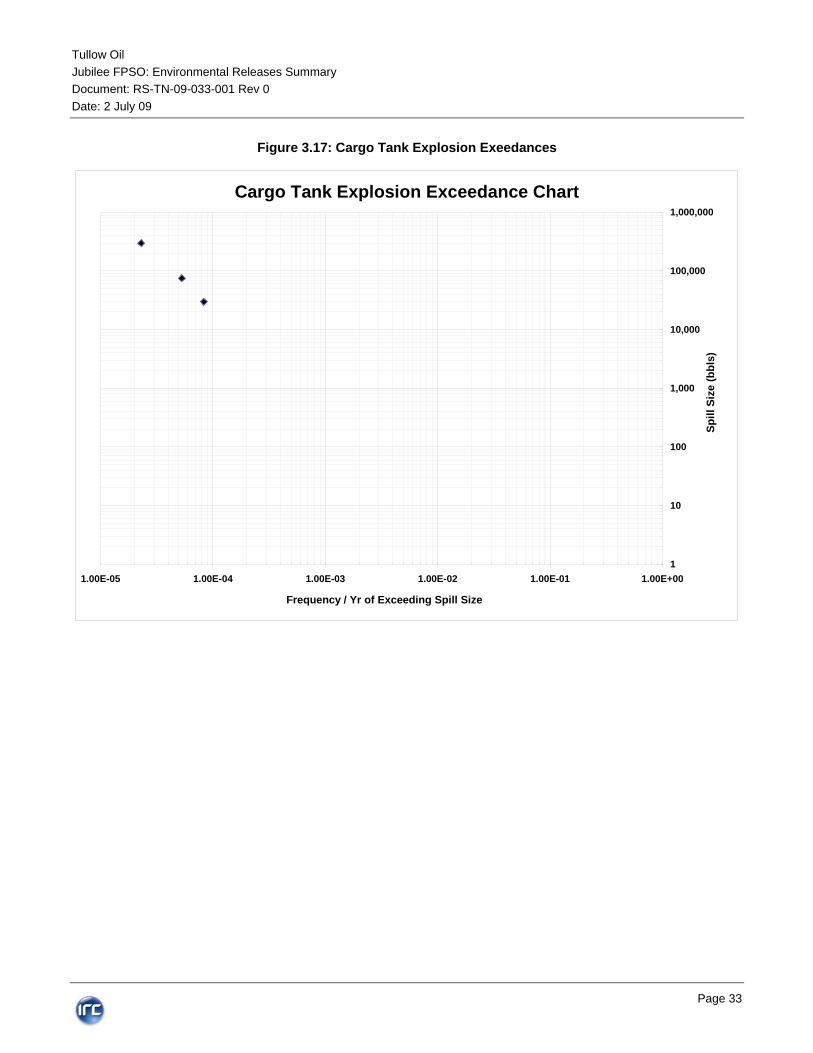
Release frequencies [1] are based on historical data of FPSO cargo tank explosions [10]. This data categorizes releases into three sizes:
• 10,000 – 50,000bbls
• 50,000 – 100,000bbls
• 100,000 – 500,000bbls
3.8.3 Results
Figure 3.17 presents the frequencies of different oil spill sizes for releases from cargo tank explosions.
Tullow Oil Jubilee FPSO: Environmental Releases Summary Document: RS-TN-09-033-001 Rev 0 Date: 2 July 09
Page 33
Figure 3.17: Cargo Tank Explosion Exeedances
Cargo Tank Explosion Exceedance Chart
1
10
100
1,000
10,000
100,000
1,000,000
1.00E-05 1.00E-04 1.00E-03 1.00E-02 1.00E-01 1.00E+00
Frequency / Yr of Exceeding Spill Size
Spill
Siz
e (b
bls)
Tullow Oil Jubilee FPSO: Environmental Releases Summary Document: RS-TN-09-033-001 Rev 0 Date: 2 July 09
Page 34
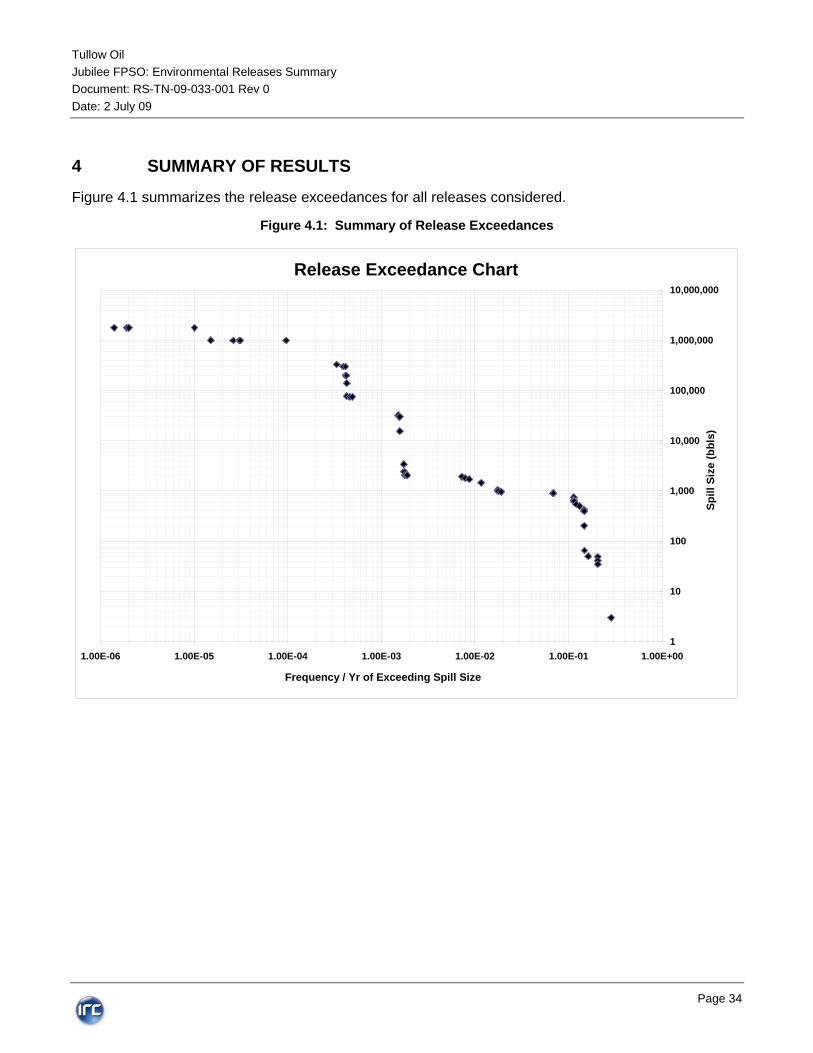
4 SUMMARY OF RESULTS
Figure 4.1 summarizes the release exceedances for all releases considered.
Figure 4.1: Summary of Release Exceedances
Release Exceedance Chart
1
10
100
1,000
10,000
100,000
1,000,000
10,000,000
1.00E-06 1.00E-05 1.00E-04 1.00E-03 1.00E-02 1.00E-01 1.00E+00
Frequency / Yr of Exceeding Spill Size
Spill
Siz
e (b
bls)
Tullow Oil Jubilee FPSO: Environmental Releases Summary Document: RS-TN-09-033-001 Rev 0 Date: 2 July 09
Page 35
Table 4.1 presents the range of spill sizes, the weighted average of the spill sizes and frequencies from the release scenarios.

Tullow Oil Jubilee FPSO: Environmental Releases Summary Document: RS-TN-09-033-001 Rev 0 Date: 2 July 09
Page 36
Table 4.1: Weighted Average of Release Sizes and Frequencies
Spill Size Ranges (bbls)
Weighted Avg Volume (bbls)
Weighted Avg Frequency
>1,000,000 1,527,249 2.32E-06 100,000 - 1,000,000 451,511 2.63E-05 10,000 - 100,000 34,654 1.19E-04 1,000 - 10,000 1,519 9.68E-04 100 - 1,000 734 1.01E-02 10 - 100 49 1.42E-02 <10 3 1.00E-01
Figure 4.2 below presents the release frequencies of different sizes of releases.
Figure 4.2: Release Frequencies by Size
Release Frequencies
1
10
100
1,000
10,000
100,000
1,000,000
10,000,000
1.00E-06 1.00E-05 1.00E-04 1.00E-03 1.00E-02 1.00E-01 1.00E+00
Frequency / Yr
Spill
Siz
e (b
bls)

Tullow Oil Jubilee FPSO: Environmental Releases Summary Document: RS-TN-09-033-001 Rev 0 Date: 2 July 09
Page 37
Table 4.2 presents the frequency of releases from each release source.

Tullow Oil Jubilee FPSO: Environmental Releases Summary Document: RS-TN-09-033-001 Rev 0 Date: 2 July 09
Page 38
Table 4.2: Release Frequencies by Source Release Source Frequency
Wellhead, Manifold, Flowline Leak 5.81E-02 Turret Leak 1.86E-02 Transfer Hose 2.00E-01 Ship Collision 1.02E-04 Riser Leak 1.06E-02 FPSO Hull Damage 1.33E-04 Bunkering 3.54E-02 Blowout 1.90E-03 Cargo Tank Explosion 8.30E-05
Figure 4.3 below shows the percentage of release frequencies from each release source.
Figure 4.3: Release Frequencies by Source
Percentage of Release Frequencies by Release Source
Wellhead, Manifold, Flowline Leak18%
Cargo Tank Explosion0%
Blowout1%
Transfer Hose61%
Ship Collision0%
Riser Leak3%
FPSO Hull Damage0%
Bunkering11%
Turret Leak6%

Tullow Oil Jubilee FPSO: Environmental Releases Summary Document: RS-TN-09-033-001 Rev 0 Date: 2 July 09
Page 39
5 REFERENCES
[1] RS-REP-09-033-004, Jubilee Environmental Releases Assessment, IRC, 2009.
[2] RS-REP-09-033-002, Jubilee Environmental HAZID, IRC, 2009.
[3] Jubilee Field Oil Spill Scenarios, ERM, May 2009.
[4] http://www.onlineconversion.com
[5] RS-REP-08-073-001, Jubilee Fire Risk Analysis, IRC, 2008.
[6] RS-REP-09-033-001, Jubilee Pipeline and Flowline SSIV Study, IRC, 2009.
[7] TGJ-OPS-PHL-10-0001-0, Jubilee Marine Vessel Philosphy, Tullow Oil, 2009.
[8] RS-REP-09-033-003, Jubilee Ship Collision Study, IRC, 2009.
[9] 10-01-MOD-L02-00010, FPSO Technical Description, Modec, 2009.
[10] Frequency Analysis of Accidental Oil Releases from FPSO Operations in the Gulf of Mexico, DNV, 2001.
[11] Safety Breakaway Couplings, KLAW Products LTD, www.klawproducts.com
[12] Email communication from Butch Manuel, Senior Operations Readiness Engineer, Tullow Oil, June 29, 2009.
[13] Email communication from Lewis Griffin, Senior Operations Readiness Engineer, Tullow Oil, June 26, 2009.
[14] Accident Statistics for Floating Offshore Units on the UK Continental Shelf 1980 – 2005, DNV, 2007.
[15] MMS Incident Satatistics and Summaries 1996-2010, http://www.mms.gov/incidents/IncidentStatisticsSummaries.htm.
[16] P. Holland, Offshore Blowouts Causes and Control, Houston: Gulf Publishing, 1997.