oil spill biology 1. impacts 2. cleanup ned black, ph.d., cercla ecologist, u.s. epa region 9...
TRANSCRIPT

Oil Spill Biology1. Impacts2. Cleanup
Ned Black, Ph.D.,CERCLA Ecologist, U.S. EPA Region 9
415-972-3055 [email protected]
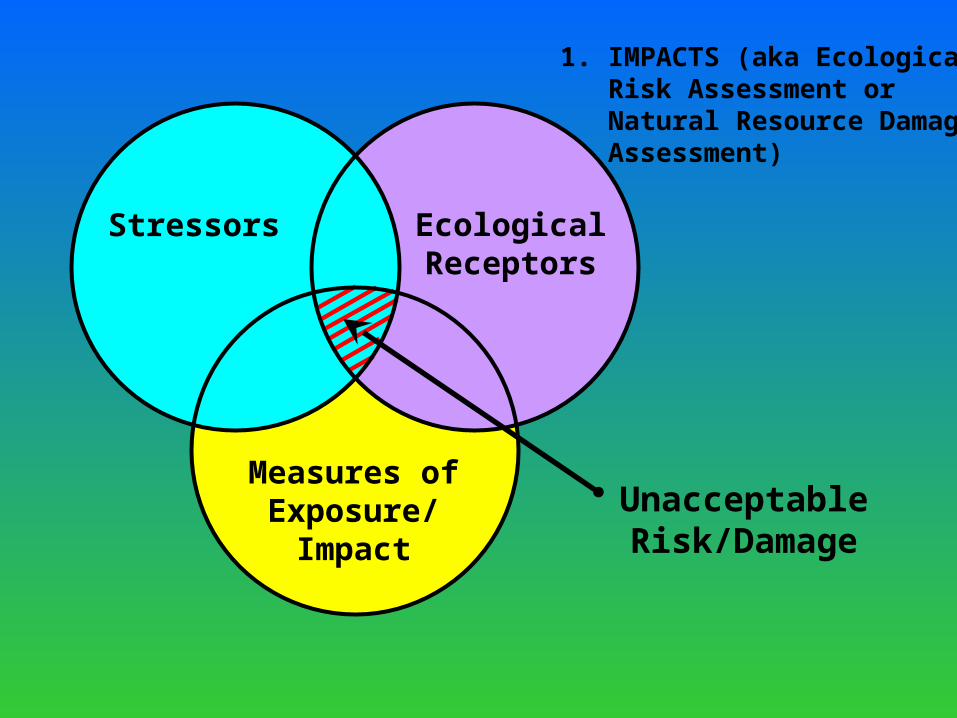
Unacceptable Risk/Damage
Stressors EcologicalReceptors
Measures ofExposure/
Impact
1. IMPACTS (aka Ecological Risk Assessment orNatural Resource Damage Assessment)
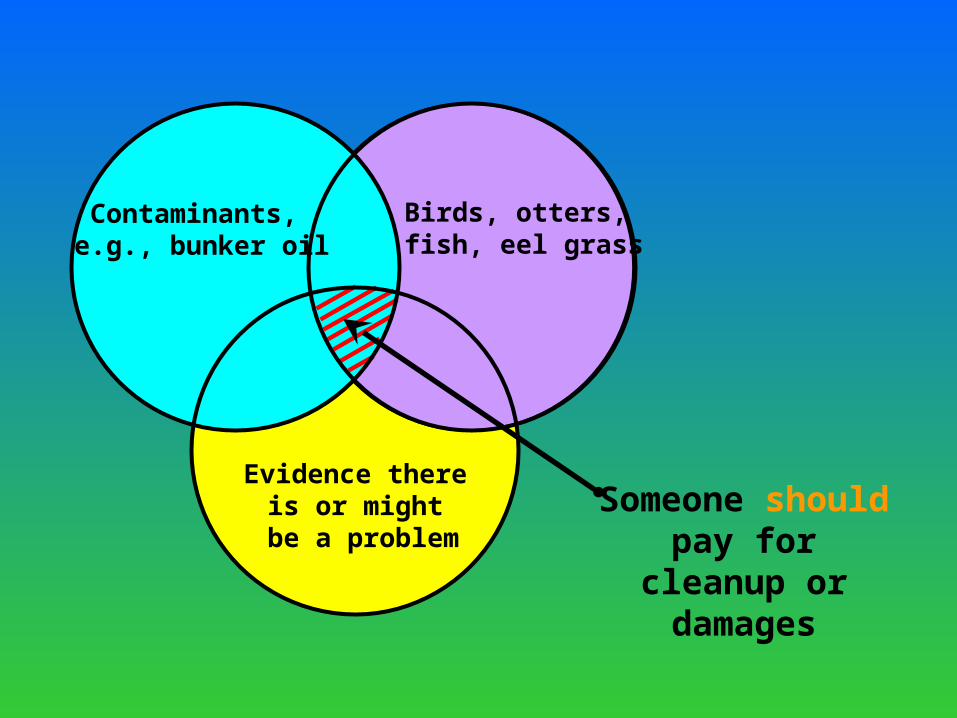
Someone shouldpay for cleanup
or damages
Contaminants, e.g., bunker oil
Birds, otters, fish, eel grass
Evidence thereis or might
be a problem

Potential receptors impacted by something other than COCs,
e.g. habitat destruction and industrial contamination along
Gulf Coast
Contaminantsof concern
PotentialReceptors
Measures ofExposure/
Impact
Ecological Risk Assessment Fundamentals
COCs at demonstrably toxic concentrations, but exposure
pathway to receptors incomplete, e.g., Mansfield
Canyon mining district
COCs and receptors present, but COCs not
bioavailable or concentrations too low
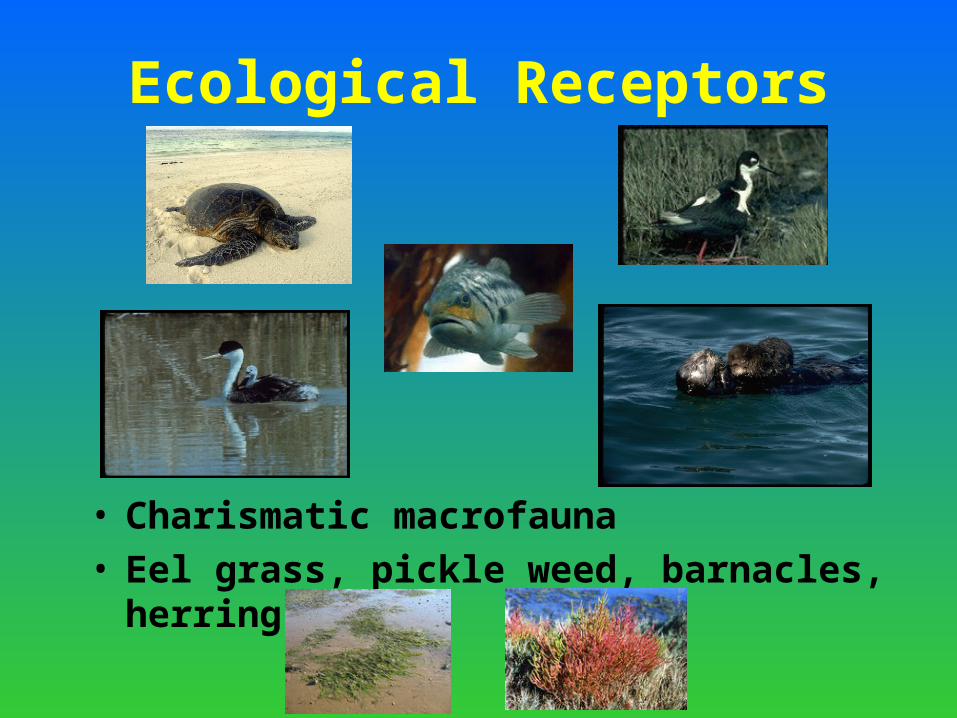
Ecological Receptors
• Charismatic macrofauna • Eel grass, pickle weed, barnacles, herring
roe
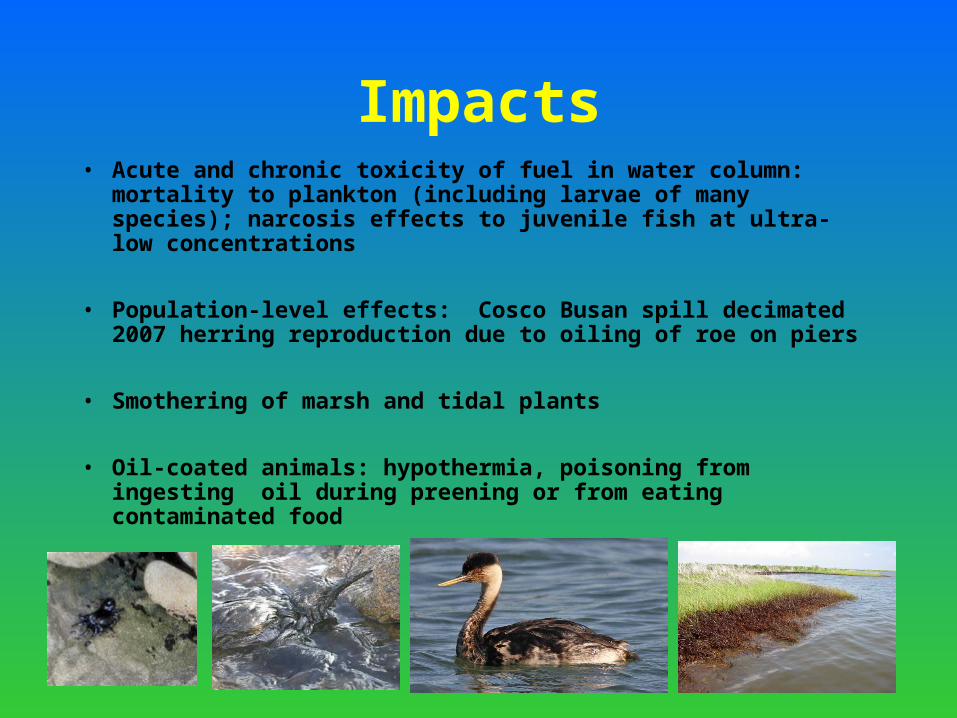
Impacts• Acute and chronic toxicity of fuel in water column:
mortality to plankton (including larvae of many species); narcosis effects to juvenile fish at ultra-low concentrations
• Population-level effects: Cosco Busan spill decimated 2007 herring reproduction due to oiling of roe on piers
• Smothering of marsh and tidal plants
• Oil-coated animals: hypothermia, poisoning from ingesting oil during preening or from eating contaminated food

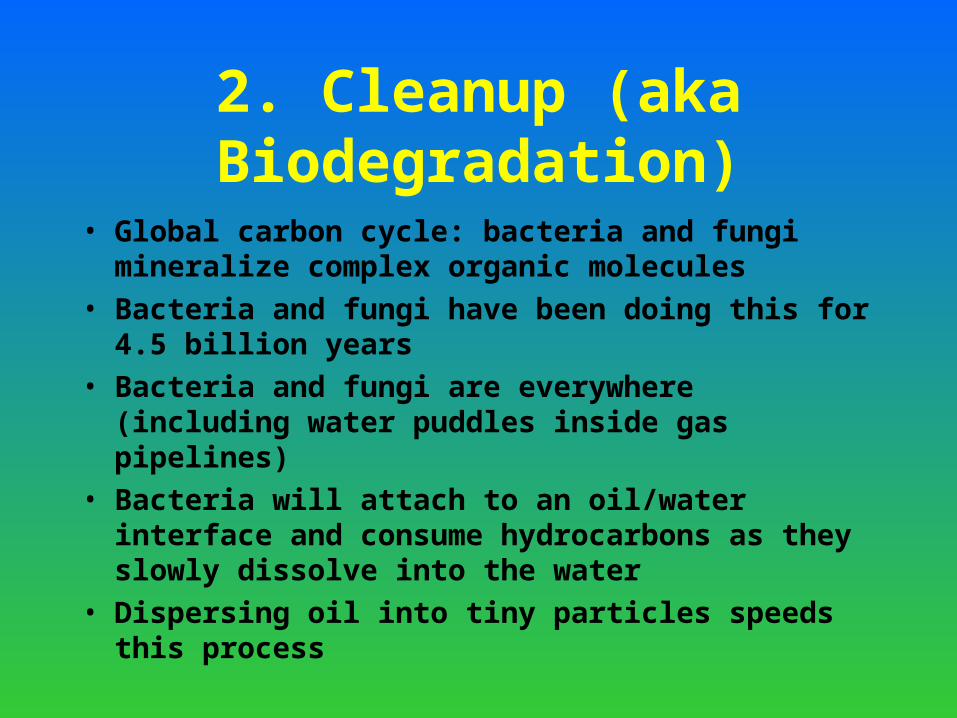
2. Cleanup (aka Biodegradation)
• Global carbon cycle: bacteria and fungi mineralize complex organic molecules
• Bacteria and fungi have been doing this for 4.5 billion years
• Bacteria and fungi are everywhere (including water puddles inside gas pipelines)
• Bacteria will attach to an oil/water interface and consume hydrocarbons as they slowly dissolve into the water
• Dispersing oil into tiny particles speeds this process

Figure 7. (a) Phase contrast (100×); (b) fluorescence (40×) and (c) confocal scanning laser (40×) photomicrographs illustrating the sorption of Acinetobacter junii (Hex-2) at the gas–liquid interface of the foam. L, Lamellae; P, plateau border; B, bacteria; G, gas bubble
Ripley, M. , Harrison, A. , Betts, W. and Dart, R. (2002), Mechanisms for enhanced biodegradation of petroleum hydrocarbons by a microbe-colonized gas–liquid foam. Journal of Applied Microbiology, 92: 22–31.

Mansfield Canyon Mining District, AZShaft pool