oil market outlook - samba · oil market outlook executive summary. october 2015 public 2 key...
TRANSCRIPT

PUBLIC
October 2015
Report Series
Oil Market Outlook Executive SummaryS
Office of the Chief Economist Economics Department Samba Financial Group P.O. Box 833, Riyadh 11241 Saudi Arabia [email protected] +4420-7659-8200 (London) This and other publications can be Downloaded from www.samba.com
Lower oil prices were supposed to bring a supply response from non-OPEC producers, but this is happening more slowly than expected, and has been offset by surging OPEC supply. As a result, projections that physical markets would start to rebalance during 2015 have been pushed into late 2016. In recognition of this, the rebound in prices to $70/b in May could not be sustained, and Brent has subsequently dropped back below $50/b.
However, there is mounting evidence that non-OPEC production is now
starting to decline, particularly in the USA. As long as global oil demand holds up as we expect, this should allow for a rebalancing of market fundamentals next year that will set the stage for a price recovery in 2017. The need to work down the large stock overhang and absorb new Iranian supply will keep prices suppressed in 2016, when we project Brent will average $58/b. But by 2017 we think prices will be back near $70/b.
This projection is relatively bullish, particularly compared with futures markets, and we recognise that there are large downside risks in the short-term, especially on the demand side. However, current prices appear too low for medium or long-term market equilibrium, and unless there is a pick-up reasonably soon, the large scale curtailment in traditional oil sector investment may be setting the stage for an uncontrollable price surge further down the line.
Global oil demand staged a healthy recovery during 2015 to grow by around 1.5mb/d. Lower oil prices and recovering economies helped prompt an increase in OECD demand and, despite concerns over China and Emerging Markets, non-OECD oil demand also continues to grow. We expect that global growth will weaken somewhat next year, but do not expect China will suffer a “hard landing “, and project oil demand growth will hold at 1.3mb/d in 2016.
Recent data suggest that US oil production is now on a declining trend, and that many shale oil companies are facing financial strains which will be accentuated once the US Fed finally starts to hike rates. On current trends average US production this year is still likely to be up around 0.6mb/d, but will decline by around 0.4mb/d in 2016.
OPEC meets in December, but is unlikely to alter its current strategy of preserving market share which has led to surging production, particularly from Saudi Arabia and Iraq. However, production gains next year are projected to be much more modest, and mainly driven by higher Iranian supply as sanctions are formally lifted.
Oil Market Outlook Executive Summary

October 2015
PUBLIC
2
Key Recent Developments
Premature price rebound to $70/b in May 2015
Oil prices collapsed in 2014 as surging supply exceeded weak demand and, driven by Saudi Arabia, OPEC abandoned its traditional role of trimming supply to balance the market and support prices. Despite an estimated 1-1.5mb/d supply overhang, at its November 2014 meeting the cartel opted for a new strategy of protecting market share in response to the sustained and large increases in US shale production. From $115/b in June 2014, Brent prices crashed 60 percent to trade below $50/b in January 2015. However, prices then staged a strong recovery, and by May were back trading near $70/b, a level which had previously been widely viewed as a new sustainable floor. The main drivers behind this rebound were financial investor inflows which were encouraged by a sharp decline (60 percent) in US rig counts, an apparent stalling in US production, a drawdown of elevated US oil stocks, and announcements of large scale cuts to oil investment, with adverse implications for future supply. At the same time oil demand began to recover as lower prices boosted consumption, and global growth remained steady. Has been followed by another slump and lowered
expectations
However, the rebound was premature as a number of developments made clear that any hoped for rebalancing in the physical markets would not start during 2015, but be pushed back to late 2016 at the earliest. These included:
a) surging OPEC supply, led by Saudi Arabia and Iraq as,
unconstrained by quotas, members sought to preserve
market share;
b) resilience in US production which, until very recently,
held up despite the collapse in rig counts, as improved
productivity and cost efficiencies emerged in shale oil
production;
c) continued gains in other non-OPEC supply, despite the
sharp cuts in investment, as already commissioned
projects came on stream;
d) the successful conclusion of nuclear negotiations with
Iran allowing for a lifting of sanctions (probably early
next year) bringing with it the prospect of up to 1mb/d
of returning Iranian supply;
e) wide spread downgrades in global growth expectations
and heightened concerns over Emerging Markets (EMs),
which were triggered by developments in China over the

October 2015
PUBLIC
3
summer, and prompted a major sell-off in global
financial and commodity markets, including oil.
The latter development saw Brent crash to a new low of near $40/b in August, before financial investors again prompted a short-lived rebound back above $50/b. As of writing, prices were currently holding at around $48/b, and the average for the year is projected at $56/b down from a $100/b average in 2014. Developments during 2015 point to the considerable difficulty markets are having in identifying a price floor, and assessing when the physical markets will rebalance given OPEC’s abandonment of its traditional supply management role, and the constantly evolving force that is US shale oil. This has been reflected in the steady downgrading of price expectations which can be clearly seen in the futures markets. From pricing in $70/b at end-2015 back in April, current futures have Brent below $60/b through to early 2018, and only just reaching $65/b by 2021. Market Outlook
Market fundamentals should rebalance during 2016 and
prices recover in 2017
Lower oil prices were supposed to bring a supply response from non-OPEC producers, but this is happening much more slowly than might have been expected and, on a global level, has been offset by surging OPEC supply (see chart). As a result, expectations that physical markets would start to rebalance during 2015 have been pushed into late 2016. We share this view, and expect a sharp slowdown in supply growth will combine with sustained demand growth to produce a large shortfall (see table). This should allow for a rebalancing of fundamentals that will set the stage for a stronger price recovery in 2017. The need to work
down the large stock overhang and absorb new Iranian
supply will prevent a sustainable price recovery in 2016, when
we project Brent will average $58/b, but by 2017 we think
prices will be back around $70/b. This puts us on the bullish side, particularly compared with futures markets, and we recognise that there are large downside risks in the short-term, especially on the demand side. However, current prices appear too low for medium or long-term market equilibrium, and unless there is a pick-up reasonably soon, the large scale curtailment in traditional oil sector investment may be setting the stage for an uncontrollable price surge further down the line.
annual change mb/d 2015 2016 2017
Demand 1.51 1.31 1.35
non-OPEC supply 1.03 -0.62 0.1
N.America 0.83 -0.42 0.4
OPEC NGLs 0.2 0.2 0.2
OPEC crude 0.9 0.32 0.4
Total supply 2.13 -0.10 0.70
Balance (-surplus) -0.62 1.41 0.65
Samba Global Oil Market Balance

October 2015
PUBLIC
4
World oil demand picked up in 2015 and should slow only
slightly in 2016
Global oil demand staged a healthy recovery during 2015 and is expected to grow by around 1.5mb/d to 94.2mb/d. In particular, the combination of lower oil prices and recovering economies have helped revive demand in the OECD, particularly in the USA. Having contracted in 2014, OECD demand is estimated to increase by over 0.4mb/d in 2015. Meanwhile, although many EMs are struggling (Russia, Brazil, Argentina and Venezuela are all in recession) non-OECD oil demand continues to grow, led by China and India. Economic growth in the former may be slowing, but oil demand continues to grow by over 0.35mb/d, driven in part by strategic stockpiling which still has a long-way to go to reach OECD levels. Meanwhile India’s annual oil demand growth is running at over 0.2mb/d. Box Global growth steady but muted
Global growth prospects have taken a turn for the worse as many EMs continue to struggle, and fears mount over a sharper slowdown in China, and the authorities’ ability to smoothly unwind imbalances built up in the economy, particularly the credit boom. While risks are elevated, we do not think China is headed for a hard landing, and instead will maintain growth at around 6-6.5 percent. This should help commodities find a floor, and ensure EM’s do not deteriorate further, although their growth prospects remain variable and relatively weak. Meanwhile, advanced economies are generally performing as expected. Despite continued uncertainty in Greece, growth is accelerating in the Eurozone (EZ), the UK remains solid, Japan is recovering after a contraction last year, and the US economy continues to grow strongly. That said, financial market strains and weak EMs will present headwinds and, with inflation still low, likely delay and extend expected rate hike cycles in the US and UK, while prompting more easing from the ECB and Bank of Japan. Overall we have revised down our global growth forecast to 2.9 percent for 2016 and 2017. For a more detailed analysis see our October Economic Monitor. Looking ahead, we do not expect China to experience a hard landing (see box), and thus assume oil demand will continue to grow at only a slightly slower rate next year. A more stable China will also help restore confidence in the global economy and support growth in the broader Asia Pacific region, which remains the largest source of oil import demand. Performances in EMs are likely to remain mixed and subdued, although India should continue to do well and provide a key source of growing oil demand. Sustained improvements in the EZ and Japan, together with steady growth in the USA, will also help sustain OECD oil
2013 2014 2015f 2016f 2017f
World 3.0 3.0 2.9 2.9 3.0
US 2.2 2.4 2.5 2.7 2.8
Japan 1.5 -0.1 0.5 1.1 1.2
Euro area -0.4 0.9 1.5 1.6 1.6
China 7.7 7.3 6.8 6.2 6.0
Emerging Markets 4.0 3.9 3.2 3.3 3.7
Saudi Arabia 2.7 3.5 3.1 0.6 2.5
US 0.25 0.25 0.25 1.00 2.00
Japan 0.10 0.10 0.10 0.10 0.10
Euro area 0.25 0.15 0.15 0.15 0.15
Brent 107.0 100.0 56.0 58.0 70.0
Samba estimates and forecasts
Real GDP growth (percent change)
World Economic Outlook
Official policy rate (end period)
Oil Price ($/b period average)

October 2015
PUBLIC
5
consumption, particularly as we expect prices will remain subdued. Overall, although we project that growth in global oil demand will slow next year, we think it will still hold at around 1.3mb/d. US production is finally falling
With OPEC refusing to cut production, the big question has been when, where, and at what price, would non-OPEC supply give way to restore the market to balance? Here, attention has been focused on US shale oil which had been adding 1mb/d a year to supply since 2012. However, the very different production process and lack of any guiding history, have made it particularly hard to gauge a “break even” price for US shale oil. Not so long ago estimates were in the $60-75/b range, but these have been hastily revised down, and only now that prices are holding at under $50/b for WTI, does there seem to be convincing evidence that shale oil production will decline. Part of the difficulty in predicting production behaviour stems from the rapid and large improvements in efficiency and cost savings which have allowed companies to maintain production levels with massively reduced rig counts.
Box US shale oil economics
Until quite recently it was widely estimated that US shale
producers required oil prices of between $60-75/b to break even,
and around $90/b (and easy access to capital) to fund
development expenditures required to deliver sustained growth in
output (shale oil plays are characterised by very steep decline
rates, such that to grow, or even sustain, production levels requires
continuous investment). However, cheap and easy funding,
improvements in productivity and efficiency, a focusing on drilling
“sweet spots”, and a sharp decline in costs, have all combined to
keep shale output surprisingly resilient in the face of the collapse
in oil prices since mid-2014, and a sharp drop in rig counts. How
much longer this situation can continue is open to question, and
financial strains are clearly developing, reflected in steep jumps in
oil company bond yields and the reported relaxing of borrowing
conditions on bank loans to avoid defaults. A resumed drop in rig
counts also suggests that companies are reaching a tipping point,
and the IEA has recently estimated that futures prices are currently
below the average cost of production for all the main shale plays.
As such drilling and completion rates are expected to decline
further. There are also doubts that the recent improvements in
production rates can be repeated in 2016, such that output seems
bound to fall. That said, shale oil has the capacity to respond
quickly to price movements, and there is now a backlog of drilled-
but-uncompleted wells (DUCs) the clearing of which could,
according to Citi, rapidly add up to 0.35mb/d in supply next year.

October 2015
PUBLIC
6
Adding to the uncertainty has been the fact that US oil production estimates use a variety of modelling and reporting methods, making it harder for markets to clearly track and anticipate supply. However, recent developments do now suggest that US oil production is on a declining trend, and that many companies are facing financial strains which may be accentuated once the US Fed finally starts to hike rates. September data from the EIA show total US production slipped to 9mb/d, and on this trend the increase in average output is likely to be contained to around 0.6mb/d this year, and production will actually decline next year. Our own projection is for average production to drop by around 0.4mb/d in 2016, although this will probably require prices to stay low through most of the year, otherwise a large number of “drilled but uncompleted” wells may be brought on line. Other non-OPEC supply also expected to stall
The collapse in oil prices has prompted large scale reductions in planned oil investment in non-OPEC countries. Having already fallen in 2014, it is widely predicted that global oil investments will be down another 20 percent this year. This will certainly impact future supply developments, but in the meantime existing production has remained robust and has actually increased on average in Russia, Canada and China, despite the lower oil prices. However, this should begin to change next year as it is clear producers across the world are shutting in high cost marginal fields. Already we have seen a dip in Russian production; but it will probably not be until 2017 that the full effects of reduced investment begin to have a more meaningful impact on supply and, perhaps more importantly, on market perceptions of tightening future balances. Iraq and Saudi Arabia have led a surge in 2015 OPEC supply
Surging OPEC production this year has been a major factor extending the global supply overhang and subduing what appeared to be a nascent price recovery. One of the main drivers has been Iraq, where reported output has soared to average around 3.9m/b this year, up 0.65mb/d over the 2014 average. However, the reported 0.7mb/d jump in supply during the summer (see chart) is thought in large part to reflect the inclusion in the data of Kurdish oil production. Given that this oil was already in the market, the impact of rising Iraqi supply is likely to have been less than the numbers suggest. However, there is no dispute over the jump in Saudi Arabia supply which has been running above 10mb/d since March, raising average production by 0.5mb/d compared with 2014. Output peaked at a record 10.6mb/d in July, but has since eased back as domestic summer demand has faded, although it remains well above 10mb/d. These

October 2015
PUBLIC
7
two countries have been the driving force behind an increase in average total OPEC production to around 31.5mb/d in the third quarter this year, compared with the previous targeted limit of 30mb/d. But this should ease off in 2016
Given the large gains in Iraqi and Saudi production already made, we see little scope for further large increases in 2016, particularly in Iraq which is suffering from reduced oil revenues and continued political and security strains. Saudi Arabia retains scope to raise supply further given its stated capacity of around 12mb/d, but we think it will be content to hold at around current levels unless there is further demand for its crude. That said, we do not expect any change in the Saudi driven “market share” strategy being pursued by OPEC. Although many members are suffering financially, there have been surprisingly few and muted complaints over the current stance and impact on prices. There is also no real hope of non-OPEC members joining in any output cuts, and thus we do not expect any official change in policy at OPEC’s December 4 meeting when Indonesia is set to re-join the group. Instead, the more wealthy producers such as UAE and Kuwait are busily expanding production capacity so as to position themselves for more competitive markets ahead. Meanwhile, sharply reduced revenues are adversely affecting production prospects in financially (and politically) strained countries like Venezuela, Nigeria and Angola where output is expected to stall. Libya is also struggling to maintain production (currently running at around 350,000b/d), and we do not expect continuing political stresses will ease up enough to allow any significant recovery next year. On balance, we expect total OPEC production will rise by only 0.3mb/d or so in 2016, and mainly because of the lifting of Iranian sanctions. Although the lifting of Iranian sanctions will boost supply
Iranian oil production is set to rise once sanctions are formally lifted. This could take place in December, although it seems more likely to slip into the first quarter of 2016. Estimates of how much oil Iran can bring back on stream vary, with the authorities stating they could restore between 0.7-1mb/d in a short space of time, returning output to the pre-sanctions levels of around 3.7mb/d. This appears over optimistic, and we expect average production will be up by around 0.32mb/d next year, with further gains over 0.5mb/d likely to be pushed into 2017 as they would be dependent on international oil companies’ expertise and investment.
October 2015
PUBLIC
8
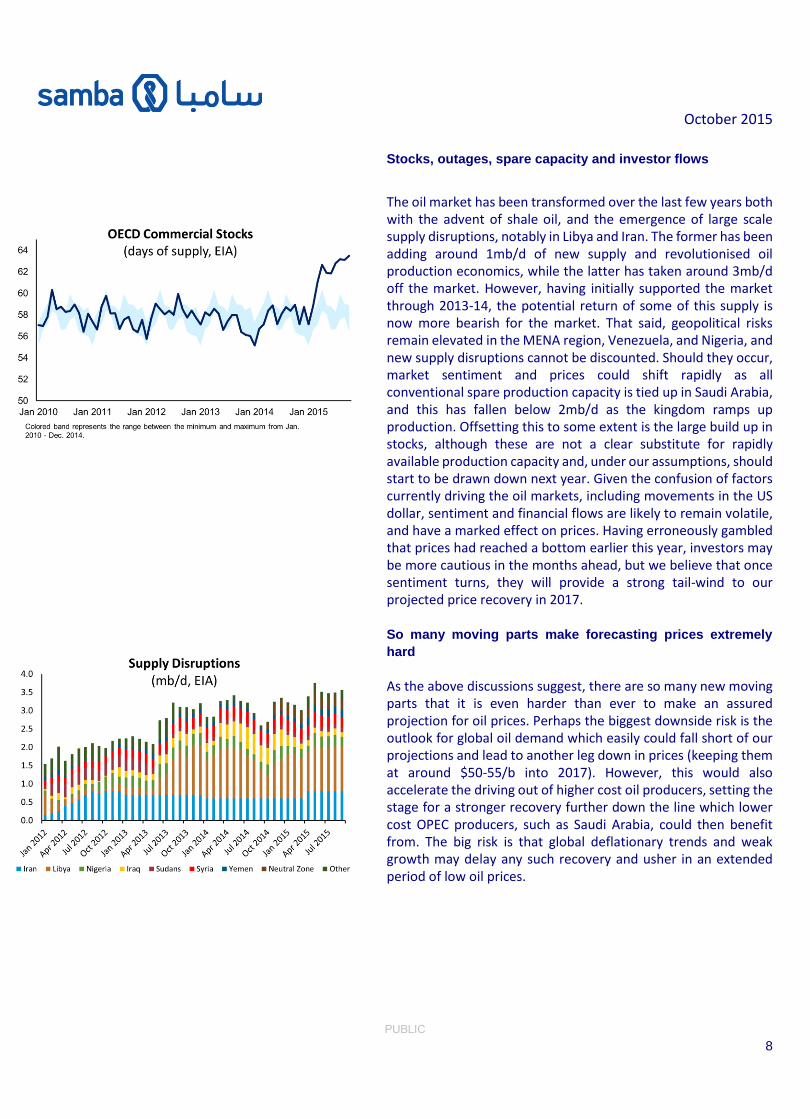
Stocks, outages, spare capacity and investor flows
The oil market has been transformed over the last few years both with the advent of shale oil, and the emergence of large scale supply disruptions, notably in Libya and Iran. The former has been adding around 1mb/d of new supply and revolutionised oil production economics, while the latter has taken around 3mb/d off the market. However, having initially supported the market through 2013-14, the potential return of some of this supply is now more bearish for the market. That said, geopolitical risks remain elevated in the MENA region, Venezuela, and Nigeria, and new supply disruptions cannot be discounted. Should they occur, market sentiment and prices could shift rapidly as all conventional spare production capacity is tied up in Saudi Arabia, and this has fallen below 2mb/d as the kingdom ramps up production. Offsetting this to some extent is the large build up in stocks, although these are not a clear substitute for rapidly available production capacity and, under our assumptions, should start to be drawn down next year. Given the confusion of factors currently driving the oil markets, including movements in the US dollar, sentiment and financial flows are likely to remain volatile, and have a marked effect on prices. Having erroneously gambled that prices had reached a bottom earlier this year, investors may be more cautious in the months ahead, but we believe that once sentiment turns, they will provide a strong tail-wind to our projected price recovery in 2017. So many moving parts make forecasting prices extremely
hard
As the above discussions suggest, there are so many new moving parts that it is even harder than ever to make an assured projection for oil prices. Perhaps the biggest downside risk is the outlook for global oil demand which easily could fall short of our projections and lead to another leg down in prices (keeping them at around $50-55/b into 2017). However, this would also accelerate the driving out of higher cost oil producers, setting the stage for a stronger recovery further down the line which lower cost OPEC producers, such as Saudi Arabia, could then benefit from. The big risk is that global deflationary trends and weak growth may delay any such recovery and usher in an extended period of low oil prices.

October 2015
PUBLIC
9
James Reeve Deputy Chief Economist [email protected] Andrew Gilmour Deputy Chief Economist [email protected] Thomas Simmons Economist [email protected]
Disclaimer This publication is based on information generally available to the public from sources believed to be reliable and up to date at the time of publication. However, SAMBA is unable to accept any liability whatsoever for the accuracy or completeness of its contents or for the consequences of any reliance which may be place upon the information it contains. Additionally, the information and opinions contained herein: 1. Are not intended to be a complete or comprehensive study or to
provide advice and should not be treated as a substitute for specific advice and due diligence concerning individual situations;
2. Are not intended to constitute any solicitation to buy or sell any instrument or engage in any trading strategy; and/or
3. Are not intended to constitute a guarantee of future performance. Accordingly, no representation or warranty is made or implied, in fact or in law, including but not limited to the implied warranties of merchantability and fitness for a particular purpose notwithstanding the form (e.g., contract, negligence or otherwise), in which any legal or equitable action may be brought against SAMBA. Samba Financial Group P.O. Box 833, Riyadh 11421 Saudi Arabia