oil information documentation for beyond 2020 …wds.iea.org/wds/pdf/documentation_oil_2010.pdf ·...
TRANSCRIPT

OIL INFORMATION: BEYOND 2020 DOCUMENTATION - 1
INTERNATIONAL ENERGY AGENCY
OIL INFORMATION
DOCUMENTATION FOR BEYOND 2020 FILES

OIL INFORMATION: BEYOND 2020 DOCUMENTATION - I.3
INTERNATIONAL ENERGY AGENCY
TABLE OF CONTENTS PART I: SOURCES AND DEFINITIONS 1. Introduction ................................................................................................................................................. 7
2. Description of the B20/20 Service ..................................................................................................... 9
3. Recent data revisions ........................................................................................................................... 11
4. Flow definitions ......................................................................................................................................... 13 5. Product definitions ................................................................................................................................ 23
6. Geographical coverage ........................................................................................................................ 27
7. Country notes ........................................................................................................................................... 31
8. Abbreviations ............................................................................................................................................ 41


OIL INFORMATION: BEYOND 2020 DOCUMENTATION - I.5
INTERNATIONAL ENERGY AGENCY
PART I
SOURCES AND DEFINITIONS

OIL INFORMATION: BEYOND 2020 DOCUMENTATION - I.7
INTERNATIONAL ENERGY AGENCY
1. INTRODUCTION
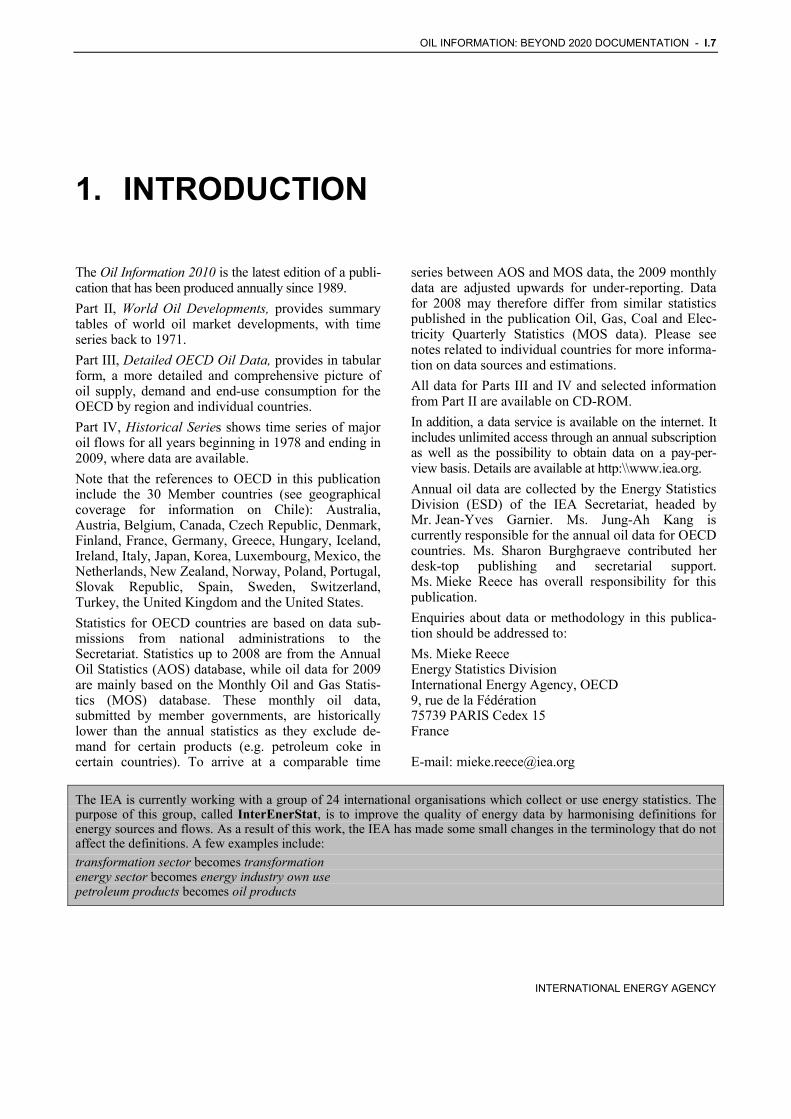
The Oil Information 2010 is the latest edition of a publi-cation that has been produced annually since 1989. Part II, World Oil Developments, provides summary tables of world oil market developments, with time series back to 1971. Part III, Detailed OECD Oil Data, provides in tabular form, a more detailed and comprehensive picture of oil supply, demand and end-use consumption for the OECD by region and individual countries. Part IV, Historical Series shows time series of major oil flows for all years beginning in 1978 and ending in 2009, where data are available. Note that the references to OECD in this publication include the 30 Member countries (see geographical coverage for information on Chile): Australia, Austria, Belgium, Canada, Czech Republic, Denmark, Finland, France, Germany, Greece, Hungary, Iceland, Ireland, Italy, Japan, Korea, Luxembourg, Mexico, the Netherlands, New Zealand, Norway, Poland, Portugal, Slovak Republic, Spain, Sweden, Switzerland, Turkey, the United Kingdom and the United States. Statistics for OECD countries are based on data sub-missions from national administrations to the Secretariat. Statistics up to 2008 are from the Annual Oil Statistics (AOS) database, while oil data for 2009 are mainly based on the Monthly Oil and Gas Statis-tics (MOS) database. These monthly oil data, submitted by member governments, are historically lower than the annual statistics as they exclude de-mand for certain products (e.g. petroleum coke in certain countries). To arrive at a comparable time
series between AOS and MOS data, the 2009 monthly data are adjusted upwards for under-reporting. Data for 2008 may therefore differ from similar statistics published in the publication Oil, Gas, Coal and Elec-tricity Quarterly Statistics (MOS data). Please see notes related to individual countries for more informa-tion on data sources and estimations. All data for Parts III and IV and selected information from Part II are available on CD-ROM. In addition, a data service is available on the internet. It includes unlimited access through an annual subscription as well as the possibility to obtain data on a pay-per-view basis. Details are available at http:\\www.iea.org. Annual oil data are collected by the Energy Statistics Division (ESD) of the IEA Secretariat, headed by Mr. Jean-Yves Garnier. Ms. Jung-Ah Kang is currently responsible for the annual oil data for OECD countries. Ms. Sharon Burghgraeve contributed her desk-top publishing and secretarial support. Ms. Mieke Reece has overall responsibility for this publication. Enquiries about data or methodology in this publica-tion should be addressed to: Ms. Mieke Reece Energy Statistics Division International Energy Agency, OECD 9, rue de la Fédération 75739 PARIS Cedex 15 France E-mail: [email protected]
The IEA is currently working with a group of 24 international organisations which collect or use energy statistics. The purpose of this group, called InterEnerStat, is to improve the quality of energy data by harmonising definitions for energy sources and flows. As a result of this work, the IEA has made some small changes in the terminology that do not affect the definitions. A few examples include: transformation sector becomes transformation energy sector becomes energy industry own use petroleum products becomes oil products


OIL INFORMATION: BEYOND 2020 DOCUMENTATION - I.9
INTERNATIONAL ENERGY AGENCY
2. DESCRIPTION OF THE B20/20 SERVICE
1) OECD Crude Supply (AOSCRUDE) Information is provided in the form of supply and demand balances, presenting indigenous production, imports, exports, stock changes, and refinery. 2) OECD Product Supply and Consumption (AOSPROD) Information is provided in the form of supply and demand balances, presenting refinery gross output, recycled products, imports, exports, transfers, stock changes, international marine bunkers and gross deliveries. In addition, the table includes data on inland deliveries by sector: transformation, energy, transport, industry and other, as well as the non-energy use.
3) OECD Imports (AOSIMPS) Information on OECD member countries’ imports from 101 origins for some 20 oil products. This includes
crude oil, NGLs, motor gasoline, gas/diesel oil, resid-ual fuel oil and 16 other refined products.
4) OECD Exports (AOS_EXPS)
Information on OECD member countries’ exports to 94 destinations for some 20 oil products. Included are: crude oil, NGLs, motor gasoline, gas/diesel oil, resid-ual fuel oil and 16 other refined products.
5) OECD Conversion Factors (AOSCONV)
This table includes the average conversion factors from metric tons to barrels, for the OECD countries and for some 20 oil products.
6) World Oil Statistics (AOSWORLD)
Information is provided on crude oil and NGL production, refinery output, trade and oil demand for the world.


OIL INFORMATION: BEYOND 2020 DOCUMENTATION - I.11
INTERNATIONAL ENERGY AGENCY
3. RECENT DATA REVISIONS
The IEA Secretariat finalised processing the latest submissions of energy statistics from OECD Member countries on 31 March 2010 (covering the period 1960 - 2008). These data were subsequently published in IEA/OECD Energy Statistics of OECD Countries –2010 Edition and in IEA/OECD Energy Balances of OECD Countries 2010 Edition.
Oil supply and demand data for all OECD countries are available for years 1971-2007. For 2008, only supply data are available; end-use consumption data usually lag one to two years.
In addition, supply and demand data are available for years 1960-1970, with the following exceptions:
• Czech Republic 1971 onwards • Hungary 1965 onwards • Korea 1970 onwards
• Mexico 1971 onwards • Slovak Republic 1971 onwards
As a result, regional totals will not be calculated for years 1960-1970, inclusive.
Data for non-OECD countries are primarily from IEA's database on World Energy Statistics. The database cov-ers supply and demand for all forms of energy for over 100 non-OECD countries for the period 1971 to 2008. The data have been collected from national statistical publications and through collaboration with other inter-national organisations and the energy industry. Non-OECD data for 2008 and 2009 in Part II of Oil Infor-mation 2010 are provisional. The complete and final results obtained from this work will be published in the annual IEA publications Energy Statistics of Non-OECD Countries 2010 Edition and Energy Balances of Non-OECD Countries 2010 Edition.
OECD Data
Non-OECD Data


OIL INFORMATION: BEYOND 2020 DOCUMENTATION - I.13
INTERNATIONAL ENERGY AGENCY
4. FLOW DEFINITIONS
Supply and consumption Flow Short name Definition
Refinery gross out-put
REFGROUT This is the production of finished products at a refinery or blending plant. This category excludes refinery losses, but includes refinery fuel.
Inputs of recycled products
RECYCLED These are finished products which are returned through the refining and/or the marketing network after delivery to final consumers (for example used lubricants which are reprocessed).
Imports IMPORTS Comprise amounts having crossed the national territorial boundaries of the country whether or not customs clearance has taken place. Quantities of crude oil and oil products imported under processing agreements (i.e. refining on account) are included. Quantities of oil in transit are excluded. Crude oil, NGL and natural gas are reported as com-ing from the country of origin; refinery feedstocks and oil products are reported as coming from the country of last consignment.
Exports EXPORTS Comprise amounts having crossed the national territorial boundaries of the country whether or not customs clearance has taken place. Quantities of crude oil and oil products exported under processing agreements (i.e. refining on account) are included. Re-exports of oil imported for processing within bonded areas are shown as an export of product from the processing country to the final destination.
International marine bunkers
BUNKERS Bunkers cover the quantities of fuels delivered to sea-going ships of all flags, including warships. Consumption by ships engaged in trans-port in inland and coastal waters is not included (see Transport, below).
Transfers TRANSFERS These are finished products which have been reclassified and re-entered for use in a refinery without having been delivered to final consumers. This heading also covers transfers between products which are reclassified after blending, for example transfers between kerosene type jet fuel and kerosene.

I.14 - OIL INFORMATION: BEYOND 2020 DOCUMENTATION
INTERNATIONAL ENERGY AGENCY
Supply and consumption Flow Flow Flow
Stock changes STOCKCHA Stock changes reflect the difference between opening stock level at the first day of the year and closing stock level at the last day of the year of stocks held on national territory. A stock build is shown as a negative number and a stock draw as a positive number.
Statistical differ-ences
STATDIFF National administrations sometimes obtain the data components of domestic availability from a variety of sources. Owing to differences in concepts, coverage, timing and definitions, observed and calculated consumption are often not identical. This is reflected in statistical dif-ferences.
Inland demand (To-tal consumption)
TOTCONS This is the gross observed inland consumption (including refinery consumption for oil), before the deduction of amounts returned by the petrochemical industry (backflow).
Transformation TOTTRANF This comprises fuel inputs to both public and private electricity, com-bined heat and power plants and heat plants. An autoproducer is an industrial establishment which, in addition to its main activities, gen-erates electricity, wholly or partly for its own use. It includes railway's own production of electricity. Heat plants and combined heat and power plants only cover fuel inputs for that part of the heat which is sold to a third party. Transformation also comprises fuels used as feedstocks in gas works, coke ovens, blast furnaces and the petro-chemical industry.
Main activity producer electricity plants
MAINELEC Includes inputs of oil for the production of electricity in electricity plants whose primary purpose is to produce, transmit or distribute electricity.
Autoproducer electricity plants
AUTOELEC Includes inputs of oil for the production of electricity by an enterprise which, in addition to its main activities, generates electricity wholly or partly for its own use, e.g. industrial establishments, railways, refiner-ies, etc.
Main activity producer CHP plants
MAINCHP Refers to plants which are designed to produce both heat and electric-ity (sometimes referred to as co-generation power stations). If possible, fuel inputs and electricity/heat outputs are on a unit basis rather than on a plant basis. However, if data are not available on a unit basis, the convention for defining a CHP plant noted above should be adopted. Main activity producers (formerly referred to as public supply undertakings) generate electricity and/or heat for sale to third parties, as their primary activity. They may be privately or pub-licly owned. Note that the sale need not take place through the public grid.

OIL INFORMATION: BEYOND 2020 DOCUMENTATION - I.15
INTERNATIONAL ENERGY AGENCY
Supply and consumption Flow Flow Flow
Autoproducer CHP plants
AUTOCHP Refers to plants which are designed to produce both heat and electric-ity (sometimes referred to as co-generation power stations). If possible, fuel inputs and electricity/heat outputs are on a unit basis rather than on a plant basis. However, if data are not available on a unit basis, the convention for defining a CHP plant noted above should be adopted. Note that for autoproducer CHP plants, all fuel inputs to electricity production are taken into account, while only the part of fuel inputs to heat sold is shown. Fuel inputs for the production of heat consumed within the autoproducer's establishment are not in-cluded here but are included with figures for the final consumption of fuels in the appropriate consuming sector. Autoproducer undertakings generate electricity and/or heat, wholly or partly for their own use as an activity which supports their primary activity. They may be pri-vately or publicly owned.
Main activity producer heat plants
MAINHEAT Refers to plants (including heat pumps and electric boilers) designed to produce heat only and who sell heat to a third party (e.g. residen-tial, commercial or industrial consumers) under the provisions of a contract. Main activity producers (formerly referred to as public sup-ply undertakings) generate heat for sale to third parties, as their primary activity. They may be privately or publicly owned. Note that the sale need not take place through the public grid.
Autoproducer heat plants
AUTOHEAT Refers to plants (including heat pumps and electric boilers) designed to produce heat only and who sell heat to a third party (e.g. residen-tial, commercial or industrial consumers) under the provisions of a contract. Autoproducer undertakings generate heat, wholly or partly for their own use as an activity which supports their primary activity. They may be privately or publicly owned.
Gas works TGASWKS Includes the manufacture of town gas.
For blended natural gas
TBLENDGAS Includes other gases that are blended with natural gas.
Coke ovens TCOKEOVS Includes the manufacture of coke and coke oven gas.

I.16 - OIL INFORMATION: BEYOND 2020 DOCUMENTATION
INTERNATIONAL ENERGY AGENCY
Supply and consumption Flow Flow Flow
Blast furnaces TBLASTFUR Includes the production of town gas, blast furnace gas and oxygen steel furnace gas. The production of pig-iron from iron ore in blast furnaces uses fuels for supporting the blast furnace charge and providing heat and carbon for the reduction of the iron ore. Accounting for the calorific con-tent of the fuels entering the process is a complex matter as transformation (into blast furnace gas) and consumption (heat of combus-tion) occur simultaneously. Some carbon is also retained in the pig-iron; almost all of this reappears later in the oxygen steel furnace gas (or con-verter gas) when the pig-iron is converted to steel. In the 1992/1993 annual questionnaires, Member Countries were asked for the first time to report in the transformation the quantities of all fuels (e.g. pulverised coal injection [PCI] coal, coke oven coke, natural gas and oil) entering blast furnaces and the quantity of blast furnace gas and oxygen steel furnace gas produced. The Secretariat then needed to split these inputs into the transformation and consumption components. The transformation com-ponent is shown in the row blast furnaces/gas works in the column appropriate for the fuel, and the consumption component is shown in the row iron and steel, in the column appropriate for the fuel. The Secretariat decided to assume transformation efficiency such that the carbon input into the blast furnaces should equal the carbon output. This is roughly equivalent to assuming an energy transformation efficiency of 40%.
Petrochemical industry
TPETCHEM Includes quantities of backflows returned from the petrochemical sec-tor, whether returned to refineries for further processing/blending or used directly. It refers to oil products only.
Patent fuel plants TPATFUEL Includes the manufacture of patent fuels.
Non-specified (Transformation)
TNONSPEC Includes other non-specified transformation.
Energy industry own use
TOTENGY Fuels used by energy industries for heating purposes and for operation of their equipment are reported under this heading as well as trans-formation and distribution losses. It includes coal mining and oil and gas extraction (all activities involved in making oil and gas market-able up to the point of shipment from the producing area) as well as transformation industries such as electricity generating plants, gas works, coke ovens, and petroleum refineries (refinery fuels).
Coal mines EMINES Represents the energy which is used directly within the coal industry for hard coal and lignite mining. It excludes coal burned in pithead power stations (included under electricity plants in transformation) and free allo-cations to miners and their families (considered as part of household consumption and therefore included under residential).
Oil and gas extraction
EOILGASEX Represents the energy which is used for oil and gas extraction. Flared gas is not included.
Refinery fuel REFFUEL Includes oil consumed in refineries for the operation of equipment, heating and light.
OIL INFORMATION: BEYOND 2020 DOCUMENTATION - I.17
INTERNATIONAL ENERGY AGENCY
Supply and consumption Flow Flow Flow
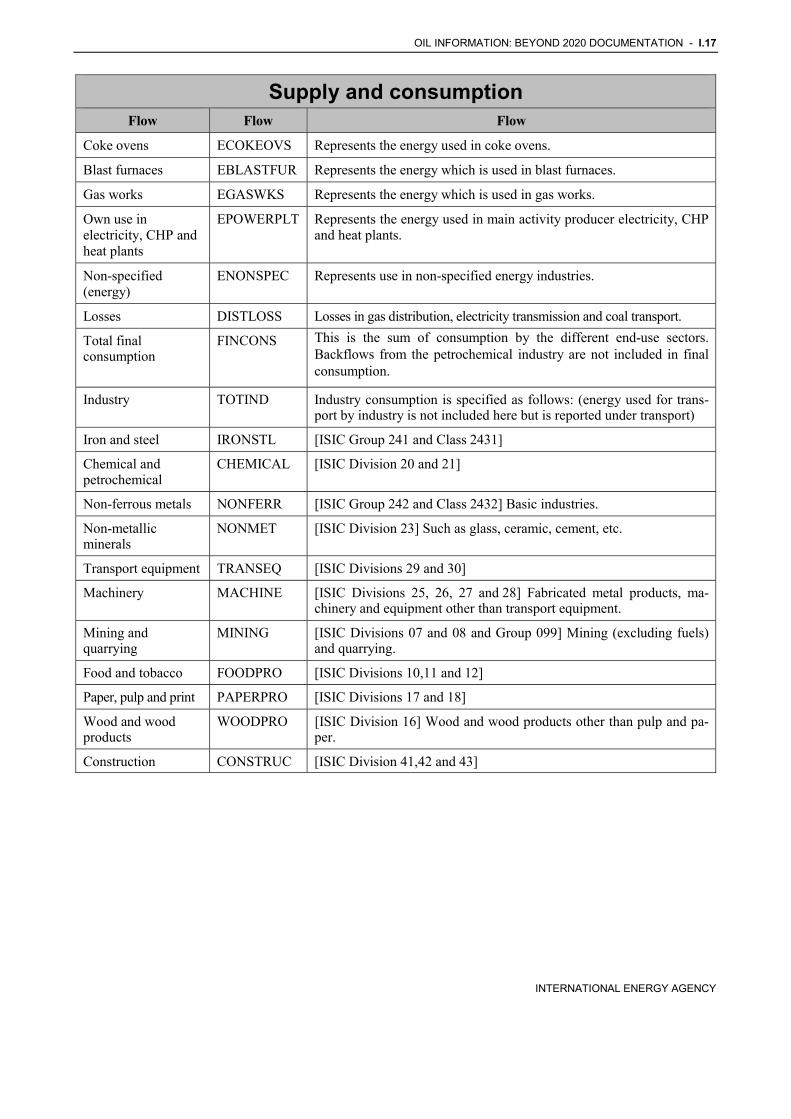
Coke ovens ECOKEOVS Represents the energy used in coke ovens.
Blast furnaces EBLASTFUR Represents the energy which is used in blast furnaces.
Gas works EGASWKS Represents the energy which is used in gas works.
Own use in electricity, CHP and heat plants
EPOWERPLT Represents the energy used in main activity producer electricity, CHP and heat plants.
Non-specified (energy)
ENONSPEC Represents use in non-specified energy industries.
Losses DISTLOSS Losses in gas distribution, electricity transmission and coal transport.
Total final consumption
FINCONS This is the sum of consumption by the different end-use sectors. Backflows from the petrochemical industry are not included in final consumption.
Industry TOTIND Industry consumption is specified as follows: (energy used for trans-port by industry is not included here but is reported under transport)
Iron and steel IRONSTL [ISIC Group 241 and Class 2431]
Chemical and petrochemical
CHEMICAL [ISIC Division 20 and 21]
Non-ferrous metals NONFERR [ISIC Group 242 and Class 2432] Basic industries.
Non-metallic minerals
NONMET [ISIC Division 23] Such as glass, ceramic, cement, etc.
Transport equipment TRANSEQ [ISIC Divisions 29 and 30]
Machinery MACHINE [ISIC Divisions 25, 26, 27 and 28] Fabricated metal products, ma-chinery and equipment other than transport equipment.
Mining and quarrying
MINING [ISIC Divisions 07 and 08 and Group 099] Mining (excluding fuels) and quarrying.
Food and tobacco FOODPRO [ISIC Divisions 10,11 and 12]
Paper, pulp and print PAPERPRO [ISIC Divisions 17 and 18]
Wood and wood products
WOODPRO [ISIC Division 16] Wood and wood products other than pulp and pa-per.
Construction CONSTRUC [ISIC Division 41,42 and 43]

I.18 - OIL INFORMATION: BEYOND 2020 DOCUMENTATION
INTERNATIONAL ENERGY AGENCY
Supply and consumption Flow Short name Definition
Textile and leather TEXTILES [ISIC Divisions 13, 14 and 15]
Non-specified (Industry) INONSPEC [ISIC Divisions 22, 31 and 32] Any manufacturing industry not included above. Note: Most countries have difficulties supplying an industrial breakdown for all fuels. In these cases, the non-specified industry row has been used. Regional aggregates of industrial con-sumption should therefore be used with caution.
Transport TOTTRANS This covers oil products to all transport activities regardless of the economic sector.
International aviation INTLAIR Includes deliveries of aviation fuels to aircraft for international aviation. Fuels used by airlines for their road vehicles are excluded. The domestic/international split should be determined on the basis of departure and landing locations and not by the nationality of the airline. For many countries this incorrectly excludes fuel used by domestically owned carriers for their international departures.
Domestic aviation DOMESAIR Includes deliveries of aviation fuels to aircraft for domestic avia-tion - commercial, private, agricultural, etc. It includes use for purposes other than flying, e.g. bench testing of engines, but not airline use of fuel for road transport. The domestic/international split should be determined on the basis of departure and landing locations and not by the nationality of the airline. Note that this may include journeys of considerable length between two airports in a country (e.g. San Francisco to Honolulu). For many countries this incorrectly includes fuel used by domestically owned carriers for outbound international traffic;
Road ROAD Includes fuels used in road vehicles as well as agricultural and in-dustrial highway use. Excludes military consumption as well as motor gasoline used in stationary engines and diesel oil for use in tractors that are not for highway use;
Rail RAIL Includes quantities used in rail traffic, including industrial railways;
Pipeline transport PIPELINE Includes energy used in the support and operation of pipelines transporting gases, liquids, slurries and other commodities, includ-ing the energy used for pump stations and maintenance of the pipeline. Energy for the pipeline distribution of natural or manufac-tured gas, hot water or steam (ISIC Division 35) from the distributor to final users is excluded and should be reported in the energy industry own use, while the energy used for the final distri-bution of water (ISIC Division 36) to household, industrial, commercial and other users should be included in commercial/public services. Losses occurring during the transport between dis-tributor and final users should be reported as distribution losses;

OIL INFORMATION: BEYOND 2020 DOCUMENTATION - I.19
INTERNATIONAL ENERGY AGENCY
Supply and consumption Flow Short name Definition
Domestic navigation DOMESNAV Includes fuels delivered to vessels of all flags not engaged in inter-national navigation (see international marine bunkers). The domestic/international split should be determined on the basis of port of departure and port of arrival and not by the flag or national-ity of the ship. Note that this may include journeys of considerable length between two ports in a country (e.g. San Francisco to Hono-lulu). Fuel used for ocean, coastal and inland fishing and military consumption are excluded;
Non-specified (transport) TRNONSPE Includes all transport not elsewhere specified. Note: International marine bunkers are shown in Supply and are not included in the transport as part of final consumption.
Other TOTOTHER Includes residential, commercial/public services, agriculture/forestry, fishing and non-specified (other).
Residential RESIDENT Includes consumption by households, excluding fuels used for transport. Includes households with employed persons [ISIC Divi-sion 97 and 98] which is a small part of total residential consumption.
Commercial and public services
COMMPUB [ISIC Divisions 33, 36-39, 45-47, 52-53, 55-56,58-66,68-75, 77-82, 84-96 and 99(excluding Class 8422), 85-88, 90-96 and 99]
Agriculture/forestry AGRICULT Includes deliveries to users classified as agriculture, hunting and forestry by the ISIC, and therefore includes energy consumed by such users whether for traction (excluding agricultural highway use), power or heating (agricultural and domestic) [ISIC Divisions 01 and 02].
Fishing FISHING Includes fuels used for inland, coastal and deep-sea fishing. Fishing covers fuels delivered to ships of all flags that have refuelled in the country (including international fishing) as well as energy used in the fishing industry [ISIC Division 03].
Non-specified (other) ONONSPEC Includes all fuel use not elsewhere specified as well as consump-tion in the above-designated categories for which separate figures have not been provided. Military fuel use for all mobile and station-ary consumption is included here (e.g. ships, aircraft, road and energy used in living quarters) regardless of whether the fuel deliv-ered is for the military of that country or for the military of another country.
Memo: Non-energy use NONENUSE This is the total of Chem./petchem. feedstocks and Other, below.
Memo: Non-energy use chemical/petrochemical
NECHEM Concerns feedstocks for non-energy use in the chemical and petro-chemical industry.
Memo: Other non-energy use
OTHERNE Oil products used for non-energy purposes in all other sectors. This is usually the case for all consumption of lubricants, bitumen, white spirit and paraffin waxes. Petroleum coke is shown as non-energy use only when there is evidence of such use (for example in non-ferrous metals industry).

I.20 - OIL INFORMATION: BEYOND 2020 DOCUMENTATION
INTERNATIONAL ENERGY AGENCY
Supply and consumption Flow Short name Definition
Closing stock level (National Territory)
CSNATTER Refer to closing stock levels, at the last day of the year, of stocks held on national territory (including government controlled stocks).

OIL INFORMATION: BEYOND 2020 DOCUMENTATION - I.21
INTERNATIONAL ENERGY AGENCY
OECD Crude supply Flow Short name Definition
Indigenous production INDPROD This includes all production within national boundaries, including offshore production. Production includes only marketable production, and excludes volumes returned to formation.
From other sources OSOURCES Refers supplies of additives, biofuels and Other hydrocarbons, the production of which has already been covered in other fuel balances.
Backflows BACKFLOW Backflows cover cracking residues and other products from the chemical and petrochemical industries, which are returned to refiner-ies and used as feedstocks. Transfers from one refinery to another within the country are not included.
Products transferred PTRANSF These are imported products which are reclassified as feedstocks for further processing in the refinery, without delivery to final consum-ers.
Imports IMPORTS See the definition under “Supply and Consumption”
Exports EXPORTS See the definition under “Supply and Consumption”
Statistical differences STATDIFF See the definition under “Supply and Consumption”
Refinery intake REFINOBS See the definition under “Supply and Consumption”
Refinery losses REFLOSS Refers the difference between Refinery intake (observed) and Gross Refinery Output.
Closing stock level (national territory)
CSNATTER See the definition under “Supply and Consumption”


OIL INFORMATION: BEYOND 2020 DOCUMENTATION - I.23
INTERNATIONAL ENERGY AGENCY
5. PRODUCT DEFINITIONS
Oil products Product Short name Definition
Crude oil CRUDEOIL Crude oil is a mineral oil of natural origin comprising a mixture of hydrocarbons and associated impurities, such as sulphur. It exists in the liquid phase under normal surface temperature and pressure and its physical characteristics (density, viscosity, etc.) are highly variable. This category includes field or lease condensate recov-ered from associated and non-associated gas where it is commingled with the commercial crude oil stream.
Natural gas liquids NGL NGL are liquid or liquefied hydrocarbons recovered from natural gas in separation facilities or gas processing plants. Natural gas liquids include ethane, propane, butane (normal and iso-), (iso) pentane and pentanes plus (sometimes referred to as natural gaso-line or plant condensate).
Refinery feedstocks REFFEEDS A refinery feedstock is a processed oil destined for further proc-essing (e.g. straight run fuel oil or vacuum gas oil) other than blending in the refining industry. It is transformed into one or more components and/or finished products. This definition cov-ers those finished products imported for refinery intake and those returned from the petrochemical industry to the refining industry.
Additives/blending components
ADDITIVE Additives are non-hydrocarbon substances added to or blended with a product to modify its properties, for example, to improve its combustion characteristics. Alcohols and ethers (MTBE, methyl tertiary-butyl ether) and chemical alloys such as tetraethyl lead are included here. The biomass fractions of biogasoline, bio-diesel and ethanol are not included here, but under liquid biomass. This differs from the presentation of additives in the Oil Informa-tion publication.
Other hydrocarbons NONCRUDE Other hydrocarbons, including emulsified oils (e.g. orimulsion), synthetic crude oil, mineral oils extracted from bituminous miner-als such as oil shale, bituminous sand, etc. and liquids from coal liquefaction, are included here.

I.24 - OIL INFORMATION: BEYOND 2020 DOCUMENTATION
INTERNATIONAL ENERGY AGENCY
Oil products Oil products are any oil-based products which can be obtained by distillation and are normally used outside the refining industry. The exceptions to this are those finished products which are classified as refinery feedstocks.
Product Short name Definition
Refinery gas REFINGAS Refinery gas includes a mixture of non-condensable gases mainly consisting of hydrogen, methane, ethane and olefins obtained during distillation of crude oil or treatment of oil products (e.g. cracking) in refineries. This also includes gases which are returned from the pet-rochemical industry.
Ethane ETHANE A naturally gaseous straight-chain hydrocarbon (C2H6), extracted from natural gas and refinery gas streams.
Liquefied petroleum gases
LPG LPG is light saturated paraffinic hydrocarbons derived from the re-finery processes, crude oil stabilisation and natural gas processing plants. They consist mainly of propane (C3H8) and butane (C4Hl0) or a combination of the two. They are normally liquefied under pres-sure for transportation and storage.
Motor gasoline MOTORGAS Motor gasoline consists of a mixture of light hydrocarbons distilling between 35oC and 215oC. It is used as a fuel for land based spark ignition engines. Motor gasoline may include additives, oxygenates and octane enhancers, including lead compounds such as TEL (tetra-ethyl lead) and TML (tetramethyl lead).
This category includes motor gasoline blending components (exclud-ing additives/oxygenates), e.g. alkylates, isomerate, reformate, cracked gasoline destined for use as finished motor gasoline.
Of which : biogasoline
BIOGASOL Biogasoline includes bioethanol (ethanol produced from biomass and/or the biodegradable fraction of waste), biomethanol (methanol produced from biomass and/or the biodegradable fraction of waste), bioETBE (ethyl-tertio-butyl-ether produced on the basis of bioetha-nol; the percentage by volume of bioETBE that is calculated as biofuel is 47%) and bioMTBE (methyl-tertio-butyl-ether produced on the basis of biomethanol: the percentage by volume of bioMTBE that is calculated as biofuel is 36%).
Aviation gasoline AVGAS This is motor spirit prepared especially for aviation piston engines, with an octane number suited to the engine, a freezing point of −60oC and a distillation range usually within the limits of 30oC and 180oC.
Gasoline type jet fuel JETGAS This includes all light hydrocarbon oils for use in aviation turbine power units, distilling between 100oC and 250oC. They are obtained by blending kerosenes and gasoline or naphthas in such a way that the aromatic content does not exceed 25% in volume, and the vapour pressure is between 13.7kPa and 20.6kPa.

OIL INFORMATION: BEYOND 2020 DOCUMENTATION - I.25
INTERNATIONAL ENERGY AGENCY
Oil products Oil products are any oil-based products which can be obtained by distillation and are normally used outside the refining industry. The exceptions to this are those finished products which are classified as refinery feedstocks.
Product Short name Definition
Kerosene type jet fuel
JETKERO This is a distillate used for aviation turbine power units. It has the same distillation characteristics between 150oC and 300oC (generally not above 250oC) and flash point as kerosene. In addition, it has particular specifications (such as freezing point) which are estab-lished by the International Air Transport Association (IATA).
Other kerosene OTHKERO Kerosene comprises refined petroleum distillate and is used in end use sectors other than aircraft transport. It distils between 150oC and 300oC.
Gas/diesel oil GASDIES Gas/diesel oil is primarily a medium distillate distilling between 180ºC and 380ºC. Several grades are available depending on uses: diesel oil for diesel compression ignition (cars, trucks, marine, etc.); light heating oil for industrial and commercial uses; other gas oil including heavy gas oils which distil between 380oC and 540oC and which are used as petrochemical feedstocks.
Of which: biodiesels BIODIESEL Biodiesels includes biodiesel (a methyl-ester produced from vegeta-ble or animal oil, of diesel quality), biodimethylether (dimethylether produced from biomass), Fischer Tropsh (Fischer Tropsh produced from biomass), cold pressed bio-oil (oil produced from oil seed through mechanical processing only) and all other liquid biofuels which are added to, blended with or used straight as transport diesel.
Heavy fuel oil RESFUEL This covers all residual (heavy) fuel oils (including those obtained by blending). Kinematic viscosity is above 10 cSt at 80ºC. The flash point is always above 50oC and density is always more than 0.90 kg/l.
- Low-sulphur content: Heavy fuel oil with sulphur content lower than 1%.
- High-sulphur content: Heavy fuel oil with sulphur content of 1% or higher.
Naphtha NAPHTHA Naphtha is a feedstock destined for the petrochemical industry (e.g. ethylene manufacture or aromatics production). Naphtha comprises material in the 30oC and 2l0oC distillation range or part of this range.

I.26 - OIL INFORMATION: BEYOND 2020 DOCUMENTATION
INTERNATIONAL ENERGY AGENCY
Oil products Oil products are any oil-based products which can be obtained by distillation and are normally used outside the refining industry. The exceptions to this are those finished products which are classified as refinery feedstocks.
Product Short name Definition
White spirit & SBP WHITESP White Spirit and SBP are defined as refined distillate intermediates with a distillation in the naphtha/kerosene range. They are sub-divided as:
i. Industrial Spirit (SBP): Light oils distilling between 30oC and 200oC. There are 7 or 8 grades of industrial spirit, depending on the position of the cut in the distillation range. The grades are de-fined according to the temperature difference between the 5% volume and 90% volume distillation points (which is not more than 60oC).
ii. White Spirit: Industrial spirit with a flash point above 30oC. The distillation range of white spirit is 135oC to 200oC.
Lubricants LUBRIC Lubricants are hydrocarbons produced from distillate or residue; they are mainly used to reduce friction between bearing surfaces. This category includes all finished grades of lubricating oil, from spindle oil to cylinder oil, and those used in greases, including motor oils and all grades of lubricating oil-based stocks.
Bitumen BITUMEN Bitumen is a solid, semi-solid or viscous hydrocarbon with a colloi-dal structure, being brown to black in colour, obtained as a residue in the distillation of crude oil, by vacuum distillation of oil residues from atmospheric distillation. Bitumen is often referred to as asphalt and is primarily used for construction of roads and for roofing mate-rial. This category includes fluidized and cut-back bitumen.
Paraffin waxes PARWAX These are saturated aliphatic hydrocarbons. These waxes are residues extracted when dewaxing lubricant oils. They have a crystalline structure which is more-or-less fine according to the grade. Their main characteristics are as follows: they are colourless, odourless and translucent, with a melting point above 45oC.
Petroleum coke PETCOKE Petroleum coke is a black solid residue, obtained mainly by cracking and carbonising residue feedstock, tar and pitches in processes such as delayed coking or fluid coking. It consists mainly of carbon (90 to 95%) and has a low ash content. It is used as a feedstock in coke ovens for the steel industry, for heating purposes, for electrode manufacture and for production of chemicals. The two most impor-tant qualities are “green coke” and “calcinated coke.” This category also includes “catalyst coke” deposited on the catalyst during refin-ing processes; this coke is not recoverable and is usually burned as refinery fuel.
Other products ONONSPEC All products not specifically mentioned above, for example: tar and sulphur. This category also includes aromatics (e.g. BTX or benzene, toluene and xylene) and olefins (e.g. propylene) produced within re-fineries.

OIL INFORMATION: BEYOND 2020 DOCUMENTATION - I.27
INTERNATIONAL ENERGY AGENCY
6. GEOGRAPHICAL COVERAGE
Countries and regions Country/Region Short name Definition
Australia AUSTRALI Excludes the overseas territories.
Austria AUSTRIA
Belgium BELGIUM
Canada CANADA
Czech Republic CZECH
Denmark DENMARK Excludes Greenland and the Danish Faroes, except prior to 1990, where data on oil for Greenland were included with the Danish sta-tistics. The Administration is planning to revise the series back to 1974 to exclude these amounts.
Finland FINLAND
France FRANCE Includes Monaco. It excludes Andorra and the overseas territories Guadeloupe, Martinique, French Guyana, Reunion, St.-Pierre and Miquelon, New Caledonia, French Polynesia, Wallis and Futuna, Mayotte.
Germany GERMANY Includes the new federal states of Germany from 1970 onwards.
Greece GREECE
Hungary HUNGARY
Iceland ICELAND
Ireland IRELAND
Italy ITALY Includes San Marino and the Vatican.
Japan JAPAN Includes Okinawa.
Korea KOREA
Luxembourg LUXEMBOU
Mexico MEXICO
Netherlands NETHLAND Excludes Suriname and the Netherlands Antilles.

I.28 - OIL INFORMATION: BEYOND 2020 DOCUMENTATION
INTERNATIONAL ENERGY AGENCY
Countries and regions Country/Region Short name Definition
New Zealand NZ
Norway NORWAY
Poland POLAND
Portugal PORTUGAL Includes the Azores and Madeira.
Slovak Republic SLOVAKIA
Spain SPAIN Includes the Canary Islands.
Sweden SWEDEN
Switzerland SWITLAND Does not include Liechtenstein.
Turkey TURKEY
United Kingdom UK Includes Jersey, Guernsey and the Isle of Mann.
United States USA Includes the 50 states and the District of Columbia. Oil statistics as well as coal trade statistics also include Puerto Rico, Guam, the U.S. Virgin Islands, American Samoa, Johnston Atoll, Midway Islands, Wake Island and the Northern Mariana Islands.
OECD1 Total OECDTOT Includes Australia, Austria, Belgium, Canada, the Czech Republic, Denmark, Finland, France, Germany, Greece, Hungary, Iceland, Ireland, Italy, Japan, Korea, Luxembourg, Mexico, the Netherlands, New Zealand, Norway, Poland, Portugal, the Slovak Republic, Spain, Sweden, Switzerland, Turkey, the United Kingdom and the United States.
OECD North America
OECDNAM Includes Canada, Mexico and the United States.
OECD Pacific OECDPAC Includes Australia, Japan, Korea and New Zealand.
OECD Europe OECDEUR Includes Austria, Belgium, the Czech Republic, Denmark, Finland, France, Germany, Greece, Hungary, Iceland, Ireland, Italy, Luxembourg, the Netherlands, Norway, Poland, Portugal, the Slovak Republic, Spain, Sweden, Switzerland, Turkey and the United Kingdom.
IEA IEATOT Comprises OECD countries except Iceland and Mexico.
1. Chile became a member country of the OECD with effect from 7 May 2010. Since the preparation of the annual statistics publications was well on its way at that stage, data for Chile have not been included in OECD totals for the 2010 edition and will continue to be included in Latin America with the OECD non-member countries. The IEA Secretariat will work closely with the Chilean Administration, especially on the consistency of the time series, for incorporating Chile into OECD totals in the 2011 edition.

OIL INFORMATION: BEYOND 2020 DOCUMENTATION - I.29
INTERNATIONAL ENERGY AGENCY
Countries and regions Country/Region Short name Definition
Middle East MIDDLEEAST Bahrain, Islamic Republic of Iran, Iraq, Israel2, Jordan, Kuwait, Lebanon, Oman, Qatar, Saudi Arabia, Syrian Arab Republic, United Arab Emirates and Yemen.
Non-OECD Europe NONOECDEUR Comprises Albania, Bulgaria, Cyprus3, Gibraltar, Malta, Romania, and Former Yugoslavia.
Former Yugoslavia Comprises Bosnia-Herzegovina, Croatia, Former Yugoslav Repub-lic of Macedonia, Serbia4 and Montenegro, and Slovenia.
Former Soviet Union
FORMERUSSR Comprises Armenia, Azerbaijan, Belarus, Estonia, Georgia, Ka-zakhstan, Kyrgyzstan, Latvia, Lithuania, Moldova, Russian Federation, Tajikistan, Turkmenistan, Ukraine, and Uzbekistan.
OPEC Comprises Algeria, Angola, Ecuador, Islamic Republic of Iran, Iraq, Kuwait, Libyan Arab Jamahiriya, Nigeria, Qatar, Saudi Arabia, United Arab Emirates and Venezuela.
China CHINA Includes People’s Republic of China and Hong Kong, China.
2. The statistical data for Israel are supplied by and under the responsibility of the relevant Israeli authorities. The use of such data by the OECD is without prejudice to the status of the Golan Heights, East Jerusalem and Israeli settlements in the West Bank under the terms of international law. 3. Note by Turkey: The information in this document with reference to “Cyprus” relates to the southern part of the Island. There is no single authority representing both Turkish and Greek Cypriot people on the Island. Turkey recognizes the Turkish Republic of Northern Cyprus (TRNC). Until a lasting and equitable solution is found within the context of United Nations, Turkey shall preserve its position concerning the “Cyprus” issue. Note by all the European Union Member States of the OECD and the European Commission: The Republic of Cyprus is recognized by all members of the United Nations with the exception of Turkey. The information in this document relates to the area under the effective control of the Government of the Republic of Cyprus. 4. Data for Serbia include Montenegro until 2004 and Kosovo until 1999.


OIL INFORMATION: BEYOND 2020 DOCUMENTATION - I.31
INTERNATIONAL ENERGY AGENCY
7. COUNTRY NOTES Please note that as a result of revisions, data in Oil Information may differ from those published earlier in Energy Statistics of OECD Countries and Energy Balances of OECD Countries.
Oil data for 2009 are preliminary, based on Monthly Oil and Gas Statistics (MOS) unless otherwise specified. For some countries data in MOS are not fully compati-ble with Annual Oil Statistics (AOS), therefore MOS 2009 data have been adjusted in order to show consis-tent time series developments from 2008 to 2009.
All data: All data refer to fiscal years which run from 1 July to 30 June (e.g. 2009 = 1 July 2008 to 30 June 2009). Negative refinery losses are due to differences in treatment of transfers between refineries.
Data after 1973 are based on national surveys. Prior to 1973, there are no detailed data available for autopro-ducers and for sub-sector industry consumption. The large drop in industry consumption in 1982-83 is due to the restructuring of the iron and steel industry, the economic recession and one of the worst droughts in history. Crude oil: The drop in the production in 1999 is due to a gas explosion at Longford plant. There is a break in series for crude oil and NGL production between 2001 and 2002.
NGL: Prior to 1992, part of the NGL production is included in crude oil.
Refinery gas: Prior to 1974, refinery gas is reported net of consumption in refineries. LPG, ethane: LPG includes ethane prior to 1991.
Lubricants, white spirit, paraffin waxes: Consump-tion of lubricants, white spirit/SBP and paraffin waxes is reported as non-specified industry consumption, as no further breakdown is available.
Fuel oil: Imports of fuel oil are estimated by the Australian administration.
There is a break in series for consumption data be-tween 2001 and 2002, due to a change in data collection and estimation methodology.
Data were revised by the Austrian Administration back to 1990.
There are breaks in stock levels between 1989 and 1990.
The industry breakdown is based on a new survey from 1999 onwards.
Gas/diesel oil: For 1978 and 1979, industry consump-tion of gas/diesel oil is included with fuel oil.
Other products: As of 1978, "other products" include paraffin waxes and petroleum coke. Prior to 1990, they include also naphtha.
Lubricants: Before 1990 consumption of lubricants is reported in the road sector as no further breakdown is available.
Data for non-metallic minerals, machinery, min-ing/quarrying, food/beverages, tobacco, pulp/paper/ printing and construction are not available prior to 1971.
Australia Austria
Belgium

I.32 - OIL INFORMATION: BEYOND 2020 DOCUMENTATION
INTERNATIONAL ENERGY AGENCY
Inputs to electricity and CHP plants have been esti-mated by the Secretariat from year 1974, based on inputs reported in the Annual Electricity Questionnaire.
The new reporting system started from 2008.
Refinery feedstocks: The decrease of products trans-ferred in 1995 was due to refinery maintenance of one month.
Refinery gas: Prior to 1975, refinery gas is reported net of consumption in refineries.
LPG, gas/diesel oil: LPG and gas/diesel oil consump-tion in the commercial/public services sector is included with the residential sector prior to 1976.
Fuel oil: The break in series for fuel oil between 1975 and 1976 is due to a change in classification between the industry and "other". The decrease in industry consumption since 1993 is due to the introduction of an excise tax as well as the increased use of natural gas.
Other products, petroleum coke: The break in series between 1999 and 2000 is due to improvements in the collection system.
Other hydrocarbons: Indigenous production of other hydrocarbons represents synthetic crude oil produced from tar sands. Prior to 1990, hydrogen used for the upgrading of synthetic crude oil from “other sources” was included in the natural gas supply. From 1990, a different methodology was adopted by the Canadian administration.
Canada imported orimulsion from Venezuela from 1994 to 2000.
International marine bunkers are included with inland waterways prior to 1978.
LPG, ethane: LPG includes ethane prior to 1990. Ethane is mainly used as petrochemical feedstock.
Kerosene, gas/diesel oil, fuel oil: Several breaks in series exist for detailed industrial consumption prior to 1980. From 1980, all consumption data are based on one survey. However, from 1988 onwards, data for transport equipment, machinery, food, and textiles are not available as Statistics Canada has ceased the col-lection of these data. Separate consumption data for agriculture (including forestry) are available from 1983 for kerosene, from 1973 for gas/diesel oil and
from 1978 for fuel oil. For previous years, agriculture consumption is included with residential.
Gas/diesel oil: As of 1982, gas/diesel oil consumed by fleets in the wholesale/retail service industry is re-ported in the commerce/public services sector. Prior to 1982, it was included in the road sector.
Gasoline type jet fuel: Prior to 1979, gasoline type jet fuel is included with kerosene type jet fuel.
Naphtha, other products: Recycled products for naphtha and “other products” include purchases of feedstock and other additives from non-reporting companies.
Data are available starting in 1971.
Consumption data prior to 1994 are estimated by the Secretariat. The Czech Administration submitted offi-cial data from 1994 onwards.
Gas/Diesel Oil: From 1999 the Czech Administration has implemented a new updating system. It entails breaks in series for the final consumption.
Fuel oil, other products: From 2002 onwards, some amounts of fuel oil have been reclassified under other products. This change mainly affects the transforma-tion processes.
From 1990 onwards, Greenland and Faroe Island are not included in oil data.
Other hydrocarbons: Orimulsion imports and inputs to electricity generation begin in 1995. Orimulsion import stopped in 2002.
Refinery gas: Prior to 1975, refinery gas is reported net of consumption in refineries.
Gas/diesel oil, fuel oil: Prior to 1990, gas/diesel oil and fuel oil used for fishing is included in the inland waterways sector, while after this date it is reported in the agriculture sector.
Fuel oil: From 1974 to 1979, consumption of fuel oil for the CHP production by autoproducers has been estimated. The marked increase in inputs to CHP pro-duction in 1994 is due to increased electricity exports to Norway.
Canada
Czech Republic
Denmark

OIL INFORMATION: BEYOND 2020 DOCUMENTATION - I.33
INTERNATIONAL ENERGY AGENCY
All oil consumption in the commercial/public services sector is included in residential prior to 1976 except fuel oil which is shown separately in 1975.
Paraffin waxes: As of 1987, separate data on paraffin waxes are no longer available.
Gasoline type jet fuel: Consumption of gasoline type jet fuel ceased in 1988. From 1989 onwards, only kerosene type jet fuel is consumed.
Other products: Information on recycling and end-use consumption begins in 1989, and refers to waste oil.
Data for end-use consumption may vary from year to year due to a detailed survey which is sent to compa-nies in Denmark every other year. For non-survey years, the consumption by end-use is estimated by the Danish Energy Agency.
Due to better survey methods, inputs to electricity and heat generation are reclassified as of 1994. There is therefore a break in series between 1993 and 1994. The oil inputs used in industrial sub-sectors for pro-ducing surplus of heat, which is delivered to district heating networks, are allocated to these industrial sub-sectors.
Detail in industry for 1994 and 1995 is based on a new survey.
Fuel oil: There is a break in other between 1998 and 1999 due to a new calculation model. Petroleum coke: Data on petroleum coke are only available from 1985 onwards.
Before 2002, petroleum coke used as refinery fuel was included with refinery gas.
In 1995, there is a break in series for oil products trade due to the aligning of the National Board of Customs trade data collection system with the European Union's Intrastat system.
NGL: Ethylene produced in Lacq is not included in NGL from 2001 onwards.
Additives and oxygenates: Data are available from 1991. Petroleum coke: The split of petroleum coke consumption into energy and non-energy use is not available prior to 1982. Data for non-ferrous metals is
not available since 2000, hence included in non-specified industry.
LPG, ethane: LPG includes ethane prior to 1988. Breaks in the time series for LPG consumption are due to improved data collection.
Prior to 1994, the separation of consumption of LPG by the tertiary sector between residential and commerce/public services have been estimated by the Secretariat.
Kerosene type jet fuel: The consumption includes military use as of 1998.
Gas/diesel oil: Consumption in the non-metallic min-erals sector has been reclassified as non-ferrous metals and vice-versa for years 1982 to 1994. Prior to 1985, residential sector consumption is reported under commerce/public service sector as no separate data were available.
Gas/diesel oil, fuel oil: Residential and commerce/public services sector consumption for gas/diesel and residual fuel oil has been estimated by the Secretariat from 1985 to 1998 based on information provided by the French Administration.
A different treatment of transfers was adopted from 1998. From 1998, imported oil products needing fur-ther refinery processing are no longer reported as refinery feedstock imports but as oil product imports and products transferred. And from 1999, due to a reallocation of some products, part of the amounts previously reported in other products is now reported in fuel oil.
For 2001 and 2002, all products transferred are re-ported with heavy fuel oil.
From 2001 onwards, a new methodology was used to report biofuels in the category additives/blending components and motor gasoline.
Breaks in sectorial breakdown of LPG and other products in consumption between 2000 and 2001 are due a result of more detailed data surveys.
Additives exports started in 2003 and not used for direct use anymore. Break in the time series for indus-trial sub-sectors are due to improved data collection.
Refinery gas: Prior to 1970, consumption in the chemical industry is included with refineries' own consumption.
Finland
France
Germany
I.34 - OIL INFORMATION: BEYOND 2020 DOCUMENTATION
INTERNATIONAL ENERGY AGENCY
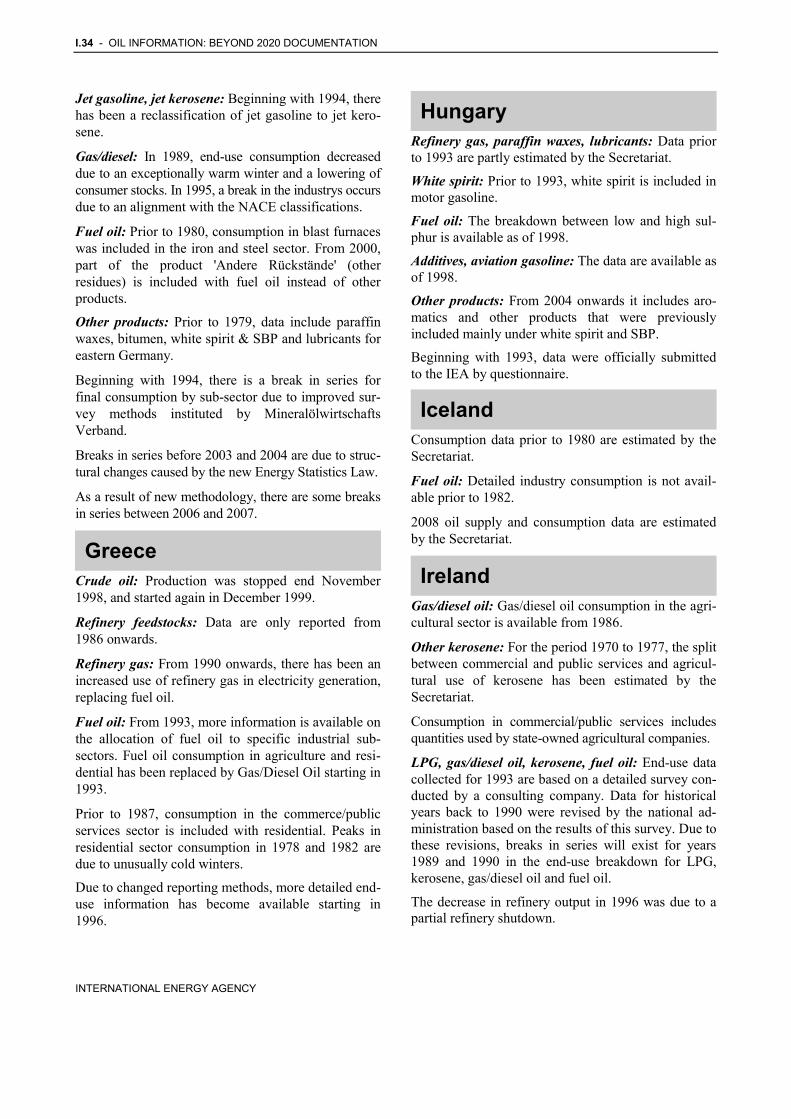
Jet gasoline, jet kerosene: Beginning with 1994, there has been a reclassification of jet gasoline to jet kero-sene.
Gas/diesel: In 1989, end-use consumption decreased due to an exceptionally warm winter and a lowering of consumer stocks. In 1995, a break in the industrys occurs due to an alignment with the NACE classifications.
Fuel oil: Prior to 1980, consumption in blast furnaces was included in the iron and steel sector. From 2000, part of the product 'Andere Rückstände' (other residues) is included with fuel oil instead of other products.
Other products: Prior to 1979, data include paraffin waxes, bitumen, white spirit & SBP and lubricants for eastern Germany.
Beginning with 1994, there is a break in series for final consumption by sub-sector due to improved sur-vey methods instituted by Mineralölwirtschafts Verband.
Breaks in series before 2003 and 2004 are due to struc-tural changes caused by the new Energy Statistics Law.
As a result of new methodology, there are some breaks in series between 2006 and 2007.
Crude oil: Production was stopped end November 1998, and started again in December 1999.
Refinery feedstocks: Data are only reported from 1986 onwards.
Refinery gas: From 1990 onwards, there has been an increased use of refinery gas in electricity generation, replacing fuel oil.
Fuel oil: From 1993, more information is available on the allocation of fuel oil to specific industrial sub-sectors. Fuel oil consumption in agriculture and resi-dential has been replaced by Gas/Diesel Oil starting in 1993.
Prior to 1987, consumption in the commerce/public services sector is included with residential. Peaks in residential sector consumption in 1978 and 1982 are due to unusually cold winters.
Due to changed reporting methods, more detailed end-use information has become available starting in 1996.
Refinery gas, paraffin waxes, lubricants: Data prior to 1993 are partly estimated by the Secretariat.
White spirit: Prior to 1993, white spirit is included in motor gasoline.
Fuel oil: The breakdown between low and high sul-phur is available as of 1998.
Additives, aviation gasoline: The data are available as of 1998.
Other products: From 2004 onwards it includes aro-matics and other products that were previously included mainly under white spirit and SBP.
Beginning with 1993, data were officially submitted to the IEA by questionnaire.
Consumption data prior to 1980 are estimated by the Secretariat.
Fuel oil: Detailed industry consumption is not avail-able prior to 1982.
2008 oil supply and consumption data are estimated by the Secretariat.
Gas/diesel oil: Gas/diesel oil consumption in the agri-cultural sector is available from 1986.
Other kerosene: For the period 1970 to 1977, the split between commercial and public services and agricul-tural use of kerosene has been estimated by the Secretariat.
Consumption in commercial/public services includes quantities used by state-owned agricultural companies.
LPG, gas/diesel oil, kerosene, fuel oil: End-use data collected for 1993 are based on a detailed survey con-ducted by a consulting company. Data for historical years back to 1990 were revised by the national ad-ministration based on the results of this survey. Due to these revisions, breaks in series will exist for years 1989 and 1990 in the end-use breakdown for LPG, kerosene, gas/diesel oil and fuel oil.
The decrease in refinery output in 1996 was due to a partial refinery shutdown.
Greece
Hungary
Iceland
Ireland

OIL INFORMATION: BEYOND 2020 DOCUMENTATION - I.35
INTERNATIONAL ENERGY AGENCY
White spirit, lubricants, bitumen and paraffin waxes: There is a break in series between 2006 and 2007 for white spirit, lubricants, bitumen and paraffin waxes due to a new methodology being applied to sectoral demand by Sustainable Energy Ireland (SEI).
Aviation fuels: The aviation fuels show breaks in se-ries in 1988 due to a change in classification.
Gas/diesel: Non-specified use is included in the commerce/public sector.
Inputs to electricity and heat generation have been estimated by the Secretariat for years 1984 to 1997 based on submissions of the Annual Electricity questionnaire.
All data for the years 1992 to 1997 and the detailed consumption breakdown for other years have been estimated by the Secretariat based on Bilancio Ener-getico Nazionale. Due to new surveys, breaks appear in the consumption series between 1998 and 1999.
Starting in 1990, data are reported on a fiscal year basis (April 2008 to March 2009 for 2008).
Crude oil, NGL, feedstocks, refinery gas, LPG, avia-tion gasoline, motor gasoline, jet gasoline, jet kerosene, other kerosene: The Japanese Administra-tion has revised supply and demand data for years 1960 to 1969. The classification of fuel use between road transport and internal navigation changed in 1970.
Other hydrocarbons: Other hydrocarbons comprise sulphuric acid, clay (not white clay) and caustic soda.
Other kerosene: The decrease in end-use consump-tion in 1982 was due to an exceptionally warm winter.
Lubricants: Consumption in the commerce/public and fishing begin in 1990.
Petroleum coke: Petroleum coke use in blast furnaces series begins in 1990.
Due to improved data collection methods, breaks in series exist for several products between 1981 and 1983. Due to a change in the reporting system to ex-clude stock levels at service stations and retail stores, a break in series exists between 1981 and 1982.
Orimulsion: Imports for electricity generation began in 1991.
The export and import data of oil products in 1994 and 1995 are in reported on a calendar year basis.
Data are available starting in 1970.
Stock levels include vessel stocks starting from 1997.
Naphtha, fuel oil: Inputs to autoproducer electricity and autoproducer CHP are included with end-use consumption.
Kerosene type jet fuel: The split between international civil aviation and domestic air transport has been es-timated for 1990 to 1995.
Prior to 1994, data are net of backfl8ows to the petro-chemical industry.
Fuel oil: Due to the introduction of an excise tax in 1994, all high-sulphur fuel oil consumption has been replaced by low-sulphur fuel oil.
The reduction in consumption of fuel oil in the iron and steel industry in the late 1970s is due to substitu-tion by coal.
Data are available starting in 1971.
Because of a change in the processing of the data, there may be breaks in series between 1998 and 1999.
Inputs for autoproducer electricity and heat generation are included in the industry.
Gas/Diesel: The breakdowns of transport diesel and heating oil are available from 1990.
Lubricants, Petroleum Coke: Stock levels are not available.
Lubricants, paraffin waxes, petroleum coke, other products: End Use data of lubricants, paraffin waxes, petroleum coke are available from 1990 and other oil products from 1993.
Petroleum Coke: In 2003 the new facility were added in the refinery to produce the petroleum coke.
Italy
Japan
Korea
Luxembourg
Mexico

I.36 - OIL INFORMATION: BEYOND 2020 DOCUMENTATION
INTERNATIONAL ENERGY AGENCY
LPG: Prior to 1987, the split of LPG consumption between the residential and commercial public ser-vices has been estimated by the Secretariat.
NGL production reported in the IEA publications may be different from what is reported in the Mexican en-ergy publications as the IEA includes in its oil data liquids produced in conjunction with natural gas.
Significant breaks in series between 1983 and 1984 are due to the introduction of a more comprehensive survey on end-use consumption. However, aggregated consumption data for transport, industry and “other” are not affected. Some breaks in series occur in 2007 when the Dutch Administration has started to report the petrochemical industry according to IEA methodology.
Crude oil: Prior to 1994, stocks held by stockholding entities were not included.
LPG, ethane: LPG includes ethane prior to 1994.
Refinery gas: Data include chemical gas from 1978. These quantities are shown as chemical industry con-sumption. Inputs to public combined heat and power generation begin in 1995.
Naphtha: From 2008, Data include aromatics, naph-tha and other light oils.
Motor gasoline: Data include “other light oils” until 2007.
Petroleum coke, other products: Petroleum coke is included with “other products” for all years except 1960 to 1967, 1978 to 1982 and 2005.
Consumption data for 1960 to 1973 have been esti-mated by the Secretariat.
Other hydrocarbons: Other hydrocarbons represent synthetic gasoline production from natural gas. In February 1997 the production of synthetic gasoline ceased.
Gas/diesel oil: Consumption in the road sector in-cludes use in the railways sector.
Gas/diesel oil, fuel oil: The light fuel oil is included in residual fuel oil until 1997. As of 1998, the light fuel oil is included in gas/diesel oil.
From 2000 onwards, paraffin waxes are included with lubricants.
Due to the availability of more detailed information, the Norwegian Administration has revised the report-ing of chemical and petrochemical energy and non-energy use beginning with 1993 and 2003.
The Norwegian Administration revised stock levels for crude oil and some oil products. It entails breaks in stocks between 1999 and 2000.
Refinery feedstocks: Since 1986, imports of refinery feedstocks are reported under the relevant oil product imports.
LPG, ethane: LPG includes ethane prior to 1990.
Lubricants: Consumption of lubricants is reported in the industry, as no further breakdown is available.
Beginning in 1991, motor gasoline, gas/diesel and fuel oil end-use consumption data has been revised based on new information.
Gas/diesel oil: Quantities of gas/diesel oil for electric-ity generation from 1970 to 1975 have been estimated by the Secretariat. Starting in 1990, the Norwegian administration has revised the reporting of input of gas/diesel oil for autoproduced electricity on oil and gas platforms, giving rise to a break in series between 1989 and 1990. Data are now reported in the energy industry own use.
Gas/diesel oil, fuel oil: The detailed consumption breakdown is available from 1976.
Lubricants: For 1996, some lubricants are included with Other Products.
Petroleum coke: There is a break in series in industry between 2004 and 2005 according to the new infor-mation. Refinery fuel has been reported since 2001.
From 2002 onwards, NGL exports have been reclassi-fied as LPG exports.
The stock levels are available as of 1988.
Other hydrocarbons: From 1997, a hydrocracking complex produces hydrogen from natural gas. These amounts are reported under other sources.
Netherlands
New Zealand
Norway
Poland

OIL INFORMATION: BEYOND 2020 DOCUMENTATION - I.37
INTERNATIONAL ENERGY AGENCY
Gas/diesel oil, fuel oil: Prior to 1998, inputs of gas/diesel oil and heavy fuel oil to autoproducer CHP in petroleum refineries have been included in the trans-formation.
Petroleum coke: Supply data are available from 2003.
Gas/diesel oil: Consumption in industry and commer-cial/public services represents diesel use in the mobile fleets.
Fuel oil: Feedstocks use of fuel oil in the chemical industry beginning in 1984 reflects the opening of a new ammonia plant which uses fuel oil as raw material.
The consumption breakdown for lubricants, bitumen, white spirit/SBP and paraffin waxes has been esti-mated by the Secretariat in 1986.
Data are available starting in 1971.
Naphtha: Data are not available and therefore not included in total products before 1989.
Kerosene type jet fuel: Data include other kerosene from 2001 onwards. International Civil Aviation in-cludes Domestic use since 2001.
Gas/diesel oil: Road data includes Rail use.
Fuel oil: Fuel oil includes both light and heavy fuel oil.
White spirit: Energy Use is not available.
Data from 1993 were revised by the Slovak Admini-stration in 2002. There are several breaks between 1992 and 1993 and between 2000 and 2001 due to differences in methodology.
As a result of a new survey more detailed information is available starting in 2001.
Detailed consumption data prior to 1981 are partly estimated on the basis of national statistics covering consumption on the Spanish mainland.
Refinery feedstocks: Data are not available in 1981.
LPG, fuel oil: Consumption specifications are less detailed prior to 1973.
Gas/diesel oil, fuel oil: A reclassification of the "other" between 1976 and 1977 has resulted in a break in series for gas/diesel oil and fuel oil.
Petroleum coke: From 1982 onwards, there are more detailed consumption data available for petroleum coke.
Backflows have been estimated by the Secretariat for 1996.
A change in the reporting system in mid-1996 has resulted in some breaks in series between 1996 and 1997.
Additives, refinery gas, ethane: Data are available from 2000 for additives, from 2003 for refinery gas, and from 2001 for ethane.
Other kerosene: Consumption in the road sector is discontinued in 1984 due to product re-classification.
Gas/diesel oil: There is a break in stocks between 1999 and 2000.
Fuel oil: Due to more detailed reporting, there are breaks in consumption series between 1985 and 1986.
Swedish stock data include peacetime crisis stocks. Since these stocks may be held in crude oil instead of oil products, there may be occurrences of negative stock levels for products.
Beginning in 1995, Sweden has changed its standard classification of industry sub-sectors.
Beginning in 2002, Sweden has changed some of the conversion factors for some products. That explains the break in stocks between 2001 and 2002 as well as small breaks in series. Data from 1990 onwards have been revised due to change in methodology in 2007.
Refinery feedstocks: The reduction in refinery intake in 1988 is partly due to a switch to crude oil and partly to a shutdown for maintenance of a refinery.
Naphtha: As of 1993, the refinery gross output fig-ures are net of quantities used for blending into motor gasoline.
Gas/diesel oil: Non-specified industry (small manufac-turers) consumption is estimated. The method of
Portugal
Slovak Republic
Spain
Sweden
Switzerland

I.38 - OIL INFORMATION: BEYOND 2020 DOCUMENTATION
INTERNATIONAL ENERGY AGENCY
reporting has been revised from 1987 to 1993. The increase in consumption in 1994 is due to consumer stock-building prior to the introduction of a value-added excise tax on heating fuels as of 1 January 1995.
Petroleum coke: Production started in 2004 due to the installation of a cracking unit in a refinery.
Since 1 January 1996, the Swiss Administration re-vised its stock reporting.
The break between 1998 and 1999 in the final consump-tion of motor gasoline, gas/diesel oil and residual fuel oil is due to a new survey being introduced in 1999.
Gas/diesel oil, fuel oil: The end-use classification of gas/diesel oil and fuel oil were changed in the Turkish national statistics between 1977 and 1978. Conse-quently, breaks in detailed consumption series appear between these two years.
As of 1978, the commercial sector is included with in-dustry, while public services are included with transport. Part of non-metallic mineral products industry con-sumption is included with non-ferrous metals sector.
International marine bunkers are included in exports for the years 1978, 1980, 1981, 1983 and 1984.
Gas/diesel oil and fuel oil consumed to produce elec-tricity are used in both oil and coal-fired plants.
Bitumen: Bitumen consumed in the transformation is intended for briquette production.
Crude oil, NGL: From 1980, NGL includes conden-sates. For earlier years condensates are included with crude oil.
NGL, refinery feedstocks: Stock levels and stock changes are only reported separately from 1985. Prior to that they were included with crude oil.
Other hydrocarbons: Until 1994, other sources repre-sented bitumen produced from coal.
LPG, ethane: LPG includes ethane prior to 1990.
LPG, fuel oil: breaks in series for LPG, between 2000 and 2001, and for fuel oil, between 1999 and 2000, are due to the re-allocation of some data; and, for fuel oil, because of the introduction of heat production data as well.
Petroleum coke, other products: Imports and exports of "other products" include petroleum coke prior to 1992. Prior to 1979, all petroleum coke data are in-cluded with "other products".
Stock levels and stock changes in main activity pro-ducer are included from 1985.
Prior to 1995, the product breakdown for returns is estimated by the UK Administration. Beginning with 1995, the UK Administration revised their product breakdown for returns and petrochemical reporting methodology.
For 2002 to 2004 products transferred includes back-flows and interproduct transfers. From 2005 onwards backflows were estimated by the Administration.
In the 2010 edition, the split between international civil aviation and domestic air transport has been re-vised back to 1990 according to new research.
Prior to 1995, a detailed breakdown of oil products consumption in the industry is not available. How-ever, data by industry are published for fuel oil for the period 1971 to 1982.
Crude oil: High statistical differences for crude oil represent "Unaccounted for crude oil", the difference between the supply and disposition of crude oil.
LPG: From 1995, inputs to gas works are included in the industry.
LPG, ethane: LPG includes ethane and pentanes plus prior to 1990.
LPG, NGL: Imports and exports of NGL are reported as LPG trade prior to 1978. From 1992 onwards, the individual components of NGL and LPG have been converted using their respective conversion factor rather than an average factor, resulting in a break in series.
Naphtha: The reduction in naphtha use in the chemi-cal industry beginning in 1978 is due to a reclassification of the product.
Motor gasoline: Beginning in 1994, consumption in the commerce/public services sector is based on a new model from the Department of Transportation.
Gas/diesel oil: Gas/diesel oil consumption in agricul-ture prior to 1980 is estimated by the Secretariat.
Fuel oil: International marine bunkers of fuel oil show large increase in 1990 due to a change in the
Turkey
United Kingdom
United States

OIL INFORMATION: BEYOND 2020 DOCUMENTATION - I.39
INTERNATIONAL ENERGY AGENCY
data collection and reporting methodology in the US administration. The consumption breakdown between low and high sulphur fuel oil has been estimated. Consumption breakdown for low and high sulphur fuel oil is not available from 2002 onwards. Gas/diesel oil, fuel oil, petroleum coke: The inputs to autoproducers of electricity are available as of 1997. The inputs to CHP plants are available as of 1999. Before 1999, main activity producer CHP plants were included in main activity producer electricity plants; autoproducers of CHP were included in autoproducers of electricity and in industry. The change in the series for transfers in 1990 and 1993 is due to new reporting methods used by the US Administration.
In 1993, the US administration made several adjust-ments to its collection system for oil statistics in order to accommodate the revisions to the Clean Air Act of 1990. As a result, data for oxygenates (i.e. fuel etha-nol, MTBE, etc.) are collected as of 1993.
As a result of the new Manufacturing Energy Con-sumption Survey (MECS), there are breaks in series between 1999 and 2000 for the industry. And again between 2000 and 2001 as the MECS percentages were revised due to revisions in electric cogeneration.
There were significant revisions to residual fuel oil and unfinished oils for 2001 data. Primarily, the changes are a result of importers misclassifying unfin-ished oils as residual fuel oil.


OIL INFORMATION: BEYOND 2020 DOCUMENTATION - I.41
INTERNATIONAL ENERGY AGENCY
8. ABBREVIATIONS AND CONVERSION FACTORS
Mt Million metric tons Mtoe Million tons of oil equivalent TPES Total Primary Energy Supply kb Thousand barrels mb Million barrels
- Nil x Not applicable .. Not available 0.00 Negligible (depending on the number of decimals)
101 deca (da) 10-1 deci (d)
102 hecto (h) 10-2 centi (c)
103 kilo (k) 10-3 milli (m)
106 mega (M) 10-6 micro (µ)
109 giga (G) 10-9 nano (n)
1012 tera (T) 10-12 pico (p)
1015 peta (P) 10-15 femto (f)
1018 exa (E) 10-18 atto (a)
Abbreviations
Conventional signs
Decimal prefixes
I.42 - OIL INFORMATION: BEYOND 2020 DOCUMENTATION
INTERNATIONAL ENERGY AGENCY
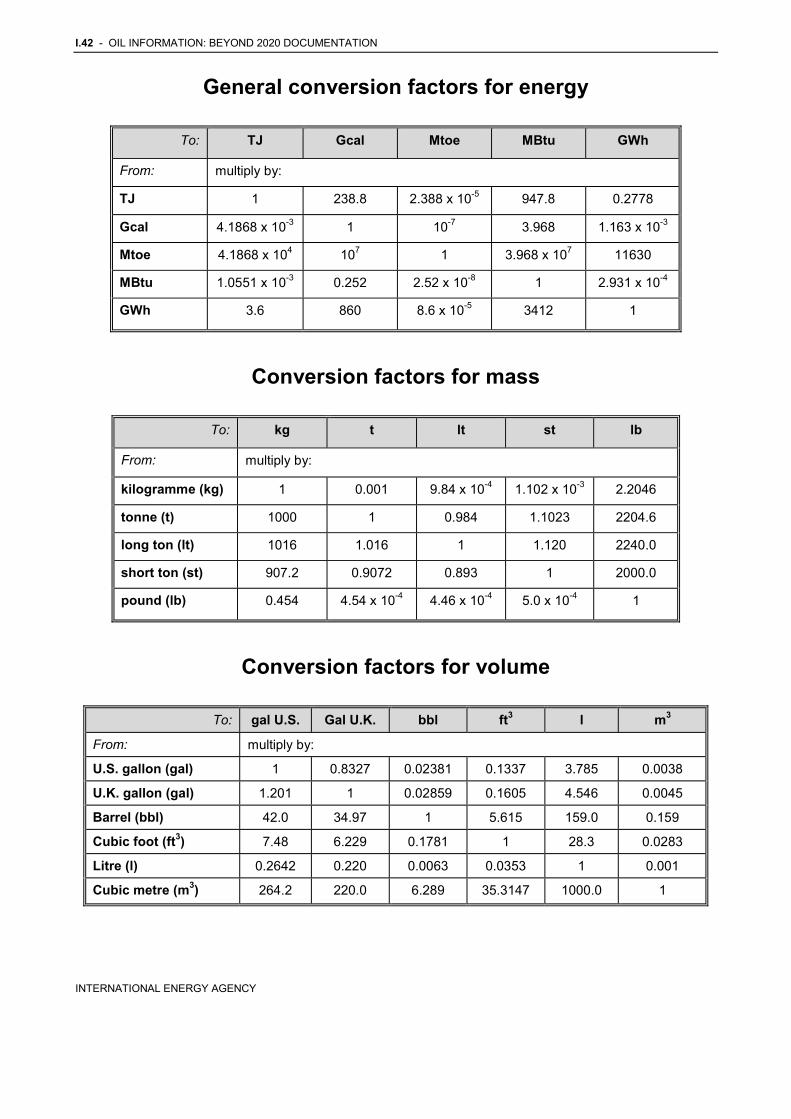
General conversion factors for energy
To: TJ Gcal Mtoe MBtu GWh
From: multiply by:
TJ 1 238.8 2.388 x 10⁻⁵ 947.8 0.2778
Gcal 4.1868 x 10⁻³ 1 10-7 3.968 1.163 x 10⁻³
Mtoe 4.1868 x 10⁴ 107 1 3.968 x 10⁷ 11630
MBtu 1.0551 x 10⁻³ 0.252 2.52 x 10⁻⁸ 1 2.931 x 10⁻⁴
GWh 3.6 860 8.6 x 10⁻⁵ 3412 1
Conversion factors for mass
To: kg t lt st lb
From: multiply by:
kilogramme (kg) 1 0.001 9.84 x 10⁻⁴ 1.102 x 10⁻³ 2.2046
tonne (t) 1000 1 0.984 1.1023 2204.6
long ton (lt) 1016 1.016 1 1.120 2240.0
short ton (st) 907.2 0.9072 0.893 1 2000.0
pound (lb) 0.454 4.54 x 10⁻⁴ 4.46 x 10⁻⁴ 5.0 x 10⁻⁴ 1
Conversion factors for volume
To: gal U.S. Gal U.K. bbl ft3 l m3
From: multiply by:
U.S. gallon (gal) 1 0.8327 0.02381 0.1337 3.785 0.0038
U.K. gallon (gal) 1.201 1 0.02859 0.1605 4.546 0.0045
Barrel (bbl) 42.0 34.97 1 5.615 159.0 0.159
Cubic foot (ft3) 7.48 6.229 0.1781 1 28.3 0.0283
Litre (l) 0.2642 0.220 0.0063 0.0353 1 0.001
Cubic metre (m3) 264.2 220.0 6.289 35.3147 1000.0 1

OIL INFORMATION: BEYOND 2020 DOCUMENTATION - I.43
INTERNATIONAL ENERGY AGENCY
Oil products Average densities, volume and heat equivalents
Product Density kg/m3
Litres per metric ton
Barrel per metric ton
Gross calorific value (GJ/t)
Net calorific value (GJ/t)(3)
Crude oil 853 1172 7.37 47.37 45.00
Ethane 366 2730 17.17 51.90 47.51
Refinery gas 786 1272 8.00 52.00 47.60
Propane 508 1969 12.38 50.32 46.33
Butane 585 1709 10.75 49.51 45.72
LPG(1) 539 1856 11.67 50.08 46.15
Naphtha 706 1416 8.91 47.73 45.34
Aviation gasoline 707 1414 8.90 47.40 45.03
Motor gasoline(2) 741 1350 8.49 47.10 44.75
Kerosene type jet fuel 803 1246 7.84 46.93 44.58
Other kerosene 810 1235 7.76 46.05 43.75
Gas/diesel oil 844 1186 7.46 45.66 43.38
Fuel oil low sulphur 925 1081 6.80 43.75 41.56
Fuel oil high sulphur 975 1026 6.45 42.00 39.90
Fuel oil 944 1059 6.66 42.82 40.68
White spirit 743 1346 8.46 46.32 44.00
Paraffin waxes 801 1248 7.85 42.00 39.90
Lubricants 887 1127 7.09 44.00 41.80
Bitumen 1035 966 6.08 42.10 40.00
Petroleum coke 1150 870 5.47 34.80 33.06
Other products 786 1273 8.00 42.30 40.19
(1) Assumes a mixture of 60% propane and 40 % butane by mass. (2) An average for motor gasolines with RON between 91 and 95. (3) For Naphtha and heavier oils the net calorific value is assumed to be 95% of gross.

I.44 - OIL INFORMATION: BEYOND 2020 DOCUMENTATION
INTERNATIONAL ENERGY AGENCY
Crude oil* Average volume equivalent of thousand metric tons
Thousand barrels Thousand kilolitres
Australia 7.890 1.254 Austria 7.040 1.119 Canada 7.180 1.142 Denmark 7.400 1.177 France 7.330 1.165 Germany 7.200 1.145 Greece 7.230 1.149 Italy 6.830 1.086 Japan 7.370 1.172 Mexico 7.080 1.126 Netherlands 7.090 1.127 New Zealand 8.130 1.293 Norway 7.490 1.191 Spain 7.440 1.183 Sweden 7.370 1.172 Turkey 7.030 1.118 United Kingdom 7.560 1.202 United States 7.400 1.177 Algeria 7.661 1.218 Angola 7.410 1.178 Argentina 7.120 1.132 Brazil 7.180 1.142 China 7.320 1.164 Colombia 7.080 1.126 Egypt 7.260 1.154 India 7.440 1.183 Indonesia 7.360 1.170 Iran 7.350 1.169 Iraq 7.430 1.181 Kuwait 7.250 1.153 Libyan Arab Jamahiriya 7.580 1.205 Nigeria 7.500 1.192 Oman 7.330 1.165 Qatar 7.500 1.192 Saudi Arabia 7.323 1.164 Syria 7.290 1.159 United Arab Emirates 7.596 1.208 Former Soviet Union 7.300 1.161 Venezuela 6.990 1.111
* Indigenous production, including condensates.