oil crisis 2008
DESCRIPTION
oil crisis 2008TRANSCRIPT
Economic Development and Globalization Division
Financing for Development Section
The impact of the global financial crisis on the world oil market and its
implications for the GCC countries
Salaheddin Abosedra, Regional Advisor, ESCWA
Overview
• Expected impact of the crisis on the oil market conditions (largely based on the EIU estimations):– Oil demand– Oil supply– Oil prices
• Scenarios for the future of oil prices
• Outlook for the GCC economies
• Conclusions

Impact on oil market conditions: Demand
• Decrease of world oil demand…:– It declined by 0.2% in 2008– Is expected to decline by 0.4% in 2009
• …Largely driven by OECD’s demand…:– A decline of 2.9% in 2008– An expected decline of 1.8% in 2009
• …While non-OECD demand is expected to grow:– By 1.4% in 2009

Impact on oil market conditions: Demand
Oil consumption 2008 2009 2010
EIU estimates
China 7.90 8.10 8.38
Other Asian countries 9.49 9.52 9.69
Total OECD 47.77 46.90 46.90
Total non-OECD 38.14 38.68 39.57
World total 85.91 85.58 86.47
US Department of Energy estimates
China 7.98 8.17 8.41
Other Asian countries 9.24 9.16 9.24
Total OECD 47.47 45.84 45.76
Total non-OECD 38.18 38.43 39.38
World total 85.65 84.27 85.15
Table 1: World oil demand, 2008-2010
In million barrel/day
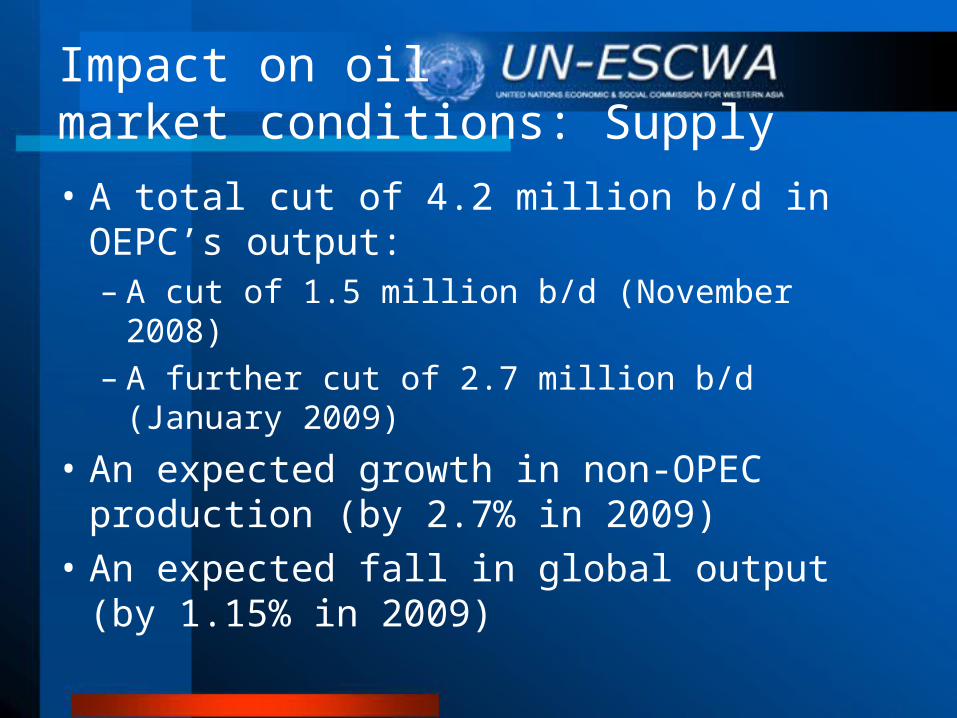
Impact on oil market conditions: Supply
• A total cut of 4.2 million b/d in OEPC’s output:– A cut of 1.5 million b/d (November 2008)– A further cut of 2.7 million b/d (January 2009)
• An expected growth in non-OPEC production (by 2.7% in 2009)
• An expected fall in global output (by 1.15% in 2009)
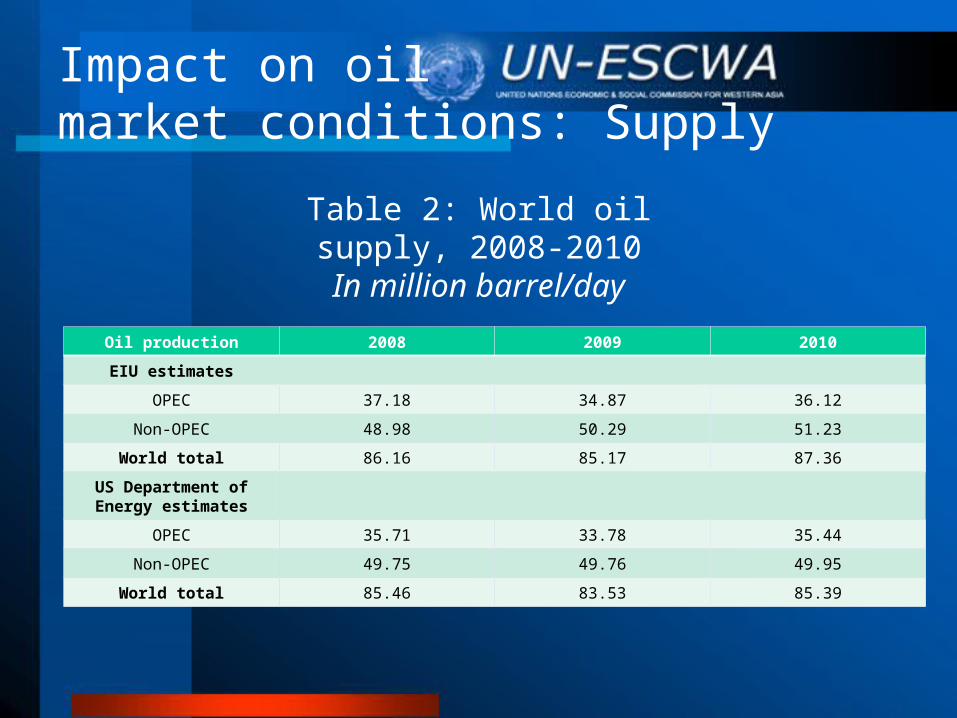
Impact on oil market conditions: Supply
Oil production 2008 2009 2010
EIU estimates
OPEC 37.18 34.87 36.12
Non-OPEC 48.98 50.29 51.23
World total 86.16 85.17 87.36
US Department of Energy estimates
OPEC 35.71 33.78 35.44
Non-OPEC 49.75 49.76 49.95
World total 85.46 83.53 85.39
Table 2: World oil supply, 2008-2010
In million barrel/day

Impact on oil market conditions: Prices
• The crisis has affected oil prices mainly thru two channels:– Many operators have liquidated their positions in
the commodity markets fall in oil prices– The severe slowdown in world demand fall in
oil prices
• However, the EIU expects a recovery in 2010, with an increase in oil prices by almost 43%
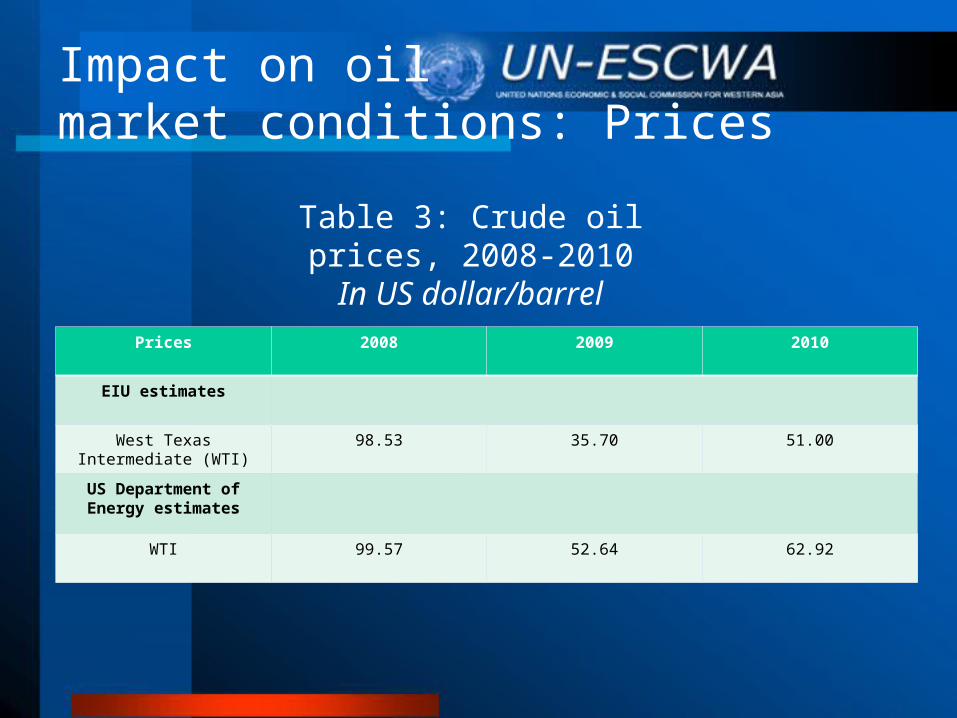
Impact on oil market conditions: Prices
Prices 2008 2009 2010
EIU estimates
West Texas Intermediate (WTI)
98.53 35.70 51.00
US Department of Energy estimates
WTI 99.57 52.64 62.92
Table 3: Crude oil prices, 2008-2010
In US dollar/barrel
Three Scenarios forthe future of oil prices
• Scenario 1: Two turbulent years followed by moderate growth in 2011, due to…:– Loss of confidence in the stock markets– More bank failures– Further tightening of financial capital– Declining housing prices
• …And resulting in: – A decline in world GDP by 0.4% in 2009
– A sluggish recovery of 1.5% in 2010
– Average oil price of $35 in 2009$35 in 2009, and $50 in 2010$50 in 2010

Three Scenarios forthe future of oil prices
2005 2006 2007 2008 2009 2010
Real GDP growth (%)
USA 2.9 2.8 2.0 1.1 -2.0 0.7
Japan 1.9 2.4 2.1 0.3 -0.5 0.7
Euro Area 2.0 2.9 2.6 1.1 -1.2 0.5
World 3.5 4.0 3.8 2.3 -0.4 1.5
World trade growth (%)
Goods 7.5 9.1 7.4 4.9 -1.5 2.5
Inflation
USA 3.4 3.2 2.9 4.0 0.3 1.0
Japan -0.3 0.2 0.1 1.6 0.0 0.3
Euro Area 2.0 2.0 2.1 3.4 1.7 1.5
Table 4: Global outlook
Three Scenarios forthe future of oil prices
• Scenario 2: Six turbulent months followed by moderate growth in late 2009, due to:– Confidence in the US economic recovery– Low oil prices– Strengthening of the US dollar
• The average oil price in this scenario would be $45 in 2009 and $60 in 2010
Three Scenarios forthe future of oil prices
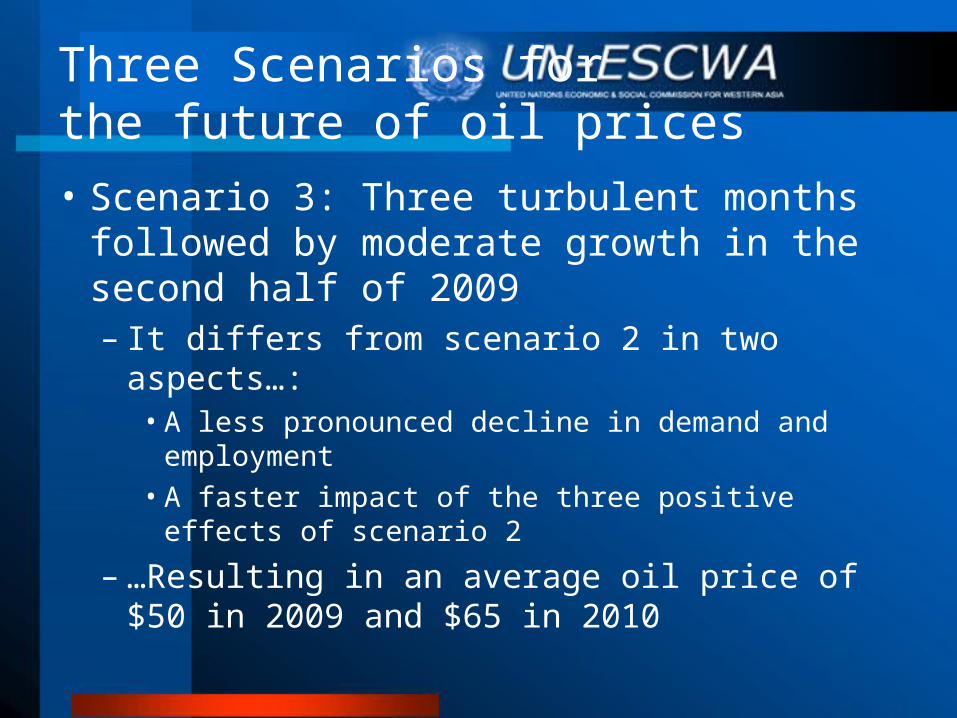
• Scenario 3: Three turbulent months followed by moderate growth in the second half of 2009– It differs from scenario 2 in two aspects…:
• A less pronounced decline in demand and employment
• A faster impact of the three positive effects of scenario 2
– …Resulting in an average oil price of $50 in 2009 and $65 in 2010

Three Scenarios forthe future of oil prices
Chart 1: GCC oil and gas revenues as percentage of total revenues, 2004, 2007
In percentage
0%
10%
20%
30%
40%
50%
60%
70%
80%
90%
100%
Bahrain Kuwait Oman Qatar Saudi Arabia United ArabEmirates
2004
2007

Three Scenarios forthe future of oil pricesChart 2: GCC oil and gas exports as percentage of total exports,
2004, 2007
In percentage
0%
10%
20%
30%
40%
50%
60%
70%
80%
90%
100%
Bahrain Kuwait Oman* Qatar SaudiArabia
United ArabEmirates*
2004
2007
Outlook for GCC economies
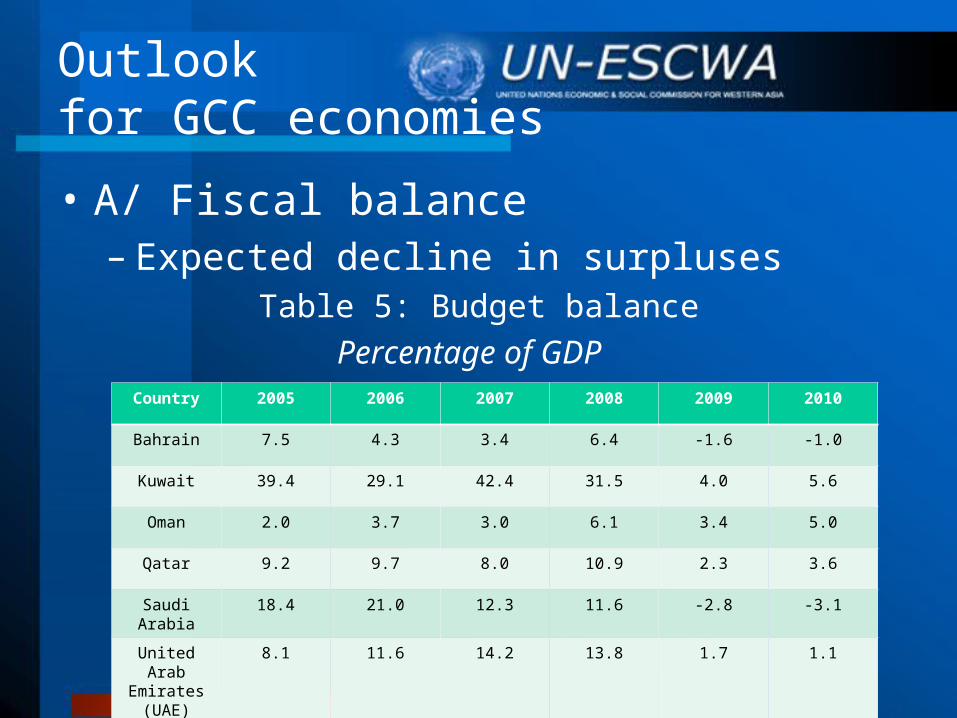
• A/ Fiscal balance– Expected decline in surpluses
Table 5: Budget balance
Percentage of GDP Country 2005 2006 2007 2008 2009 2010
Bahrain 7.5 4.3 3.4 6.4 -1.6 -1.0
Kuwait 39.4 29.1 42.4 31.5 4.0 5.6
Oman 2.0 3.7 3.0 6.1 3.4 5.0
Qatar 9.2 9.7 8.0 10.9 2.3 3.6
Saudi Arabia 18.4 21.0 12.3 11.6 -2.8 -3.1
United Arab Emirates (UAE)
8.1 11.6 14.2 13.8 1.7 1.1

Outlook for GCC economies
• B/ Economic growth– Expected decline in growth rates
Table 6: Economic growth
Percentage change, market exchange rate weights
Country 2005 2006 2007 2008 2009 2010
Bahrain 7.9 6.7 8.1 6.1 3.0 4.3
Kuwait 11.4 6.3 4.7 8.5 4.2 5.5
Oman 5.8 7.5 5.8 6.4 3.2 6.2
Qatar 6.1 5.1 11.3 12.7 18.7 16.7
Saudi Arabia 5.5 3.2 3.4 6.1 3.0 4.6
UAE 8.2 9.4 7.6 7.9 4.0 5.6
Outlook for GCC economies
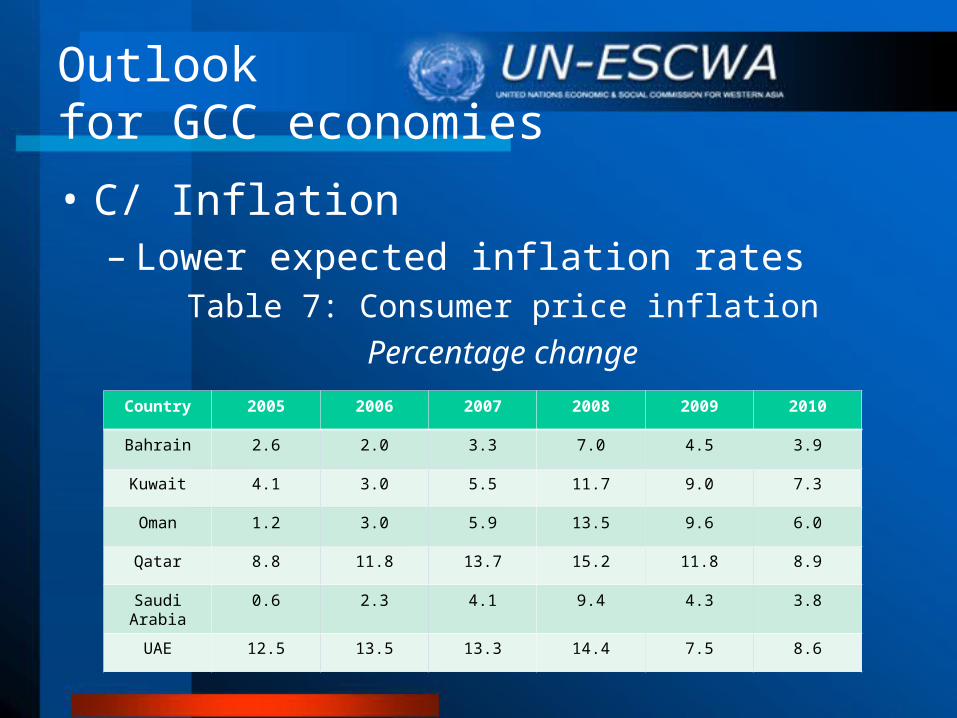
• C/ Inflation– Lower expected inflation rates
Table 7: Consumer price inflation
Percentage change
Country 2005 2006 2007 2008 2009 2010
Bahrain 2.6 2.0 3.3 7.0 4.5 3.9
Kuwait 4.1 3.0 5.5 11.7 9.0 7.3
Oman 1.2 3.0 5.9 13.5 9.6 6.0
Qatar 8.8 11.8 13.7 15.2 11.8 8.9
Saudi Arabia 0.6 2.3 4.1 9.4 4.3 3.8
UAE 12.5 13.5 13.3 14.4 7.5 8.6
Outlook for GCC economies
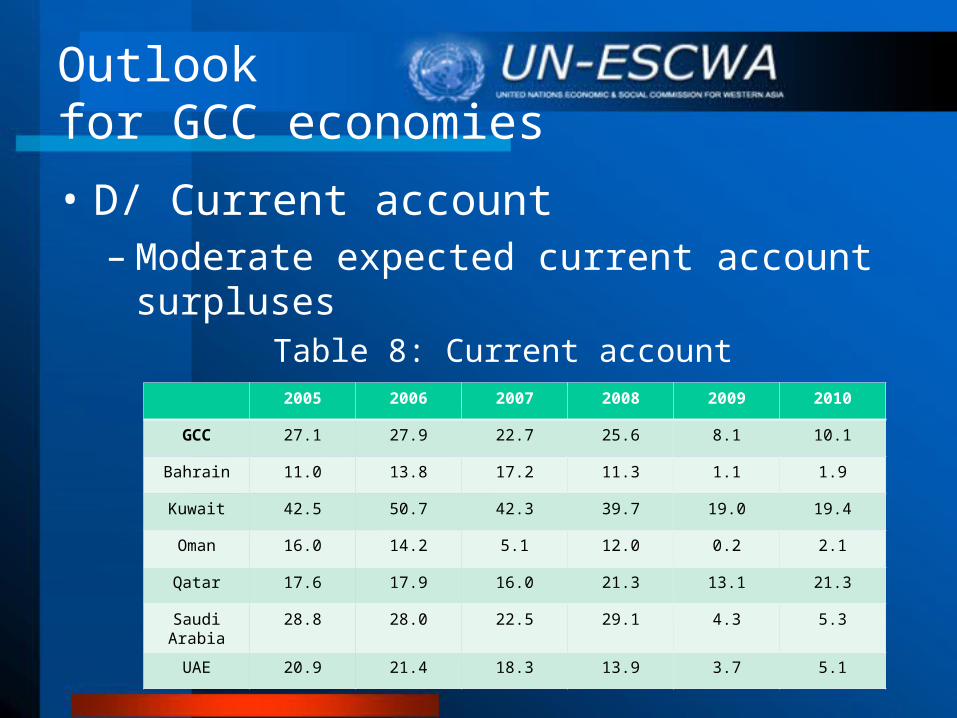
• D/ Current account– Moderate expected current account surpluses
Table 8: Current account
Percentage of GDP2005 2006 2007 2008 2009 2010
GCC 27.1 27.9 22.7 25.6 8.1 10.1
Bahrain 11.0 13.8 17.2 11.3 1.1 1.9
Kuwait 42.5 50.7 42.3 39.7 19.0 19.4
Oman 16.0 14.2 5.1 12.0 0.2 2.1
Qatar 17.6 17.9 16.0 21.3 13.1 21.3
Saudi Arabia 28.8 28.0 22.5 29.1 4.3 5.3
UAE 20.9 21.4 18.3 13.9 3.7 5.1
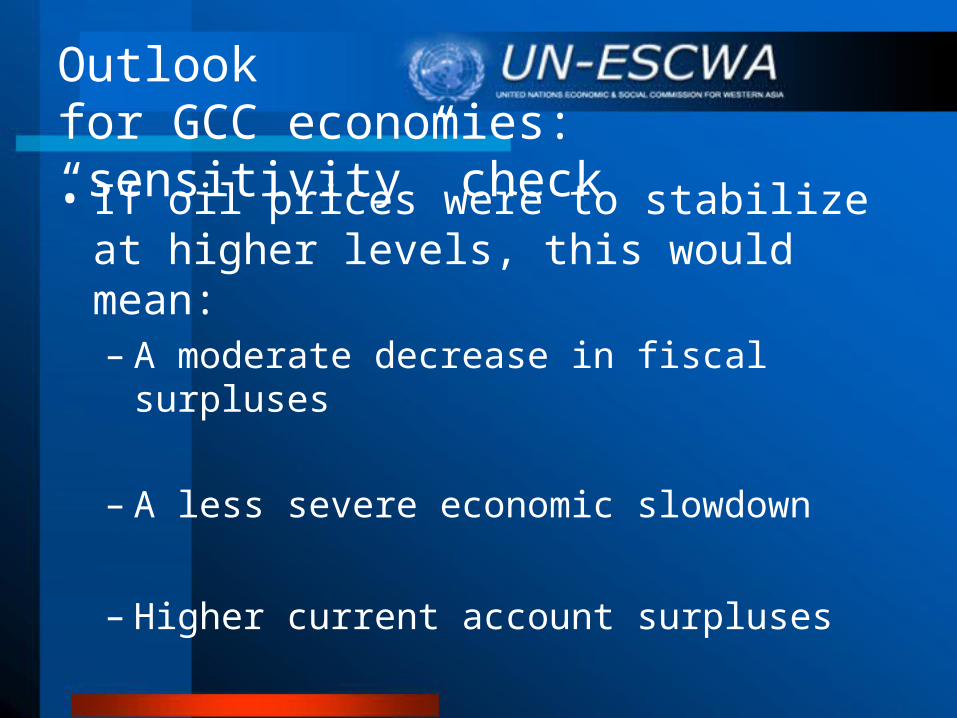
Outlook for GCC economies: “sensitivity” check
• If oil prices were to stabilize at higher levels, this would mean:– A moderate decrease in fiscal surpluses
– A less severe economic slowdown
– Higher current account surpluses
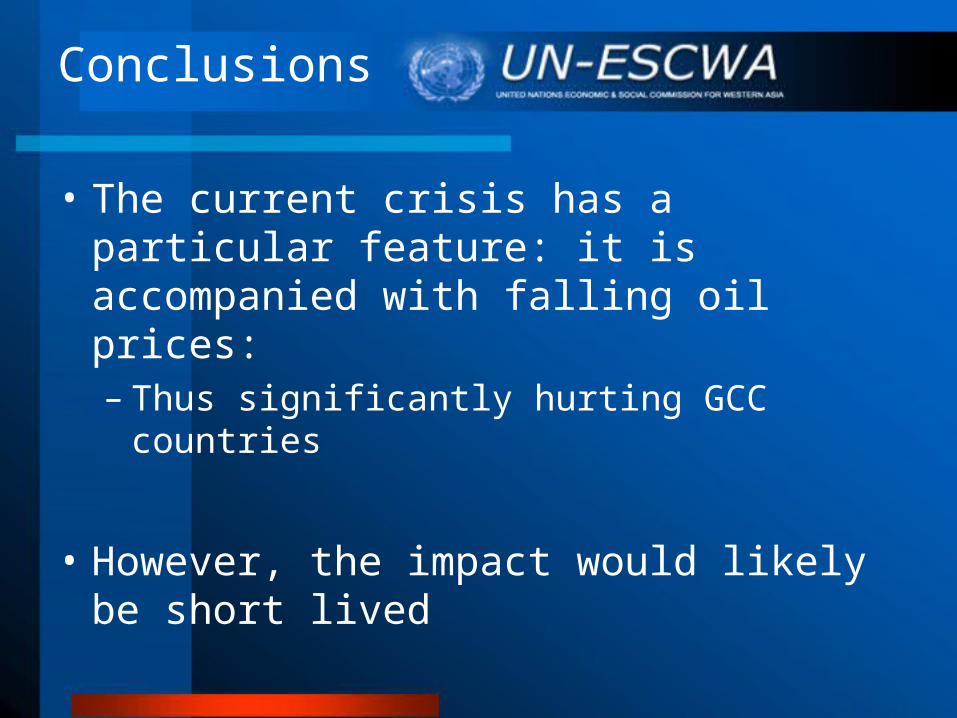
Conclusions
• The current crisis has a particular feature: it is accompanied with falling oil prices:– Thus significantly hurting GCC countries
• However, the impact would likely be short lived

Thank you