oil and gas producers in a period of low oil prices · 2017-09-19 · oil and gas producers in a...
TRANSCRIPT
© OECD/IEA 2016 © OECD/IEA 2016
Oil and gas producers in a period of low oil prices

© OECD/IEA 2016
USD 1.8 trillion
Oil and gas is still the largest field of investment
An 8% reduction in 2015 global energy investment results from a $200 billion decline in fossil fuels, while the share of renewables, networks and efficiency expands
Oil & Gas46%
Coal 4%
Electricity Networks
14%
Energy Efficiency
12%
Biofuels and Solar Heat1%
Global Energy Investment, 2015
Renewables 17%
Power Generation
23%
Thermal Power
7%
© OECD/IEA 2016
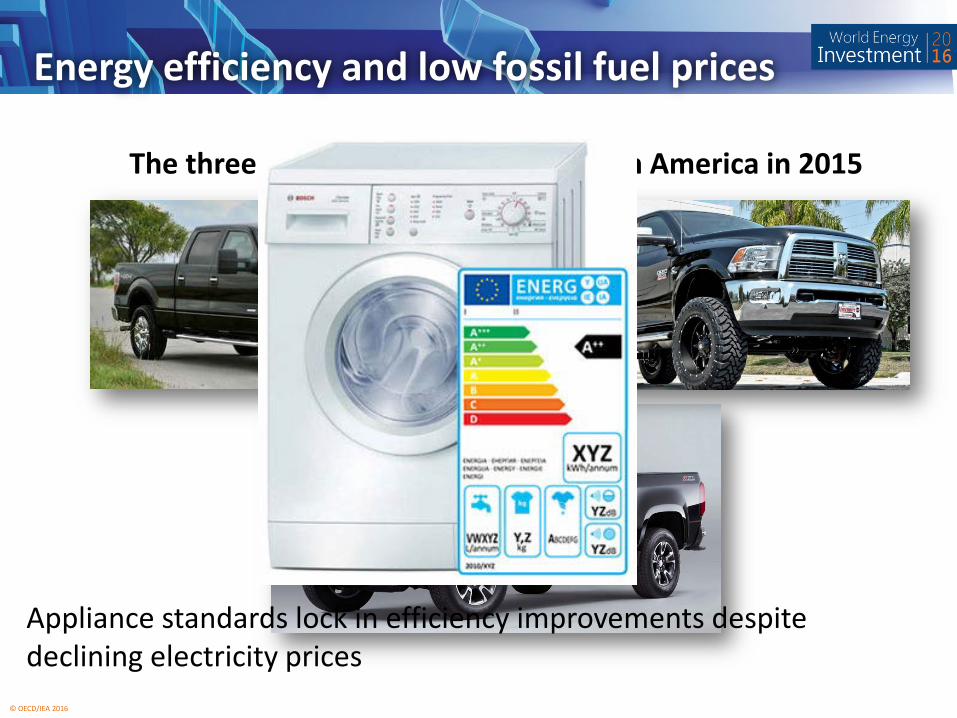
Energy efficiency and low fossil fuel prices
The three best selling vehicles in North America in 2015
Appliance standards lock in efficiency improvements despite declining electricity prices

© OECD/IEA 2016
New technologies have an asymmetric impact on oil and gas producers
Electric cars generate consumer excitement, but displaced only 0.01% of oil production last yearCurrent wind and solar investment is equivalent to over 1% of global gas
production not burned in CCGTs

© OECD/IEA 2016
The balance of oil markets tilting towards low-cost regions
North America covers almost half of the world’s decline in upstream investment, while the Middle East and Russia emerge as the most resilient regions.
Upstream investment in key regions, 2000-2016
0
100
200
300
400
500
600
700
800
90020
00
2001
2002
2003
2004
2005
2006
2007
2008
2009
2010
2011
2012
2013
2014
2015
2016
USD
(201
5) b
illio
n Other
Asia
Latin America
Russia
Middle East
North America

© OECD/IEA 2016
Upstream costs back to levels of 10 years ago, serving as key contributor to investment plunge
Lower costs accounted for just less than two-thirds of the total fall in upstream investment between 2014 and 2016
Investment Cost Indexes, 2005-2016
30
40
50
60
70
80
90
100
110
120
5060708090
100110120130140150
2005
2006
2007
2008
2009
2010
2011
2012
2013
2014
2015
2016
USD
per
bar
rel
Inde
x (2
005
= 10
0)
US Shale Investment Cost Index Upstream Investment Cost Index Oil Price (RHS)

© OECD/IEA 2016
Rig count in the Middle East remain close to record levels
Recent uptick in the oil price has raised the economic case for an increase in rig counts in North America and recovery in activity is tangible since June
Total rig count index, 2015-2016
0
20
40
60
80
100
120Ja
nFe
bM
ar Apr
May Jun Jul
Aug
Sep
Oct
Nov De
cJa
nFe
bM
ar Apr
May Jun Jul
Aug
Sep
Oct
2015 2016
Jan
2015
= 1
00 Middle East
Europe
Asia Pacific
Latin America
Africa
North America
© OECD/IEA 2016
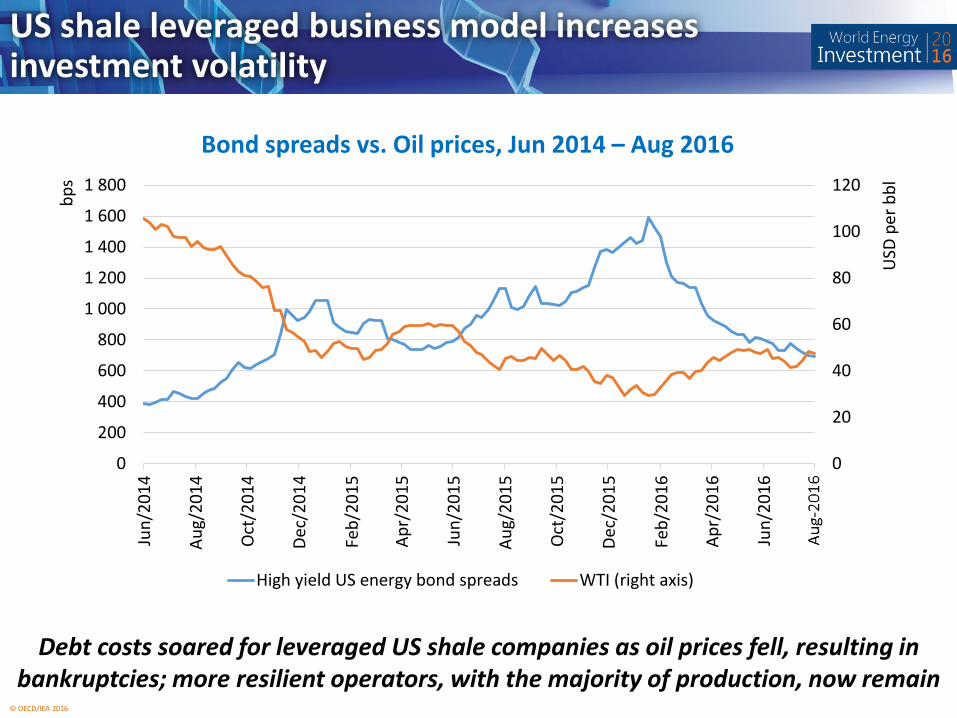
US shale leveraged business model increases investment volatility
Debt costs soared for leveraged US shale companies as oil prices fell, resulting in bankruptcies; more resilient operators, with the majority of production, now remain
Bond spreads vs. Oil prices, Jun 2014 – Aug 2016
0
20
40
60
80
100
120
0
200
400
600
800
1 000
1 200
1 400
1 600
1 800
Jun/
2014
Aug/
2014
Oct
/201
4
Dec/
2014
Feb/
2015
Apr/
2015
Jun/
2015
Aug/
2015
Oct
/201
5
Dec/
2015
Feb/
2016
Apr/
2016
Jun/
2016
USD
per
bblbps
High yield US energy bond spreads WTI (right axis)

© OECD/IEA 2016
Russian oil upstream keeps defying expectations
10000
10200
10400
10600
10800
11000
2015
2016
2017
IEA OMR monthly projections for Russian oil production

© OECD/IEA 2016
Russia: large and dispersed resource base
Legacy infrastructure was built up to supply the Western regions and European exports
© OECD/IEA 2016
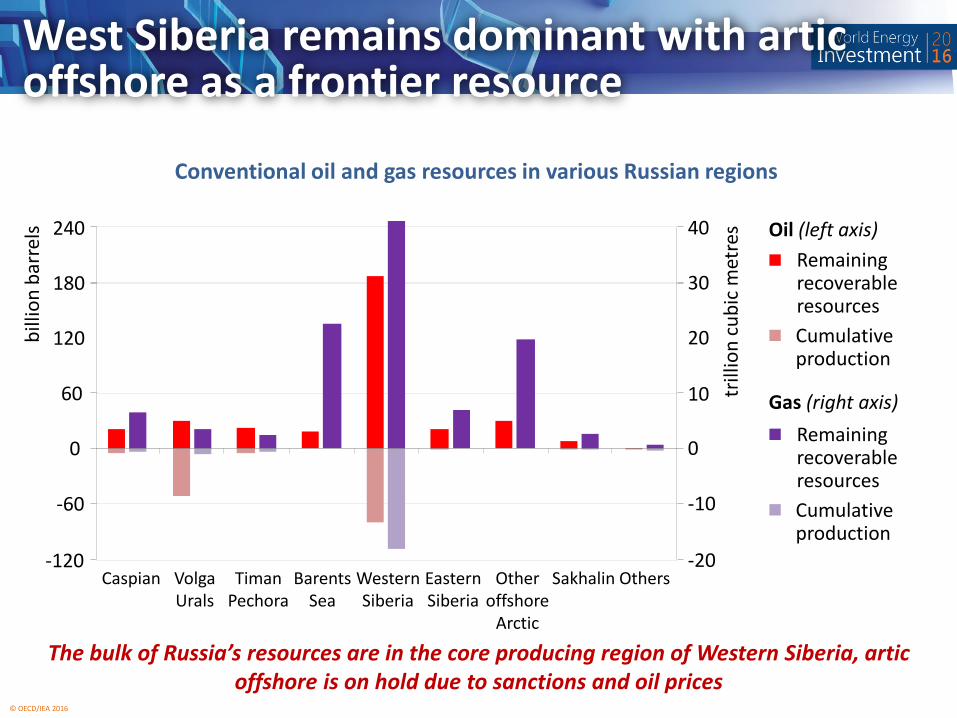
West Siberia remains dominant with artic offshore as a frontier resource
The bulk of Russia’s resources are in the core producing region of Western Siberia, artic offshore is on hold due to sanctions and oil prices
Conventional oil and gas resources in various Russian regions
Caspian VolgaUrals
TimanPechora
BarentsSea
WesternSiberia
EasternSiberia
Otheroffshore
Arctic
Sakhalin Others-120
-60
0
60
120
180
240
billi
on b
arre
ls
-20
-10
0
10
20
30
40
trill
ion
cubi
c m
etre
s
Cumulative production
Remaining recoverableresources
Oil (left axis)
Cumulative production
Remaining recoverableresources
Gas (right axis)

© OECD/IEA 2016
Arctic offshore: What a difference three years make
Arctic offshore developments are likely to be on hold in the foreseeable future
• Sanctions constrain investment and technology transfer
• But similar projects became unviable in Alaska and Canada as well
• And the IOCs are cutting capex anyway
© OECD/IEA 2016
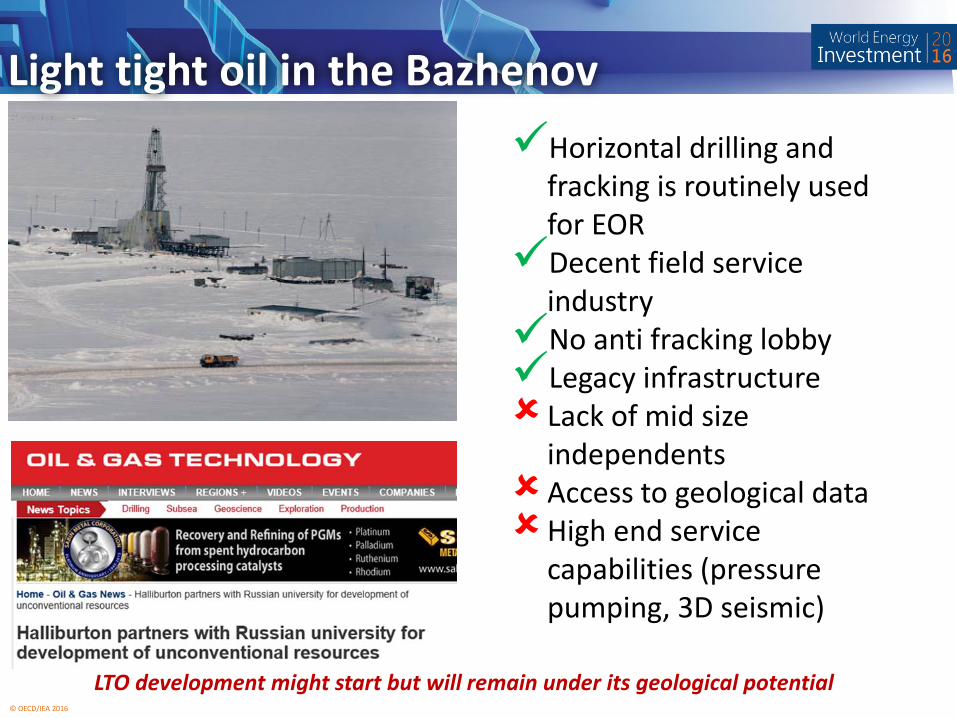
Light tight oil in the Bazhenov
LTO development might start but will remain under its geological potential
Horizontal drilling and fracking is routinely used for EORDecent field service
industryNo anti fracking lobbyLegacy infrastructure Lack of mid size
independentsAccess to geological dataHigh end service
capabilities (pressure pumping, 3D seismic)

© OECD/IEA 2016
Investment cuts, what investment cuts?
80-90% of capital spending is Rouble based due to a large domestic service industry and focus on conventional brownfield development
Russian oil and gas upstream investment, in Roubles 2010-2016
-
500
1,000
1,500
2,000
2,500
3,000
2010 2011 2012 2013 2014 2015 2016
RUB
(201
5) B
illio
n

© OECD/IEA 2016
Altai pipeline (Western)• 2600 km from West Siberia to
China• Initial capacity: 30 bcm
SKV pipeline• 1830 km between Sakhalin-
Khabarovsk-Vladivostok• Full design capacity: 30 bcm• Current capacity: about 7 bcm
Power of Siberia pipeline (Estern)• 4000 km from Kovykta to Vladivostok• Construction commenced in Sept 2014• Initial capacity: 38 bcm
East Siberia: the manifest destiny?
Source: Gazprom and IEA (forthcoming)

© OECD/IEA 2016
Yamal LNG: overcoming the odds
Equity stake by Total and EPC contract with Technip maintained
CNPC + Silk Road Fund equity stakes
Multibillion Euro/RMB Chinese project financing secured

© OECD/IEA 2016
LNG investment about to fall from historical peak
Given the sharp fall of investment and increasing reluctance for new long term contracts LNG might be heading towards a new boom and bust cycle
50
125
200
275
350
425
500
575
650
0
5
10
15
20
25
30
35
4020
0520
0620
0720
0820
0920
1020
1120
1220
1320
1420
1520
1620
1720
1820
1920
20
bcm
per
yea
r
USD
(201
5) b
illio
n Australia
Africa
Middle East
North America
Russia
Europe
Others
CapacityRight axis:
LNG terminals investment

© OECD/IEA 2016
New North American shale plays drove pipeline investment
North America oil & gas infrastructure capital spending 2010-2016
Less well-connected states and regions that concentrated boom in production led investment in new infrastructure
0
10
20
30
40
50
60
2010 2011 2012 2013 2014 2015 2016
USD
(201
5) b
illio
n
© OECD/IEA 2016
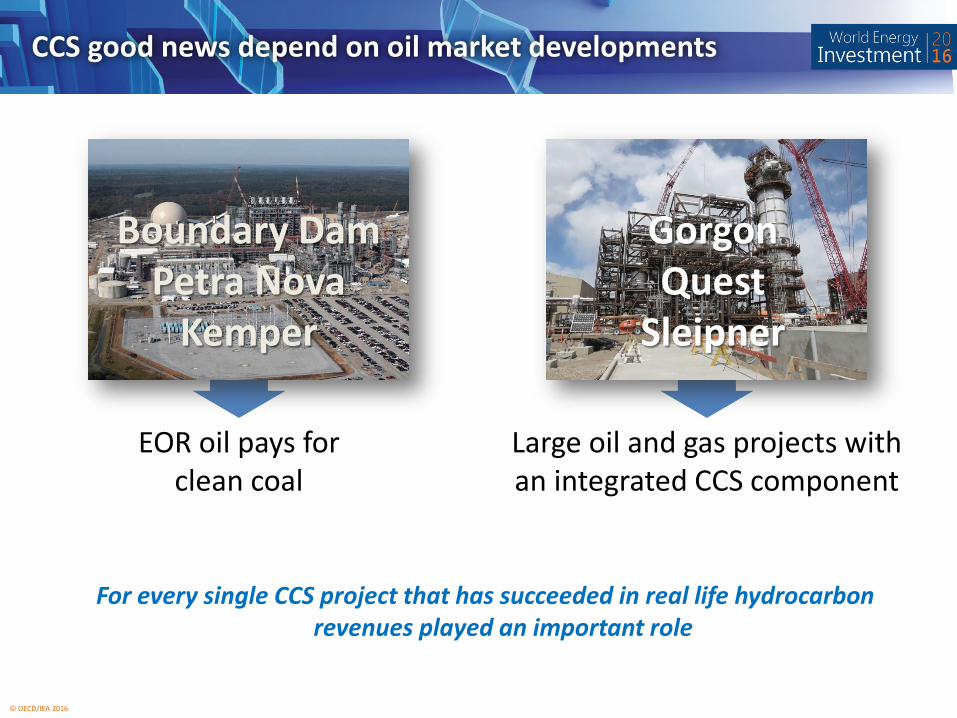
CCS good news depend on oil market developments
For every single CCS project that has succeeded in real life hydrocarbon revenues played an important role
Boundary DamPetra Nova
Kemper
GorgonQuest
Sleipner
EOR oil pays forclean coal
Large oil and gas projects with an integrated CCS component

© OECD/IEA 2016
Oil prices and methane leakage
North American
flaring
Russia, Nigeria, Iraq Distribution
LTO slowdown enables midstream
to catch up
Investment capability,
geopolitics, and other priorities...
Investment capability of utilities

© OECD/IEA 2016
Backup