ohio agricultural statistics 2015 annual bulletin · ohio agricultural statistics 2015 annual ......
TRANSCRIPT

Ohio Annual Bulletin (September 2015) 1 USDA, National Agricultural Statistics Service
Ohio Agricultural Statistics
2015 Annual Bulletin
Compiled by the
United States Department of Agriculture
National Agricultural Statistics Service
Great Lakes Region
Ohio Field Office
Cheryl Turner, State Statistician
Brooke Morris, Survey Coordinator
Great Lakes Regional Office Mailing Address
P.O. Box 30329
Lansing, MI 48909
Ohio Field Office Mailing Address
8995 E. Main Street
Reynoldsburg, OH 43068
(517) 324-5300
(855) 270-2709
http://www.nass.usda.gov/Statistics_by_State/Ohio
Issued Cooperatively by the:
Ohio Department of Agriculture
David T. Daniels, Director and
United States Department of Agriculture
National Agricultural Statistics Service
Joseph T. Reilly, Administrator

2 Ohio Annual Bulletin (September 2015) USDA, National Agricultural Statistics Service
National Association of State Departments of Agriculture (NASDA) enumerators
collect data for the USDA, NASS, Great Lakes Region. NASDA workers who
gathered information for this publication were:
Field Enumerators
Northwest Ohio North Central – Central Ohio
Kris Karr, Supervisor, Defiance Laura Coleman, Supervisor, Mount Gilead
Ralph Barbee, Ney George Keep, Bellville
Jerry Matuch, Galion Sonia Tilley, Saint Louisville
Terry Love, McCutchenville Jay Fowl, Elyria
David Fodor, Tiffin Jerry McMahan, Marion
West Central Ohio East Ohio Duane Grimme, Supervisor, West Alexandria Beckie McCracken, Supervisor, Salem
Ron Cronley, Mount Victory Rob Schmelzer, Medina
Jerry Zimmerman, Casstown Libby Rush, Beloit
David Helgeson, Belle Center Vicky McMaster, Hammondsville
David Corwin, Lewistown Janice Schilling, Baltic
Roger Hoelscher, New Knoxville Earl Gowdy, Cortland
Jim Brandt, Anna Jodie Nickles, Newark
Steven Terrill, Huntsville
Southearn Ohio Mark Fannin, Supervisor, Winchester
James (Jim) Simmons, Lynchburg
Susan Williams, Chillicothe
Shane Pugh, Reno
Jessica Williams, Chillicothe
Carol Wurdack, Thornville
Mark Fannin, Supervisor, Winchester

Ohio Annual Bulletin (September 2015) 3 USDA, National Agricultural Statistics Service
United States Department of Agriculture
National Agricultural Statistics Service Ohio Field Office
Cooperating with Ohio Department of Agriculture
August 2015
The US Department of Agriculture’s (USDA) National Agricultural Statistics Service’s (NASS) – Ohio Field Office is
pleased to present the 2015 edition of Ohio Agricultural Statistics Annual Bulletin. This publication, which is also
available on our web site, is a compilation of the many statistical reports published over the past year that highlight Ohio’s
diverse agriculture sector.
The statistics in this bulletin showcase this diversity and are used on a regular basis to make informed decisions by
producers, consultants, advisors, government officials, and others. The compilation of this bulletin is a product of the
partnership between the Ohio Department of Agriculture and NASS.
I would like to extend a special thanks to all those producers, agri-businesses, commodity groups, and countless others
who have given their valuable time to provide the information that serve as a basis for these data. Their responses are
through the Internet, mail, via telephone, and face-to-face interviews.
Special thanks also go to the National Association of State Department of Agriculture enumerators for their outstanding
work in collecting and providing timely and accurate data. Without their dedication to Ohio agriculture, we would be
unable to successfully provide these many data.
The Census of Agriculture is conducted by NASS every 5 years. The 2012 Census of Agriculture was released in May
2014. Results include information on farm numbers, acreage, crops, livestock, income, expenses, and demographics at the
county, state, and national level. The wide-array of Census data are used by policy makers, universities, communities,
and organizations throughout Ohio and the United States to plan for the future and compete for valuable resources. We
thank Ohio’s producers for their cooperation and providing the information which helps ensure the success of Ohio
agriculture.
Good decisions can only be made with good information. Our agency continually strives to meet our mission of providing
timely, accurate, and useful statistics in service to U.S. agriculture. Thanks again to all those who provided, collected, and
analyzed the data in this publication. If you have any questions about these data or need any additional information, please
visit our web site at www.nass.usda.gov and/or contact our office at (614) 728-2100. We look forward to serving you.
Sincerely,
Cheryl Turner
State Statistician

4 Ohio Annual Bulletin (September 2015) USDA, National Agricultural Statistics Service
At the Ohio Department of Agriculture, we spend a great deal of time supporting and working on ways to improve the food and
agriculture industry and keeping people safe. We also spend a great deal of time formulating and enforcing rules and supporting rural
policy that affects agriculture. Our decisions resonate through all levels of state government right down to the producer out in the field
thinking about how he is going to pay his taxes, keep his farm productive, and pass his business on to the next generation.
If you didn’t already know what happens at the Ohio Department of Agriculture’s Reynoldsburg campus, you might be surprised.
Most people do not know that behind the brick buildings are scientific and consumer protection activity. In fact, it is the top
comprehensive consumer protection lab safety network in the state, and one of only a few of its kind in the nation.
ODA administers numerous regulatory, food safety, consumer protection, plant health and animal care programs for the benefit of all
Ohioans. The department also helps create greater economic opportunity for Ohio’s farmers and processors and to preserve and
enhance Ohio’s resources.
This past year, in addition to our routine duties, we spent a great deal of time working with the Ohio Department of Natural Resources
and the Ohio Environmental Protection Agency on water quality and nutrient management issues. Much progress has been made in
this area and the department will continue to move forward with industry on steps to improve Ohio’s waterways.
Ohio has invested more than $1 billion in the Lake Erie watershed to improve drinking water and waste water facilities, monitor water
quality, plant cover crops, recycle dredge material, install controlled drainage systems on fields, and fix faulty septic systems.
The Department of Agriculture will continue to hold fertilizer certification classes for anyone who applies fertilizer to more than 50
acres annually. These training sessions will emphasize best management practices for the proper application of fertilizer on farmland
in order to obtain the maximum benefit while preventing run-off into creeks, streams, and rivers.
Additionally, we will continue our work to implement Senate Bill 1, which was signed into
law in April of 2015 to strengthen Lake Erie water quality. These historic reforms make it
illegal to apply fertilizer or manure on frozen, snow-covered, saturated soils, or before a
significant rain event unless they inject the fertilizer or manure into the soil, till it in, or
apply it to a cover crop. It also calls for streamlining soil and water programs in Ohio.
As we work on these issues and other pressing consumer safety and farm protection efforts,
I look forward to another productive year.
Sincerely,
David T. Daniels
Director

Ohio Annual Bulletin (September 2015) 5 USDA, National Agricultural Statistics Service

6 Ohio Annual Bulletin (September 2015) USDA, National Agricultural Statistics Service
Table of Contents
General
Historical Crop Data — Ohio ...................................................................................................................... 11
Record Highs and Lows: Harvested Acres, Yield, and Production — Ohio............................................... 12
Cash Rents, State Average — Ohio: 2010-2014 ......................................................................................... 12
Average Prices Paid by Farmers for Feed and Fuels — Corn Belt: 2010 - 2014 ........................................ 13
Average Prices Paid by Farmers for Fertilizers — United States Average: 2010- 2014 ............................ 13
Farm Real Estate Value — Ohio: 2010 - 2014 ........................................................................................... 13
Rank and Quantity Produced, Selected Commodities — Ohio, Leading State, and
United States: 2014 ..................................................................................................................................... 14
Number of Farms, Land in Farms and Average Farm Size — Ohio and United States: 2010
- 2014 .......................................................................................................................................................... 15
Grain Storage Capacity by Position and Off-Farm Facilities — Ohio: December 1, 2010-2014 ............... 15
Crops: Monthly Prices Received by Farmers — Ohio: 2013-2014 Marketing Year .................................. 15
Crops: Monthly Percent of Crop Marketed — Ohio: 2012-2014 Marketing Years .................................... 15
Field Crops
Corn for Grain Area Planted and Harvested, Yield, Production, Price, and Value —
Ohio: 2010-2014 ......................................................................................................................................... 16
Corn for Silage Area Harvested, Yield, and Production — Ohio: 2010-2014 ............................................ 17
Corn Stocks by Position and Month — Ohio: 2010-2014 .......................................................................... 17
Soybeans for Beans Area Planted and Harvested, Yield, Production, Price, and Value —
Ohio: 2010-2014 ......................................................................................................................................... 18
Soybean Stocks by Position and Month — Ohio: 2010-2014 ..................................................................... 19
Winter Wheat Area Planted and Harvested, Yield, Production, Price, and Value —
Ohio: 2010-2014 ......................................................................................................................................... 20
Oat Area Planted and Harvested, Yield, Production, Price, and Value — Ohio: 2010-2014 ..................... 21
All Tobacco Area Harvested, Yield, Production, Price, and Value — Ohio: 2010-2014 ........................... 21
Fall Potato Area Planted and Harvested, Yield, Production, Price, and Value —
Ohio: 2010-2014 ......................................................................................................................................... 21
Maple Syrup Taps, Yield, and Production— Ohio: 2010-2014 .................................................................. 21
Alfalfa Hay Area Planted and Harvested, Yield, Production, Price, and Value —
Ohio: 2010-2014 ......................................................................................................................................... 22
Other Hay Area Planted and Harvested, Yield, Production, Price, and Value —
Ohio: 2010-2014 ......................................................................................................................................... 22
Forage Area Harvested, Yield, and Production — Ohio: 2010-2014 ......................................................... 22
Days Suitable for Fieldwork — Ohio: 2013-2014 ...................................................................................... 23
Winter Wheat Development by Selected Dates – Ohio: 2013-2014 and 2010-2014 Average ................... 24
Oats Development by Selected Dates — Ohio: 2013-2014 and 2010-2014 Average ................................. 24
Soybean Development by Selected Dates — Ohio: 2013-2014 and 2010-2014 Average .......................... 25
Soybean Development by Selected Dates — Ohio: 2013-2014 and 2010-2014 Average .......................... 25
Corn Development by Selected Dates — Ohio: 2013-2014 and 2010-2014 Average ................................ 26
Corn Development by Selected Dates — Ohio: 2013-2014 and 2010-2014 Average ................................ 26
Alfalfa Hay Development by Selected Dates — Ohio: 2013-2014 ............................................................ 27
Other Hay Development by Selected Dates — Ohio: 2013-2014 ............................................................... 27
Vegetables
Cabbage for Fresh Market Area Planted and Harvested, Yield, Production, Price, and Value —
Ohio: 2010-2014 ......................................................................................................................................... 28
Cucumbers for Pickles Area Planted and Harvested, Yield, Production, Price, and Value —
Ohio: 2010-2014 ......................................................................................................................................... 28
Bell Peppers for Fresh Market and Processing Area Planted and Harvested, Yield,
Production, Price, and Value — Ohio: 2010-2014 ..................................................................................... 28
Pumpkins for Fresh Market and Processing Area Planted and Harvested, Yield,
Ohio Annual Bulletin (September 2015) 7 USDA, National Agricultural Statistics Service
Production, Price, and Value — Ohio: 2010-2014 ..................................................................................... 28
Squash for Fresh Market and Processing Area Planted and Harvested, Yield, Production, Price,
and Value — Ohio: 2010-2014 ................................................................................................................... 29
Sweet Corn for Fresh Market Area Planted and Harvested, Yield, Production, Price, and Value
— Ohio: 2010-2014 .................................................................................................................................... 29
Tomatoes for Fresh Market Area Planted and Harvested, Yield, Production, Price, and Value —
Ohio: 2010-2014 ......................................................................................................................................... 29
Tomatoes for Processing Area Planted and Harvested, Yield, Production, Price, and Value —
Ohio: 2010-2014 ......................................................................................................................................... 29
Fruit
Apple Acreage, Yield, Production, Price and Value — Ohio: 2010-2014 ................................................. 30
Apple Production, Price and Value by Utilization — Ohio: 2010-2014 .................................................... 30
Unutilized Apple Production — Ohio: 2010-2014 ..................................................................................... 30
Strawberries for Fresh Market and Processing Area Planted and Harvested, Yield,
Production, Price, and Value — Ohio: 2010-2014 ..................................................................................... 30
Grape Acreage, Yield, Production, Use and Value — Ohio: 2010-2014 ................................................... 31
Grape Production, Price and Value by Utilization — Ohio: 2010-2014 .................................................... 31
Peach Acreage, Yield, Production, Price and Value — Ohio: 2010-2014 .................................................. 31
Livestock
Commercial Calf Slaughter — Ohio: Monthly 2013-2014 ......................................................................... 32
All Cattle and Calves Production and Income — Ohio: 2010-2014 ........................................................... 32
Commercial Cattle Slaughter — Ohio: Monthly 2013-2014 ...................................................................... 32
Cattle and Calves: Number by Class and Calf Crop — Ohio: January 1, 2010-2014 ................................ 33
Milk Production and Disposition — Ohio and United States: 2010 - 2014 ................................................ 33
Milk Cows and Production by Month — Ohio: 2010-2014 ....................................................................... 34
Dairy Products: Annual Production Totals — Ohio: 2010 - 2014 .............................................................. 35
Honey: Number of Colonies, Yield, Production, Stocks, Price, and Value — Ohio: 2010-2014 .............. 36
Commercial Hog Slaughter — Ohio: Monthly 2013-2014 ......................................................................... 36
Hogs and Pigs: Production, Marketings and Income — Ohio: 2010-2014 ................................................ 37
Market Hogs and Pigs Inventory by Weight Group — Ohio and United States:
December 1, 2010-2014 .............................................................................................................................. 37
Hogs and Pigs Total, Breeding and Market Inventory, Farrowings, Pigs per litter, Pig crop, and
Marketings — Ohio and United States: December 1, 2010-2014............................................................... 37
Commercial Sheep and Lamb Slaughter — Ohio: Monthly 2013-2014 ..................................................... 38
Sheep and Lamb: Lamb Crop, Farm Slaughter and Death Loss — Ohio: 2010-2014................................ 38
Market Sheep and Lamb Inventory by Weight Group — Ohio: January 1, 2010-2014 ............................. 38
Sheep and Lamb Inventory by Class — Ohio and United States: January 1, 2010-2014 ........................... 39
Wool Production, Price and Value — Ohio: 2010-2014 ............................................................................ 39
Turkey Production and Value — Ohio and United States: 2010-2014 ...................................................... 39
Egg production and value — Ohio and United States: 2010 - 2014 ........................................................... 40
Chicken Disposition and Value — Ohio and United States: 2010-2014 .................................................... 40
Chicken Inventory by Class— Ohio and United States: December 1, 2010-2014 ..................................... 40
Young Chickens, Number Slaughtered, Total Live Weight, and Average Live Weight — Ohio:
Monthly 2013-2014 .................................................................................................................................... 41
Broiler Production and Value — Ohio: 2010-2014 ................................................................................... 41
Average Number of Layers on Hand and Eggs Produced by Months — Ohio: 2010 - 2014 ..................... 42
Floriculture
Bedding Plants: Producers, Quantity Sold, Price, and Value — Ohio: 2010-2014 .................................... 43
Potted Flowering and Annual Bedding Plants: Producers, Quantity Sold, Price, and Value —
Ohio: 2010-2014 ......................................................................................................................................... 44
Potted Flowering and Annual Bedding Plants: Producers, Quantity Sold, Price, and Value —

8 Ohio Annual Bulletin (September 2015) USDA, National Agricultural Statistics Service
Ohio: 2010-2014 (continued) ...................................................................................................................... 45
County Estimates
County Estimates: Cash Rent Per Acre — Ohio: 2013 & 2014 ................................................................. 46
County Estimates: Cash Rent Per Acre — Ohio: 2013 & 2014 (continued) ............................................. 47
County Estimates: Corn Harvested for Grain — Ohio: 2013 & 2014 ....................................................... 48
County Estimates: Corn Harvested for Grain — Ohio: 2013 & 2014 (continued) .................................... 49
County Estimates: Soybeans Harvested for Beans — Ohio: 2013 & 2014 ............................................... 50
County Estimates: Soybeans Harvested for Beans — Ohio: 2013 & 2014 (continued) ............................ 51
County Estimates: Winter Wheat — Ohio: 2013 & 2014 .......................................................................... 52
County Estimates: Winter Wheat — Ohio: 2013 & 2014 (continued) ...................................................... 53
County Estimates: Alfalfa and Alfalfa Mixtures for Hay, All Cropping Practices — Ohio: 2013
& 2014 ......................................................................................................................................................... 54
County Estimates: Alfalfa & Alfalfa Mixtures for Hay, All Cropping Practices — Ohio: 2013 &
2014 (continued) ......................................................................................................................................... 55
County Estimates: Other Hay, All Cropping Practices — Ohio: 2013 & 2014 ......................................... 56
County Estimates: Other Hay, All Cropping Practices — Ohio: 2013 & 2014 (continued) ...................... 57
County Estimates: Oats — Ohio: 2013 & 2014 ......................................................................................... 58
County Estimates: Cattle — Ohio: January 1, 2014 - 2015 ....................................................................... 59
County Estimates: Cattle — Ohio: January 1, 2014 - 2015 (continued) .................................................... 60
County Profiles
Adams County ............................................................................................................................................. 61
Allen County ............................................................................................................................................... 61
Ashland County ........................................................................................................................................... 62
Ashtabula County ........................................................................................................................................ 62
Athens County ............................................................................................................................................. 63
Auglaize County .......................................................................................................................................... 63
Belmont County .......................................................................................................................................... 64
Brown County ............................................................................................................................................. 64
Butler County .............................................................................................................................................. 65
Carroll County ............................................................................................................................................. 65
Champaign County ...................................................................................................................................... 66
Clark County ............................................................................................................................................... 66
Clermont County ......................................................................................................................................... 67
Clinton County ............................................................................................................................................ 67
Columbiana County..................................................................................................................................... 68
Coshocton County ....................................................................................................................................... 68
Crawford County ......................................................................................................................................... 69
Cuyahoga County ........................................................................................................................................ 69
Darke County .............................................................................................................................................. 70
Defiance County .......................................................................................................................................... 70
Delaware County ......................................................................................................................................... 71
Erie County ................................................................................................................................................. 71
Fairfield County .......................................................................................................................................... 72
Fayette County ............................................................................................................................................ 72
Franklin County .......................................................................................................................................... 73
Fulton County .............................................................................................................................................. 73
Gallia County .............................................................................................................................................. 74
Geauga County ............................................................................................................................................ 74
Greene County ............................................................................................................................................ 75
Guernsey County ......................................................................................................................................... 75
Hamilton County ......................................................................................................................................... 76
Hancock County .......................................................................................................................................... 76

Ohio Annual Bulletin (September 2015) 9 USDA, National Agricultural Statistics Service
Hardin County ............................................................................................................................................. 77
Harrison County .......................................................................................................................................... 77
Henry County .............................................................................................................................................. 78
Highland County ......................................................................................................................................... 78
Hocking County .......................................................................................................................................... 79
Holmes County ........................................................................................................................................... 79
Huron County .............................................................................................................................................. 80
Jackson County ........................................................................................................................................... 80
Jefferson County ......................................................................................................................................... 81
Knox County ............................................................................................................................................... 81
Lake County ................................................................................................................................................ 82
Lawrence County ........................................................................................................................................ 82
Licking County ........................................................................................................................................... 83
Logan County .............................................................................................................................................. 83
Lorain County ............................................................................................................................................. 84
Lucas County .............................................................................................................................................. 84
Madison County .......................................................................................................................................... 85
Mahoning County ....................................................................................................................................... 85
Marion County ............................................................................................................................................ 86
Medina County ............................................................................................................................................ 86
Meigs County .............................................................................................................................................. 87
Mercer County ............................................................................................................................................ 87
Miami County ............................................................................................................................................. 88
Monroe County ........................................................................................................................................... 88
Montgomery County ................................................................................................................................... 89
Morgan County ........................................................................................................................................... 89
Morrow County ........................................................................................................................................... 90
Muskingum County .................................................................................................................................... 90
Noble County .............................................................................................................................................. 91
Ottawa County ............................................................................................................................................ 91
Paulding County .......................................................................................................................................... 92
Perry County ............................................................................................................................................... 92
Pickaway County ........................................................................................................................................ 93
Pike County ................................................................................................................................................. 93
Portage County ............................................................................................................................................ 94
Preble County .............................................................................................................................................. 94
Putnam County ............................................................................................................................................ 95
Richland County ......................................................................................................................................... 95
Ross County ................................................................................................................................................ 96
Sandusky County ........................................................................................................................................ 96
Scioto County .............................................................................................................................................. 97
Seneca County ............................................................................................................................................ 97
Shelby County ............................................................................................................................................. 98
Stark County ............................................................................................................................................... 98
Summit County ........................................................................................................................................... 99
Trumbull County ......................................................................................................................................... 99
Tuscarawas County ................................................................................................................................... 100
Union County ............................................................................................................................................ 100
Van Wert County ...................................................................................................................................... 101
Vinton County ........................................................................................................................................... 101
Warren County .......................................................................................................................................... 102
Washington County .................................................................................................................................. 102
Wayne County .......................................................................................................................................... 103
Williams County ....................................................................................................................................... 103

10 Ohio Annual Bulletin (September 2015) USDA, National Agricultural Statistics Service
Wood County ............................................................................................................................................ 104
Wyandot County ....................................................................................................................................... 104

Ohio Annual Bulletin (September 2015) 11 USDA, National Agricultural Statistics Service
Historical Crop Data — Ohio
Farms Corn Soybeans Winter Wheat Hay Oats
Year Number Harvested1 Yield Harvested Yield Harvested Yield Harvested Yield Harvested Yield
(1,000) (acres)
(bushels) (1,000) (acres)
(bushels) (1,000) (acres)
(bushels) (1,000) (acres)
(tons) (1,000) (acres)
(bushels)
1965 ........ 1966 ........ 1967 ........ 1968 ........ 1969 ........ 1970 ........ 1971 ........ 1972 ........ 1973 ........ 1974 ........ 1975 ........ 1976 ........ 1977 ........ 1978 ........ 1979 ........ 1980 ........ 1981 ........ 1982 ........ 1983 ........ 1984 ........ 1985 ........ 1986 ........ 1987 ........ 1988 ........ 1989 ........ 1990 ........ 1991 ........ 1992 ........ 1993 ........ 1994 ........ 1995 ........ 1996 ........ 1997 ........ 1998 ........ 1999 ........ 2000 ........ 2001 ........ 2002 ........ 2003 ........ 2004 ........ 2005 ........ 2006 ........ 2007 ........ 2008 ........ 2009 ........ 2010 ........ 2011 ........ 2012 ........ 2013 ........ 2014 ........
129,000 126,000 124,000 122,000 120,000 118,000 116,000 114,000 113,000 112,000 101,000 99,000 97,000 96,000 96,000 95,000 94,000 93,000 92,000 90,000 89,000 88,000 84,000 85,000 85,000 83,000 80,000 78,000 81,000 80,000 79,000 78,000 79,000 79,000 79,000 79,000 78,000 77,800 77,600 77,200 76,500 76,200 75,900 75,300 75,100 75,400 75,300 75,500 75,000 74,500
3,054 3,115 3,240 2,884 2,773 3,040 3,545 3,090 3,040 3,540 3,340 3,820 3,620 3,610 3,630 3,900 3,750 4,000 2,800 3,900 4,030 3,720 3,100 3,000 2,980 3,450 3,400 3,550 3,280 3,500 3,100 2,800 3,550 3,340 3,200 3,300 3,170 2,970 3,070 3,110 3,250 2,960 3,610 3,120 3,140 3,270 3,200 3,650 3,730 3,470
74 84 79 86 87 79 91 92 80 75 93
103 105 105 115 113 96
114 80
118 127 128 120 85
117 121 96
143 110 139 121 111 134 141 126 147 138 89
156 158 143 159 150 131 171 160 153 120 174 176
2,044 2,105 2,231 2,325 2,475 2,550 2,634 3,010 3,590 3,140 3,100 2,880 3,480 3,870 4,080 3,760 3,450 3,700 3,280 3,770 3,870 3,620 3,900 3,700 3,980 3,480 3,770 3,680 4,110 3,990 4,030 4,490 4,340 4,390 4,500 4,440 4,580 4,720 4,280 4,420 4,480 4,620 4,240 4,480 4,530 4,590 4,540 4,590 4,490 4,840
24.5 28.5 22.5 30.5 29.5 28.5 30.5 26.5 25.5 26.0 33.0 33.0 35.0 33.0 35.5 36.0 28.5 36.0 32.0 36.5 41.5 40.5 37.0 27.0 31.5 39.0 36.0 40.0 38.0 43.5 38.0 35.0 44.0 44.0 36.0 42.0 41.0 32.0 38.5 47.0 45.0 47.0 47.0 36.0 49.0 48.0 48.0 45.0 49.5 52.5
1,258 1,183 1,514 1,196 1,017
925 944
1,029 800
1,450 1,680 1,600 1,540 1,080 1,320 1,370 1,600 1,200 1,200 1,100
950 1,050
850 920
1,230 1,270 1,080 1,115 1,010 1,180 1,210 1,330 1,090 1,160 1,030 1,110
900 810
1,000 890 830 960 730
1,090 950 700 850 450 640 545
32 39 34 38 38 38 44 45 32 41 42 40 47 39 48 49 44 43 49 44 62 46 58 50 51 60 49 53 52 58 61 39 63 64 70 72 67 62 68 62 71 68 61 67 71 61 57 68 70 74
1,853 1,786 1,654 1,600 1,415 1,440 1,550 1,476 1,500 1,380 1,510 1,540 1,550 1,550 1,440 1,430 1,420 1,340 1,260 1,350 1,450 1,460 1,400 1,625 1,625 1,400 1,300 1,300 1,250 1,280 1,250 1,200 1,250 1,160 1,240 1,280 1,390 1,320 1,350 1,190 1,200 1,210 1,160 1,140 1,040 1,110 1,120 1,030 1,000
960
1.86 2.04 1.82 2.14 2.05 2.09 2.07 2.12 2.20 2.19 2.36 2.31 2.30 2.50 2.51 2.51 2.53 2.64 2.57 2.81 3.17 2.95 3.06 2.18 2.80 3.30 2.42 3.26 2.78 3.43 3.23 2.83 3.08 3.01 2.42 3.35 2.88 2.58 2.94 2.72 3.03 2.83 2.42 2.46 2.77 2.59 2.48 2.15 2.50 2.82
606 642 494 692 585 528 539 367 540 475 465 440 370 340 290 290 270 340 240 220 310 160 250 200 250 230 170 170 150 120 100 90 90
100 100 90 85 55 60 50 60 55 50 65 50 55 31 46 25 39
56 52 51 68 62 60 68 61 48 62 63 57 59 61 70 67 63 69 64 63 85 76 70 45 63 70 60 71 60 56 69 57 74 65 70 76 73 61 66 63 60 75 62 70 75 70 54 56 63 63
1 Harvested for grain. Silage acreage not included.

12 Ohio Annual Bulletin (September 2015) USDA, National Agricultural Statistics Service
Record Highs and Lows: Harvested Acres, Yield, and Production — Ohio
Crop Series Began
Record Area Yield Production
Harvested Year Yield Year Production Year
(acres) (bushels) (bushels)
Corn For Grain ......... Soybeans for Beans . Wheat ...................... Oats .........................
1866
1924
1866
1866
High Low High Low High Low High Low
4,200,000 2,350,000 4,990,000
17,000 3,209,000
450,000 2,374,000
25,000
1917 1868 2015 1925 1899 2012 1928 2013
176.00 25.00 52.50 11.50 74.00 6.00
85.00 20.00
2014 1890 2014
1924,26 2014
1866, 1900 1985 1890
649,020,000 72,000,000
254,100,000 207,000
79,920,000 9,000,000
92,400,000 1,575,000
2013 1867 2014 1926 2000 1866 1912 2013
(acres) (tons) (tons)
Corn for Silage ......... Alfalfa Hay ............... Other Hay ................
1919
1919
1919
High Low High Low High Low
285,000 106,000
1,052,000 93,000
3,206,000 500,000
1981 1935 1955 1920 1922 1996
20.50 5.40 4.20 1.30 2.70 0.71
2014 1930 1994 1930 2000 1930
4,000,000 823,000
2,800,000 188,000
4,159,000 1,080,000
1982 1933
1985,90,92 1919 1922 1999
(acres) (cwt) (cwt)
Potatoes ..................
1866
High Low
225,000 1,500
1895 2014
335.00 27.00
2009 1881
12,269,000 420,000
1909 2014
(acres) (lbs) (lbs)
Tobacco ...................
1866
High Low
106,000 1,600
1909 2011
2,496.00 620.00
1970 1875
94,575,000 3,325,000
1918 2015
Cash Rents, State Average — Ohio: 2010-2014
Year Non-irrigated cropland Irrigated cropland All cropland Pastureland
(dollars per acre) (dollars per acre) (dollars per acre) (dollars per acre)
2010 .................... 2011 .................... 2012 .................... 2013 .................... 2014 ....................
100.00 110.00 122.00 139.00 144.00
148.00 140.00 160.00 150.00 165.00
101.00 110.00 122.00 139.00 144.00
35.00 35.00 30.00 25.00 25.00

Ohio Annual Bulletin (September 2015) 13 USDA, National Agricultural Statistics Service
Average Prices Paid by Farmers for Feed and Fuels — Corn Belt: 2010 - 2014 [Corn Belt states: Ohio, Illinois, Indiana, Iowa, and Missouri]
Feed1 2010 2011 2012 2013 2014
(Dollars per ton) (Dollars per ton) (Dollars per ton) (Dollars per ton) (Dollars per ton)
Hog Feed 14-18% ................................... Hog concentrate 38-42% protein ............. Beef cattle concentrate 32-36% protein ... Dairy Feed 16% protein ........................... Dairy feed 32-38% protein ....................... Laying feed .............................................. Turkey Grower .........................................
290 434 407 263 432 328 412
367 549 516 381 512 387 483
384 558 532 391 531 403 502
481 625 610 411 638 521 637
498 646 632 430 663 548 655
(Dollars per gallon) (Dollars per gallon) (Dollars per gallon) (Dollars per gallon) (Dollars per gallon)
Unleaded gas, retail ................................. Unleaded gas, bulk .................................. Diesel, bulk .............................................. LP gas, bulk .............................................
2.70 2.78 2.54 1.87
3.46 3.53 3.51 1.95
3.77 3.83 3.68 2.01
3.61 3.68 3.55 1.77
3.54 3.60 3.60 1.92
1 April Price
Average Prices Paid by Farmers for Fertilizers — United States Average: 2010- 2014 Feed1 2010 2011 2012 2013 2014
(Dollars per ton) (Dollars per ton) (Dollars per ton) (Dollars per ton) (Dollars per ton)
5-20-20 ......................................................................... 6-24-24 ......................................................................... 10-34-0 ......................................................................... 18-46-0 ......................................................................... Ammonium nitrate ......................................................... Urea 44-46% ................................................................ Anhydrous Ammonia .................................................... Nitrogen Solution 28% .................................................. Superphosphate 44-46% .............................................. Muriate of Potash 60-62% ............................................
455 565 422 508 398 448 499 261 507 511
553 675 675 703 479 526 749 369 633 601
601 687 755 675 574 644 785 388 729 665
590 703 629 640 544 592 847 397 701 595
580 690 611 611 560 571 851 372 621 601
1 Marketing Year Average Price.
Farm Real Estate Value — Ohio: 2010 - 2014 Year Farmland & buildings Cropland Pastureland
(Dollars per acre) (Dollars per acre) (Dollars per acre)
2010 ............................ 2011 ............................ 2012 ............................ 2013 ............................ 2014 ............................
3,850 4,160 4,640 5,100 5,550
3,900 4,160 4,640 5,190 5,650
2,890 2,840 2,970 3,010 3,100

14 Ohio Annual Bulletin (September 2015) USDA, National Agricultural Statistics Service
Rank and Quantity Produced, Selected Commodities — Ohio, Leading State, and United States: 2014
Commodity Unit Ohio Leading State
United States Rank Quantity State Quantity
Field Crops Corn, grain, production ..............................(1,000 bu) Corn, silage, production ......................... (1,000 tons) Soybeans, production ...............................(1,000 bu) Winter Wheat, production ..........................(1,000 bu) Hay, alfalfa, production .......................... (1,000 tons) Hay, other, production ............................ (1,000 tons) Maple Syrup, production ................... (1,000 gallons) Oats, production ........................................(1,000 bu) Potatoes, production ............................... (1,000 cwt) Tobacco, production ................................... (1,000 lb) Fresh Vegetables Bell peppers, production .......................... (1,000 cwt) Cabbage, production ............................... (1,000 cwt) Corn, sweet, production .......................... (1,000 cwt) Pumpkins, production .............................. (1,000 cwt) Squash, production ................................. (1,000 cwt) Tomatoes, production ............................. (1,000 cwt) Processed Vegetables Cucumbers, production .......................... (1,000 tons) Tomatoes, production ............................ (1,000 tons) Fruit Apples, production ................................... (1,000 lbs) Grapes, production ................................ (1,000 Tons) Peach, production ................................. (1,000 Tons) Strawberries, production 1 ....................... (1,000 cwt) Livestock 2 Egg production ........................................ (1,000 No.) Cattle & calves ...................................... (1,000 head) Hogs & pigs .......................................... (1,000 head) Sheep and Lamb ................................... (1,000 head) Turkey ................................................... (1,000 head) Milk .......................................................... (1,000 lbs) Miscellaneous Farms ..................................................... (1,000 No.) Land in farms ....................................... (1,000 acres) Average size of farm ...................................... (acres)
8 12 7
14 19 18 6 9
26 8
5 11 6 3 8 4
3 3
12 12 23 10
2 25 8
12 10 11
7 21 35
610,720 3,895
254,100 40,330 1,085 1,625
130 2,457
420 4,300
455 490
1,314 1,053
304 954
41 154
44,000 4
0.23 18
8,731,000 1,250 2,220
121 5,100
5,425,000
75 14,000
188
Iowa Wisconsin
Illinois Kansas
California Texas
Vermont South Dakota
Idaho North Carolina
California California California
Illinois Michigan California
Michigan California
Washington California California California
Iowa Texas
Iowa Texas
Minnesota California
Texas Texas
Wyoming
2,367,400 15,725
547,680 246,400
5,688 11,130 1,350 9,300
135,920 453,860
9,242 6,888 5,423 7,458 1,200
10,175
167 14,010
7,300,000 6,822
620 27,577
16,449,000 11,800 21,300
720 45,500
42,337,000
246 130,000
2,598
14,215,532 128,048
3,968,823 1,377,526
61,446 78,352 3,211
69,684 446,693 876,415
15,346 22,359 25,346 13,143 5,745
27,280
482 14,637
11,431,200 7,772
853 30,222
99,768,000 89,800 67,726 5,280
237,500 206,046,000
2,084 913,000
438
1 Fresh market. 2 Inventory January 1, 2015 for cattle; December 1, 2014 for hogs.

Ohio Annual Bulletin (September 2015) 15 USDA, National Agricultural Statistics Service
Number of Farms, Land in Farms and Average Farm Size — Ohio and United States: 2010 - 2014 [Places with annual sales of agricultural products of $1,000 or more.]
Year
Ohio United States
Number of farms
Land in farms
Average farm size
Number of farms
Land in farms
Average farm size
(number) (1,000 acres) (acres) (number) (1,000 acres) (acres)
2010 ...................... 2011 ...................... 2012 ...................... 2013 ...................... 2014 ......................
75,400 75,300 75,500 75,000 74,500
13,840 13,800 14,000 14,000 14,000
184 183 185 187 188
2,149,520 2,131,240 2,109,810 2,102,010 2,084,000
915,660 914,420 914,600 914,030 913,000
426 429 433 435 438
Grain Storage Capacity by Position and Off-Farm Facilities — Ohio: December 1, 2010-2014
Date On farms Off farms 1 Off farm facilities
(1,000 bushels) (1,000 bushels) (Number)
December 1, 2010 ........................................................... December 1, 2011 ........................................................... December 1, 2012 ........................................................... December 1, 2013 ........................................................... December 1, 2014 ...........................................................
480,000 500,000 510,000 530,000 540,000
371,650 412,240 420,500 425,200 425,000
422 405 399 380 370
1 Includes stocks at mills, elevators, terminals, and processors.
Crops: Monthly Prices Received by Farmers — Ohio: 2013-2014 Marketing Year
2013-2014 Marketing
years
Corn per bushel
Winter wheat
per bushel
Soybeans per bushel
Alfalfa hay
per ton
Other hay
per ton
Milk per cwt
(Dollars) (Dollars) (Dollars) (Dollars) (Dollars) (Dollars)
September .................... October ........................ November ..................... December ..................... January ........................ February ....................... March ........................... April .............................. May .............................. June ............................. July ............................... August ..........................
5.57 4.36 4.17 4.31 4.36 4.37 4.57 4.69 4.89 4.49 4.13 3.62
6.24 6.67 6.74 6.24 6.10 5.87 6.38 6.60 6.71 5.90 5.64 5.54
13.00 12.30 12.70 13.10 13.10 13.40 14.10 14.50 15.00 14.80 13.30 13.10
190.00 205.00 205.00 200.00 185.00 185.00 185.00 165.00 165.00 160.00 175.00 175.00
140.00 150.00 145.00 155.00 145.00 145.00 140.00 110.00 125.00 110.00 110.00 115.00
21.30 21.60 22.40 22.80 24.10 25.20 25.70 25.80 24.80 23.70 23.90 24.90
Crops: Monthly Percent of Crop Marketed — Ohio: 2012-2014 Marketing Years
Corn Soybeans Wheat
2011 - 2012
2012 - 2013
2013 - 2014
2011 - 2012
2012 - 2013
2013 - 2014
2011 - 2012
2012 - 2013
2013 - 2014
(Percent) (Percent) (Percent) (Percent) (Percent) (Percent) (Percent) (Percent) (Percent)
September ........ October ............ November ......... December ......... January ............ February ........... March ............... April .................. May .................. June ................. July ................... August ..............
2 6
18 9
15 9
10 6 7 7 6 5
6 14 15 7
13 6
10 7 7 6 5 4
4 18 17 5
11 9
10 8 4 5 5 4
1 17 13 8
12 12 10 7 4 5 6 5
5 24 8 9
23 8 5 5 5 3 3 2
12 32 11 6
12 9 6 5 2 1 2 2
3 2 1 1 4 2 2 1 1
26 41 9
4 1 3 2 5 3
13 10 4 5
46 15
9 8 5 2 3 3 4 2 2 1
NA NA
(NA) Data are not available.

16 Ohio Annual Bulletin (September 2015) USDA, National Agricultural Statistics Service
Field Crops
Corn for Grain Area Planted and Harvested, Yield, Production, Price, and Value — Ohio: 2010-2014
Year Area
planted Area
harvested Yield
per acre Production
Price per bushel1
Value of production
(1,000 acres) (1,000 acres) (bushels) (1,000 bushels) (dollars) (1,000 dollars)
2010 ........................... 2011 ........................... 2012 ........................... 2013 ........................... 2014 ...........................
3,450 3,400 3,900 3,900 3,700
3,270 3,200 3,650 3,730 3,470
160.0 153.0 120.0 174.0 176.0
523,200 489,600 438,000 649,020 610,720
5.45 6.44 7.09 4.41 3.65
2,851,440 3,153,024 3,105,420 2,862,178 2,229,128
1 Marketing year average price.
0
20
40
60
80
100
120
140
160
180
200
Yie
ld
Year
Corn Yield - Ohio: 1965-2014

Ohio Annual Bulletin (September 2015) 17 USDA, National Agricultural Statistics Service
Corn for Silage Area Harvested, Yield, and Production — Ohio: 2010-2014
Year Area
harvested Yield
per acre Production
(1,000 acres) (tons) (1,000 tons)
2010 ....................................................... 2011 ....................................................... 2012 ....................................................... 2013 ....................................................... 2014 .......................................................
140 140 200 130 190
17.0 18.0 15.0 19.5 20.5
2,380 2,520 3,000 2,535 3,895
Corn Stocks by Position and Month — Ohio: 2010-2014
Date On farms Off farms 1 Total all positions
(1,000 bushels) (1,000 bushels) (1,000 bushels)
March 1, 2010 .................................................................. June 1, 2010 .................................................................... September 1, 2010 .......................................................... December 1, 2010 ........................................................... March 1, 2011 .................................................................. June 1, 2011 .................................................................... September 1, 2011 .......................................................... December 1, 2011 ........................................................... March 1, 2012 .................................................................. June 1, 2012 .................................................................... September 1, 2012 .......................................................... December 1, 2012 ........................................................... March 1, 2013 .................................................................. June 1, 2013 .................................................................... September 1, 2013 .......................................................... December 1, 2013 ........................................................... March 1, 2014 .................................................................. Jume 1, 2014 ................................................................... September 1, 2014 .......................................................... December 1, 2014 ...........................................................
200,000 83,000 15,000
270,000
140,000 49,000 10,000
280,000
125,000 57,000 16,000
220,000
135,000 61,000 8,200
330,000
210,000 90,000 16,000
340,000
124,237 91,138 42,026
131,939
108,893 68,565 27,763
118,056
117,695 78,743 25,825
134,644
117,438 68,600 16,165
179,636
153,584 124,115 36,447
166,887
324,237 174,138 57,026
401,939
248,893 117,565 37,763
398,056
242,695 135,743 41,825
354,644
252,438 129,600 24,365
509,636
363,584 214,115 52,447
506,887
1 Includes stocks at mills, elevators, terminals, and processors.

18 Ohio Annual Bulletin (September 2015) USDA, National Agricultural Statistics Service
Soybeans for Beans Area Planted and Harvested, Yield, Production, Price, and Value — Ohio: 2010-2014
Year Area
planted Area
harvested Yield
per acre Production
Price per bushel1
Value of production
(1,000 acres) (1,000 acres) (bushels) (1,000 bushels) (dollars) (1,000 dollars)
2010 ........................... 2011 ........................... 2012 ........................... 2013 ........................... 2014 ...........................
4,600 4,550 4,600 4,500 4,850
4,590 4,540 4,590 4,490 4,840
48.0 48.0 45.0 49.5 52.5
220,320 217,920 206,550 222,255 254,100
11.50 13.00 14.60 13.00 10.40
2,533,680 2,832,960 3,015,630 2,889,315 2,642,640
1 Marketing year average price.
0
10
20
30
40
50
60
Yie
ld
Year
Soybean Yield – Ohio: 1965 – 2014

Ohio Annual Bulletin (September 2015) 19 USDA, National Agricultural Statistics Service
Soybean Stocks by Position and Month — Ohio: 2010-2014
Date On farms Off farms 1 Total all positions
(1,000 bushels) (1,000 bushels) (1,000 bushels)
March 1, 2010 .................................................................. June 1, 2010 .................................................................... September 1, 2010 .......................................................... December 1, 2010 ........................................................... March 1, 2011 .................................................................. June 1, 2011 .................................................................... September 1, 2011 .......................................................... December 1, 2011 ........................................................... March 1, 2012 .................................................................. June 1, 2012 .................................................................... September 1, 2012 .......................................................... December 1, 2012 ........................................................... March 1, 2013 .................................................................. June 1, 2013 .................................................................... September 1, 2013 .......................................................... December 1, 2013 ........................................................... March 1, 2014 .................................................................. June 1, 2014 .................................................................... September 1, 2014 .......................................................... December 1, 2014 ...........................................................
50,000 18,000 1,700
82,000
37,000 8,500 4,100
95,000
46,000 12,000 4,400
78,000
36,000 16,000 1,000
84,000
33,000 9,500 1,100
110,000
35,792 18,979 4,573
57,243
42,994 24,931 12,609 70,852
54,965 35,874 7,088
64,340
36,357 17,994 4,398
56,800
30,662 13,804 4,199
70,593
85,792 36,979 6,273
139,243
79,994 33,431 16,709
165,852
100,965 47,874 11,488
142,340
72,357 33,994 5,398
140,800
63,662 23,304 5,299
180,593
1 Includes stocks at mills, elevators, terminals, and processors.

20 Ohio Annual Bulletin (September 2015) USDA, National Agricultural Statistics Service
Winter Wheat Area Planted and Harvested, Yield, Production, Price, and Value — Ohio: 2010-2014
Year Area
planted Area
harvested Yield
per acre Production
Price per bushel1
Value of production
(1,000 acres) (1,000 acres) (bushels) (1,000 bushels) (dollars) (1,000 dollars)
2010 ........................... 2011 ........................... 2012 ........................... 2013 ........................... 2014 ...........................
720 880 500 660 620
700 850 450 640 545
61 57 68 70 74
42,700 48,450 30,600 44,800 40,330
5.21 6.73 7.94 6.54 5.55
222,467 326,069 242,964 292,992 223,832
1 Marketing year average price.
0
10
20
30
40
50
60
70
80
Yie
ld
Year
Winter Wheat Yield – Ohio: 1965 – 2014

Ohio Annual Bulletin (September 2015) 21 USDA, National Agricultural Statistics Service
Oat Area Planted and Harvested, Yield, Production, Price, and Value — Ohio: 2010-2014
Year Area
planted Area
harvested Yield
per acre Production
Price per bushel1
Value of production
(1,000 acres) (1,000 acres) (bushels) (1,000 bushels) (dollars) (1,000 dollars)
2010 ........................... 2011 ........................... 2012 ........................... 2013 ........................... 2014 ...........................
65 40 70 50 55
55 31 46 25 39
70 54 56 63 63
3,850 1,674 2,576 1,575 2,457
3.09 4.30 4.71 3.75 4.65
11,897 7,198
12,133 5,906
11,425
1 Marketing year average price.
All Tobacco Area Harvested, Yield, Production, Price, and Value — Ohio: 2010-2014
Year Area
harvested Yield
per acre Production
Price per pound1
Value of production
(acres) (pounds) (1,000 pounds) (dollars) (1,000 dollars)
2010 .................................. 2011 .................................. 2012 .................................. 2013 .................................. 2014 ..................................
2,500 1,600 1,900 2,100 2,000
2,050 2,100 2,100 2,200 2,150
5,125 3,360 3,990 4,620 4,300
1.63 1.69 1.89 2.05 1.96
8,354 5,678 7,541 9,471 8,428
1 Marketing year average price.
Fall Potato Area Planted and Harvested, Yield, Production, Price, and Value — Ohio: 2010-2014
Year Area
planted Area
harvested Yield
per acre Production
Price per cwt1
Value of production
(1,000 acres) (1,000 acres) (cwt) (1,000 cwt) (dollars) (1,000 dollars)
2010 ........................... 2011 ........................... 2012 ........................... 2013 ........................... 2014 ...........................
2.2 2.0 2.1 1.9 1.6
2.1 1.7 2.0 1.8 1.5
290 270 220 280 280
609 459 440 504 420
12.30 12.30 11.80 14.80 13.00
7,491 5,646 5,192 7,459 5,460
1 Marketing year average price.
Maple Syrup Taps, Yield, and Production — Ohio: 2010-2014
Date Taps Yield
per tap Production
Value of production
(number) (gallons) (gallons) (1,000 dollars)
2010 ................................................................. 2011 ................................................................. 2012 ................................................................. 2013 ................................................................. 2014 .................................................................
385,000 405,000 440,000 440,000 450,000
0.169 0.309 0.216 0.352 0.289
65,000 125,000 95,000
155,000 130,000
2,776 5,038 4,038 5,720 5,564

22 Ohio Annual Bulletin (September 2015) USDA, National Agricultural Statistics Service
Alfalfa Hay Area Planted and Harvested, Yield, Production, Price, and Value — Ohio: 2010-2014
Year Area
harvested Yield Production
Price per ton1
Value of production
(1,000 acres) (tons) (1,000 tons) (dollars) (1,000 dollars)
2010 ............................ 2011 ............................ 2012 ............................ 2013 ............................ 2014 ............................
390 380 360 330 310
3.30 3.40 2.80 3.50 3.50
1,287 1,292 1,008 1,155 1,085
160.00 183.00 231.00 194.00 174.00
205,920 236,436 232,848 224,070 188,790
1 Marketing year average price.
Other Hay Area Planted and Harvested, Yield, Production, Price, and Value — Ohio: 2010-2014
Year Area
harvested Yield Production
Price per ton1
Value of production
(1,000 acres) (tons) (1,000 tons) (dollars) (1,000 dollars)
2010 ............................ 2011 ............................ 2012 ............................ 2013 ............................ 2014 ............................
720 740 670 670 650
2.20 2.00 1.80 2.00 2.50
1,584 1,480 1,206 1,340 1,625
77.00 94.00
162.00 151.00 112.00
121,968 139,120 195,372 202,340 182,000
1 Marketing year average price.
Forage Area Harvested, Yield, and Production — Ohio: 2010-2014
Year Area
harvested Yield
per acre 1 Production 1
(1,000 acres) (tons) (1,000 tons)
2010 ............................................... 2011 ............................................... 2012 ............................................... 2013 ............................................... 2014 ...............................................
1,150 1,170 1,100 1,050 1,030
2.72 2.59 2.35 2.70 2.96
3,124 3,033 2,588 2,838 3,044
1 Dry ton basis.

Ohio Annual Bulletin (September 2015) 23 USDA, National Agricultural Statistics Service
Days Suitable for Fieldwork — Ohio: 2013-2014
Week ending date 2013 2014
April 6 .............................................................................. April 13 ............................................................................ April 20 ............................................................................ April 27 ............................................................................ May 4 .............................................................................. May 11 ............................................................................ May 18 ............................................................................ May 25 ............................................................................ June 1 ............................................................................. June 8 ............................................................................. June 15 ........................................................................... June 22 ........................................................................... June 29 ........................................................................... July 6 ............................................................................... July 13 ............................................................................. July 20 ............................................................................. July 27 ............................................................................. August 3 .......................................................................... August 10 ........................................................................ August 17 ........................................................................ August 24 ........................................................................ August 31 ........................................................................ September 7 .................................................................... September 14 .................................................................. September 21 .................................................................. September 28 .................................................................. October 5 ......................................................................... October 12 ....................................................................... October 19 ....................................................................... October 26 ....................................................................... November 2 ..................................................................... November 9 .....................................................................
4.0 3.0 2.0 2.0 4.0 4.0 5.0 6.0 6.0 5.0 3.0 6.0 3.0 1.0 2.0 5.0 4.0 5.0 4.0 6.0 6.0 6.0 7.0 6.0 5.0 6.0 NA NA 4.0 5.0 4.0 5.0
0.9 0.8 2.0 3.7 1.4 4.6 1.3 3.2 5.4 4.1 3.9 3.8 2.7 5.3 5.0 5.8 5.8 5.6 6.3 5.1 5.1 6.0 5.7 4.8 5.8 6.7 5.0 3.7 3.2 4.3 4.8 4.4
(NA) Not available due to a lapse in federal funding in October 2013.

24 Ohio Annual Bulletin (September 2015) USDA, National Agricultural Statistics Service
Winter Wheat Development by Selected Dates – Ohio: 2013-2014 and 2010-2014 Average
Headed Harvested Planted Emerged
Week ending date 2013 2014 Average 2013 2014 Average 2013 2014 Average 2013 2014 Average
(percent) (percent) (percent) (percent) (percent) (percent) (percent) (percent) (percent) (percent) (percent) (percent)
April 27 ................. May 4 .................... May 11 .................. May 18 .................. May 25 .................. June 1 ................... June 8 ................... June 15 ................. June 22 ................. June 29 ................. July 6 .................... July 13 .................. July 20 .................. July 27 .................. August 3 ............... August 10 ............. September 14 ....... September 21 ....... September 28 ....... October 5 .............. October 12 ............ October 19 ............ October 26 ............ November 2 .......... November 9 ..........
4 13 53 82 97
100 100
4 35 76 94 98
100
1 2
11 29 60 86 98
100 100
1 3 8
25 84 97
100
2 20 61 89 97
100
4 17 43 75 95 99
100
1 2
11 NA NA 77 89 96
100
3 15 33 42 55 72 90 95
1 2 7
21 42 63 80 89 95
NA NA 51 68 79 89
2 9
18 28 45 62 75
5 13 27 44 61 75
(NA) Not available due to a lapse in federal funding in October 2013.
Oats Development by Selected Dates — Ohio: 2013-2014 and 2010-2014 Average
Planted Emerged Headed Harvested
Week ending date 2013 2014 Average 2013 2014 Average 2013 2014 Average 2013 2014 Average
(percent) (percent) (percent) (percent) (percent) (percent) (percent) (percent) (percent) (percent) (percent) (percent)
April 6 ................... April 13 ................. April 20 ................. April 27 ................. May 4 .................... May 11 .................. May 18 .................. May 25 .................. June 1 ................... June 8 ................... June 15 ................. June 22 ................. June 29 ................. July 6 .................... July 13 .................. July 20 .................. July 27 .................. August 3 ............... August 10 ............. August 17 ............. August 24 ............. August 31 .............
7 22 37 50 65 83 93 97
100 100
1 6
19 43 53 77 86 90 96
100
17 32 47 61 71 79 84 89 93 95
9
12 16 29 45 60 79 91 96
100
1 2
14 26 44 67 79 89 96
100
1 7
16 27 41 58 66 78 87 91 97
1 4
19 47 76 86 95 99
100
1 7
13 31 54 78 91 97
100
3 9
17 29 51 71 80 89 96 99
3 21 35 56 79 93 99
100
7 25 34 54 68 88 95
100
11 30 50 73 91 98
100 100

Ohio Annual Bulletin (September 2015) 25 USDA, National Agricultural Statistics Service
Soybean Development by Selected Dates — Ohio: 2013-2014 and 2010-2014 Average
Planted Emerged Blooming
Week ending date 2013 2014 Average 2013 2014 Average 2013 2014 Average
(percent) (percent) (percent) (percent) (percent) (percent) (percent) (percent) (percent)
April 27 .......................... May 4 ............................ May 11 .......................... May 18 .......................... May 25 .......................... June 1 ........................... June 8 ........................... June 15 ......................... June 22 ......................... June 29 ......................... July 6 ............................. July 13 ........................... July 20 ........................... July 27 ........................... August 3 ........................ August 10 ...................... August 17 ...................... August 24 ......................
1
14 41 66 86 93 97
100 100
1 3
13 20 34 66 85 91 95
100
6 12 22 35 52 70 83 93 97
100
3 24 54 73 84 95 99
100
3 11 31 59 78 88 95
100
5 12 26 46 64 78 90 97 99
6 24 55 72 85 92 95 99
1 10 22 51 71 82 91 94
100
7 16 32 55 72 85 94 97
100
Soybean Development by Selected Dates — Ohio: 2013-2014 and 2010-2014 Average
Setting pods Dropping leaves Harvested
Week ending date 2013 2014 Average 2013 2014 Average 2013 2014 Average
(percent) (percent) (percent) (percent) (percent) (percent) (percent) (percent) (percent)
July 20 ........................... July 27 ........................... August 3 ........................ August 10 ...................... August 17 ...................... August 24 ...................... August 31 ...................... September 7 .................. September 14 ................ September 21 ................ September 28 ................ October 5 ....................... October 12 ..................... October 19 ..................... October 26 ..................... November 2 ................... November 9 ................... November 16 ................. November 23 .................
6 22 43 68 81 91 96
100
8 24 48 66 80 91 97
100
11 26 44 65 79 92 97 99
3 14 42 67 83
NA NA 96
2 5
12 28 48 75 88 93 97
4 9
20 39 60 76 87 94 98
3 15
NA NA 68 80 90 94 99
100
1 9
21 29 36 50 72 86 93 95
5 13 23 38 56 73 83 90 96 99
(NA) Not available due to a lapse in federal funding in October 2013.
26 Ohio Annual Bulletin (September 2015) USDA, National Agricultural Statistics Service
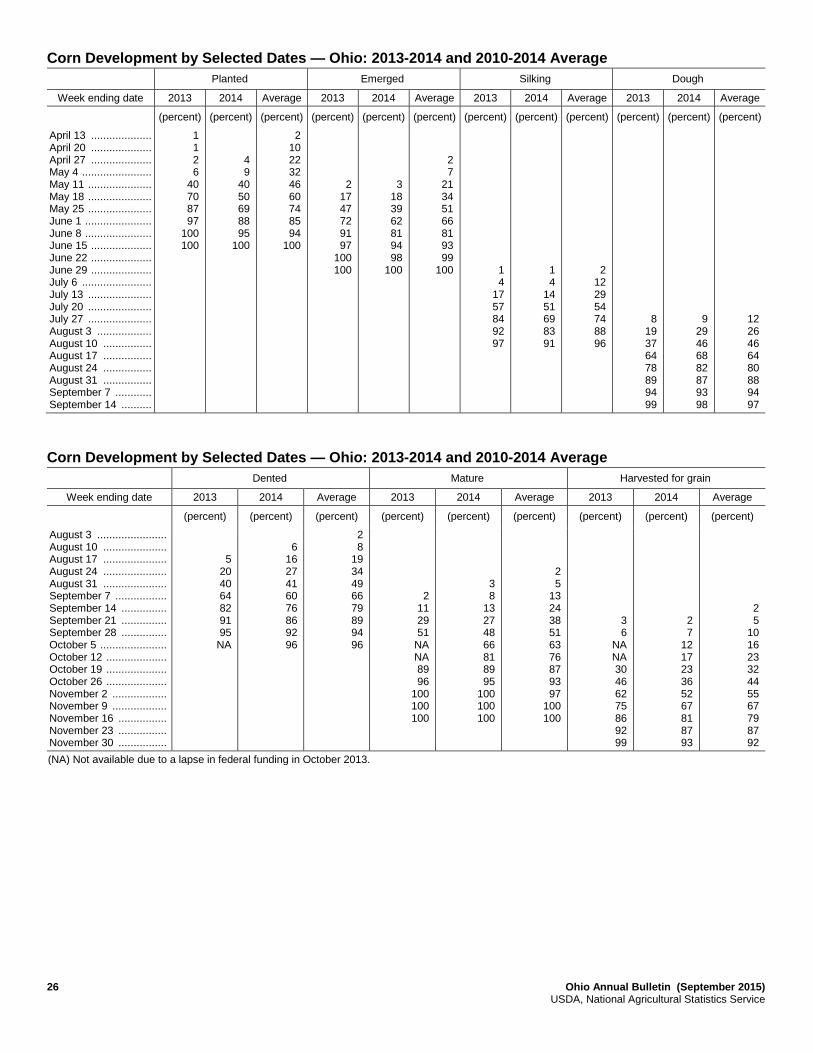
Corn Development by Selected Dates — Ohio: 2013-2014 and 2010-2014 Average
Planted Emerged Silking Dough
Week ending date 2013 2014 Average 2013 2014 Average 2013 2014 Average 2013 2014 Average
(percent) (percent) (percent) (percent) (percent) (percent) (percent) (percent) (percent) (percent) (percent) (percent)
April 13 .................... April 20 .................... April 27 .................... May 4 ....................... May 11 ..................... May 18 ..................... May 25 ..................... June 1 ...................... June 8 ...................... June 15 .................... June 22 .................... June 29 .................... July 6 ....................... July 13 ..................... July 20 ..................... July 27 ..................... August 3 .................. August 10 ................ August 17 ................ August 24 ................ August 31 ................ September 7 ............ September 14 ..........
1 1 2 6
40 70 87 97
100 100
4 9
40 50 69 88 95
100
2 10 22 32 46 60 74 85 94
100
2 17 47 72 91 97
100 100
3 18 39 62 81 94 98
100
2 7
21 34 51 66 81 93 99
100
1 4
17 57 84 92 97
1 4
14 51 69 83 91
2 12 29 54 74 88 96
8 19 37 64 78 89 94 99
9 29 46 68 82 87 93 98
12 26 46 64 80 88 94 97
Corn Development by Selected Dates — Ohio: 2013-2014 and 2010-2014 Average
Dented Mature Harvested for grain
Week ending date 2013 2014 Average 2013 2014 Average 2013 2014 Average
(percent) (percent) (percent) (percent) (percent) (percent) (percent) (percent) (percent)
August 3 ....................... August 10 ..................... August 17 ..................... August 24 ..................... August 31 ..................... September 7 ................. September 14 ............... September 21 ............... September 28 ............... October 5 ...................... October 12 .................... October 19 .................... October 26 .................... November 2 .................. November 9 .................. November 16 ................ November 23 ................ November 30 ................
5 20 40 64 82 91 95
NA
6
16 27 41 60 76 86 92 96
2 8
19 34 49 66 79 89 94 96
2 11 29 51
NA NA 89 96
100 100 100
3 8
13 27 48 66 81 89 95
100 100 100
2 5
13 24 38 51 63 76 87 93 97
100 100
3 6
NA NA 30 46 62 75 86 92 99
2 7
12 17 23 36 52 67 81 87 93
2 5
10 16 23 32 44 55 67 79 87 92
(NA) Not available due to a lapse in federal funding in October 2013.
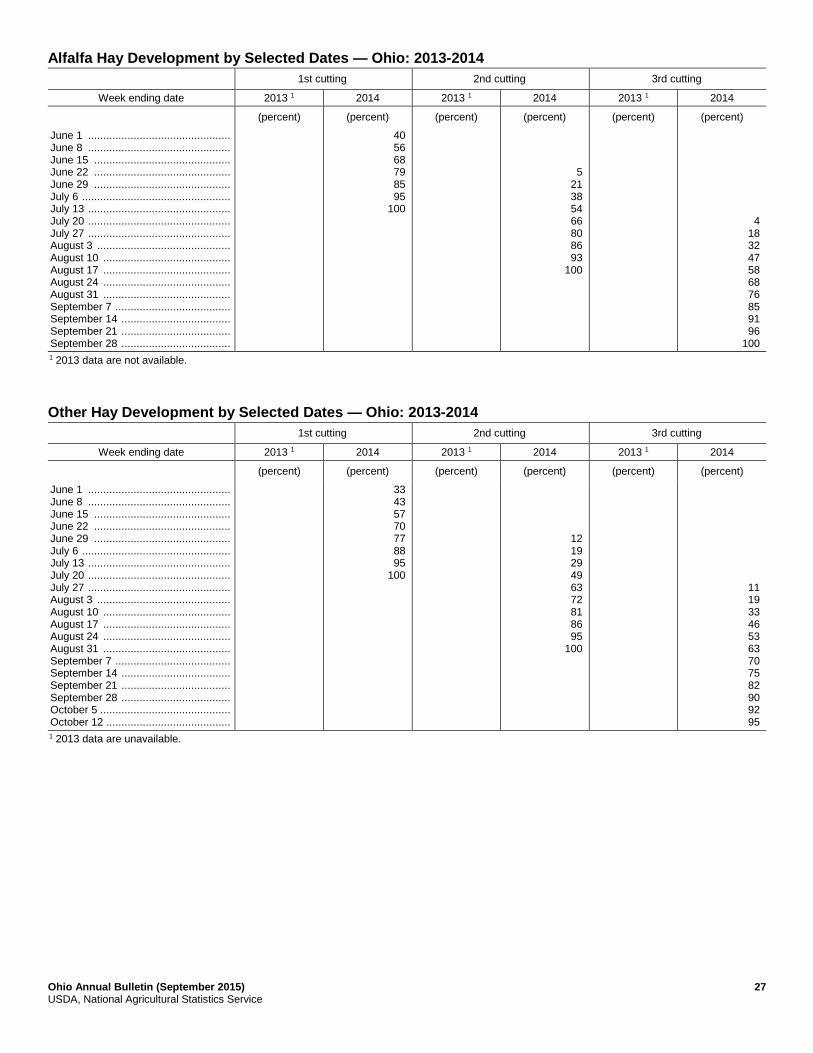
Ohio Annual Bulletin (September 2015) 27 USDA, National Agricultural Statistics Service
Alfalfa Hay Development by Selected Dates — Ohio: 2013-2014
1st cutting 2nd cutting 3rd cutting
Week ending date 2013 1 2014 2013 1 2014 2013 1 2014
(percent) (percent) (percent) (percent) (percent) (percent)
June 1 ............................................... June 8 ............................................... June 15 ............................................. June 22 ............................................. June 29 ............................................. July 6 ................................................. July 13 ............................................... July 20 ............................................... July 27 ............................................... August 3 ............................................ August 10 .......................................... August 17 .......................................... August 24 .......................................... August 31 .......................................... September 7 ...................................... September 14 .................................... September 21 .................................... September 28 ....................................
40 56 68 79 85 95
100
5 21 38 54 66 80 86 93
100
4 18 32 47 58 68 76 85 91 96
100
1 2013 data are not available.
Other Hay Development by Selected Dates — Ohio: 2013-2014
1st cutting 2nd cutting 3rd cutting
Week ending date 2013 1 2014 2013 1 2014 2013 1 2014
(percent) (percent) (percent) (percent) (percent) (percent)
June 1 ............................................... June 8 ............................................... June 15 ............................................. June 22 ............................................. June 29 ............................................. July 6 ................................................. July 13 ............................................... July 20 ............................................... July 27 ............................................... August 3 ............................................ August 10 .......................................... August 17 .......................................... August 24 .......................................... August 31 .......................................... September 7 ...................................... September 14 .................................... September 21 .................................... September 28 .................................... October 5 ........................................... October 12 .........................................
33 43 57 70 77 88 95
100
12 19 29 49 63 72 81 86 95
100
11 19 33 46 53 63 70 75 82 90 92 95
1 2013 data are unavailable.

28 Ohio Annual Bulletin (September 2015) USDA, National Agricultural Statistics Service
Vegetables
Cabbage for Fresh Market Area Planted and Harvested, Yield, Production, Price, and Value — Ohio: 2010-2014
Year Area
planted Area
harvested Yield
per acre Production
Price per cwt1
Value of production
(acres) (acres) (cwt) (1,000 cwt) (dollars) (1,000 dollars)
2010 ........................................... 2011 ........................................... 2012 ........................................... 2013 ........................................... 2014 ...........................................
1,300 1,100 1,000 1,300 1,500
1,200 1,000
900 1,300 1,400
280 355 369 335 350
336 355 332 436 490
25.60 15.70 14.90 16.00 13.00
8,602 5,574 4,947 6,976 6,370
1 Marketing year average price.
Cucumbers for Pickles Area Planted and Harvested, Yield, Production, Price, and Value — Ohio: 2010-2014
Year Area
planted Area
harvested Yield
per acre Production
Price per ton1
Value of production
(acres) (acres) (tons) (tons) (dollars) (1,000 dollars)
2010 ........................................... 2011 ........................................... 2012 ........................................... 2013 ........................................... 2014 ...........................................
2,100 2,600 7,100 8,000 7,500
2,000 2,600 7,000 7,000 6,500
10.78 6.89 4.47 7.50 6.30
21,560 17,910 31,290 52,500 40,950
450.00 490.00 320.00 325.00 300.00
9,702 8,776
10,013 17,063 12,285
1 Marketing year average price.
Bell Peppers for Fresh Market and Processing Area Planted and Harvested, Yield, Production, Price, and Value — Ohio: 2010-2014
Year Area
planted Area
harvested Yield
per acre Production
Price per cwt1
Value of production
(acres) (acres) (cwt) (1,000 cwt) (dollars) (1,000 dollars)
2010 ........................................... 2011 ........................................... 2012 ........................................... 2013 ........................................... 2014 ...........................................
2,100 1,900 1,900 2,900 2,800
1,900 1,800 1,800 2,700 2,600
245 325 185 180 175
466 585 333 486 455
24.00 41.40 40.00 43.00 38.00
11,184 24,219 13,320 20,898 17,290
1 Marketing year average price.
Pumpkins for Fresh Market and Processing Area Planted and Harvested, Yield, Production, Price, and Value — Ohio: 2010-2014
Year Area
planted Area
harvested Yield
per acre Production
Price per cwt1
Value of production
(acres) (acres) (cwt) (1,000 cwt) (dollars) (1,000 dollars)
2010 ........................................... 2011 ........................................... 2012 ........................................... 2013 ........................................... 2014 ...........................................
7,300 7,100 6,400 6,800 6,700
6,900 6,800 6,000 6,100 6,300
160 165 240 165 165
1,104 1,122 1,440 1,004 1,053
15.10 14.80 13.40 15.40 17.80
16,670 16,606 19,296 15,455 18,701
1 Marketing year average price.

Ohio Annual Bulletin (September 2015) 29 USDA, National Agricultural Statistics Service
Squash for Fresh Market and Processing Area Planted and Harvested, Yield, Production, Price, and Value — Ohio: 2010-2014
Year Area
planted Area
harvested Yield
per acre Production
Price per cwt1
Value of production
(acres) (acres) (cwt) (1,000 cwt) (dollars) (1,000 dollars)
2010 ........................................... 2011 ........................................... 2012 ........................................... 2013 ........................................... 2014 ...........................................
1,800 1,700 1,600 1,600 1,800
1,700 1,600 1,500 1,400 1,600
160 200 180 170 190
272 320 270 238 304
35.30 26.00 36.00 40.00 34.00
9,602 8,320 9,720 9,520
10,336
1 Marketing year average price.
Sweet Corn for Fresh Market Area Planted and Harvested, Yield, Production, Price, and Value — Ohio: 2010-2014
Year Area
planted Area
harvested Yield
per acre Production
Price per cwt1
Value of production
(acres) (acres) (cwt) (1,000 cwt) (dollars) (1,000 dollars)
2010 ........................................... 2011 ........................................... 2012 ........................................... 2013 ........................................... 2014 ...........................................
13,000 11,400 11,400 16,400 15,900
11,100 10,800 10,500 15,500 15,100
90 115 105 100 87
999 1,242 1,103 1,550 1,314
24.60 25.30 23.60 25.60 29.90
24,575 31,423 26,031 39,680 39,289
1 Marketing year average price.
Tomatoes for Fresh Market Area Planted and Harvested, Yield, Production, Price, and Value — Ohio: 2010-2014 [Cherry, grape, tomatillo, and greenhouse tomatoes are excluded]
Year Area
planted Area
harvested Yield
per acre Production
Price per cwt1
Value of production
(acres) (acres) (cwt) (1,000 cwt) (dollars) (1,000 dollars)
2010 ........................................... 2011 ........................................... 2012 ........................................... 2013 ........................................... 2014 ...........................................
3,000 3,000 2,700 3,600 3,700
2,900 2,700 2,500 3,400 3,600
270 235 170 175 265
783 635 425 595 954
36.90 49.20 61.40 75.00 36.60
28,893 31,242 26,095 44,625 34,916
1 Marketing year average price.
Tomatoes for Processing Area Planted and Harvested, Yield, Production, Price, and Value — Ohio: 2010-2014
Year Area
planted Area
harvested Yield
per acre Production
Price per ton1
Value of production
(acres) (acres) (tons) (tons) (dollars) (1,000 dollars)
2010 ........................................... 2011 ........................................... 2012 ........................................... 2013 ........................................... 2014 ...........................................
5,900 5,600 6,200 5,200 4,700
5,800 5,300 5,800 5,100 4,400
27.30 23.80 27.00 30.00 35.00
158,340 126,140 156,600 153,000 154,000
98.30 103.00 113.00 116.00 111.00
15,565 12,992 17,696 17,748 17,094
1 Marketing year average price.

30 Ohio Annual Bulletin (September 2015) USDA, National Agricultural Statistics Service
Fruit
Apple Acreage, Yield, Production, Price and Value — Ohio: 2010-2014
Year Bearing acreage
Yield per acre 1
Production Price per pound2
Value of utilized
production Total Utilized
(acres) (pounds) (million pounds) (million pounds) (dollars) (1,000 dollars)
2010 ...................... 2011 ...................... 2012 ...................... 2013 ...................... 2014 ......................
5,100 4,300 4,000 3,900 3,600
13,100 15,500 8,250
13,800 12,200
67.0 66.6 33.0 54.0 44.0
58.0 59.4 26.0 51.0 43.0
0.364 0.367 0.336 0.418 0.453
21,124 21,808 8,735
21,310 19,465
1 Yield is based on total production, which includes unharvested production and fruit harvested but not sold due to market conditions. 2 Marketing year average price.
Apple Production, Price and Value by Utilization — Ohio: 2010-2014
Year
Fresh Processed
Quantity Price per pound1
Value of production
Quantity Price per
ton1 Value of
production
(million pounds) (dollars) (1,000 dollars) (million pounds) (dollars) (1,000 dollars)
2010 ................. 2011 ................. 2012 ................. 2013 ................. 2014 .................
42.5 43.4 17.8 37.0 34.0
0.460 0.460 0.420 0.540 0.550
19,550 19,964 7,476
19,980 18,700
15.5 16.0 8.2
14.0 9.0
203 231 307 190 170
1,574 1,844 1,259 1,330
765
1 Marketing year average price.
Unutilized Apple Production — Ohio: 2010-2014
Year Production
Unharvested Harvested Not Sold
(million pounds) (million pounds)
2010 ..................................................... 2011 ..................................................... 2012 ..................................................... 2013 ..................................................... 2014 .....................................................
7.0 3.1 0.4 0.6 0.5
2.0 4.1 6.6 2.4 0.5
Strawberries for Fresh Market and Processing Area Planted and Harvested, Yield, Production, Price, and Value — Ohio: 2010-2014
Year Area
planted Area
harvested Yield
per acre Production
Price per cwt1
Value of production
(acres) (acres) (cwt) (1,000 cwt) (dollars) (1,000 dollars)
2010 ........................................... 2011 ........................................... 2012 ........................................... 2013 ........................................... 2014 ...........................................
1,100 1,100
700 660 620
730 730 600 590 480
48 36 42 49 38
35 26 25 29 18
272.00 210.00 168.00 209.00 193.00
9,520 5,460 4,200 6,061 3,474
1 Marketing year average price.
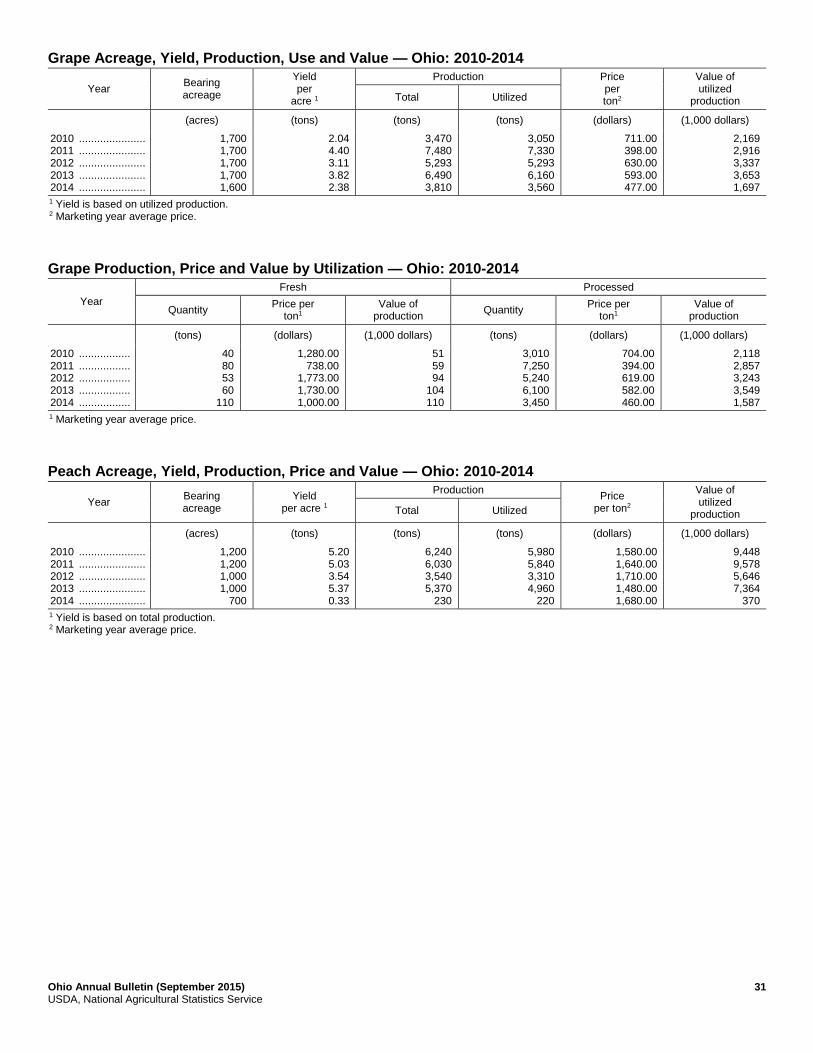
Ohio Annual Bulletin (September 2015) 31 USDA, National Agricultural Statistics Service
Grape Acreage, Yield, Production, Use and Value — Ohio: 2010-2014
Year Bearing acreage
Yield per
acre 1
Production Price per ton2
Value of utilized
production Total Utilized
(acres) (tons) (tons) (tons) (dollars) (1,000 dollars)
2010 ...................... 2011 ...................... 2012 ...................... 2013 ...................... 2014 ......................
1,700 1,700 1,700 1,700 1,600
2.04 4.40 3.11 3.82 2.38
3,470 7,480 5,293 6,490 3,810
3,050 7,330 5,293 6,160 3,560
711.00 398.00 630.00 593.00 477.00
2,169 2,916 3,337 3,653 1,697
1 Yield is based on utilized production. 2 Marketing year average price.
Grape Production, Price and Value by Utilization — Ohio: 2010-2014
Year
Fresh Processed
Quantity Price per
ton1 Value of
production Quantity
Price per ton1
Value of production
(tons) (dollars) (1,000 dollars) (tons) (dollars) (1,000 dollars)
2010 ................. 2011 ................. 2012 ................. 2013 ................. 2014 .................
40 80 53 60
110
1,280.00 738.00
1,773.00 1,730.00 1,000.00
51 59 94
104 110
3,010 7,250 5,240 6,100 3,450
704.00 394.00 619.00 582.00 460.00
2,118 2,857 3,243 3,549 1,587
1 Marketing year average price.
Peach Acreage, Yield, Production, Price and Value — Ohio: 2010-2014
Year Bearing acreage
Yield per acre 1
Production Price
per ton2
Value of utilized
production Total Utilized
(acres) (tons) (tons) (tons) (dollars) (1,000 dollars)
2010 ...................... 2011 ...................... 2012 ...................... 2013 ...................... 2014 ......................
1,200 1,200 1,000 1,000
700
5.20 5.03 3.54 5.37 0.33
6,240 6,030 3,540 5,370
230
5,980 5,840 3,310 4,960
220
1,580.00 1,640.00 1,710.00 1,480.00 1,680.00
9,448 9,578 5,646 7,364
370
1 Yield is based on total production. 2 Marketing year average price.
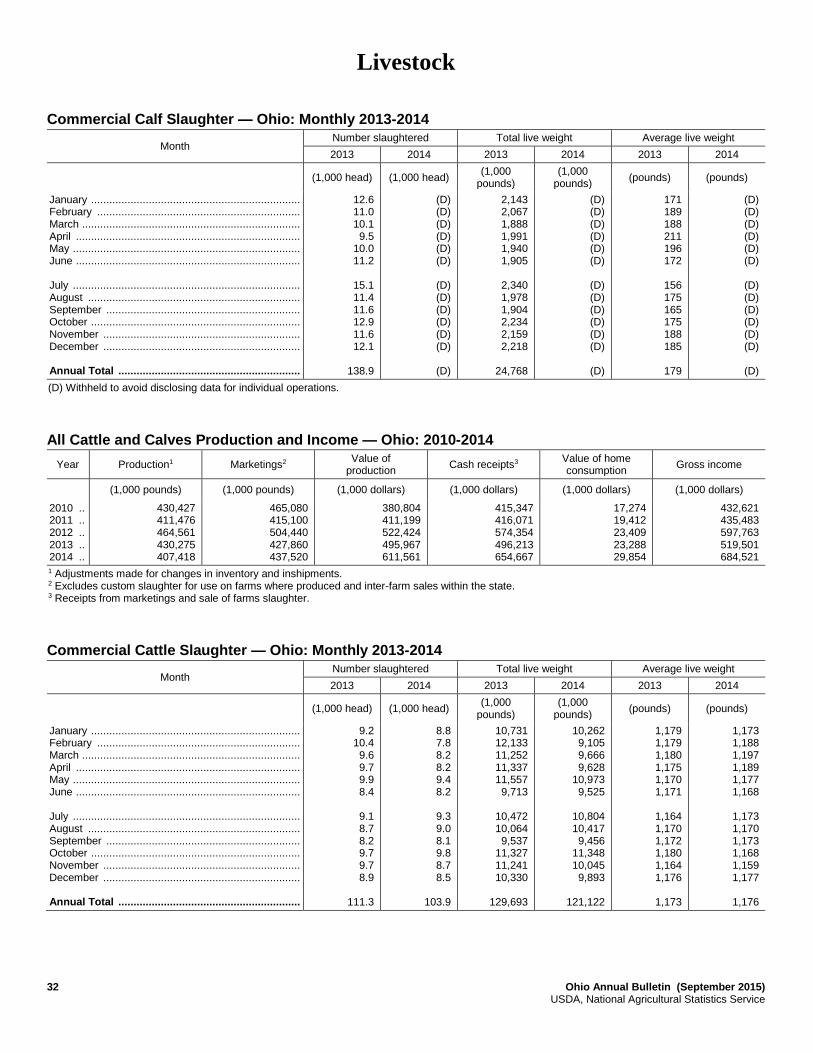
32 Ohio Annual Bulletin (September 2015) USDA, National Agricultural Statistics Service
Livestock
Commercial Calf Slaughter — Ohio: Monthly 2013-2014
Month Number slaughtered Total live weight Average live weight
2013 2014 2013 2014 2013 2014
(1,000 head) (1,000 head) (1,000
pounds) (1,000
pounds) (pounds) (pounds)
January ..................................................................... February ................................................................... March ........................................................................ April .......................................................................... May ........................................................................... June .......................................................................... July ........................................................................... August ...................................................................... September ................................................................ October ..................................................................... November ................................................................. December ................................................................. Annual Total ............................................................
12.6 11.0 10.1 9.5
10.0 11.2
15.1 11.4 11.6 12.9 11.6 12.1
138.9
(D) (D) (D) (D) (D) (D)
(D) (D) (D) (D) (D) (D)
(D)
2,143 2,067 1,888 1,991 1,940 1,905
2,340 1,978 1,904 2,234 2,159 2,218
24,768
(D) (D) (D) (D) (D) (D)
(D) (D) (D) (D) (D) (D)
(D)
171 189 188 211 196 172
156 175 165 175 188 185
179
(D) (D) (D) (D) (D) (D)
(D) (D) (D) (D) (D) (D)
(D)
(D) Withheld to avoid disclosing data for individual operations.
All Cattle and Calves Production and Income — Ohio: 2010-2014
Year Production1 Marketings2 Value of
production Cash receipts3
Value of home consumption
Gross income
(1,000 pounds) (1,000 pounds) (1,000 dollars) (1,000 dollars) (1,000 dollars) (1,000 dollars)
2010 .. 2011 .. 2012 .. 2013 .. 2014 ..
430,427 411,476 464,561 430,275 407,418
465,080 415,100 504,440 427,860 437,520
380,804 411,199 522,424 495,967 611,561
415,347 416,071 574,354 496,213 654,667
17,274 19,412 23,409 23,288 29,854
432,621 435,483 597,763 519,501 684,521
1 Adjustments made for changes in inventory and inshipments. 2 Excludes custom slaughter for use on farms where produced and inter-farm sales within the state. 3 Receipts from marketings and sale of farms slaughter.
Commercial Cattle Slaughter — Ohio: Monthly 2013-2014
Month Number slaughtered Total live weight Average live weight
2013 2014 2013 2014 2013 2014
(1,000 head) (1,000 head) (1,000
pounds) (1,000
pounds) (pounds) (pounds)
January ..................................................................... February ................................................................... March ........................................................................ April .......................................................................... May ........................................................................... June .......................................................................... July ........................................................................... August ...................................................................... September ................................................................ October ..................................................................... November ................................................................. December ................................................................. Annual Total ............................................................
9.2 10.4 9.6 9.7 9.9 8.4
9.1 8.7 8.2 9.7 9.7 8.9
111.3
8.8 7.8 8.2 8.2 9.4 8.2
9.3 9.0 8.1 9.8 8.7 8.5
103.9
10,731 12,133 11,252 11,337 11,557 9,713
10,472 10,064 9,537
11,327 11,241 10,330
129,693
10,262 9,105 9,666 9,628
10,973 9,525
10,804 10,417 9,456
11,348 10,045 9,893
121,122
1,179 1,179 1,180 1,175 1,170 1,171
1,164 1,170 1,172 1,180 1,164 1,176
1,173
1,173 1,188 1,197 1,189 1,177 1,168
1,173 1,170 1,173 1,168 1,159 1,177
1,176
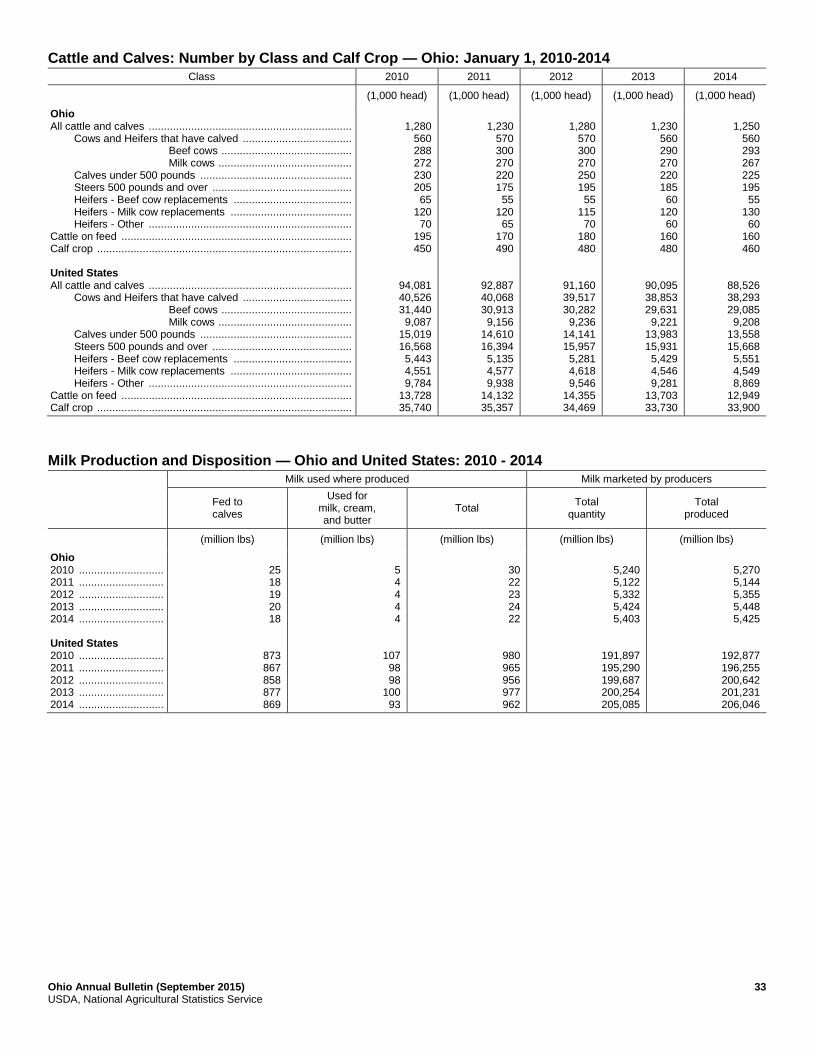
Ohio Annual Bulletin (September 2015) 33 USDA, National Agricultural Statistics Service
Cattle and Calves: Number by Class and Calf Crop — Ohio: January 1, 2010-2014
Class 2010 2011 2012 2013 2014
(1,000 head) (1,000 head) (1,000 head) (1,000 head) (1,000 head)
Ohio All cattle and calves ................................................................... Cows and Heifers that have calved .................................... Beef cows ........................................... Milk cows ............................................ Calves under 500 pounds .................................................. Steers 500 pounds and over .............................................. Heifers - Beef cow replacements ....................................... Heifers - Milk cow replacements ........................................ Heifers - Other ................................................................... Cattle on feed ............................................................................ Calf crop .................................................................................... United States All cattle and calves ................................................................... Cows and Heifers that have calved .................................... Beef cows ........................................... Milk cows ............................................ Calves under 500 pounds .................................................. Steers 500 pounds and over .............................................. Heifers - Beef cow replacements ....................................... Heifers - Milk cow replacements ........................................ Heifers - Other ................................................................... Cattle on feed ............................................................................ Calf crop ....................................................................................
1,280
560 288 272 230 205 65
120 70
195 450
94,081 40,526 31,440 9,087
15,019 16,568 5,443 4,551 9,784
13,728 35,740
1,230
570 300 270 220 175 55
120 65
170 490
92,887 40,068 30,913 9,156
14,610 16,394 5,135 4,577 9,938
14,132 35,357
1,280
570 300 270 250 195 55
115 70
180 480
91,160 39,517 30,282
9,236 14,141 15,957
5,281 4,618 9,546
14,355 34,469
1,230
560 290 270 220 185 60
120 60
160 480
90,095 38,853 29,631 9,221
13,983 15,931 5,429 4,546 9,281
13,703 33,730
1,250
560 293 267 225 195 55
130 60
160 460
88,526 38,293 29,085 9,208
13,558 15,668 5,551 4,549 8,869
12,949 33,900
Milk Production and Disposition — Ohio and United States: 2010 - 2014
Milk used where produced Milk marketed by producers
Fed to calves
Used for milk, cream, and butter
Total Total
quantity Total
produced
(million lbs) (million lbs) (million lbs) (million lbs) (million lbs)
Ohio 2010 ............................ 2011 ............................ 2012 ............................ 2013 ............................ 2014 ............................ United States 2010 ............................ 2011 ............................ 2012 ............................ 2013 ............................ 2014 ............................
25 18 19 20 18
873 867 858 877 869
5 4 4 4 4
107 98 98
100 93
30 22 23 24 22
980 965 956 977 962
5,240 5,122 5,332 5,424 5,403
191,897 195,290 199,687 200,254 205,085
5,270 5,144 5,355 5,448 5,425
192,877 196,255 200,642 201,231 206,046

34 Ohio Annual Bulletin (September 2015) USDA, National Agricultural Statistics Service
Milk Cows and Production by Month — Ohio: 2010-2014
Year and month Milk
cows1,3
Milk per
cow2,3
Milk production2
Milkfat Price per cwt
Year and month
Milk cows1,3
Milk per
cow2,3
Milk production2
Milkfat Price per cwt
(1,000 head)
(pounds) (million) (pounds)
(percent) (dollars) (1,000 head)
(pounds) (million) (pounds)
(percent) (dollars)
2010 January ..... February ... March ........ April .......... May ........... June .......... July ........... August ....... September October ..... November . December . Annual Total .. 2011 January ..... February ... March ........ April .......... May ........... June .......... July ........... August ....... September October ..... November . December . Annual Total .. 2012 January ..... February ... March ........ April .......... May ........... June .......... July ........... August ....... September October ..... November . December . Annual Total ..
272 272 272 272 271 270 270 270 270 270 270 270
271
270 271 269 268 268 266 266 267 268 268 269 270
268
270 270 270 271 271 270 269 269 270 270 270 270
270
1,600 1,490 1,690 1,680 1,765 1,660 1,640 1,610 1,560 1,600 1,560 1,610
19,446
1,625 1,500 1,660 1,620 1,680 1,575 1,580 1,590 1,550 1,600 1,560 1,625
19,194
1,655 1,610 1,740 1,730 1,735 1,630 1,595 1,620 1,540 1,650 1,610 1,710
19,833
435 405 460 457 478 448 443 435 421 432 421 435
5,270
439 407 447 434 450 419 420 425 415 429 420 439
5,144
447 435 470 469 470 440 429 436 416 446 435 462
5,355
3.87 3.86 3.77 3.68 3.63 3.56 3.54 3.55 3.65 3.80 3.90 3.98
3.73
3.94 3.88 3.83 3.79 3.70 3.62 3.56 3.56 3.66 3.77 3.81 3.85
3.75
3.83 3.78 3.74 3.68 3.61 3.58 3.53 3.56 3.65 3.82 3.89 3.90
3.72
17.70 17.70 16.60 15.90 16.40 16.80 17.20 18.00 19.20 20.10 19.80 18.60
17.80
18.40 20.40 22.10 21.60 21.50 22.40 23.10 23.40 22.90 21.50 21.60 21.10
21.70
20.50 19.10 18.50 18.00 17.00 16.60 17.20 18.60 20.20 22.20 23.10 22.40
19.40
2013 January .... February .. March ....... April ......... May .......... June ......... July .......... August ...... September October .... November December Annual Total . 2014 January .... February .. March ....... April ......... May .......... June ......... July .......... August ...... September October .... November December Annual Total .
271 271
271 271 270 269 268 267
270
267 266 266 267 266 266 266 266 267 267 267 268
267
1,725 1,590
1,650 1,680 1,575 1,650 1,600 1,680
20,178
1,700 1,545 1,730 1,720 1,800 1,720 1,745 1,720 1,650 1,685 1,620 1,710
20,318
467 431 481 473 489 458 447 455 425 444 429 449
5,448
454 411 460 459 479 458 464 458 441 450 433 458
5,425
3.92 3.91 3.92 3.84 3.72 3.71 3.68 3.71 3.78 3.88 3.98 3.98
3.84
3.96 3.93 3.87 3.76 3.68 3.64 3.63 3.67 3.70 3.81 3.92 3.91
3.79
21.20 20.90 20.30 20.50 20.60 20.80 20.70 21.20 21.30 21.60 22.40 22.80
21.20
24.10 25.20 25.70 25.80 24.80 23.70 23.90 24.90 26.30 25.20 23.60 21.80
24.60
1 Includes dry cows; excludes heifers not yet fresh. 2 Excludes milk sucked by calves. 3 Survey was not conducted in April and July, resulting in no milk cow and milk per cow data for March through June 2013. 2013 annual totals include
modeled data.
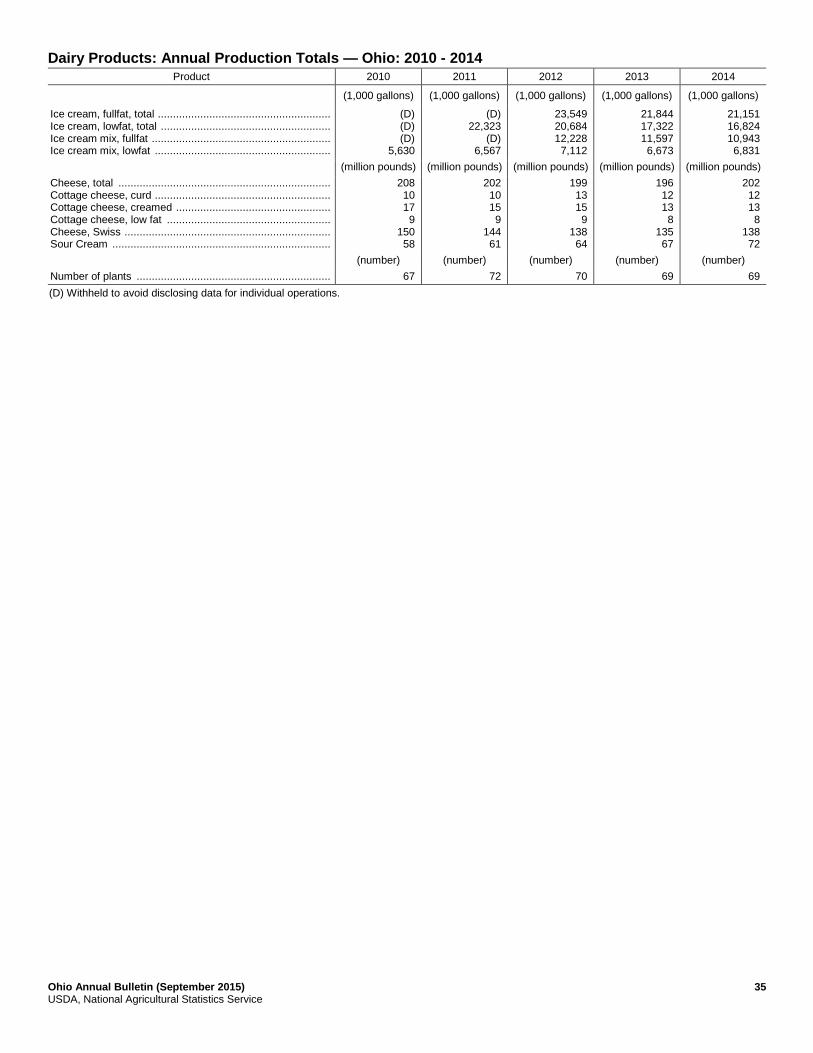
Ohio Annual Bulletin (September 2015) 35 USDA, National Agricultural Statistics Service
Dairy Products: Annual Production Totals — Ohio: 2010 - 2014
Product 2010 2011 2012 2013 2014
(1,000 gallons) (1,000 gallons) (1,000 gallons) (1,000 gallons) (1,000 gallons)
Ice cream, fullfat, total ......................................................... Ice cream, lowfat, total ........................................................ Ice cream mix, fullfat ........................................................... Ice cream mix, lowfat ..........................................................
(D) (D) (D)
5,630
(D) 22,323
(D) 6,567
23,549 20,684 12,228 7,112
21,844 17,322 11,597 6,673
21,151 16,824 10,943 6,831
(million pounds) (million pounds) (million pounds) (million pounds) (million pounds)
Cheese, total ...................................................................... Cottage cheese, curd .......................................................... Cottage cheese, creamed ................................................... Cottage cheese, low fat ...................................................... Cheese, Swiss .................................................................... Sour Cream ........................................................................
208 10 17 9
150 58
202 10 15 9
144 61
199 13 15 9
138 64
196 12 13 8
135 67
202 12 13 8
138 72
(number) (number) (number) (number) (number)
Number of plants ................................................................ 67 72 70 69 69
(D) Withheld to avoid disclosing data for individual operations.

36 Ohio Annual Bulletin (September 2015) USDA, National Agricultural Statistics Service
Honey: Number of Colonies, Yield, Production, Stocks, Price, and Value — Ohio: 2010-2014 [Producers with 5 or more colonies.]
Year Honey
producing colonies 1
Yield per
colony Production
Stocks December 15 2
Average price per pound 3
Value of
production 4
(1,000) (pounds) (1,000 pounds) (1,000 pounds) (cents) (1,000 dollars)
2010 ...................... 2011 ...................... 2012 ...................... 2013 ...................... 2014 ......................
18 15 18 17 15
62 66 60 45 61
1,116 990
1,080 765 915
346 228 410 390 256
228 234 246 329 352
2,544 2,317 2,657 2,517 3,221
1 Honey producing colonies are the maximum number of colonies from which honey was taken during the year. It is possible to take honey from colonies which did not survive the entire year.
2 Stocks held by producers. 3 Average price per pound based on expanded sales. 4 Value of production is equal to production multiplied by average price per pound.
Commercial Hog Slaughter — Ohio: Monthly 2013-2014
Month Number slaughtered Total live weight Average live weight
2013 2014 2013 2014 2013 2014
(1,000 head) (1,000 head) (1,000
pounds) (1,000
pounds) (pounds) (pounds)
January ..................................................................... February ................................................................... March ........................................................................ April .......................................................................... May ........................................................................... June .......................................................................... July ........................................................................... August ...................................................................... September ................................................................ October ..................................................................... November ................................................................. December ................................................................. Annual Total ............................................................
82.3 71.3 76.1 77.2 80.2 73.4
79.6 81.1 79.8 90.2 77.8 89.8
958.8
77.1 71.1 70.9 74.5 68.8 69.2
73.3 73.6 83.4 88.1 71.3 88.4
909.7
22,005 19,432 20,585 20,363 21,462 19,497
20,942 21,465 21,533 25,280 22,754 25,743
261,061
22,252 20,412 20,506 21,022 19,257 19,425
20,433 21,085 23,412 24,888 20,251 24,801
257,744
268 273 271 264 268 266
263 265 270 281 293 287
273
289 287 290 283 280 281
279 287 281 283 284 281
284
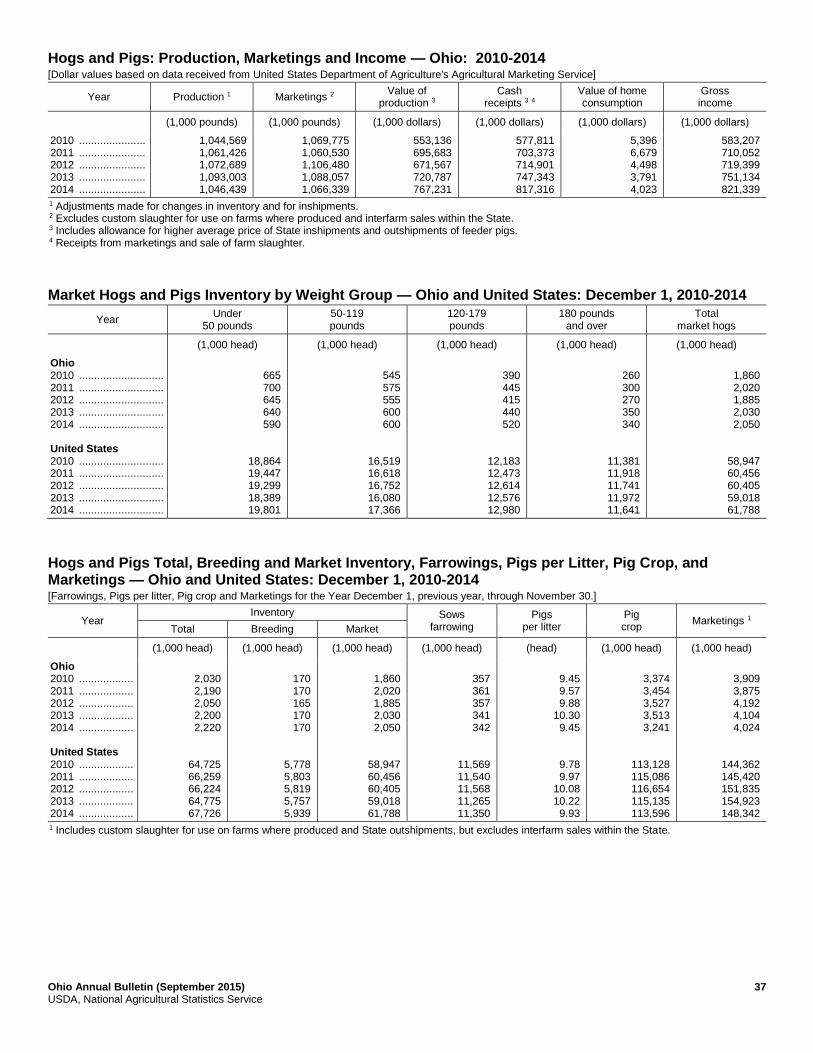
Ohio Annual Bulletin (September 2015) 37 USDA, National Agricultural Statistics Service
Hogs and Pigs: Production, Marketings and Income — Ohio: 2010-2014 [Dollar values based on data received from United States Department of Agriculture's Agricultural Marketing Service]
Year Production 1 Marketings 2 Value of
production 3 Cash
receipts 3 4 Value of home consumption
Gross income
(1,000 pounds) (1,000 pounds) (1,000 dollars) (1,000 dollars) (1,000 dollars) (1,000 dollars)
2010 ...................... 2011 ...................... 2012 ...................... 2013 ...................... 2014 ......................
1,044,569 1,061,426 1,072,689 1,093,003 1,046,439
1,069,775 1,060,530 1,106,480 1,088,057 1,066,339
553,136 695,683 671,567 720,787 767,231
577,811 703,373 714,901 747,343 817,316
5,396 6,679 4,498 3,791 4,023
583,207 710,052 719,399 751,134 821,339
1 Adjustments made for changes in inventory and for inshipments. 2 Excludes custom slaughter for use on farms where produced and interfarm sales within the State. 3 Includes allowance for higher average price of State inshipments and outshipments of feeder pigs. 4 Receipts from marketings and sale of farm slaughter.
Market Hogs and Pigs Inventory by Weight Group — Ohio and United States: December 1, 2010-2014
Year Under
50 pounds 50-119 pounds
120-179 pounds
180 pounds and over
Total market hogs
(1,000 head) (1,000 head) (1,000 head) (1,000 head) (1,000 head)
Ohio 2010 ............................ 2011 ............................ 2012 ............................ 2013 ............................ 2014 ............................ United States 2010 ............................ 2011 ............................ 2012 ............................ 2013 ............................ 2014 ............................
665 700 645 640 590
18,864 19,447 19,299 18,389 19,801
545 575 555 600 600
16,519 16,618 16,752 16,080 17,366
390 445 415 440 520
12,183 12,473 12,614 12,576 12,980
260 300 270 350 340
11,381 11,918 11,741 11,972 11,641
1,860 2,020 1,885 2,030 2,050
58,947 60,456 60,405 59,018 61,788
Hogs and Pigs Total, Breeding and Market Inventory, Farrowings, Pigs per Litter, Pig Crop, and Marketings — Ohio and United States: December 1, 2010-2014 [Farrowings, Pigs per litter, Pig crop and Marketings for the Year December 1, previous year, through November 30.]
Year Inventory Sows
farrowing Pigs
per litter Pig crop
Marketings 1 Total Breeding Market
(1,000 head) (1,000 head) (1,000 head) (1,000 head) (head) (1,000 head) (1,000 head)
Ohio 2010 .................. 2011 .................. 2012 .................. 2013 .................. 2014 .................. United States 2010 .................. 2011 .................. 2012 .................. 2013 .................. 2014 ..................
2,030 2,190 2,050 2,200 2,220
64,725 66,259 66,224 64,775 67,726
170 170 165 170 170
5,778 5,803 5,819 5,757 5,939
1,860 2,020 1,885 2,030 2,050
58,947 60,456 60,405 59,018 61,788
357 361 357 341 342
11,569 11,540 11,568 11,265 11,350
9.45 9.57 9.88
10.30 9.45
9.78 9.97
10.08 10.22 9.93
3,374 3,454 3,527 3,513 3,241
113,128 115,086 116,654 115,135 113,596
3,909 3,875 4,192 4,104 4,024
144,362 145,420 151,835 154,923 148,342
1 Includes custom slaughter for use on farms where produced and State outshipments, but excludes interfarm sales within the State.

38 Ohio Annual Bulletin (September 2015) USDA, National Agricultural Statistics Service
Commercial Sheep and Lamb Slaughter — Ohio: Monthly 2013-2014
Month Number slaughtered Total live weight Average live weight
2013 2014 2013 2014 2013 2014
(1,000 head) (1,000 head) (1,000
pounds) (1,000
pounds) (pounds) (pounds)
January ..................................................................... February ................................................................... March ........................................................................ April .......................................................................... May ........................................................................... June .......................................................................... July ........................................................................... August ...................................................................... September ................................................................ October ..................................................................... November ................................................................. December ................................................................. Annual Total ............................................................
0.9 0.9 1.5 1.4 1.6 1.3
1.9 1.3 1.5 2.3 1.4 1.4
17.6
1.0 0.8 0.7 1.5 1.5 1.6
2.1 1.5 0.9 1.6 1.7 1.2
16.2
96 95
157 145 168 140
196 140 157 240 151 146
1,830
105 81 75
161 158 166
224 162 92
165 172 116
1,677
106 104 102 102 104 106
102 105 104 106 106 103
104
105 106 104 104 103 105
105 106 104 103 101 100
104
Sheep and Lamb: Lamb Crop, Farm Slaughter and Death Loss — Ohio: 2010-2014
Year Ewes 1 year
and older January 1
Lambs per 100 ewes January 1
Lamb crop 1 Farm
slaughter 2
Deaths
Sheep Lambs
(1,000 head) (number) (1,000 head) (1,000 head) (1,000 head) (1,000 head)
2010 ...................... 2011 ...................... 2012 ...................... 2013 ...................... 2014 ......................
81 81 78 77 72
128 123 131 119 136
104 100 102 92 98
3.0 3.0 3.0 3.0 3.1
8 7 7 6 7
11 12 12 12 12
1 Lamb crop is defined as lambs born in the Eastern States and lambs docked or branded in the Western States. 2 Excludes custom slaughter for farmers at commercial establishments.
Market Sheep and Lamb Inventory by Weight Group — Ohio: January 1, 2010-2014
Year
Market lambs Market sheep
Total market
sheep and lambs
Under 65 pounds
65 - 84 pounds
85 - 105 pounds
Over 105 pounds
Total
(1,000 head) (1,000 head) (1,000 head) (1,000 head) (1,000 head) (1,000 head) (1,000 head)
2010 .................. 2011 .................. 2012 .................. 2013 .................. 2014 ..................
7 8 6 6 7
6 6 6 6 5
7 6 6 6 6
4 7 5 5 6
24 26 23 21 23
1 1 1 1 1
25 27 24 22 24

Ohio Annual Bulletin (September 2015) 39 USDA, National Agricultural Statistics Service
Sheep and Lamb Inventory by Class — Ohio and United States: January 1, 2010-2014
Year
Inventory
Breeding sheep Replacement lambs under one year old
Total breeding sheep and
lambs Market
Total sheep and
lambs Ewes Rams
(1,000 head) (1,000 head) (1,000 head) (1,000 head) (1,000 head) (1,000 head)
Ohio 2010 ...................... 2011 ...................... 2012 ...................... 2013 ...................... 2014 ...................... United States 2010 ...................... 2011 ...................... 2012 ...................... 2013 ...................... 2014 ......................
81 81 78 77 72
3,335 3,215 3,165 3,135 3,090
6 6 6 6 6
195 190 170 180 175
16 15 18 16 15
655 665 660 670 635
103 102 102 99 93
4,185 4,070 3,995 3,985 3,900
25 27 24 22 24
1,435 1,400 1,380 1,375 1,345
128 129 126 121 117
5,620 5,470 5,375 5,360 5,245
Wool Production, Price and Value — Ohio: 2010-2014
Year Sheep shorn Weight per
fleece Production
Price per pound
Value of production 1
(1,000 head) (pounds) (1000 pounds) (dollars) (1,000 dollars)
2010 ............................ 2011 ............................ 2012 ............................ 2013 ............................ 2014 ............................
100 97 93 80 83
6.3 6.0 6.0 6.1 5.9
625 585 560 490 490
0.28 0.56 0.60 0.69 0.59
175 328 336 338 289
1 Production multiplied by marketing year average price.
Turkey Production and Value — Ohio and United States: 2010-2014
Ohio United States
Year Production in head 1
Production in pounds
Value of production
Production in head 1
Production in pounds
Value of production
(1,000 head) (1,000 pounds) (1,000 Dollars) (1,000 head) (1,000 pounds) (1,000 dollars)
2010 ............... 2011 ............... 2012 ............... 2013 ............... 2014 ...............
4,600 5,000 5,500 5,700 5,100
191,820 201,000 217,250 233,130 209,100
118,928 137,082 156,637 155,031 153,689
244,188 248,500 253,500 240,000 237,500
7,108,222 7,313,205 7,561,905 7,277,536 7,217,056
4,372,438 4,987,608 5,452,135 4,839,562 5,304,537
1 Excludes young turkeys lost.

40 Ohio Annual Bulletin (September 2015) USDA, National Agricultural Statistics Service
Egg Production and Value — Ohio and United States: 2010 - 2014
Ohio1 United States
Eggs produced
Value of production
Eggs produced
Value of production
(1,000,000 eggs) (1,000 dollars) (1,000,000 eggs) (1,000 dollars)
2010 .................................... 2011 .................................... 2012 .................................... 2013 .................................... 2014 ....................................
7,540 7,607 7,688 8,171 8,731
427,361 486,185 523,315 587,562 744,317
91,811 92,450 94,364 97,555 99,768
6,553,087 7,355,873 7,929,104 8,678,859
10,166,321
1 Estimates cover the 12 month period Dec. 1, previous year through Nov. 30.
Chicken Disposition and Value — Ohio and United States: 2010-2014
Ohio1 United States
Lost2 Sold for
slaughter Pounds
sold Value of
sales Lost2
Sold for slaughter
Pounds sold
Value of sales
(1,000 head) (1,000 head) (1,000 lbs) (1,000 dollars) (1,000 head) (1,000 head) (1,000 lbs) (1,000 dollars)
2010 ............... 2011 ............... 2012 ............... 2013 ............... 2014 ...............
8,022 9,211 9,124 9,035
11,206
10,345 9,469
11,038 11,393 8,236
34,139 31,248 36,425 37,597 28,002
239 250 364 376 476
108,356 106,361 103,758 101,166 104,519
173,404 182,153 179,162 185,837 188,412
903,750 943,142 901,411 922,546 947,499
73,099 81,110 79,208 87,939 96,557
1 Marketing Year 2 Includes rendered, died, destroyed, composted or disappeared for any reason except sold during the 12 month period.
Chicken Inventory by Class— Ohio and United States: December 1, 2010-2014 [Excludes commercial broilers]
Year Layers Pullets Other
chickens Total
chickens1 Value
per head Total value
(1,000 head) (1,000 head) (1,000 head) (1,000 head) (dollars) (1,000 dollars)
Ohio 2010 ...................... 2011 ...................... 2012 ...................... 2013 ...................... 2014 ...................... United States 2010 ...................... 2011 ...................... 2012 ...................... 2013 ...................... 2014 ......................
28,297 28,355 28,820 29,977 31,542
342,782 343,283 354,977 361,403 366,045
8,759 7,582 7,455 7,975 7,584
107,025 104,159 105,140 106,646 106,602
40 41 29 42 40
7,390 6,922 6,827 6,853 6,403
37,096 35,978 36,304 37,994 39,166
457,197 454,364 466,944 474,902 479,050
2.00 2.30 2.00 2.80 3.80
3.58 3.79 4.04 4.15 4.10
74,192 82,749 72,608
106,383 148,831
1,637,016 1,721,671 1,885,904 1,971,590 1,962,126

Ohio Annual Bulletin (September 2015) 41 USDA, National Agricultural Statistics Service
Young Chickens, Number Slaughtered, Total Live Weight, and Average Live Weight — Ohio: Monthly 2013-2014
Month Number slaughtered Total live weight Average live weight
2013 2014 2013 2014 2013 2014
(1,000 head) (1,000 head) (1,000
pounds) (1,000
pounds) (pounds) (pounds)
January .................................................................... February ................................................................... March ....................................................................... April .......................................................................... May .......................................................................... June ......................................................................... July ........................................................................... August ...................................................................... September ................................................................ October .................................................................... November ................................................................. December ................................................................. Annual Total ............................................................
5,843 5,098 5,331 5,904 5,983 6,026
6,161 6,350 5,771 6,221 5,512 5,963
70,163
6,270 5,799 6,194 6,145 6,449 6,332
6,600 6,506 6,542 6,832 5,831 6,704
76,204
34,100 29,213 31,009 34,945 34,183 35,219
34,872 36,973 32,988 35,030 31,087 34,642
404,261
36,246 32,526 35,578 34,864 36,208 35,025
36,924 37,137 37,076 38,180 33,015 38,053
430,832
5.84 5.73 5.82 5.92 5.71 5.84
5.66 5.82 5.72 5.63 5.64 5.81
5.80
5.78 5.61 5.74 5.67 5.61 5.53
5.59 5.71 5.67 5.59 5.66 5.68
5.70
Broiler Production and Value — Ohio: 2010-2014
Ohio United States 1
Year Production
in head Production in pounds
Value of production
Production in head
Production in pounds
Value of production
(1,000 head) (1,000 pounds) (1,000 dollars) (1,000 head) (1,000 pounds) (1,000 dollars)
2010 ............... 2011 ............... 2012 ............... 2013 ............... 2014 ...............
60,000 59,600 63,200 69,800 75,600
376,800 375,500 379,200 404,800 430,900
181,618 172,355 189,600 245,714 274,483
8,623,600 8,607,600 8,463,000 8,533,800 8,544,100
49,152,600 50,082,400 49,655,600 50,678,200 51,373,100
23,691,553 22,987,822 24,827,800 30,761,669 32,724,667
1 Excludes states producing less than 500,000 broilers.

42 Ohio Annual Bulletin (September 2015) USDA, National Agricultural Statistics Service
Average Number of Layers on Hand and Eggs Produced by Months — Ohio: 2010 - 2014
Month Layers Eggs per 100 Layers Eggs Produced Month Layers Eggs per 100 Layers Eggs Produced
(1,000 layers) (number) (million eggs) (1,000 layers) (number) (million eggs)
2010 January ..... February ... March ........ April .......... May ........... June .......... July ........... August ....... September October ..... November . December . 2011 January ..... February ... March ........ April .......... May ........... June .......... July ........... August ....... September October ..... November . December . 2012 January ..... February ... March ........ April .......... May ........... June .......... July ........... August ....... September October ..... November . December .
27,329 27,532 28,119 27,880 27,738 27,984 28,279 28,262 28,131 28,265 28,331 28,550
28,363 27,477 27,316 27,447 27,346 27,504 27,551 27,705 27,999 27,740 27,880 28,359
28,384 28,200 28,188 28,249 28,133 27,896 27,491 27,338 27,361 27,974 28,691 28,785
2,294 2,041 2,272 2,217 2,264 2,166 2,263 2,303 2,225 2,300 2,270 2,378
2,316 2,089 2,372 2,266 2,296 2,225 2,301 2,292 2,232 2,343 2,306 2,373
2,315 2,131 2,320 2,230 2,293 2,208 2,292 2,323 2,233 2,345 2,370 2,449
627 562 639 618 628 606 640 651 626 650 643 679
657 574 648 622 628 612 634 635 625 650 643 673
657 601 654 630 645 616 630 635 611 656 680 705
2013 January .... February .. March ....... April ......... May .......... June ......... July .......... August ...... September October .... November December 2014 January .... February .. March ....... April ......... May .......... June ......... July .......... August ...... September October .... November December
28,810 29,069 29,179 28,987 29,070 29,242 29,202 29,208 29,280 29,500 29,831 29,752
29,599 29,800 30,085 30,717 31,053 30,981 31,145 30,903 30,974 31,197 31,278 31,062
2,381 2,102 2,320 2,253 2,363 2,281 2,305 2,352 2,360 2,464 2,370 2,481
2,473 2,211 2,463 2,315 2,328 2,298 2,459 2,433 2,254 2,391 2,407 2,450
686 611 677 653 687 667 673 687 691 727 707 738
732 659 741 711 723 712 766 752 698 746 753 761

Ohio Annual Bulletin (September 2015) 43 USDA, National Agricultural Statistics Service
Floriculture
Bedding Plants: Producers, Quantity Sold, Price, and Value — Ohio: 2010-2014
Item Producers Quantity
sold
Percent of sales at
wholesale
Wholesale price
Value of sales at
wholesale
(Number) (1,000 flats) (Percent) (Dollars) (1,000 dollars)
Begonias 2010 2011 2012 2013 2014 Geraniums from cuttings 2010 2011 2012 2013 2014 Geraniums from seed 2010 2011 2012 2013 2014 Impatiens 2010 2011 2012 2013 2014 Marigolds 2010 2011 2012 2013 2014 New Guinea Impatiens 2010 2011 2012 2013 2014 Pansies/Violas 2010 2011 2012 2013 2014 Petunias 2010 2011 2012 2013 2014 Other flowering and foliar 2010 2011 2012 2013 2014 Vegetables 1 2010 2011 2012 2013 2014
129 122 127 124 120
17 17 16 19 11
70 65 62 56 59
140 129 127 113 110
132 120 125 122 122
19 16 17 24 28
124 116 117 107 105
133 128 129 126 122
124 111 118 114 102
113 111 121 114 97
238 285 280 233 235
19 16 41 46 10
69 57 51 38 45
681 684 784 485 408
230 198 322 284 251
13 5 7
19 19
245 246 407 338 113
752 754 767 688 507
1,485 1,149 1,276
970 769
433 426 519 482 355
81 82 85 75 75
64 54 21 27 77
70 64 60 60 64
80 79 82 75 71
78 75 86 81 77
38 39 52 61 61
87 89 93 92 78
87 89 89 88 81
81 77 78 76 79
70 65 73 71 67
8.1
8.48 7.68 8.05 9.44
14.29 13.76 12.12 12.47 15.46
10.71 10.95 11.79 11.36 11.36
8.33 7.79 7.72 8.07 7.41
8.82 8.54 6.64 7.29 8.42
13.3
14.49 12.37 14.34 15.23
7.71 7.71 6.29 6.06 8.22
7.03 6.63 6.58 5.15 9.72
8.01 7.6
7.75 8.23 8.67
8.66 8.42 7.8
8.82 10.23
1,928 2,417 2,150 1,876 2,218
272 220 497 574 155
739 624 601 432 511
5,673 5,328 6,052 3,914 3,023
2,029 1,691 2,024 2,070 2,113
173 72 87
272 289
1,889 1,897 2,560 2,048
929
5,287 4,999 5,047 3,543 4,928
11,895 8,732 9,889 7,983 6,667
3,750 3,587 4,048 4,251 3,632
1 Does not include vegetable transplants grown for commercial use.

44 Ohio Annual Bulletin (September 2015) USDA, National Agricultural Statistics Service
Potted Flowering and Annual Bedding Plants: Producers, Quantity Sold, Price, and Value — Ohio: 2010-2014
Item Producers
Quantity sold Percent of sales at
wholesale
Wholesale price Value of sales at
wholesale
Less than 5 inch pots
5 inch pots or larger
Total Less than
5 inch pots
5 inch pots or larger
(Number) (1,000 pots) (1,000 pots) (1,000 pots) (Percent) (Dollars) (Dollars) (1,000 dollars)
Azaleas 2010 2011 2012 2013 2014 Begonias 2010 2011 2012 2013 2014 Chrysanthemums, florist 2010 2011 2012 2013 2014 Chrysanthemums, hardy garden 2010 2011 2012 2013 2014 Easter Lilies 2010 2011 2012 2013 2014 Geraniums from cuttings 2010 2011 2012 2013 2014 Geraniums from seed 2010 2011 2012 2013 2014 Impatiens 2010 2011 2012 2013 2014 Marigolds 2010 2011 2012 2013 2014 New Guinea Impatiens 2010 2011 2012 2013 2014
12 8
10 13 11
78 75 81 93 96
19 18 20 15 21
122 120 116 117 111
33 30 32 33 34
144 137 139 139 140
53 47 46 45 44
57 58 57 52 45
25 20 22 17 24
125 121 130 132 126
2
( 1 ) 1
( 1 ) ( 1 )
393 389 428 320 368
63 82 40 9
108
177 178 123 110 59
- - - -
472
1,689 1,703 1,493 1,398 1,378
1,768 2,013 1,888 1,720 1,290
399 411 387 373 430
239 ( 1 ) 348 348 367
577 578 538 506 406
17 12 8
11 6
255 295 258 231 236
63 81 85 20
( 1 )
3,859 3,862 3,707 3,452 1,467
520 506 538 518 ( 1 )
412 427 397 420 462
( 1 ) 199 220 ( 1 ) ( 1 )
306 262 253 251 229
124 359 ( 1 ) ( 1 ) ( 1 )
160 157 161 172 227
19 12 9
11 6
648 684 686 551 604
126 163 125 29
108
4,036 4,040 3,830 3,562 1,526
520 506 538 518 472
2,101 2,130 1,890 1,818 1,840
1,768 2,212 2,108 1,720 1,290
705 673 640 624 659
363 359 348 348 367
737 735 699 678 633
93 91 89 91 93
80 84 83 83 77
66 63 94 85 96
76 77 78 89 71
98 98 98 98 97
67 68 68 67 65
87 91 91 91 87
91 88 87 89 93
94 93 93 93 97
77 79 77 77 75
5.25 ( 1 )
5.48 ( 1 ) ( 1 )
1.37 1.36 1.47 1.48 1.66
2.64 2.67 2.72 2.84 4.33
1.19 1.28 1.57 1.83 1.84
- - - -
4.44
1.86 1.78 1.93 2.01 1.96
1.49
1 0.96 1.26 1.05
1.11 1.13 1.07 1.08 0.99
1.03 ( 1 )
1.54 1.51 1.42
2.05 2.05 2.16 2.16 2.26
9.57 8.66
10.67 10.73 9.93
3.04 3.17 3.08 2.57 3.01
4.67 4.1 4.07 5.36
( 1 )
3.05 2.99 3.02 3.03 3.08
4.1 4.17 4.13 4.14
( 1 )
4.02 4.38 4.7 5.21 5.78
( 1 ) 4.14 4.17
( 1 ) ( 1 )
2.59 2.42 2.47 2.31 2.57
2.52 1.67
( 1 ) ( 1 ) ( 1 )
4.04 3.89 3.98 3.72 3.88
173 104 91
118 60
1,314 1,464 1,424 1,067 1,321
461 551 455 133 467
11,981 11,775 11,388 10,661 4,627
2,132 2,110 2,222 2,145 2,097
4,798 4,902 4,747 4,998 5,371
2,634 2,837 2,730 2,172 1,348
1,235 1,098 1,039
983 1,014
559 600 535 525 521
1,829 1,796 1,803 1,733 1,798
See footnote(s) at end of table. --continued

Ohio Annual Bulletin (September 2015) 45 USDA, National Agricultural Statistics Service
Potted Flowering and Annual Bedding Plants: Producers, Quantity Sold, Price, and Value — Ohio: 2010-2014 (continued)
Item Producers
Quantity sold Percent of sales at
wholesale
Wholesale price Value of sales at
wholesale
Less than 5 inch pots
5 inch pots or larger
Total Less than
5 inch pots
5 inch pots or larger
(Number) (1,000 pots) (1,000 pots) (1,000 pots) (Percent) (Dollars) (Dollars) (1,000 dollars)
Pansies/Violas 2010 2011 2012 2013 2014 Petunias 2010 2011 2012 2013 2014 Poinsettias 2010 2011 2012 2013 2014 Flowering bulbs 2010 2011 2012 2013 2014 Other flowering plants 2010 2011 2012 2013 2014 Other flowering and foliar type bedding plants 2010 2011 2012 2013 2014 Vegetable type 2 2010 2011 2012 2013 2014
63 59 56 54 62
95 97 98
107 99
78 73 77 68 67
31 35 37 36 29
36 35 31 36 54
110 102 99
108 107
90 87 96 88 69
411 356 269 213 243
1,172 1,103
955 979
1,073
830 830 844 773 465
47 52 60 41 27
277 318 372 240 235
3,528 2,985 3,464 3,704 2,056
1,999 1,932 2,048 1,900 1,777
472 488 488 474 320
671 594 559 494 494
2,750 2,738 2,425 2,039 1,917
178 178 162 148 91
526 205 222 246 312
1,881 1,653 1,577 1,521
868
346 208 228 229 244
883 844 757 687 563
1,843 1,697 1,514 1,473 1,567
3,580 3,568 3,269 2,812 2,382
225 230 222 189 118
803 523 594 486 547
5,409 4,638 5,041 5,225 2,924
2,345 2,140 2,276 2,129 2,021
79 87 85 86 76
88 84 81 79 80
95 95 94 95 94
91 89 89 85 85
69 53 53 72 83
78 75 70 76 63
80 78 78 76 69
0.92 0.91 0.96 0.99 1.02
1.4
1.52 1.49 1.52 1.32
1.54 1.53 1.79 1.47 1.83
2.89 2.93 2.55 3.33 2.36
2.44 2.31 1.92 2.15 2.19
1.95 2.17 2.17 2.02 2.13
1.24 1.2 1.3
1.27 1.3
2.55 2.68 2.7
2.79 3.16
2.61 2.59 2.46 2.35 2.85
4.33 4.27 5.1
5.14 4.6
4.65 4.12 4.84 4.89 4.76
4.11 5.54 5.51 5.94 6.71
3.79 3.83 4.35 4.43 5.05
3.12 3.64 3.33 3.63 3.63
1,582 1,632 1,610 1,533 1,259
3,392 3,215 2,798 2,649 2,824
13,186 12,961 13,878 11,617 9,669
964 886 937 860 497
2,838 1,870 1,937 1,977 2,608
14,009 12,808 14,377 14,220 8,763
3,558 3,076 3,422 3,244 3,196
1 Pot sizes have been combined into category with greatest production to avoid disclosure of individual operations. 2 Does not include vegetable transplants grown for commercial use.

46 Ohio Annual Bulletin (September 2015) USDA, National Agricultural Statistics Service
County Estimates
County Estimates: Cash Rent Per Acre — Ohio: 2013 & 2014
District and
county
Rented for cash 1 2
Irrigated cropland Non-irrigated cropland Pastureland
2013 2014 2013 2014 2013 2014
(dollars per acre) (dollars per acre) (dollars per acre) (dollars per acre) (dollars per acre) (dollars per acre)
Allen ........................................ Defiance .................................. Fulton ....................................... Hancock ................................... Henry ....................................... Lucas ....................................... Paulding ................................... Putnam .................................... Van Wert .................................. Williams ................................... Wood ....................................... Northwest ............................... Ashland .................................... Crawford .................................. Erie .......................................... Huron ....................................... Lorain ....................................... Ottawa ..................................... Richland ................................... Sandusky ................................. Seneca .................................... Wyandot .................................. Other counties ......................... North Central .......................... Ashtabula ................................. Columbiana .............................. Geauga .................................... Mahoning ................................. Medina ..................................... Portage .................................... Stark ........................................ Trumbull ................................... Wayne ..................................... Other counties ......................... Northeast ................................ Auglaize ................................... Champaign .............................. Clark ........................................ Darke ....................................... Hardin ...................................... Logan ....................................... Mercer ..................................... Miami ....................................... Shelby ...................................... Other counties ......................... West Central ...........................
182.00 182.00
196.00 196.00
174.00 150.00 173.00 160.00 176.00 124.00 140.00 132.00 166.00 144.00 166.00 159.00
103.00 158.00 140.00 120.00 95.50
127.00 115.00 147.00 153.00 152.00
137.00
48.50 76.50
78.00 60.50 86.50 83.50 50.00 99.00 59.00 75.50
161.00 180.00 161.00 192.00 157.00 151.00 191.00 163.00 185.00
173.00
175.00 149.00 172.00 159.00 177.00 126.00 142.00 135.00 168.00 143.00 165.00 159.00
102.00 159.00 141.00 121.00 95.00
127.00 116.00 148.00 152.00 153.00
137.00
62.00 76.00 40.00 77.50 61.00 75.50 83.00 49.50 98.00 57.50 75.00
185.00 184.00 161.00 193.00 180.00 151.00 191.00 163.00 201.00
180.00
32.50
19.50
36.00
40.50 36.50
35.00
46.50 45.50
21.00
35.00
38.50 37.00
20.50 25.00 38.00 27.50
37.50
50.00 31.50 38.50
1 Counties with missing data are included in the appropriate district’s “Other Counties”. 2 Districts with missing totals are included in “Other Districts”.

Ohio Annual Bulletin (September 2015) 47 USDA, National Agricultural Statistics Service
County Estimates: Cash Rent Per Acre — Ohio: 2013 & 2014 (continued)
District and
county
Rented for cash 1 2
Irrigated cropland Non-irrigated cropland Pastureland
2013 2014 2013 2014 2013 2014
(dollars per acre) (dollars per acre) (dollars per acre) (dollars per acre) (dollars per acre) (dollars per acre)
Delaware ................................. Fairfield ................................... Fayette .................................... Franklin ................................... Knox ........................................ Licking ..................................... Madison ................................... Marion ..................................... Morrow .................................... Pickaway ................................. Ross ........................................ Union ....................................... Other counties ......................... Central .................................... Belmont ................................... Carroll ...................................... Coshocton ............................... Harrison ................................... Holmes .................................... Jefferson .................................. Tuscarawas ............................. Other counties ......................... East Central ........................... Butler ....................................... Clermont .................................. Clinton ..................................... Greene .................................... Montgomery ............................ Preble ...................................... Warren .................................... Other counties ......................... Southwest .............................. Adams ..................................... Brown ...................................... Gallia ....................................... Highland .................................. Jackson ................................... Lawrence ................................. Pike ......................................... Scioto ...................................... Other counties ......................... South Central ......................... Athens ..................................... Guernsey ................................. Hocking ................................... Meigs ....................................... Monroe .................................... Morgan .................................... Muskingum .............................. Noble ....................................... Perry ........................................ Washington ............................. Other counties ......................... Southeast ............................... Other districts .......................... Ohio ........................................
143.00
150.00
125.00 125.00
118.00 118.00
163.00
165.00
130.00 141.00 176.00 126.00 103.00 112.00 180.00 145.00 120.00 152.00 127.00 149.00
144.00
52.50 81.00 31.50
108.00
62.50 35.50 79.00
121.00
141.00 164.00 146.00 172.00 97.50 87.50
139.00
84.50 112.00 57.00
129.00 47.00 37.50
110.00 55.50
108.00
40.00 90.00 71.00 24.50 49.50 69.50 24.50 83.00 59.00 51.00 62.00
61.00
139.00
135.00 141.00 176.00 143.00 107.00 113.00 192.00 165.00 139.00 165.00 147.00 170.00
156.00
36.50 55.50 82.00 34.50
111.00 34.00 65.50
78.50
121.00
151.00 168.00 153.00 172.00 108.00 95.50
147.00
86.50 111.00
125.00
37.00
114.00 68.50 54.50
108.00
53.00 42.00 93.00
24.00 40.00 73.50 28.50 82.50 58.50 59.50 63.00
60.50
144.00
32.50 32.00
34.00 33.50
13.50 18.50 18.50
27.50
28.50 12.50 17.50
21.50 18.50 32.50 56.50
38.00 36.00 32.50 36.00
22.50
24.00
31.00
30.00 26.50
13.00 7.30
7.90 18.50 13.00 10.50
20.00 11.50
61.00
25.00
42.00
36.00 31.50
25.50
43.50 37.00
14.00 18.00 18.00 17.00 32.00 15.00 28.00
17.00
36.50
38.00 59.00
44.00 35.50 33.50 41.00
25.00
24.00 25.00
25.00
24.50 24.50
6.30
23.50 7.70
17.00 13.50 11.00 31.00 16.00 15.50 11.00
60.50
25.00
1 Counties with missing data are included in the appropriate district's "Other Counties". 2 Districts with missing totals are included in "Other Districts".

48 Ohio Annual Bulletin (September 2015) USDA, National Agricultural Statistics Service
County Estimates: Corn Harvested for Grain — Ohio: 2013 & 2014
District and
county
Acres1 Harvested yield
Production Planted Harvested
2013 2014 2013 2014 2013 2014 2013 2014
(acres) (acres) (acres) (acres) (bushels) (bushels) (bushels) (bushels)
Allen .................................... Defiance .............................. Fulton ................................... Hancock ............................... Henry ................................... Lucas ................................... Paulding ............................... Putnam ................................ Van Wert .............................. Williams ............................... Wood ................................... Northwest ........................... Ashland ................................ Crawford .............................. Erie ...................................... Huron ................................... Lorain ................................... Ottawa ................................. Richland ............................... Sandusky ............................. Seneca ................................ Wyandot .............................. North Central ...................... Ashtabula ............................. Columbiana .......................... Geauga ................................ Mahoning ............................. Medina ................................. Portage ................................ Stark .................................... Trumbull ............................... Wayne ................................. Other counties ..................... Northeast ............................ Auglaize ............................... Champaign .......................... Clark .................................... Darke ................................... Hardin .................................. Logan ................................... Mercer ................................. Miami ................................... Shelby .................................. West Central .......................
75,000 56,500 84,000 96,000 79,000 25,500 66,000 84,000 85,000 58,000
111,000 820,000
43,500 80,000 31,500 75,000 30,500 27,500 44,000 77,000
100,000 81,000
590,000
26,500 28,500
16,500 21,500 15,500 34,500 23,500 67,000 6,500
240,000
75,000 92,000 67,000
138,000 102,000 75,000
110,000 75,000 81,000
815,000
68,000 56,000 83,000 91,000 84,000 24,000 68,000 83,000 81,000 56,000
106,000 800,000
37,000 80,000 30,000 61,000 22,000 23,000 43,000 69,000 95,000 80,000
540,000
20,900 27,000 3,500
16,000 19,000 15,200
22,400 64,000 32,000
220,000
75,000 88,000 64,000
139,000 98,000 72,000
109,000 73,000 77,000
795,000
74,000 54,000 80,500 94,500 77,000 25,000 59,000 80,000 80,000 54,000
107,000 785,000
40,000 79,000 31,200 73,000 28,500 27,300 40,000 76,000 99,500 80,500
575,000
24,000 24,500
14,500 19,800 14,000 30,000 22,000 51,000 5,200
205,000
72,000 91,000 63,500
131,000 101,000 73,500 97,500 73,500 77,000
780,000
67,000 52,500 77,000 90,000 82,000 23,900 61,000 78,500 76,500 50,600
101,000 760,000
30,500 78,500 29,500 57,500 19,600 22,800 36,400 67,700 93,500 79,000
515,000
17,700 21,500 2,700
11,800 15,800 12,800
19,700 43,300 24,700
170,000
71,000 86,000 60,500
130,000 95,000 69,000 97,000 71,000 70,500
750,000
184 163 189 178 183 174 172 189 185 170 172 179
159 181 174 181 141 159 168 170 165 174 170
135 171
163 141 138 155 175 162 140 156
171 192 187 173 172 171 173 182 173 177
179 184 183 193 191 180 192 196 192 172 182 187
147 183 159 155 160 161 168 184 168 171 169
150 163 123 149 158 152
159 165 134 155
178 181 195 184 168 165 194 179 174 180
13,600,000 8,800,000
15,200,000 16,800,000 14,100,000 4,350,000
10,150,000 15,100,000 14,800,000 9,200,000
18,400,000 140,500,000
6,360,000
14,300,000 5,430,000
13,200,000 4,030,000 4,330,000 6,700,000
12,950,000 16,400,000 14,000,000 97,700,000
3,250,000 4,180,000
2,370,000 2,790,000 1,930,000 4,650,000 3,850,000 8,250,000
730,000 32,000,000
12,300,000 17,500,000 11,900,000 22,700,000 17,400,000 12,600,000 16,900,000 13,400,000 13,300,000
138,000,000
12,000,000 9,660,000
14,100,000 17,400,000 15,650,000 4,300,000
11,700,000 15,400,000 14,700,000 8,690,000
18,400,000 142,000,000
4,480,000
14,400,000 4,700,000 8,910,000 3,140,000 3,660,000 6,110,000
12,450,000 15,750,000 13,500,000 87,100,000
2,650,000 3,510,000
331,000 1,760,000 2,490,000 1,950,000
3,140,000 7,150,000 3,319,000
26,300,000
12,650,000 15,550,000 11,800,000 23,900,000 15,950,000 11,400,000 18,800,000 12,700,000 12,250,000
135,000,000
1 Counties with missing data are included in the appropriate district's "Other Counties".

Ohio Annual Bulletin (September 2015) 49 USDA, National Agricultural Statistics Service
County Estimates: Corn Harvested for Grain — Ohio: 2013 & 2014 (continued)
District and
county
Acres1 Harvested yield
Production Planted Harvested
2013 2014 2013 2014 2013 2014 2013 2014
(acres) (acres) (acres) (acres) (bushels) (bushels) (bushels) (bushels)
Delaware .............................. Fairfield ................................ Fayette ................................. Franklin ................................ Knox ..................................... Licking .................................. Madison ................................ Marion .................................. Morrow ................................. Pickaway .............................. Ross ..................................... Union .................................... Central ................................. Belmont ................................ Carroll ................................... Coshocton ............................ Harrison ................................ Holmes ................................. Jefferson ............................... Tuscarawas .......................... East Central ........................ Butler .................................... Clermont ............................... Clinton .................................. Greene ................................. Hamilton ............................... Montgomery ......................... Preble ................................... Warren ................................. Other counties ...................... Southwest ........................... Adams .................................. Brown ................................... Gallia .................................... Highland ............................... Jackson ................................ Lawrence .............................. Pike ...................................... Scioto ................................... South Central ...................... Athens .................................. Guernsey .............................. Hocking ................................ Meigs .................................... Monroe ................................. Morgan ................................. Muskingum ........................... Noble .................................... Perry ..................................... Vinton ................................... Washington .......................... Other counties ...................... Southeast ............................ Ohio .....................................
53,000 64,000 93,000 19,500 56,500 64,000
108,000 72,000 54,000
102,000 50,000 64,000
800,000
500 10,500 28,500 5,000
23,500 2,500
24,500 95,000
31,000
77,000 63,000
39,000 84,000 25,300 20,700
340,000
17,500 28,000 3,700
50,000 3,800 1,700
12,200 8,100
125,000
2,700 4,000 3,500 3,300
4,100
22,000 1,100
20,500
10,600 3,200
75,000
3,900,000
42,000 62,000 84,000 16,000 52,000 63,000
110,000 62,000 48,000 95,000 53,000 58,000
745,000
600 9,800
30,000 4,200
24,000 1,900
24,500 95,000
29,000 16,000 70,000 61,000 4,000
35,000 81,000 24,000
320,000
15,500 26,000 3,500
46,000 3,100 1,400
11,500 8,000
115,000
2,800 3,500 3,400 3,100
900 4,100
19,200 900
19,600 2,300
10,200
70,000
3,700,000
52,000 62,000 90,000 19,300 55,200 62,000
105,000 70,500 53,000
100,000 49,000 62,000
780,000
300 8,400
26,500 4,900
17,000 2,200
20,700 80,000
30,000
76,000 62,000
38,500 83,500 25,000 20,000
335,000
16,500 27,000 3,400
49,000 3,300 1,200
11,800 7,800
120,000
2,400 3,500 3,400 2,900
3,300
21,000 1,000
20,000
9,700 2,800
70,000
3,730,000
40,700 59,000 82,000 15,800 49,500 59,500
107,000 58,500 46,500 93,000 50,000 55,500
717,000
200 7,100
26,300 3,600
14,000 1,400
18,400 71,000
27,400 15,600 69,000 60,500 3,800
34,200 80,000 23,500
314,000
14,100 25,100 3,100
45,000 2,800 1,100
11,200 7,600
110,000
2,400 2,700 3,300 2,700
500 3,200
17,500 800
19,100 2,200 8,600
63,000
3,470,000
179 176 178 176 166 163 190 175 165 174 171 181 175
130 127 151 150 148 135 150 147
168
186 177
184 185 176 169 181
156 173 153 184 147 163 170 158 173
152 140 152 145
136 169 137 162
154 151 158
174
154 178 185 173 156 154 171 172 154 180 173 164 170
130 123 167 151 154 153 155 156
176 180 200 191 197 187 186 185
189
143 171 146 178 138 135 166 153 167
160 167 170 152 146 160 157 156 158 148 176
160
176
9,300,000 10,900,000 16,000,000 3,400,000 9,150,000
10,100,000 19,900,000 12,300,000 8,750,000
17,400,000 8,400,000
11,200,000 136,800,000
39,000
1,070,000 4,000,000
735,000 2,510,000
296,000 3,100,000
11,750,000
5,030,000
14,150,000 11,000,000
7,100,000
15,450,000 4,400,000 3,370,000
60,500,000
2,570,000 4,660,000
520,000 9,030,000
485,000 195,000
2,010,000 1,230,000
20,700,000
365,000 490,000 515,000 420,000
450,000
3,550,000 137,000
3,230,000
1,490,000 423,000
11,070,000
649,020,000
6,280,000 10,500,000 15,200,000 2,730,000 7,730,000 9,140,000
18,250,000 10,050,000 7,150,000
16,700,000 8,670,000 9,100,000
121,500,000
26,000 875,000
4,380,000 545,000
2,160,000 214,000
2,850,000 11,050,000
4,810,000 2,800,000
13,800,000 11,550,000
750,000 6,400,000
14,900,000 4,340,000
59,350,000
2,020,000 4,300,000
452,000 8,000,000
385,000 148,000
1,855,000 1,160,000
18,320,000
385,000 450,000 560,000 410,000 73,000
512,000 2,740,000
125,000 3,010,000
325,000 1,510,000
10,100,000
610,720,000
1 Counties with missing data are included in the appropriate district's "Other Counties".

50 Ohio Annual Bulletin (September 2015) USDA, National Agricultural Statistics Service
County Estimates: Soybeans Harvested for Beans — Ohio: 2013 & 2014
District and
county
Acres1 Harvested yield
Production Planted Harvested
2013 2014 2013 2014 2013 2014 2013 2014
(acres) (acres) (acres) (acres) (bushels) (bushels) (bushels) (bushels)
Allen .................................... Defiance .............................. Fulton ................................... Hancock ............................... Henry ................................... Lucas ................................... Paulding ............................... Putnam ................................ Van Wert .............................. Williams ............................... Wood ................................... Northwest ........................... Ashland ................................ Crawford .............................. Erie ...................................... Huron ................................... Lorain ................................... Ottawa ................................. Richland ............................... Sandusky ............................. Seneca ................................ Wyandot .............................. North Central ...................... Ashtabula ............................. Columbiana .......................... Geauga ................................ Medina ................................. Portage ................................ Stark .................................... Summit ................................ Trumbull ............................... Wayne ................................. Other counties ..................... Northeast ............................ Auglaize ............................... Champaign .......................... Clark .................................... Darke ................................... Hardin .................................. Logan ................................... Mercer ................................. Miami ................................... Shelby .................................. West Central .......................
84,900 95,500 81,500
129,500 96,400 26,200
114,500 133,000 117,000 76,000
134,500 1,089,000
39,800 92,800 32,600 88,700 50,600 56,300 44,200 86,700
122,000 97,300
711,000
29,200 21,600 4,000
28,700 17,900 24,300 1,900
27,000 42,000 14,400
211,000
89,800 81,400 61,000
136,500 112,000 86,300 98,200 79,800 89,000
834,000
87,600 100,500 86,100
134,000 101,500 29,300
113,000 134,000 122,000 85,500
150,500 1,144,000
44,000 96,500 36,800
106,000 55,000 67,400 45,300 96,000
133,000 103,000 783,000
36,100 20,800 4,000
31,300 19,900 27,900
28,900 44,900 18,700
232,500
93,500 93,400 68,200
145,500 116,500 89,600
102,000 82,800 94,500
886,000
84,900 95,300 81,400
129,400 96,300 26,200
114,500 132,600 117,000 76,000
134,400 1,088,000
39,500 92,800 32,600 88,700 50,400 56,300 44,100 86,700
121,900 97,000
710,000
29,000 21,500 4,000
28,600 17,600 24,300 1,800
26,900 41,900 14,400
210,000
89,800 80,200 61,000
136,400 112,000 86,200 98,100 79,600 88,700
832,000
87,500 100,400 86,000
133,900 101,400 29,300
112,900 133,900 121,900 85,400
150,400 1,143,000
43,900 96,400 36,700
105,900 54,900 66,700 45,200 95,900
132,500 102,900 781,000
36,000 20,700 3,970
31,200 19,800 27,700
28,800 44,800 18,530
231,500
93,400 93,300 68,100
145,300 116,400 89,500
101,900 82,700 94,400
885,000
46.3 40.6 52.7 46.0 49.6 47.2 46.2 48.2 55.0 45.5 48.7 48.0
47.0 53.7 50.7 53.0 43.7 50.3 50.0 50.3 50.0 48.5 50.1
43.6 50.4 43.3 45.2 44.3 47.3 36.7 48.6 50.0 43.4 46.8
47.8 51.8 51.6 50.7 47.2 46.9 51.1 50.5 47.5 49.4
54.9 51.1 51.1 54.2 50.4 50.7 55.7 52.9 61.2 46.1 53.5 53.4
44.7 54.6 49.0 45.5 46.9 50.8 53.3 52.5 49.2 50.8 49.9
43.3 50.1 46.3 46.0 43.2 43.2
44.7 53.3 44.3 46.5
58.9 54.6 56.7 57.1 53.1 50.4 62.2 54.6 56.8 56.1
3,934,000 3,869,000 4,292,000 5,949,000 4,780,000 1,236,000 5,290,000 6,397,000 6,440,000 3,456,000 6,547,000
52,190,000
1,856,000 4,979,000 1,652,000 4,697,000 2,204,000 2,831,000 2,205,000 4,359,000 6,096,000 4,700,000
35,579,000
1,263,000 1,083,000
173,000 1,294,000
780,000 1,149,000
66,000 1,308,000 2,093,000
625,000 9,834,000
4,293,000 4,154,000 3,148,000 6,913,000 5,288,000 4,044,000 5,012,000 4,017,000 4,210,000
41,079,000
4,802,000 5,131,000 4,392,000 7,256,000 5,109,000 1,486,000 6,289,000 7,079,000 7,462,000 3,936,000 8,040,000
60,982,000
1,964,000 5,268,000 1,798,000 4,815,000 2,574,000 3,389,000 2,407,000 5,038,000 6,518,000 5,226,000
38,997,000
1,557,000 1,037,000
184,000 1,435,000
855,000 1,197,000
1,288,000 2,390,000
821,000 10,764,000
5,503,000 5,098,000 3,860,000 8,303,000 6,186,000 4,514,000 6,336,000 4,518,000 5,366,000
49,684,000
1 Counties with missing data are included in the appropriate district's "Other Counties".
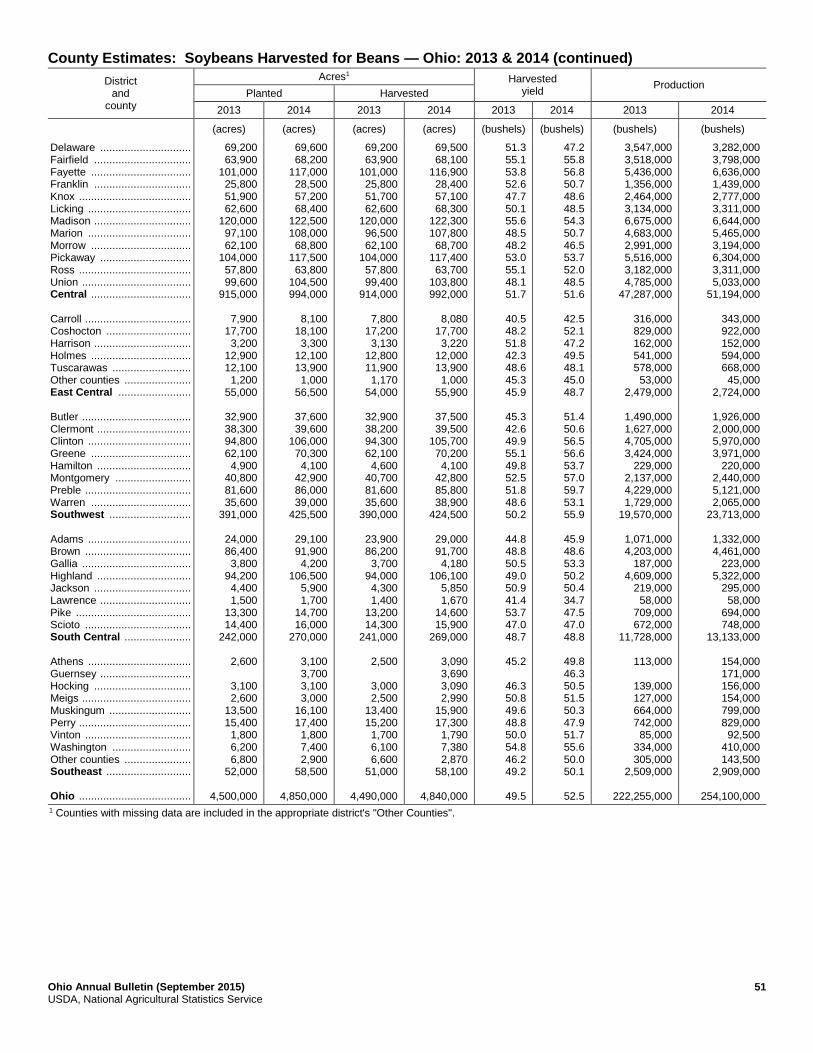
Ohio Annual Bulletin (September 2015) 51 USDA, National Agricultural Statistics Service
County Estimates: Soybeans Harvested for Beans — Ohio: 2013 & 2014 (continued)
District and
county
Acres1 Harvested yield
Production Planted Harvested
2013 2014 2013 2014 2013 2014 2013 2014
(acres) (acres) (acres) (acres) (bushels) (bushels) (bushels) (bushels)
Delaware .............................. Fairfield ................................ Fayette ................................. Franklin ................................ Knox ..................................... Licking .................................. Madison ................................ Marion .................................. Morrow ................................. Pickaway .............................. Ross ..................................... Union .................................... Central ................................. Carroll ................................... Coshocton ............................ Harrison ................................ Holmes ................................. Tuscarawas .......................... Other counties ...................... East Central ........................ Butler .................................... Clermont ............................... Clinton .................................. Greene ................................. Hamilton ............................... Montgomery ......................... Preble ................................... Warren ................................. Southwest ........................... Adams .................................. Brown ................................... Gallia .................................... Highland ............................... Jackson ................................ Lawrence .............................. Pike ...................................... Scioto ................................... South Central ...................... Athens .................................. Guernsey .............................. Hocking ................................ Meigs .................................... Muskingum ........................... Perry ..................................... Vinton ................................... Washington .......................... Other counties ...................... Southeast ............................ Ohio .....................................
69,200 63,900
101,000 25,800 51,900 62,600
120,000 97,100 62,100
104,000 57,800 99,600
915,000
7,900 17,700 3,200
12,900 12,100 1,200
55,000
32,900 38,300 94,800 62,100 4,900
40,800 81,600 35,600
391,000
24,000 86,400 3,800
94,200 4,400 1,500
13,300 14,400
242,000
2,600
3,100 2,600
13,500 15,400 1,800 6,200 6,800
52,000
4,500,000
69,600 68,200
117,000 28,500 57,200 68,400
122,500 108,000 68,800
117,500 63,800
104,500 994,000
8,100
18,100 3,300
12,100 13,900 1,000
56,500
37,600 39,600
106,000 70,300 4,100
42,900 86,000 39,000
425,500
29,100 91,900 4,200
106,500 5,900 1,700
14,700 16,000
270,000
3,100 3,700 3,100 3,000
16,100 17,400 1,800 7,400 2,900
58,500
4,850,000
69,200 63,900
101,000 25,800 51,700 62,600
120,000 96,500 62,100
104,000 57,800 99,400
914,000
7,800 17,200 3,130
12,800 11,900 1,170
54,000
32,900 38,200 94,300 62,100 4,600
40,700 81,600 35,600
390,000
23,900 86,200 3,700
94,000 4,300 1,400
13,200 14,300
241,000
2,500
3,000 2,500
13,400 15,200 1,700 6,100 6,600
51,000
4,490,000
69,500 68,100
116,900 28,400 57,100 68,300
122,300 107,800 68,700
117,400 63,700
103,800 992,000
8,080
17,700 3,220
12,000 13,900 1,000
55,900
37,500 39,500
105,700 70,200 4,100
42,800 85,800 38,900
424,500
29,000 91,700 4,180
106,100 5,850 1,670
14,600 15,900
269,000
3,090 3,690 3,090 2,990
15,900 17,300 1,790 7,380 2,870
58,100
4,840,000
51.3 55.1 53.8 52.6 47.7 50.1 55.6 48.5 48.2 53.0 55.1 48.1 51.7
40.5 48.2 51.8 42.3 48.6 45.3 45.9
45.3 42.6 49.9 55.1 49.8 52.5 51.8 48.6 50.2
44.8 48.8 50.5 49.0 50.9 41.4 53.7 47.0 48.7
45.2
46.3 50.8 49.6 48.8 50.0 54.8 46.2 49.2
49.5
47.2 55.8 56.8 50.7 48.6 48.5 54.3 50.7 46.5 53.7 52.0 48.5 51.6
42.5 52.1 47.2 49.5 48.1 45.0 48.7
51.4 50.6 56.5 56.6 53.7 57.0 59.7 53.1 55.9
45.9 48.6 53.3 50.2 50.4 34.7 47.5 47.0 48.8
49.8 46.3 50.5 51.5 50.3 47.9 51.7 55.6 50.0 50.1
52.5
3,547,000 3,518,000 5,436,000 1,356,000 2,464,000 3,134,000 6,675,000 4,683,000 2,991,000 5,516,000 3,182,000 4,785,000
47,287,000
316,000 829,000 162,000 541,000 578,000 53,000
2,479,000
1,490,000 1,627,000 4,705,000 3,424,000
229,000 2,137,000 4,229,000 1,729,000
19,570,000
1,071,000 4,203,000
187,000 4,609,000
219,000 58,000
709,000 672,000
11,728,000
113,000
139,000 127,000 664,000 742,000 85,000
334,000 305,000
2,509,000
222,255,000
3,282,000 3,798,000 6,636,000 1,439,000 2,777,000 3,311,000 6,644,000 5,465,000 3,194,000 6,304,000 3,311,000 5,033,000
51,194,000
343,000 922,000 152,000 594,000 668,000 45,000
2,724,000
1,926,000 2,000,000 5,970,000 3,971,000
220,000 2,440,000 5,121,000 2,065,000
23,713,000
1,332,000 4,461,000
223,000 5,322,000
295,000 58,000
694,000 748,000
13,133,000
154,000 171,000 156,000 154,000 799,000 829,000 92,500
410,000 143,500
2,909,000
254,100,000
1 Counties with missing data are included in the appropriate district's "Other Counties".
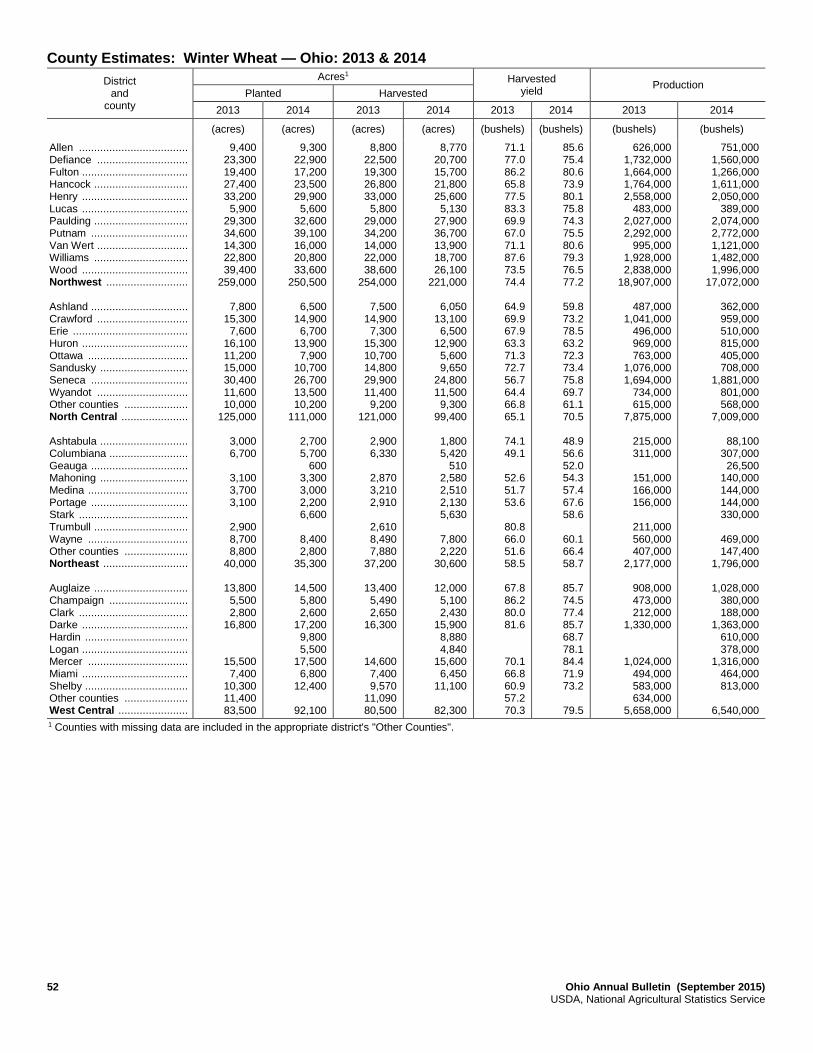
52 Ohio Annual Bulletin (September 2015) USDA, National Agricultural Statistics Service
County Estimates: Winter Wheat — Ohio: 2013 & 2014
District and
county
Acres1 Harvested yield
Production Planted Harvested
2013 2014 2013 2014 2013 2014 2013 2014
(acres) (acres) (acres) (acres) (bushels) (bushels) (bushels) (bushels)
Allen .................................... Defiance .............................. Fulton ................................... Hancock ............................... Henry ................................... Lucas ................................... Paulding ............................... Putnam ................................ Van Wert .............................. Williams ............................... Wood ................................... Northwest ........................... Ashland ................................ Crawford .............................. Erie ...................................... Huron ................................... Ottawa ................................. Sandusky ............................. Seneca ................................ Wyandot .............................. Other counties ..................... North Central ...................... Ashtabula ............................. Columbiana .......................... Geauga ................................ Mahoning ............................. Medina ................................. Portage ................................ Stark .................................... Trumbull ............................... Wayne ................................. Other counties ..................... Northeast ............................ Auglaize ............................... Champaign .......................... Clark .................................... Darke ................................... Hardin .................................. Logan ................................... Mercer ................................. Miami ................................... Shelby .................................. Other counties ..................... West Central .......................
9,400 23,300 19,400 27,400 33,200 5,900
29,300 34,600 14,300 22,800 39,400
259,000
7,800 15,300 7,600
16,100 11,200 15,000 30,400 11,600 10,000
125,000
3,000 6,700
3,100 3,700 3,100
2,900 8,700 8,800
40,000
13,800 5,500 2,800
16,800
15,500 7,400
10,300 11,400 83,500
9,300 22,900 17,200 23,500 29,900 5,600
32,600 39,100 16,000 20,800 33,600
250,500
6,500 14,900 6,700
13,900 7,900
10,700 26,700 13,500 10,200
111,000
2,700 5,700
600 3,300 3,000 2,200 6,600
8,400 2,800
35,300
14,500 5,800 2,600
17,200 9,800 5,500
17,500 6,800
12,400
92,100
8,800 22,500 19,300 26,800 33,000 5,800
29,000 34,200 14,000 22,000 38,600
254,000
7,500 14,900 7,300
15,300 10,700 14,800 29,900 11,400 9,200
121,000
2,900 6,330
2,870 3,210 2,910
2,610 8,490 7,880
37,200
13,400 5,490 2,650
16,300
14,600 7,400 9,570
11,090 80,500
8,770 20,700 15,700 21,800 25,600 5,130
27,900 36,700 13,900 18,700 26,100
221,000
6,050 13,100 6,500
12,900 5,600 9,650
24,800 11,500 9,300
99,400
1,800 5,420
510 2,580 2,510 2,130 5,630
7,800 2,220
30,600
12,000 5,100 2,430
15,900 8,880 4,840
15,600 6,450
11,100
82,300
71.1 77.0 86.2 65.8 77.5 83.3 69.9 67.0 71.1 87.6 73.5 74.4
64.9 69.9 67.9 63.3 71.3 72.7 56.7 64.4 66.8 65.1
74.1 49.1
52.6 51.7 53.6
80.8 66.0 51.6 58.5
67.8 86.2 80.0 81.6
70.1 66.8 60.9 57.2 70.3
85.6 75.4 80.6 73.9 80.1 75.8 74.3 75.5 80.6 79.3 76.5 77.2
59.8 73.2 78.5 63.2 72.3 73.4 75.8 69.7 61.1 70.5
48.9 56.6 52.0 54.3 57.4 67.6 58.6
60.1 66.4 58.7
85.7 74.5 77.4 85.7 68.7 78.1 84.4 71.9 73.2
79.5
626,000 1,732,000 1,664,000 1,764,000 2,558,000
483,000 2,027,000 2,292,000
995,000 1,928,000 2,838,000
18,907,000
487,000 1,041,000
496,000 969,000 763,000
1,076,000 1,694,000
734,000 615,000
7,875,000
215,000 311,000
151,000 166,000 156,000
211,000 560,000 407,000
2,177,000
908,000 473,000 212,000
1,330,000
1,024,000 494,000 583,000 634,000
5,658,000
751,000 1,560,000 1,266,000 1,611,000 2,050,000
389,000 2,074,000 2,772,000 1,121,000 1,482,000 1,996,000
17,072,000
362,000 959,000 510,000 815,000 405,000 708,000
1,881,000 801,000 568,000
7,009,000
88,100 307,000 26,500
140,000 144,000 144,000 330,000
469,000 147,400
1,796,000
1,028,000 380,000 188,000
1,363,000 610,000 378,000
1,316,000 464,000 813,000
6,540,000
1 Counties with missing data are included in the appropriate district's "Other Counties".

Ohio Annual Bulletin (September 2015) 53 USDA, National Agricultural Statistics Service
County Estimates: Winter Wheat — Ohio: 2013 & 2014 (continued)
District and
county
Acres1 Harvested yield
Production Planted Harvested
2013 2014 2013 2014 2013 2014 2013 2014
(acres) (acres) (acres) (acres) (bushels) (bushels) (bushels) (bushels)
Delaware .............................. Fairfield ................................ Fayette ................................. Franklin ................................ Knox ..................................... Licking .................................. Madison ................................ Marion .................................. Pickaway .............................. Ross ..................................... Union .................................... Other counties ...................... Central ................................. Carroll ................................... Coshocton ............................ Holmes ................................. Tuscarawas .......................... Other counties ...................... East Central ........................ Butler .................................... Clermont ............................... Clinton .................................. Greene ................................. Montgomery ......................... Preble ................................... Warren ................................. Other counties ...................... Southwest ........................... Adams .................................. Brown ................................... Highland ............................... Jackson ................................ Pike ...................................... Scioto ................................... Other counties ...................... South Central ...................... Athens .................................. Hocking ................................ Muskingum ........................... Perry ..................................... Washington .......................... Other counties ...................... Southeast ............................ Ohio .....................................
5,000 8,400 7,700 2,800 4,100 6,900 8,900
13,900
34,400 92,100
1,100 2,200 1,900
3,600 8,800
1,300 5,400
2,500 6,200 2,900 8,300
26,600
3,000
8,000 900
1,200 1,100 3,700
17,900
700 500
1,600 1,700 1,200 1,400 7,100
660,000
4,200 7,400 5,200
4,000 5,600 7,300 7,500
10,200 8,100 9,800
10,600 79,900
700
1,900
2,700 3,300 8,600
3,600
5,000 4,100
5,400 2,500 4,300
24,900
1,800 6,200
800 600 700
2,400 12,500
1,300 1,200 1,200 1,500 5,200
620,000
4,930 8,310 7,630 2,760 4,020 6,760 8,850
13,800
33,240 90,300
1,040 2,170 1,820
3,270 8,300
1,200 5,290
2,490 5,900 2,900 8,220
26,000
2,270
7,970 860
1,200 1,050 3,250
16,600
600 470
1,450 1,600 1,020
960 6,100
640,000
3,930 7,000 5,050
3,700 5,160 7,000 6,680 9,600 6,850 8,530
10,000 73,500
580
1,450
1,800 2,170 6,000
3,000
3,200 3,610
4,790 2,210 3,590
20,400
1,200 4,130
540 400 410 720
7,400
1,200 1,080
920 1,200 4,400
545,000
67.3 75.3 87.4 75.7 59.7 58.4 82.7
77.5
57.4 68.4
43.6 69.1 57.1
51.9 56.5
65.8 86.8
75.1 76.4 82.1 72.5 77.3
64.8
74.7 66.3 72.8 49.9 69.3 70.1
57.8 56.2 54.1 74.4 48.3 57.5 59.5
70.0
59.3 70.0 83.8
58.4 62.6 76.7 74.0 80.0 70.7 64.2 76.7 71.9
39.7 65.2
63.9 59.2 60.2
65.7
69.7 73.7
83.3 74.7 76.6 74.8
55.2 72.2 68.7 82.0 61.7 55.0 67.4
64.2 45.8 50.2 60.3 55.7
74.0
332,000 626,000 667,000 209,000 240,000 395,000 732,000
1,069,000
1,907,000 6,177,000
45,300
150,000 104,000
169,700 469,000
79,000 459,000
187,000 451,000 238,000 596,000
2,010,000
147,000
595,000 57,000 87,300 52,400
225,300 1,164,000
34,700 26,400 78,400
119,000 49,300 55,200
363,000
44,800,000
233,000 490,000 423,000
216,000 323,000 537,000 494,000 768,000 484,000 548,000 767,000
5,283,000
23,000 94,500
115,000 128,500 361,000
197,000
223,000 266,000
399,000 165,000 275,000
1,525,000
66,200 298,000 37,100 32,800 25,300 39,600
499,000
77,000 49,500 46,200 72,300
245,000
40,330,000
1 Counties with missing data are included in the appropriate district's "Other Counties".

54 Ohio Annual Bulletin (September 2015) USDA, National Agricultural Statistics Service
County Estimates: Alfalfa and Alfalfa Mixtures for Hay, All Cropping Practices — Ohio: 2013 & 2014
District and
county
Acres harvested1 Harvested yield Production
2013 2014 2013 2014 2013 2014
(acres) (acres) (tons) (tons) (tons) (tons)
Allen ........................................... Defiance ..................................... Fulton .......................................... Hancock ...................................... Henry .......................................... Lucas .......................................... Paulding ...................................... Van Wert ..................................... Wood .......................................... Other counties ............................ Northwest .................................. Ashland ....................................... Crawford ..................................... Erie ............................................. Huron .......................................... Lorain .......................................... Ottawa ........................................ Sandusky .................................... Seneca ....................................... Wyandot ..................................... Other counties ............................ North Central ............................. Geauga ....................................... Mahoning .................................... Medina ........................................ Portage ....................................... Summit ....................................... Wayne ........................................ Other counties ............................ Northeast ................................... Auglaize ...................................... Champaign ................................. Clark ........................................... Hardin ......................................... Logan .......................................... Mercer ........................................ Shelby ......................................... Other counties ............................ West Central ..............................
1,800 2,600 1,170 1,690 3,150 1,500 1,520
850 2,190 6,330
22,800
2,080 1,420 3,010 3,640 2,990 5,670 2,500 1,470
16,020 38,800
1,850
11,100 38,850 51,800
3,330
2,300
28,570 34,200
2,050 2,380 1,320 2,020 2,690
1,260
770 3,350 8,660
24,500
7,070 2,010 1,410 2,660
3,950 4,860
1,720
12,920 36,600
3,090 2,140 4,160 3,370 1,040
11,500 25,500 50,800
3,800 3,830 2,420 3,750 6,130 3,160 3,420 9,590
36,100
3.40 3.05 4.55 3.55 4.45 6.25 3.35 3.30 4.85 3.85 4.00
3.75 3.95 3.20 4.30 4.60 3.85 3.50 4.20 3.65 3.80
3.85
4.55 3.55 3.75
4.30
3.20
3.85 3.85
5.85 5.45 3.65 3.35 4.00
2.55 4.70 4.30 4.50 4.40
3.45 3.80 4.45 2.90
4.20 4.30
4.25 3.25 3.65
3.15 3.00 3.60 3.05 3.05 4.10 3.40 3.50
5.35 3.60 4.15 5.00 3.60 6.40 4.95 3.85 4.40
6,100 7,900 5,300 6,000
14,000 9,400 5,100 2,800
10,600 24,400 91,600
7,800 5,600 9,600
15,700 13,700 21,700 8,800 6,200
58,100 147,200
7,100
50,700 137,400 195,200
14,400
7,400
109,700 131,500
12,000 13,000 4,800 6,800
10,700
3,200 3,600
14,400 38,800
107,300
24,300 7,600 6,300 7,700
16,500 20,900
7,300
42,200 132,800
9,800 6,400
15,000 10,300 3,170
47,000 87,330
179,000
20,400 13,800 10,100 18,700 22,000 20,200 17,000 36,800
159,000
1 Counties with missing data are included in the appropriate district's "Other Counties".

Ohio Annual Bulletin (September 2015) 55 USDA, National Agricultural Statistics Service
County Estimates: Alfalfa & Alfalfa Mixtures for Hay, All Cropping Practices — Ohio: 2013 & 2014 (continued)
District and
county
Acres harvested1 Harvested yield Production
2013 2014 2013 2014 2013 2014
(acres) (acres) (tons) (tons) (tons) (tons)
Delaware .................................... Franklin ...................................... Madison ...................................... Pickaway .................................... Other counties ............................ Central ....................................... Belmont ...................................... Holmes ....................................... Jefferson ..................................... Tuscarawas ................................ Other counties ............................ East Central .............................. Butler .......................................... Clermont ..................................... Clinton ........................................ Greene ....................................... Hamilton ..................................... Warren ....................................... Other counties ............................ Southwest ................................. Highland ..................................... Lawrence .................................... Pike ............................................ Other counties ............................ South Central ............................ Athens ........................................ Meigs .......................................... Monroe ....................................... Morgan ....................................... Muskingum ................................. Noble .......................................... Vinton ......................................... Washington ................................ Other counties ............................ Southeast .................................. Ohio ...........................................
2,430 950
2,450 1,990
37,480 45,300
7,350
12,300 7,800 6,570
24,680 58,700
3,520 1,370
1,600 1,190
8,820
16,500
4,350
1,570 14,280 20,200
2,160 4,040
3,830
31,670 41,700
330,000
1,620 1,000 2,250 2,390
35,540 42,800
11,900 6,370
36,430 54,700
2,760
1,000 1,710
560 2,560 6,210
14,800
860
16,540 17,400
1,350 1,920 3,610 3,960 4,590 2,660 1,180 4,090 8,940
32,300
310,000
4.50 4.20 4.55 4.15 3.45 3.60
1.95 2.90 3.35 2.70 3.35 3.00
4.60 2.55
4.65 2.05
3.50 3.65
3.55
4.80 3.15 3.35
2.35 2.85
2.40
3.00 2.90
3.50
2.95 4.10 4.10 2.80 3.60 3.55
2.70 2.70
3.00 2.90
3.10
4.00 3.45 4.10 2.85 3.15 3.20
1.85
2.85 2.80
2.75 2.95 3.30 3.00 3.65 1.90 1.80 3.90 2.95 3.05
3.50
10,900 4,010
11,100 8,300
128,890 163,200
14,400 35,600 26,100 17,900 82,700
176,700
16,200 3,510
7,400 2,440
31,050 60,600
15,400
7,500
45,000 67,900
5,100 11,600
9,100
95,300 121,100
1,155,000
4,800 4,100 9,200 6,700
127,200 152,000
32,300 17,200
109,900 159,400
8,600
4,000 5,900 2,300 7,300
19,600 47,700
1,600
46,900 48,500
3,700 5,700
11,900 11,900 16,700 5,100 2,100
15,900 26,300 99,300
1,085,000
1 Counties with missing data are included in the appropriate district's "Other Counties".

56 Ohio Annual Bulletin (September 2015) USDA, National Agricultural Statistics Service
County Estimates: Other Hay, All Cropping Practices — Ohio: 2013 & 2014
District and
county
Acres harvested1 Harvested yield Production
2013 2014 2013 2014 2013 2014
(acres) (acres) (tons) (tons) (tons) (tons)
Allen ........................................... Other counties ............................ Northwest .................................. Crawford ..................................... Erie ............................................. Huron .......................................... Sandusky .................................... Other counties ............................ North Central ............................. Ashtabula .................................... Geauga ....................................... Lake ............................................ Medina ........................................ Portage ....................................... Summit ....................................... Trumbull ...................................... Other counties ............................ Northeast ................................... Miami .......................................... Other counties ............................ West Central ..............................
1,370 19,130 20,500
1,410
27,190 28,600
7,380 1,850 5,160
8,750 59,660 82,800
32,800 32,800
1,180 17,720 18,900
1,780
760 1,790
710 22,960 28,000
11,600
1,810 7,890 6,820 1,900 9,400
43,880 83,300
1,950
25,250 27,200
3.80 2.10 2.20
3.30
1.90 1.95
2.70 2.05 2.45
2.35 2.20 2.25
2.20 2.20
2.7 2.2 2.2
2.7 3.3 4.0 2.8 2.5 2.6
2.5
1.8 3.1 2.5 1.6 2.7 3.1 2.9
2.9 2.9 2.9
5,200 40,300 45,500
4,650
51,750 56,400
20,000 3,810
12,700
20,600 130,490 187,600
(D)
71,900 71,900
3,200 38,600 41,800
4,700 2,500 7,100 2,000
56,100 72,400
28,500
3,300
24,400 17,100 2,900
25,400 136,300 237,900
5,700
73,600 79,300
(D) Withheld to avoid disclosing data for individual operations. 1 Counties with missing data are included in the appropriate district's "Other Counties".

Ohio Annual Bulletin (September 2015) 57 USDA, National Agricultural Statistics Service
County Estimates: Other Hay, All Cropping Practices — Ohio: 2013 & 2014 (continued)
District and
county
Acres harvested1 Harvested yield Production
2013 2014 2013 2014 2013 2014
(acres) (acres) (tons) (tons) (tons) (tons)
Delaware .................................... Franklin ...................................... Licking ........................................ Madison ...................................... Marion ........................................ Pickaway .................................... Ross ........................................... Union .......................................... Other counties ............................ Central ....................................... Belmont ...................................... Harrison ...................................... Jefferson ..................................... Tuscarawas ................................ Other counties ............................ East Central .............................. Hamilton ..................................... Other counties ............................ Southwest ................................. Adams ........................................ Brown ......................................... Gallia .......................................... Jackson ...................................... Lawrence .................................... Pike ............................................ Scioto ......................................... Other counties ............................ South Central ............................ Athens ........................................ Guernsey .................................... Hocking ...................................... Meigs .......................................... Monroe ....................................... Morgan ....................................... Muskingum ................................. Noble .......................................... Perry ........................................... Vinton ......................................... Washington ................................ Other counties ............................ Southeast .................................. Ohio ...........................................
2,470
15,500 2,320 1,690
34,720 56,700
25,300 18,500 12,500 22,300 38,300
116,900
39,200 39,200
24,200 14,700 24,200
8,600 8,500
10,700 26,900
117,800
23,000
7,300 13,900 18,100
14,200 9,000 6,200
16,600 66,400
174,700
670,000
2,750 1,500
2,090
2,670 8,350 2,000
38,640 58,000
20,200 17,900
16,900 53,900
108,900
2,070 40,330 42,400
19,200 14,700 20,000 14,500 8,150 7,550
24,700
108,800
23,000 24,700 6,870
13,700 17,100 15,700 29,500 14,000 7,750 5,880
16,300
174,500
650,000
2.20
1.95 2.85 2.80
1.95 2.00
1.70 1.90 1.90 1.80 1.75 1.80
2.15 2.15
1.95 2.10 1.85
2.40 2.20 1.75 2.05 2.00
1.50
1.55 2.45 2.00
2.05 1.75 1.55 1.90 1.95 1.90
2.00
2.70 2.05
2.85
2.70 3.00 3.25 2.50 2.60
2.10 3.00
2.20 2.55 2.50
1.30 2.45 2.40
2.70 2.25 2.50 2.40 2.10 2.50
2.60 2.50
2.05 2.20 1.60 2.20 2.70 2.45 2.65 2.15 1.95 1.65 2.40
2.30
2.50
5,400
30,000 6,600 4,750
67,750 114,500
42,500 35,200 23,900 39,700 67,100
208,400
84,600 84,600
47,600 30,900 45,200
20,700 18,500 18,900 55,800
237,600
34,600
11,400 34,200 35,900
29,300 15,800 9,500
31,900 130,900 333,500
1,340,000
7,400 3,100
6,000
7,200
25,000 6,500
96,300 151,500
42,700 53,400
37,000
138,400 271,500
2,700
99,100 101,800
51,700 33,400 49,500 34,600 17,000 18,800
64,400
269,400
47,000 54,500 11,000 30,000 46,500 38,300 77,800 30,100 15,200 9,700
39,300
399,400
1,625,000
(D) Withheld to avoid disclosing data for individual operations. 1 Counties with missing data are included in the appropriate district's "Other Counties".
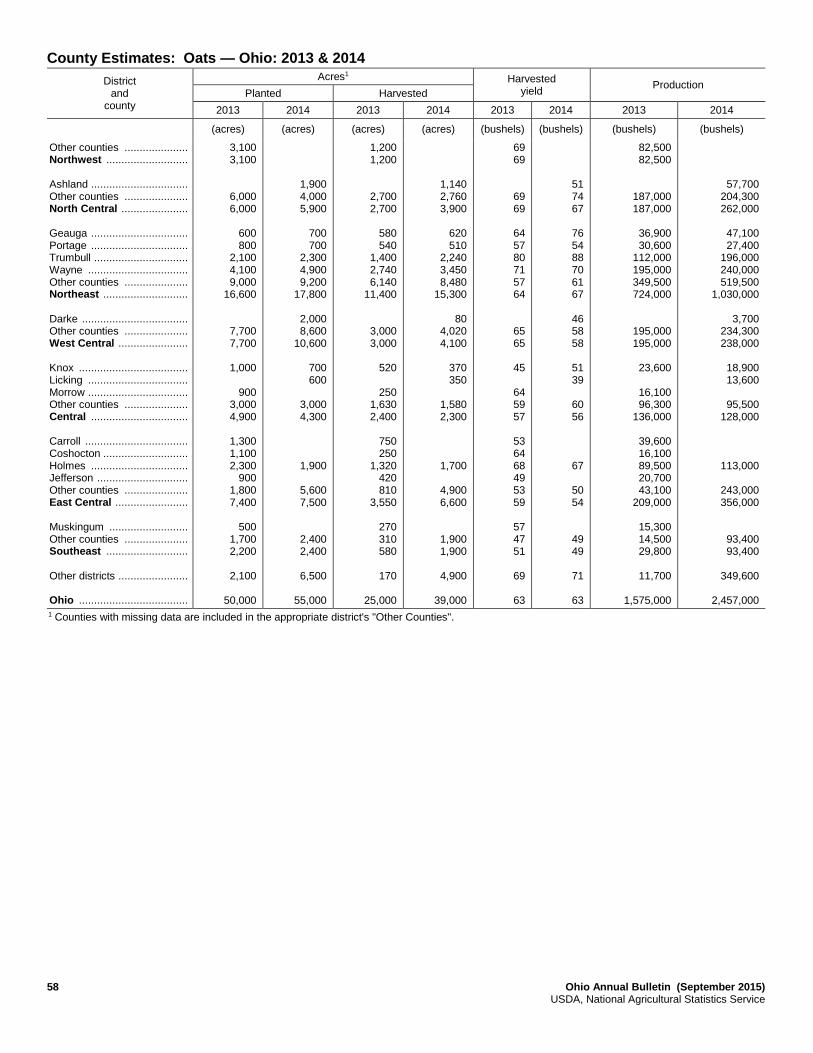
58 Ohio Annual Bulletin (September 2015) USDA, National Agricultural Statistics Service
County Estimates: Oats — Ohio: 2013 & 2014
District and
county
Acres1 Harvested yield
Production Planted Harvested
2013 2014 2013 2014 2013 2014 2013 2014
(acres) (acres) (acres) (acres) (bushels) (bushels) (bushels) (bushels)
Other counties ..................... Northwest ........................... Ashland ................................ Other counties ..................... North Central ...................... Geauga ................................ Portage ................................ Trumbull ............................... Wayne ................................. Other counties ..................... Northeast ............................ Darke ................................... Other counties ..................... West Central ....................... Knox .................................... Licking ................................. Morrow ................................. Other counties ..................... Central ................................ Carroll .................................. Coshocton ............................ Holmes ................................ Jefferson .............................. Other counties ..................... East Central ........................ Muskingum .......................... Other counties ..................... Southeast ........................... Other districts ....................... Ohio ....................................
3,100 3,100
6,000 6,000
600 800
2,100 4,100 9,000
16,600
7,700 7,700
1,000
900
3,000 4,900
1,300 1,100 2,300
900 1,800 7,400
500
1,700 2,200
2,100
50,000
1,900 4,000 5,900
700 700
2,300 4,900 9,200
17,800
2,000 8,600
10,600
700 600
3,000 4,300
1,900
5,600 7,500
2,400 2,400
6,500
55,000
1,200 1,200
2,700 2,700
580 540
1,400 2,740 6,140
11,400
3,000 3,000
520
250
1,630 2,400
750 250
1,320 420 810
3,550
270 310 580
170
25,000
1,140 2,760 3,900
620 510
2,240 3,450 8,480
15,300
80 4,020 4,100
370 350
1,580 2,300
1,700
4,900 6,600
1,900 1,900
4,900
39,000
69 69
69 69
64 57 80 71 57 64
65 65
45
64 59 57
53 64 68 49 53 59
57 47 51
69
63
51 74 67
76 54 88 70 61 67
46 58 58
51 39
60 56
67
50 54
49 49
71
63
82,500 82,500
187,000 187,000
36,900 30,600
112,000 195,000 349,500 724,000
195,000 195,000
23,600
16,100 96,300
136,000
39,600 16,100 89,500 20,700 43,100
209,000
15,300 14,500 29,800
11,700
1,575,000
57,700 204,300 262,000
47,100 27,400
196,000 240,000 519,500
1,030,000
3,700 234,300 238,000
18,900 13,600
95,500
128,000
113,000
243,000 356,000
93,400 93,400
349,600
2,457,000
1 Counties with missing data are included in the appropriate district's "Other Counties".

Ohio Annual Bulletin (September 2015) 59 USDA, National Agricultural Statistics Service
County Estimates: Cattle — Ohio: January 1, 2014 - 2015
County All Cattle1 Milk Cows1
2014 2015 2014 2015
(Number) (Number) (Number) (Number)
Allen .......................................................... Defiance .................................................... Fulton ........................................................ Hancock .................................................... Henry ......................................................... Lucas ......................................................... Paulding .................................................... Putnam ...................................................... Van Wert ................................................... Williams ..................................................... Wood ......................................................... Ashland ..................................................... Crawford .................................................... Erie ............................................................ Huron ........................................................ Lorain ........................................................ Ottawa ....................................................... Richland .................................................... Sandusky ................................................... Seneca ...................................................... Wyandot .................................................... Ashtabula .................................................. Columbiana ............................................... Cuyahoga .................................................. Geauga ..................................................... Lake .......................................................... Mahoning ................................................... Medina ...................................................... Portage ...................................................... Stark .......................................................... Summit ...................................................... Trumbull .................................................... Wayne ....................................................... Auglaize ..................................................... Champaign ................................................ Clark .......................................................... Darke ......................................................... Hardin ........................................................ Logan ........................................................ Mercer ....................................................... Miami ......................................................... Shelby .......................................................
6,500 10,500 32,000 4,000 5,900
(D) 8,000
13,400 7,000
17,500 6,000
23,000 8,300 2,300 8,700
11,500 1,200
22,000 5,000 9,500 3,300
17,500 29,000
(D) 8,500
500 14,000 9,200 7,500
25,500 1,000
11,200 95,000
21,000 9,100
19,000 37,500 14,000 9,500
76,000 11,000 26,500
6,200 10,700 32,500 3,800 5,900
(D) 9,000
13,400 7,500
17,800 5,900
23,000 8,400 2,300 9,000
11,200 1,100
22,500 4,900 9,400 3,200
17,000 28,500
(D) 9,000
500 14,500 9,000 7,500
25,000 1,000
11,100 97,000
21,000 9,000
18,800 38,000 13,800 9,600
75,000 10,500 26,500
600 3,900 2,800 1,100 1,700
7,900 4,400 3,000
(D) (D)
6,100 1,400
400 3,500 4,500
(D) 6,100
800 700
1,200
6,300 9,300
3,000
(D) 5,200 2,700 1,700 9,200
(D) 2,900
32,500
5,100 1,800
(D) 7,800 6,100 2,400
20,000 1,400 6,700
500 4,100 2,800 1,100 1,600
8,300 4,500 2,800
(D) (D)
6,300 1,500
400 3,800 4,300
(D) 6,500
700 600
1,000
6,000 9,400
3,200
(D) 5,500 2,900 1,600 8,900
(D) 2,900
34,000
4,800 1,600
(D) 7,900 6,300 2,500
19,800 1,200 7,000
(D) Withheld to avoid disclosing data for individual operations. 1 Counties with missing data are included in "Other counties".

60 Ohio Annual Bulletin (September 2015) USDA, National Agricultural Statistics Service
County Estimates: Cattle — Ohio: January 1, 2014 - 2015 (continued)
County All Cattle1 Milk Cows1
2014 2015 2014 2015
(Number) (Number) (Number) (Number)
Delaware ................................................... Fairfield ...................................................... Fayette ....................................................... Franklin ...................................................... Knox .......................................................... Licking ....................................................... Madison ..................................................... Marion ........................................................ Morrow ....................................................... Pickaway ................................................... Ross .......................................................... Union ......................................................... Belmont ..................................................... Carroll ........................................................ Coshocton .................................................. Harrison ..................................................... Holmes ...................................................... Jefferson .................................................... Tuscarawas ............................................... Butler ......................................................... Clermont .................................................... Clinton ....................................................... Greene ....................................................... Hamilton .................................................... Montgomery ............................................... Preble ........................................................ Warren ....................................................... Adams ....................................................... Brown ........................................................ Gallia ......................................................... Highland .................................................... Jackson ..................................................... Lawrence ................................................... Pike ........................................................... Scioto ......................................................... Athens ....................................................... Guernsey ................................................... Hocking ...................................................... Meigs ......................................................... Monroe ...................................................... Morgan ...................................................... Muskingum ................................................ Noble ......................................................... Perry .......................................................... Vinton ........................................................ Washington ................................................ Other counties ........................................... Ohio ...........................................................
3,200 13,500 4,700 1,500
17,500 22,500 11,000 6,300 9,700 8,700
13,500 8,500
19,500 16,000 26,000 11,000 55,000 9,500
33,000
15,000 5,000 4,700 4,500 1,500 9,000
17,000 3,900
25,000 19,000 17,000 19,500 10,800 5,500 6,600 9,000
7,500
20,500 2,200 9,500
13,000 13,000 30,000 12,000 9,000 2,600
18,500
500
1,250,000
3,000 13,300 5,000 1,400
17,300 22,000 11,500 6,000 9,700 8,700
13,300 8,700
19,100 15,800 25,500 10,900 57,000 9,200
32,500
14,800 4,800 5,000 4,600 1,500 8,800
17,500 4,000
24,500 18,500 16,800 19,800 10,500 5,300 6,600 8,800
7,500
20,000 2,200 9,300
13,100 12,800 30,500 12,300 8,900 2,500
18,700
500
1,250,000
400 1,000
(D) (D)
3,400 3,400 3,000 3,300 1,700 1,400 1,100 1,100
900
3,500 3,700
800 17,400 1,800 9,800
1,400
(D) (D) (D) (D) 500
1,600 (D)
3,000
800 600
1,300 300 (D) 400 (D)
1,000 1,400
(D) 1,900 1,400 1,100 1,500
(D) 500 (D)
2,300
14,100
267,000
400 1,100
(D) (D)
3,200 3,200 3,200 3,400 1,600 1,500 1,200 1,100
900
3,400 3,600
700 18,000 1,700 9,600
1,300
(D) (D) (D) (D) 500
1,500 (D)
2,900
700 500
1,300 400 (D) 500 (D)
900
1,300 (D)
1,800 1,300 1,000 1,400
(D) 400 100
2,200
13,900
268,000
(D) Withheld to avoid disclosing data for individual operations. 1 Counties with missing data are included in "Other Counties".

Ohio Annual Bulletin (September 2015) 61 USDA, National Agricultural Statistics Service
Adams County Farms (2012 Census) Number
Number of Farms ..................................................... 1,351
Land (2012 Census) Acres
Land Area ................................................................ Land in Farms .......................................................... Cropland .................................................................. Harvested Cropland ................................................. Pastureland ............................................................. Woodland ................................................................
373,675 172,408 84,394 70,945 43,215 46,249
Capacity (2012 Census) Bushels
On-farm Grain Storage Capacity .............................. 1,482,893
Livestock (2014) Number Rank
All cattle and calves ................... Milk cows ...............................
25,000 3,000
12 26
Crop (2014) Acres Harvested Yield Per Acre Production Rank
Corn ........................................ Bu. Soybeans ................................ Bu. Other Hay ............................... Ton
14,100 29,000 19,200
143.3 45.9 2.70
2,020,000 1,332,000
51,700
62 55 4
Commodity (2012 Census) Cash Receipts Commodity (2012 Census) Cash Receipts
Corn ............................................................... Soybeans ....................................................... Wheat ............................................................. Tobacco .......................................................... Vegetables ..................................................... Fruit & Berries ................................................. Nursery & Greenhouse ................................... Total Crop .......................................................
7,863,000 11,085,000
(D) 2,803,000
(D) 112,000 865,000
26,693,000
Poultry & Eggs .............................................. Cattle & Calves ............................................. Milk ............................................................... Hogs & Pigs .................................................. Sheep & Goats ............................................. Total Livestock .............................................. Total Crop & Livestock ..................................
(D) 7,866,000 3,071,000
837,000 167,000
12,213,000
38,906,000
(D) Withheld to avoid disclosing data for individual operations.
Allen County Farms (2012 Census) Number
Number of Farms ..................................................... 904
Land (2012 Census) Acres
Land Area ................................................................ Land in Farms .......................................................... Cropland .................................................................. Harvested Cropland ................................................. Pastureland ............................................................. Woodland ................................................................
257,599 183,186 163,025 155,541
5,538 8,853
Capacity (2012 Census) Bushels
On-farm Grain Storage Capacity .............................. 8,334,525
Livestock (2014) Number Rank
All cattle and calves ................... Milk cows ...............................
6,500 600
65 62
Crop (2014) Acres Harvested Yield Per Acre Production Rank
Corn ........................................ Bu. Soybeans ................................ Bu. Wheat ...................................... Bu. Alfalfa Hay .............................. Ton Other Hay ............................... Ton
67,000 87,500 8,770 2,050 1,180
179.1 54.9 85.6 5.85 2.70
12,000,000 4,802,000
751,000 12,000 3,200
23 27 19 18 34
Commodity (2012 Census) Cash Receipts Commodity (2012 Census) Cash Receipts
Corn ............................................................... Soybeans ....................................................... Wheat ............................................................. Vegetables ..................................................... Fruit & Berries ................................................. Nursery & Greenhouse ................................... Total Crop ....................................................... Poultry & Eggs ................................................
50,078,000 52,416,000 3,712,000
933,000 (D) (D)
109,811,000 (D)
Cattle & Calves ............................................. Milk ............................................................... Hogs & Pigs .................................................. Sheep & Goats ............................................. Total Livestock .............................................. Total Crop & Livestock ..................................
4,724,000 901,000
26,701,000 (D)
34,279,000
144,091,000
(D) Withheld to avoid disclosing data for individual operations.

62 Ohio Annual Bulletin (September 2015) USDA, National Agricultural Statistics Service
Ashland County Farms (2012 Census) Number
Number of Farms .................................................... 1,034
Land (2012 Census) Acres
Land in County ........................................................ Land in Farms ......................................................... Cropland ................................................................. Harvested Cropland ................................................ Pastureland ............................................................. Woodland ...............................................................
270,688 152,972 110,937 101,768 15,087 20,762
Capacity (2012 Census) Bushels
On-farm Grain Storage Capacity ............................. 4,512,460
Livestock (2014) Number Rank
All cattle and calves .................. Milk cows ..............................
23,000 6,100
13 12
Crop Acres Harvested Yield Per Acre Production Rank
Corn ........................................ Bu. Soybeans ................................ Bu. Wheat ..................................... Bu. Alfalfa Hay .............................. Ton
30,500 43,900 6,050 7,070
146.9 44.7 59.8 3.45
4,480,000 1,964,000
362,000 24,300
45 48 36 3
Crop (2012 Census) Cash Receipts Crop (2012 Census) Cash Receipts
Corn ............................................................... Soybeans ....................................................... Wheat ............................................................ Tobacco ......................................................... Vegetables ..................................................... Fruit & Berries ................................................ Nursery & Greenhouse .................................. Total Crop ......................................................
25,425,000 20,512,000 2,553,000
- 630,000 295,000
2,944,000 54,917,000
Poultry & Eggs .............................................. Cattle & Calves ............................................. Milk ............................................................... Hogs & Pigs .................................................. Sheep & Goats ............................................. Total Livestock .............................................. Total Crop & Livestock ..................................
4,817,000 11,415,000 23,535,000 7,431,000
799,000 48,704,000
103,621,000
- Represents zero.
Ashtabula County Farms (2012 Census) Number
Number of Farms .................................................... 1,099
Land (2012 Census) Acres
Land Area ............................................................... Land in Farms ......................................................... Cropland ................................................................. Harvested Cropland ................................................ Pastureland ............................................................. Woodland ...............................................................
449,238 165,967 109,025 100,299 16,419 34,929
Capacity (2012 Census) Bushels
On-farm Grain Storage Capacity ............................. 4,068,730
Livestock (2014) Number Rank
All cattle and calves .................. Milk cows ..............................
17,500 6,300
23 11
Crop (2014) Acres Harvested Yield Per Acre Production Rank
Corn ........................................ Bu. Soybeans ................................ Bu. Wheat ..................................... Bu. Other Hay ............................... Ton
17,700 36,000 1,800
11,600
149.7 43.3 48.9 2.45
2,650,000 1,557,000
88,100 28,500
59 51 53 16
Commodity (2012 Census) Cash Receipts Commodity (2012 Census) Cash Receipts
Corn ............................................................... Soybeans ....................................................... Wheat ............................................................ Vegetables ..................................................... Fruit & Berries ................................................ Nursery & Greenhouse .................................. Total Crop ...................................................... Poultry & Eggs ...............................................
24,403,000 27,133,000
451,000 654,000
2,008,000 2,464,000
61,185,000 100,000
Cattle & Calves ............................................. Milk ............................................................... Hogs & Pigs .................................................. Sheep & Goats ............................................. Total Livestock .............................................. Total Crop & Livestock ..................................
4,035,000 16,342,000
69,000 164,000
21,071,000
82,256,000
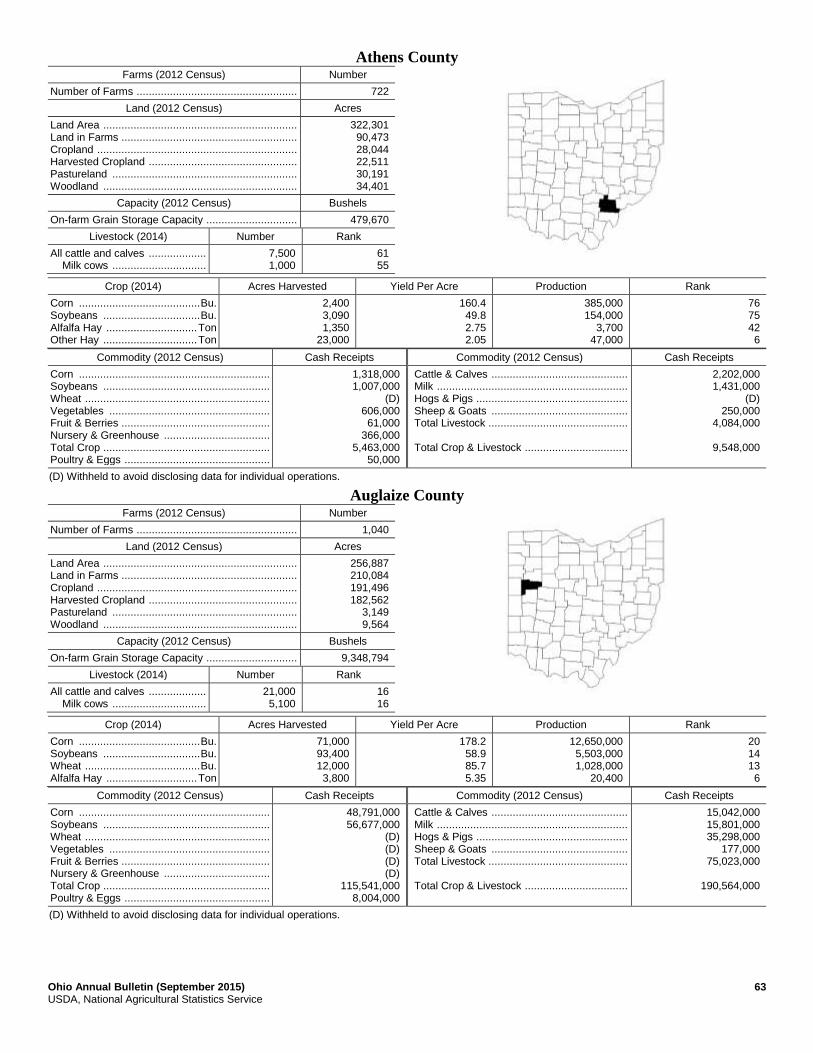
Ohio Annual Bulletin (September 2015) 63 USDA, National Agricultural Statistics Service
Athens County Farms (2012 Census) Number
Number of Farms ..................................................... 722
Land (2012 Census) Acres
Land Area ................................................................ Land in Farms .......................................................... Cropland .................................................................. Harvested Cropland ................................................. Pastureland ............................................................. Woodland ................................................................
322,301 90,473 28,044 22,511 30,191 34,401
Capacity (2012 Census) Bushels
On-farm Grain Storage Capacity .............................. 479,670
Livestock (2014) Number Rank
All cattle and calves ................... Milk cows ...............................
7,500 1,000
61 55
Crop (2014) Acres Harvested Yield Per Acre Production Rank
Corn ........................................ Bu. Soybeans ................................ Bu. Alfalfa Hay .............................. Ton Other Hay ............................... Ton
2,400 3,090 1,350
23,000
160.4 49.8 2.75 2.05
385,000 154,000
3,700 47,000
76 75 42 6
Commodity (2012 Census) Cash Receipts Commodity (2012 Census) Cash Receipts
Corn ............................................................... Soybeans ....................................................... Wheat ............................................................. Vegetables ..................................................... Fruit & Berries ................................................. Nursery & Greenhouse ................................... Total Crop ....................................................... Poultry & Eggs ................................................
1,318,000 1,007,000
(D) 606,000 61,000
366,000 5,463,000
50,000
Cattle & Calves ............................................. Milk ............................................................... Hogs & Pigs .................................................. Sheep & Goats ............................................. Total Livestock .............................................. Total Crop & Livestock ..................................
2,202,000 1,431,000
(D) 250,000
4,084,000
9,548,000
(D) Withheld to avoid disclosing data for individual operations.
Auglaize County Farms (2012 Census) Number
Number of Farms ..................................................... 1,040
Land (2012 Census) Acres
Land Area ................................................................ Land in Farms .......................................................... Cropland .................................................................. Harvested Cropland ................................................. Pastureland ............................................................. Woodland ................................................................
256,887 210,084 191,496 182,562
3,149 9,564
Capacity (2012 Census) Bushels
On-farm Grain Storage Capacity .............................. 9,348,794
Livestock (2014) Number Rank
All cattle and calves ................... Milk cows ...............................
21,000 5,100
16 16
Crop (2014) Acres Harvested Yield Per Acre Production Rank
Corn ........................................ Bu. Soybeans ................................ Bu. Wheat ...................................... Bu. Alfalfa Hay .............................. Ton
71,000 93,400 12,000 3,800
178.2 58.9 85.7 5.35
12,650,000 5,503,000 1,028,000
20,400
20 14 13 6
Commodity (2012 Census) Cash Receipts Commodity (2012 Census) Cash Receipts
Corn ............................................................... Soybeans ....................................................... Wheat ............................................................. Vegetables ..................................................... Fruit & Berries ................................................. Nursery & Greenhouse ................................... Total Crop ....................................................... Poultry & Eggs ................................................
48,791,000 56,677,000
(D) (D) (D) (D)
115,541,000 8,004,000
Cattle & Calves ............................................. Milk ............................................................... Hogs & Pigs .................................................. Sheep & Goats ............................................. Total Livestock .............................................. Total Crop & Livestock ..................................
15,042,000 15,801,000 35,298,000
177,000 75,023,000
190,564,000
(D) Withheld to avoid disclosing data for individual operations.

64 Ohio Annual Bulletin (September 2015) USDA, National Agricultural Statistics Service
Belmont County Farms (2012 Census) Number
Number of Farms .................................................... 700
Land (2012 Census) Acres
Land Area ............................................................... Land in Farms ......................................................... Cropland ................................................................. Harvested Cropland ................................................ Pastureland ............................................................. Woodland ...............................................................
340,563 113,233 34,967 30,264 59,309 26,638
Capacity (2012 Census) Bushels
On-farm Grain Storage Capacity ............................. 65,420
Livestock (2014) Number Rank
All cattle and calves .................. Milk cows ..............................
19,500 900
18 57
Crop (2014) Acres Harvested Yield Per Acre Production Rank
Corn ........................................ Bu. Other Hay ............................... Ton
200 20,200
130.0 2.10
26,000 42,700
84 8
Commodity (2012 Census) Cash Receipts Commodity (2012 Census) Cash Receipts
Corn ............................................................... Soybeans ....................................................... Wheat ............................................................ Vegetables ..................................................... Fruit & Berries ................................................ Nursery & Greenhouse .................................. Total Crop ...................................................... Poultry & Eggs ...............................................
(D) 26,000
(D) 223,000
(D) (D)
4,410,000 (D)
Cattle & Calves ............................................. Milk ............................................................... Hogs & Pigs .................................................. Sheep & Goats ............................................. Total Livestock .............................................. Total Crop & Livestock ..................................
13,261,000 2,040,000
34,000 244,000
15,725,000
20,135,000
(D) Withheld to avoid disclosing data for individual operations.
Brown County Farms (2012 Census) Number
Number of Farms .................................................... 1,379
Land (2012 Census) Acres
Land Area ............................................................... Land in Farms ......................................................... Cropland ................................................................. Harvested Cropland ................................................ Pastureland ............................................................. Woodland ...............................................................
313,610 206,446 139,279 129,516 34,160 32,347
Capacity (2012 Census) Bushels
On-farm Grain Storage Capacity ............................. 4,550,438
Livestock (2014) Number Rank
All cattle and calves .................. Milk cows ..............................
19,000 800
20 58
Crop (2014) Acres Harvested Yield Per Acre Production Rank
Corn ........................................ Bu. Soybeans ................................ Bu. Wheat ..................................... Bu. Other Hay ............................... Ton
25,100 91,700 1,200
14,700
171.3 48.6 55.2 2.25
4,300,000 4,461,000
66,200 33,400
48 30 55 13
Commodity (2012 Census) Cash Receipts Commodity (2012 Census) Cash Receipts
Corn ............................................................... Soybeans ....................................................... Wheat ............................................................ Tobacco ......................................................... Vegetables ..................................................... Fruit & Berries ................................................ Nursery & Greenhouse .................................. Total Crop ......................................................
18,763,000 47,908,000
(D) 3,097,000
101,000 (D)
299,000 73,087,000
Poultry & Eggs .............................................. Cattle & Calves ............................................. Milk ............................................................... Hogs & Pigs .................................................. Sheep & Goats ............................................. Total Livestock .............................................. Total Crop & Livestock ..................................
(D) 6,238,000 1,646,000
933,000 92,000
9,502,000
82,590,000
(D) Withheld to avoid disclosing data for individual operations.
Ohio Annual Bulletin (September 2015) 65 USDA, National Agricultural Statistics Service
Butler County Farms (2012 Census) Number
Number of Farms ..................................................... 865
Land (2012 Census) Acres
Land Area ................................................................ Land in Farms .......................................................... Cropland .................................................................. Harvested Cropland ................................................. Pastureland ............................................................. Woodland ................................................................
298,913 146,054 116,351 112,135 15,056 11,407
Capacity (2012 Census) Bushels
On-farm Grain Storage Capacity .............................. 7,705,096
Livestock (2014) Number Rank
All cattle and calves ................... Milk cows ...............................
15,000 1,400
29 43
Crop (2014) Acres Harvested Yield Per Acre Production Rank
Corn ........................................ Bu. Soybeans ................................ Bu. Wheat ...................................... Bu. Alfalfa Hay .............................. Ton
27,400 37,500 3,000 2,760
175.5 51.4 65.7 3.10
4,810,000 1,926,000
197,000 8,600
43 49 45 26
Commodity (2012 Census) Cash Receipts Commodity (2012 Census) Cash Receipts
Corn ............................................................... Soybeans ....................................................... Wheat ............................................................. Vegetables ..................................................... Fruit & Berries ................................................. Nursery & Greenhouse ................................... Total Crop ....................................................... Poultry & Eggs ................................................
23,943,000 22,224,000 1,439,000
244,000 (D)
2,482,000 52,310,000
(D)
Cattle & Calves ............................................. Milk ............................................................... Hogs & Pigs .................................................. Sheep & Goats ............................................. Total Livestock .............................................. Total Crop & Livestock ..................................
6,284,000 1,182,000 2,926,000
126,000 12,730,000
65,040,000
(D) Withheld to avoid disclosing data for individual operations.
Carroll County Farms (2012 Census) Number
Number of Farms ..................................................... 733
Land (2012 Census) Acres
Land Area ................................................................ Land in Farms .......................................................... Cropland .................................................................. Harvested Cropland ................................................. Pastureland ............................................................. Woodland ................................................................
252,549 106,256 58,445 52,529 23,434 22,237
Capacity (2012 Census) Bushels
On-farm Grain Storage Capacity .............................. 1,514,490
Livestock (2014) Number Rank
All cattle and calves ................... Milk cows ...............................
16,000 3,500
28 21
Crop (2014) Acres Harvested Yield Per Acre Production Rank
Corn ........................................ Bu. Soybeans ................................ Bu. Wheat ...................................... Bu.
7,100 8,080
580
123.2 42.5 39.7
875,000 343,000 23,000
68 68 62
Commodity (2012 Census) Cash Receipts Commodity (2012 Census) Cash Receipts
Corn ............................................................... Soybeans ....................................................... Wheat ............................................................. Vegetables ..................................................... Fruit & Berries ................................................. Nursery & Greenhouse ................................... Total Crop ....................................................... Poultry & Eggs ................................................
6,826,000 4,656,000
(D) 73,000
154,000 4,351,000
20,239,000 (D)
Cattle & Calves ............................................. Milk ............................................................... Hogs & Pigs .................................................. Sheep & Goats ............................................. Total Livestock .............................................. Total Crop & Livestock ..................................
5,509,000 11,038,000
(D) 138,000
18,960,000
39,199,000
(D) Withheld to avoid disclosing data for individual operations.

66 Ohio Annual Bulletin (September 2015) USDA, National Agricultural Statistics Service
Champaign County Farms (2012 Census) Number
Number of Farms .................................................... 873
Land (2012 Census) Acres
Land Area ............................................................... Land in Farms ......................................................... Cropland ................................................................. Harvested Cropland ................................................ Pastureland ............................................................. Woodland ...............................................................
274,348 190,060 164,873 157,421
9,481 10,340
Capacity (2012 Census) Bushels
On-farm Grain Storage Capacity ............................. 10,572,814
Livestock (2014) Number Rank
All cattle and calves .................. Milk cows ..............................
9,100 1,800
51 36
Crop (2014) Acres Harvested Yield Per Acre Production Rank
Corn ........................................ Bu. Soybeans ................................ Bu. Wheat ..................................... Bu. Alfalfa Hay .............................. Ton
86,000 93,300 5,100 3,830
180.8 54.6 74.5 3.60
15,550,000 5,098,000
380,000 13,800
10 23 34 16
Commodity (2012 Census) Cash Receipts Commodity (2012 Census) Cash Receipts
Corn ............................................................... Soybeans ....................................................... Wheat ............................................................ Vegetables ..................................................... Fruit & Berries ................................................ Nursery & Greenhouse .................................. Total Crop ...................................................... Poultry & Eggs ...............................................
58,832,000 38,249,000 1,854,000
(D) 285,000 258,000
112,985,000 (D)
Cattle & Calves ............................................. Milk ............................................................... Hogs & Pigs .................................................. Sheep & Goats ............................................. Total Livestock .............................................. Total Crop & Livestock ..................................
3,713,000 4,031,000 8,709,000
195,000 17,429,000
130,414,000
(D) Withheld to avoid disclosing data for individual operations.
Clark County Farms (2012 Census) Number
Number of Farms ................................................. 785
Land (2012 Census) Acres
Land Area ............................................................ Land in Farms ...................................................... Cropland .............................................................. Harvested Cropland ............................................. Pastureland .......................................................... Woodland ............................................................
254,384 174,337 149,820 147,113
9,708 8,663
Capacity (2012 Census) Bushels
On-farm Grain Storage Capacity .......................... 9,306,485
Livestock (2014) Number Rank
All cattle and calves .................. Milk cows ..............................
19,000 (D)
20
(D) Withheld to avoid disclosing data for individual operations.
Crop (2014) Acres Harvested Yield Per Acre Production Rank
Corn ........................................ Bu. Soybeans ................................ Bu. Wheat ..................................... Bu. Alfalfa Hay .............................. Ton
60,500 68,100 2,430 2,420
195.0 56.7 77.4 4.15
11,800,000 3,860,000
188,000 10,100
24 34 46 23
Commodity (2012 Census) Cash Receipts Commodity (2012 Census) Cash Receipts
Corn ............................................................... Soybeans ....................................................... Wheat ............................................................ Vegetables ..................................................... Fruit & Berries ................................................ Nursery & Greenhouse .................................. Total Crop ...................................................... Poultry & Eggs ...............................................
63,846,000 36,656,000 1,090,000
(D) (D)
14,067,000 116,745,000
30,000
Cattle & Calves ............................................. Milk ............................................................... Hogs & Pigs .................................................. Sheep & Goats ............................................. Total Livestock .............................................. Total Crop & Livestock ..................................
17,930,000 (D)
3,836,000 147,000
28,398,000
145,143,000
(D) Withheld to avoid disclosing data for individual operations.
Ohio Annual Bulletin (September 2015) 67 USDA, National Agricultural Statistics Service
Clermont County Farms (2012 Census) Number
Number of Farms .................................................. 822
Land (2012 Census) Acres
Land Area ............................................................. Land in Farms ....................................................... Cropland ............................................................... Harvested Cropland .............................................. Pastureland .......................................................... Woodland .............................................................
289,350 121,125 88,523 84,685 13,898 17,785
Capacity (2012 Census) Bushels
On-farm Grain Storage Capacity ........................... 2,944,600
Livestock (2014) Number Rank
All cattle and calves ................... Milk cows ...............................
5,000 (D)
70
(D) Withheld to avoid disclosing data for individual operations.
Crop (2014) Acres Harvested Yield Per Acre Production Rank
Corn ........................................ Bu. Soybeans ................................ Bu.
15,600 39,500
179.5 50.6
2,800,000 2,000,000
56 47
Commodity (2012 Census) Cash Receipts Commodity (2012 Census) Cash Receipts
Corn ............................................................... Soybeans ....................................................... Wheat ............................................................. Tobacco .......................................................... Vegetables ..................................................... Fruit & Berries ................................................. Nursery & Greenhouse ................................... Total Crop .......................................................
20,703,000 29,389,000
358,000 147,000 329,000 176,000
1,932,000 54,136,000
Poultry & Eggs .............................................. Cattle & Calves ............................................. Milk ............................................................... Hogs & Pigs .................................................. Sheep & Goats ............................................. Total Livestock .............................................. Total Crop & Livestock ..................................
69,000 1,488,000
(D) 16,000 77,000
3,883,000
58,019,000
(D) Withheld to avoid disclosing data for individual operations.
Clinton County Farms (2012 Census) Number
Number of Farms .................................................. 759
Land (2012 Census) Acres
Land Area ............................................................. Land in Farms ....................................................... Cropland ............................................................... Harvested Cropland .............................................. Pastureland .......................................................... Woodland .............................................................
261,558 208,142 187,727 181,830
6,356 9,335
Capacity (2012 Census) Bushels
On-farm Grain Storage Capacity ........................... 13,529,225
Livestock (2014) Number Rank
All cattle and calves ................... Milk cows ...............................
4,700 (D)
72
(D) Withheld to avoid disclosing data for individual operations.
Crop (2014) Acres Harvested Yield Per Acre Production Rank
Corn ........................................ Bu. Soybeans ................................ Bu. Wheat ...................................... Bu. Alfalfa Hay .............................. Ton
69,000 105,700
3,200 1,000
200.0 56.5 69.7 4.00
13,800,000 5,970,000
223,000 4,000
17 13 43 41
Commodity (2012 Census) Cash Receipts Commodity (2012 Census) Cash Receipts
Corn ............................................................... Soybeans ....................................................... Wheat ............................................................. Vegetables ..................................................... Fruit & Berries ................................................. Nursery & Greenhouse ................................... Total Crop ....................................................... Poultry & Eggs ................................................
80,245,000 65,134,000 1,105,000
342,000 (D)
573,000 148,248,000
232,000
Cattle & Calves ............................................. Milk ............................................................... Hogs & Pigs .................................................. Sheep & Goats ............................................. Total Livestock .............................................. Total Crop & Livestock ..................................
4,602,000 1,176,000 8,644,000
195,000 15,596,000
163,843,000
(D) Withheld to avoid disclosing data for individual operations.

68 Ohio Annual Bulletin (September 2015) USDA, National Agricultural Statistics Service
Columbiana County Farms (2012 Census) Number
Number of Farms .................................................... 1,045
Land (2012 Census) Acres
Land Area ............................................................... Land in Farms ......................................................... Cropland ................................................................. Harvested Cropland ................................................ Pastureland ............................................................. Woodland ...............................................................
340,436 127,846 81,687 78,489 19,098 20,998
Capacity (2012 Census) Bushels
On-farm Grain Storage Capacity ............................. 2,221,890
Livestock (2014) Number Rank
All cattle and calves .................. Milk cows ..............................
29,000 9,300
8 6
Crop (2014) Acres Harvested Yield Per Acre Production Rank
Corn ........................................ Bu. Soybeans ................................ Bu. Wheat ..................................... Bu.
21,500 20,700 5,420
163.3 50.1 56.6
3,510,000 1,037,000
307,000
51 58 39
Commodity (2012 Census) Cash Receipts Commodity (2012 Census) Cash Receipts
Corn ............................................................... Soybeans ....................................................... Wheat ............................................................ Vegetables ..................................................... Fruit & Berries ................................................ Nursery & Greenhouse .................................. Total Crop ...................................................... Poultry & Eggs ...............................................
14,297,000 12,172,000 1,885,000
884,000 (D)
2,176,000 38,141,000 12,704,000
Cattle & Calves ............................................. Milk ............................................................... Hogs & Pigs .................................................. Sheep & Goats ............................................. Total Livestock .............................................. Total Crop & Livestock ..................................
11,369,000 33,862,000 1,707,000
(D) 61,155,000
99,296,000
(D) Withheld to avoid disclosing data for individual operations.
Coshocton County Farms (2012 Census) Number
Number of Farms .................................................... 1,122
Land (2012 Census) Acres
Land Area ............................................................... Land in Farms ......................................................... Cropland ................................................................. Harvested Cropland ................................................ Pastureland ............................................................. Woodland ...............................................................
360,904 169,762 88,718 77,790 41,747 39,022
Capacity (2012 Census) Bushels
On-farm Grain Storage Capacity ............................. 3,547,871
Livestock (2014) Number Rank
All cattle and calves .................. Milk cows ..............................
26,000 3,700
10 20
Crop (2014) Acres Harvested Yield Per Acre Production Rank
Corn ........................................ Bu. Soybeans ................................ Bu. Wheat ..................................... Bu.
26,300 17,700 1,450
166.5 52.1 65.2
4,380,000 922,000 94,500
46 59 52
Commodity (2012 Census) Cash Receipts Commodity (2012 Census) Cash Receipts
Corn ............................................................... Soybeans ....................................................... Wheat ............................................................ Vegetables ..................................................... Fruit & Berries ................................................ Nursery & Greenhouse .................................. Total Crop ...................................................... Poultry & Eggs ...............................................
17,236,000 8,067,000
572,000 (D)
80,000 (D)
32,562,000 11,209,000
Cattle & Calves ............................................. Milk ............................................................... Hogs & Pigs .................................................. Sheep & Goats ............................................. Total Livestock .............................................. Total Crop & Livestock ..................................
9,643,000 10,338,000 16,830,000
412,000 49,098,000
81,660,000
(D) Withheld to avoid disclosing data for individual operations.

Ohio Annual Bulletin (September 2015) 69 USDA, National Agricultural Statistics Service
Crawford County Farms (2012 Census) Number
Number of Farms ..................................................... 634
Land (2012 Census) Acres
Land Area ................................................................ Land in Farms .......................................................... Cropland .................................................................. Harvested Cropland ................................................. Pastureland ............................................................. Woodland ................................................................
257,143 240,022 221,930 216,259
2,831 11,546
Capacity (2012 Census) Bushels
On-farm Grain Storage Capacity .............................. 14,447,920
Livestock (2014) Number Rank
All cattle and calves ................... Milk cows ...............................
8,300 1,400
59 43
Crop (2014) Acres Harvested Yield Per Acre Production Rank
Corn ........................................ Bu. Soybeans ................................ Bu. Wheat ...................................... Bu. Alfalfa Hay .............................. Ton Other Hay ............................... Ton
78,500 96,400 13,100 2,010 1,780
183.4 54.6 73.2 3.80 2.65
14,400,000 5,268,000
959,000 7,600 4,700
15 18 14 28 32
Commodity (2012 Census) Cash Receipts Commodity (2012 Census) Cash Receipts
Corn ............................................................... Soybeans ....................................................... Wheat ............................................................. Vegetables ..................................................... Fruit & Berries ................................................. Nursery & Greenhouse ................................... Total Crop ....................................................... Poultry & Eggs ................................................
74,115,000 60,648,000 6,573,000
(D) 10,000
(D) 142,931,000
3,228,000
Cattle & Calves ............................................. Milk ............................................................... Hogs & Pigs .................................................. Sheep & Goats ............................................. Total Livestock .............................................. Total Crop & Livestock ..................................
7,073,000 6,967,000
32,696,000 166,000
50,214,000
193,145,000
(D) Withheld to avoid disclosing data for individual operations.
Cuyahoga County Farms (2012 Census) Number
Number of Farms .................................................. 114
Land (2012 Census) Acres
Land Area ............................................................. Land in Farms ....................................................... Cropland ............................................................... Harvested Cropland .............................................. Pastureland .......................................................... Woodland .............................................................
292,572 2,608
637 439 726
1,064
Capacity (2012 Census) Bushels
On-farm Grain Storage Capacity ...........................
Livestock (2014) Number Rank
All cattle and calves ................... (D)
(D) Withheld to avoid disclosing data for individual operations.
Commodity (2012 Census) Cash Receipts Commodity (2012 Census) Cash Receipts
Corn ............................................................... Soybeans ....................................................... Vegetables ..................................................... Fruit & Berries ................................................. Nursery & Greenhouse ................................... Total Crop .......................................................
(D) (D)
231,000 74,000
9,707,000 10,061,000
Poultry & Eggs .............................................. Cattle & Calves ............................................. Sheep & Goats ............................................. Total Livestock .............................................. Total Crop & Livestock ..................................
17,000 (D) (D)
154,000
10,215,000
(D) Withheld to avoid disclosing data for individual operations.

70 Ohio Annual Bulletin (September 2015) USDA, National Agricultural Statistics Service
Darke County Farms (2012 Census) Number
Number of Farms .................................................... 1,693
Land (2012 Census) Acres
Land Area ............................................................... Land in Farms ......................................................... Cropland ................................................................. Harvested Cropland ................................................ Pastureland ............................................................. Woodland ...............................................................
382,794 339,981 311,595 303,009
5,608 12,012
Capacity (2012 Census) Bushels
On-farm Grain Storage Capacity ............................. 21,080,041
Livestock (2014) Number Rank
All cattle and calves .................. Milk cows ..............................
37,500 7,800
4 9
Crop (2014) Acres Harvested Yield Per Acre Production Rank
Corn ........................................ Bu. Soybeans ................................ Bu. Wheat ..................................... Bu.
130,000 145,300 15,900
183.8 57.1 85.7
23,900,000 8,303,000 1,363,000
1 1 9
Commodity (2012 Census) Cash Receipts Commodity (2012 Census) Cash Receipts
Corn ............................................................... Soybeans ....................................................... Wheat ............................................................ Vegetables ..................................................... Fruit & Berries ................................................ Nursery & Greenhouse .................................. Total Crop ...................................................... Poultry & Eggs ...............................................
87,021,000 82,483,000 6,242,000
(D) (D)
1,227,000 180,379,000 220,906,000
Cattle & Calves ............................................. Milk ............................................................... Hogs & Pigs .................................................. Sheep & Goats ............................................. Total Livestock .............................................. Total Crop & Livestock ..................................
32,421,000 29,509,000 95,898,000
220,000 379,116,000
559,494,000
(D) Withheld to avoid disclosing data for individual operations.
Defiance County Farms (2012 Census) Number
Number of Farms .................................................... 1,030
Land (2012 Census) Acres
Land Area ............................................................... Land in Farms ......................................................... Cropland ................................................................. Harvested Cropland ................................................ Pastureland ............................................................. Woodland ...............................................................
263,333 225,250 198,111 179,253
2,839 14,223
Capacity (2012 Census) Bushels
On-farm Grain Storage Capacity ............................. 4,792,564
Livestock (2014) Number Rank
All cattle and calves .................. Milk cows ..............................
10,500 3,900
44 19
Crop (2014) Acres Harvested Yield Per Acre Production Rank
Corn ........................................ Bu. Soybeans ................................ Bu. Wheat ..................................... Bu. Alfalfa Hay .............................. Ton
52,500 100,400 20,700 2,380
184.0 51.1 75.4 5.45
9,660,000 5,131,000 1,560,000
13,000
30 20 7
17
Commodity (2012 Census) Cash Receipts Commodity (2012 Census) Cash Receipts
Corn ............................................................... Soybeans ....................................................... Wheat ............................................................ Vegetables ..................................................... Fruit & Berries ................................................ Nursery & Greenhouse .................................. Total Crop ...................................................... Poultry & Eggs ...............................................
28,870,000 50,635,000 5,016,000
(D) (D) (D)
86,180,000 135,000
Cattle & Calves ............................................. Milk ............................................................... Hogs & Pigs .................................................. Sheep & Goats ............................................. Total Livestock .............................................. Total Crop & Livestock ..................................
7,959,000 15,705,000 3,395,000
99,000 27,359,000
113,539,000
(D) Withheld to avoid disclosing data for individual operations.
Ohio Annual Bulletin (September 2015) 71 USDA, National Agricultural Statistics Service
Delaware County Farms (2012 Census) Number
Number of Farms ..................................................... 755
Land (2012 Census) Acres
Land Area ................................................................ Land in Farms .......................................................... Cropland .................................................................. Harvested Cropland ................................................. Pastureland ............................................................. Woodland ................................................................
283,585 140,902 123,380 119,971
6,281 6,791
Capacity (2012 Census) Bushels
On-farm Grain Storage Capacity .............................. 6,746,007
Livestock (2014) Number Rank
All cattle and calves ................... Milk cows ...............................
3,200 400
78 66
Crop (2014) Acres Harvested Yield Per Acre Production Rank
Corn ........................................ Bu. Soybeans ................................ Bu. Wheat ...................................... Bu. Alfalfa Hay .............................. Ton Other Hay ............................... Ton
40,700 69,500 3,930 1,620 2,750
154.3 47.2 59.3 2.95 2.7
6,280,000 3,282,000
233,000 4,800 7,400
41 39 42 38 26
Commodity (2012 Census) Cash Receipts Commodity (2012 Census) Cash Receipts
Corn ............................................................... Soybeans ....................................................... Wheat ............................................................. Vegetables ..................................................... Fruit & Berries ................................................. Nursery & Greenhouse ................................... Total Crop ....................................................... Poultry & Eggs ................................................
40,553,000 39,460,000 1,404,000
137,000 127,000
25,039,000 107,887,000
117,000
Cattle & Calves ............................................. Milk ............................................................... Hogs & Pigs .................................................. Sheep & Goats ............................................. Total Livestock .............................................. Total Crop & Livestock ..................................
880,000 1,568,000 9,814,000
167,000 14,019,000
121,905,000
Erie County Farms (2012 Census) Number
Number of Farms ..................................................... 345
Land (2012 Census) Acres
Land Area ................................................................ Land in Farms .......................................................... Cropland .................................................................. Harvested Cropland ................................................. Pastureland ............................................................. Woodland ................................................................
161,021 83,330 71,855 67,519 1,668 6,437
Capacity (2012 Census) Bushels
On-farm Grain Storage Capacity .............................. 3,914,800
Livestock (2014) Number Rank
All cattle and calves ................... Milk cows ...............................
2,300 400
80 66
Crop (2014) Acres Harvested Yield Per Acre Production Rank
Corn ........................................ Bu. Soybeans ................................ Bu. Wheat ...................................... Bu. Alfalfa Hay .............................. Ton Other Hay ............................... Ton
29,500 36,700 6,500 1,410
760
159.3 49.0 78.5 4.45 3.30
4,700,000 1,798,000
510,000 6,300 2,500
44 50 24 34 38
Commodity (2012 Census) Cash Receipts Commodity (2012 Census) Cash Receipts
Corn ............................................................... Soybeans ....................................................... Wheat ............................................................. Vegetables ..................................................... Fruit & Berries ................................................. Nursery & Greenhouse ................................... Total Crop ....................................................... Poultry & Eggs ................................................
25,670,000 16,881,000
(D) 7,067,000
(D) (D)
81,334,000 (D)
Cattle & Calves ............................................. Milk ............................................................... Hogs & Pigs .................................................. Sheep & Goats ............................................. Total Livestock .............................................. Total Crop & Livestock ..................................
1,228,000 1,010,000
55,000 17,000
6,841,000
88,176,000
(D) Withheld to avoid disclosing data for individual operations.

72 Ohio Annual Bulletin (September 2015) USDA, National Agricultural Statistics Service
Fairfield County Farms (2012 Census) Number
Number of Farms .................................................... 1,184
Land (2012 Census) Acres
Land Area ............................................................... Land in Farms ......................................................... Cropland ................................................................. Harvested Cropland ................................................ Pastureland ............................................................. Woodland ...............................................................
322,822 206,699 162,932 152,888 16,295 19,144
Capacity (2012 Census) Bushels
On-farm Grain Storage Capacity ............................. 9,689,606
Livestock (2014) Number Rank
All cattle and calves .................. Milk cows ..............................
13,500 1,000
32 55
Crop (2014) Acres Harvested Yield Per Acre Production Rank
Corn ........................................ Bu. Soybeans ................................ Bu. Wheat ..................................... Bu.
59,000 68,100 7,000
178.0 55.8 70.0
10,500,000 3,798,000
490,000
28 35 26
Commodity (2012 Census) Cash Receipts Commodity (2012 Census) Cash Receipts
Corn ............................................................... Soybeans ....................................................... Wheat ............................................................ Vegetables ..................................................... Fruit & Berries ................................................ Nursery & Greenhouse .................................. Total Crop ...................................................... Poultry & Eggs ...............................................
42,219,000 35,201,000 3,043,000
464,000 392,000
1,163,000 84,070,000
75,000
Cattle & Calves ............................................. Milk ............................................................... Hogs & Pigs .................................................. Sheep & Goats ............................................. Total Livestock .............................................. Total Crop & Livestock ..................................
7,857,000 3,605,000 9,441,000
142,000 21,773,000
105,843,000
Fayette County Farms (2012 Census) Number
Number of Farms ................................................. 504
Land (2012 Census) Acres
Land Area ............................................................ Land in Farms ...................................................... Cropland .............................................................. Harvested Cropland ............................................. Pastureland .......................................................... Woodland ............................................................
260,068 196,529 180,569 173,795
5,734 4,855
Capacity (2012 Census) Bushels
On-farm Grain Storage Capacity .......................... 12,019,480
Livestock (2014) Number Rank
All cattle and calves .................. Milk cows ..............................
4,700 (D)
72
(D) Withheld to avoid disclosing data for individual operations.
Crop (2014) Acres Harvested Yield Per Acre Production Rank
Corn ........................................ Bu. Soybeans ................................ Bu. Wheat ..................................... Bu.
82,000 116,900
5,050
185.4 56.8 83.8
15,200,000 6,636,000
423,000
12 7
30
Commodity (2012 Census) Cash Receipts Commodity (2012 Census) Cash Receipts
Corn ............................................................... Soybeans ....................................................... Wheat ............................................................ Vegetables ..................................................... Fruit & Berries ................................................ Nursery & Greenhouse .................................. Total Crop ...................................................... Poultry & Eggs ...............................................
64,521,000 57,288,000 2,379,000
81,000 2,000
(D) 126,175,000
12,000
Cattle & Calves ............................................. Milk ............................................................... Hogs & Pigs .................................................. Sheep & Goats ............................................. Total Livestock .............................................. Total Crop & Livestock ..................................
3,863,000 11,460,000
90,000 (D)
17,368,000
143,543,000
(D) Withheld to avoid disclosing data for individual operations.

Ohio Annual Bulletin (September 2015) 73 USDA, National Agricultural Statistics Service
Franklin County Farms (2012 Census) Number
Number of Farms .................................................. 388
Land (2012 Census) Acres
Land Area ............................................................. Land in Farms ....................................................... Cropland ............................................................... Harvested Cropland .............................................. Pastureland .......................................................... Woodland .............................................................
340,596 62,017 53,536 51,535 3,060 3,525
Capacity (2012 Census) Bushels
On-farm Grain Storage Capacity ........................... 1,715,500
Livestock (2014) Number Rank
All cattle and calves ................... Milk cows ...............................
1,500 (D)
82
(D) Withheld to avoid disclosing data for individual operations.
Crop (2014) Acres Harvested Yield Per Acre Production Rank
Corn ........................................ Bu. Soybeans ................................ Bu. Alfalfa Hay .............................. Ton Other Hay ............................... Ton
15,800 28,400 1,000 1,500
172.8 50.7 4.10 2.05
2,730,000 1,439,000
4,100 3,100
58 53 40 35
Commodity (2012 Census) Cash Receipts Commodity (2012 Census) Cash Receipts
Corn ............................................................... Soybeans ....................................................... Wheat ............................................................. Vegetables ..................................................... Fruit & Berries ................................................. Nursery & Greenhouse ................................... Total Crop ....................................................... Poultry & Eggs ................................................
12,903,000 12,671,000
810,000 521,000 166,000
18,837,000 46,387,000
21,000
Cattle & Calves ............................................. Milk ............................................................... Hogs & Pigs .................................................. Sheep & Goats ............................................. Total Livestock .............................................. Total Crop & Livestock ..................................
417,000 (D)
33,000 120,000
1,842,000
48,228,000
(D) Withheld to avoid disclosing data for individual operations.
Fulton County Farms (2012 Census) Number
Number of Farms ..................................................... 825
Land (2012 Census) Acres
Land Area ................................................................ Land in Farms .......................................................... Cropland .................................................................. Harvested Cropland ................................................. Pastureland ............................................................. Woodland ................................................................
259,483 195,356 179,634 173,769
2,873 6,895
Capacity (2012 Census) Bushels
On-farm Grain Storage Capacity .............................. 10,083,173
Livestock (2014) Number Rank
All cattle and calves ................... Milk cows ...............................
32,000 2,800
6 31
Crop (2014) Acres Harvested Yield Per Acre Production Rank
Corn ........................................ Bu. Soybeans ................................ Bu. Wheat ...................................... Bu. Alfalfa Hay .............................. Ton
77,000 86,000 15,700 1,320
183.1 51.1 80.6 3.65
14,100,000 4,392,000 1,266,000
4,800
16 31 11 38
Commodity (2012 Census) Cash Receipts Commodity (2012 Census) Cash Receipts
Corn ............................................................... Soybeans ....................................................... Wheat ............................................................. Vegetables ..................................................... Fruit & Berries ................................................. Nursery & Greenhouse ................................... Total Crop ....................................................... Poultry & Eggs ................................................
61,113,000 47,842,000 6,929,000 2,214,000
111,000 2,499,000
121,977,000 12,000
Cattle & Calves ............................................. Milk ............................................................... Hogs & Pigs .................................................. Sheep & Goats ............................................. Total Livestock .............................................. Total Crop & Livestock ..................................
33,815,000 11,148,000 8,448,000
181,000 53,767,000
175,744,000

74 Ohio Annual Bulletin (September 2015) USDA, National Agricultural Statistics Service
Gallia County Farms (2012 Census) Number
Number of Farms .................................................... 957
Land (2012 Census) Acres
Land Area ............................................................... Land in Farms ......................................................... Cropland ................................................................. Harvested Cropland ................................................ Pastureland ............................................................. Woodland ...............................................................
298,579 115,838 34,606 29,190 54,163 37,523
Capacity (2012 Census) Bushels
On-farm Grain Storage Capacity ............................. 258,853
Livestock (2014) Number Rank
All cattle and calves .................. Milk cows ..............................
17,000 600
26 62
Crop (2014) Acres Harvested Yield Per Acre Production Rank
Corn ........................................ Bu. Soybeans ................................ Bu. Other Hay ............................... Ton
3,100 4,180
20,000
145.8 53.3 2.50
452,000 223,000 49,500
73 70 5
Commodity (2012 Census) Cash Receipts Commodity (2012 Census) Cash Receipts
Corn ............................................................... Soybeans ....................................................... Wheat ............................................................ Tobacco ......................................................... Vegetables ..................................................... Fruit & Berries ................................................ Nursery & Greenhouse .................................. Total Crop ......................................................
2,700,000 1,718,000
7,000 771,000 244,000
(D) 162,000
7,811,000
Poultry & Eggs .............................................. Cattle & Calves ............................................. Milk ............................................................... Hogs & Pigs .................................................. Sheep & Goats ............................................. Total Livestock .............................................. Total Crop & Livestock ..................................
(D) 5,786,000
894,000 92,000
280,000 7,335,000
15,146,000
(D) Withheld to avoid disclosing data for individual operations.
Geauga County Farms (2012 Census) Number
Number of Farms .................................................... 959
Land (2012 Census) Acres
Land Area ............................................................... Land in Farms ......................................................... Cropland ................................................................. Harvested Cropland ................................................ Pastureland ............................................................. Woodland ...............................................................
256,108 66,809 32,671 29,364 13,862 16,948
Capacity (2012 Census) Bushels
On-farm Grain Storage Capacity ............................. 812,066
Livestock (2014) Number Rank
All cattle and calves .................. Milk cows ..............................
8,500 3,000
57 26
Crop (2014) Acres Harvested Yield Per Acre Production Rank
Corn ........................................ Bu. Soybeans ................................ Bu. Wheat ..................................... Bu. Alfalfa Hay .............................. Ton
2,700 3,970
510 3,090
122.6 46.3 52.0 3.15
331,000 184,000 26,500 9,800
78 72 60 24
Commodity (2012 Census) Cash Receipts Commodity (2012 Census) Cash Receipts
Corn ............................................................... Soybeans ....................................................... Wheat ............................................................ Vegetables ..................................................... Fruit & Berries ................................................ Nursery & Greenhouse .................................. Total Crop ...................................................... Poultry & Eggs ...............................................
4,732,000 2,105,000
(D) 2,041,000
565,000 5,660,000
17,901,000 92,000
Cattle & Calves ............................................. Milk ............................................................... Hogs & Pigs .................................................. Sheep & Goats ............................................. Total Livestock .............................................. Total Crop & Livestock ..................................
3,735,000 16,994,000
154,000 266,000
25,711,000
43,612,000
(D) Withheld to avoid disclosing data for individual operations.
Ohio Annual Bulletin (September 2015) 75 USDA, National Agricultural Statistics Service
Greene County Farms (2012 Census) Number
Number of Farms .................................................. 800
Land (2012 Census) Acres
Land Area ............................................................. Land in Farms ....................................................... Cropland ............................................................... Harvested Cropland .............................................. Pastureland .......................................................... Woodland .............................................................
264,788 145,790 124,738 121,474
9,100 8,958
Capacity (2012 Census) Bushels
On-farm Grain Storage Capacity ........................... 7,198,600
Livestock (2014) Number Rank
All cattle and calves ................... Milk cows ...............................
4,500 (D)
74
(D) Withheld to avoid disclosing data for individual operations.
Crop (2014) Acres Harvested Yield Per Acre Production Rank
Corn ........................................ Bu. Soybeans ................................ Bu. Wheat ...................................... Bu. Alfalfa Hay .............................. Ton
60,500 70,200 3,610 1,710
190.9 56.6 73.7 3.45
11,550,000 3,971,000
266,000 5,900
26 32 41 35
Commodity (2012 Census) Cash Receipts Commodity (2012 Census) Cash Receipts
Corn ............................................................... Soybeans ....................................................... Wheat ............................................................. Tobacco .......................................................... Vegetables ..................................................... Fruit & Berries ................................................. Nursery & Greenhouse ................................... Total Crop .......................................................
47,597,000 32,722,000 1,236,000
(D) 611,000 223,000
3,953,000 87,025,000
Poultry & Eggs .............................................. Cattle & Calves ............................................. Milk ............................................................... Hogs & Pigs .................................................. Sheep & Goats ............................................. Total Livestock .............................................. Total Crop & Livestock ..................................
58,000 1,997,000 1,727,000 4,635,000
194,000 8,880,000
95,906,000
(D) Withheld to avoid disclosing data for individual operations.
Guernsey County Farms (2012 Census) Number
Number of Farms ..................................................... 1,228
Land (2012 Census) Acres
Land Area ................................................................ Land in Farms .......................................................... Cropland .................................................................. Harvested Cropland ................................................. Pastureland ............................................................. Woodland ................................................................
334,243 143,763 51,740 43,950 56,713 41,052
Capacity (2012 Census) Bushels
On-farm Grain Storage Capacity .............................. 380,156
Livestock (2014) Number Rank
All cattle and calves ................... Milk cows ...............................
20,500 1,400
17 43
Crop (2014) Acres Harvested Yield Per Acre Production Rank
Corn ........................................ Bu. Soybeans ................................ Bu. Other Hay ............................... Ton
2,700 3,690
24,700
166.7 46.3 2.20
450,000 171,000 54,500
74 73 2
Commodity (2012 Census) Cash Receipts Commodity (2012 Census) Cash Receipts
Corn ............................................................... Soybeans ....................................................... Wheat ............................................................. Vegetables ..................................................... Fruit & Berries ................................................. Nursery & Greenhouse ................................... Total Crop ....................................................... Poultry & Eggs ................................................
1,850,000 1,335,000
28,000 221,000 173,000 348,000
7,873,000 (D)
Cattle & Calves ............................................. Milk ............................................................... Hogs & Pigs .................................................. Sheep & Goats ............................................. Total Livestock .............................................. Total Crop & Livestock ..................................
9,198,000 2,112,000
(D) 168,000
13,620,000
21,493,000
(D) Withheld to avoid disclosing data for individual operations.
76 Ohio Annual Bulletin (September 2015) USDA, National Agricultural Statistics Service
Hamilton County Farms (2012 Census) Number
Number of Farms ................................................. 295
Land (2012 Census) Acres
Land Area ............................................................ Land in Farms ...................................................... Cropland .............................................................. Harvested Cropland ............................................. Pastureland .......................................................... Woodland ............................................................
259,784 21,618 9,994 8,564 5,359 5,361
Capacity (2012 Census) Bushels
On-farm Grain Storage Capacity .......................... 699,390
Livestock (2014) Number Rank
All cattle and calves .................. Milk cows ..............................
1,500 (D)
82
(D) Withheld to avoid disclosing data for individual operations.
Crop (2014) Acres Harvested Yield Per Acre Production Rank
Corn ........................................ Bu. Soybeans ................................ Bu. Alfalfa Hay .............................. Ton Other Hay ............................... Ton
3,800 4,100
560 2,070
197.4 53.7 4.10 1.30
750,000 220,000
2,300 2,700
69 71 46 37
Commodity (2012 Census) Cash Receipts Commodity (2012 Census) Cash Receipts
Corn ............................................................... Soybeans ....................................................... Wheat ............................................................ Vegetables ..................................................... Fruit & Berries ................................................ Nursery & Greenhouse .................................. Total Crop ...................................................... Poultry & Eggs ...............................................
2,297,000 1,348,000
(D) 453,000 164,000
9,865,000 14,504,000
(D)
Cattle & Calves ............................................. Milk ............................................................... Hogs & Pigs .................................................. Sheep & Goats ............................................. Total Livestock .............................................. Total Crop & Livestock ..................................
846,000 (D)
9,000 35,000
9,141,000
23,645,000
(D) Withheld to avoid disclosing data for individual operations.
Hancock County Farms (2012 Census) Number
Number of Farms .................................................... 831
Land (2012 Census) Acres
Land Area ............................................................... Land in Farms ......................................................... Cropland ................................................................. Harvested Cropland ................................................ Pastureland ............................................................. Woodland ...............................................................
340,069 230,261 212,775 206,357
2,605 8,232
Capacity (2012 Census) Bushels
On-farm Grain Storage Capacity ............................. 4,539,950
Livestock (2014) Number Rank
All cattle and calves .................. Milk cows ..............................
4,000 1,100
75 51
Crop (2014) Acres Harvested Yield Per Acre Production Rank
Corn ........................................ Bu. Soybeans ................................ Bu. Wheat ..................................... Bu. Alfalfa Hay .............................. Ton
90,000 133,900 21,800 2,020
193.3 54.2 73.9 3.35
17,400,000 7,256,000 1,611,000
6,800
5 4 6
31
Commodity (2012 Census) Cash Receipts Commodity (2012 Census) Cash Receipts
Corn ............................................................... Soybeans ....................................................... Wheat ............................................................ Vegetables ..................................................... Fruit & Berries ................................................ Nursery & Greenhouse .................................. Total Crop ...................................................... Poultry & Eggs ...............................................
67,243,000 70,396,000 8,164,000
(D) (D)
148,000 146,881,000
(D)
Cattle & Calves ............................................. Milk ............................................................... Hogs & Pigs .................................................. Sheep & Goats ............................................. Total Livestock .............................................. Total Crop & Livestock ..................................
1,064,000 3,595,000 7,028,000
(D) 13,364,000
160,245,000
(D) Withheld to avoid disclosing data for individual operations.

Ohio Annual Bulletin (September 2015) 77 USDA, National Agricultural Statistics Service
Hardin County Farms (2012 Census) Number
Number of Farms ..................................................... 793
Land (2012 Census) Acres
Land Area ................................................................ Land in Farms .......................................................... Cropland .................................................................. Harvested Cropland ................................................. Pastureland ............................................................. Woodland ................................................................
301,059 247,839 222,562 209,046
3,252 13,004
Capacity (2012 Census) Bushels
On-farm Grain Storage Capacity .............................. 12,628,356
Livestock (2014) Number Rank
All cattle and calves ................... Milk cows ...............................
14,000 6,100
30 12
Crop (2014) Acres Harvested Yield Per Acre Production Rank
Corn ........................................ Bu. Soybeans ................................ Bu. Wheat ...................................... Bu. Alfalfa Hay .............................. Ton
95,000 116,400
8,880 3,750
167.9 53.1 68.7 5.00
15,950,000 6,186,000
610,000 18,700
7 12 21 8
Commodity (2012 Census) Cash Receipts Commodity (2012 Census) Cash Receipts
Corn ............................................................... Soybeans ....................................................... Wheat ............................................................. Vegetables ..................................................... Fruit & Berries ................................................. Nursery & Greenhouse ................................... Total Crop ....................................................... Poultry & Eggs ................................................
73,959,000 66,457,000 3,002,000
991,000 42,000
835,000 146,501,000
(D)
Cattle & Calves ............................................. Milk ............................................................... Hogs & Pigs .................................................. Sheep & Goats ............................................. Total Livestock .............................................. Total Crop & Livestock ..................................
(D) (D)
33,737,000 136,000
125,951,000
272,452,000
(D) Withheld to avoid disclosing data for individual operations.
Harrison County Farms (2012 Census) Number
Number of Farms ..................................................... 444
Land (2012 Census) Acres
Land Area ................................................................ Land in Farms .......................................................... Cropland .................................................................. Harvested Cropland ................................................. Pastureland ............................................................. Woodland ................................................................
257,492 95,387 38,067 35,420 40,478 20,216
Capacity (2012 Census) Bushels
On-farm Grain Storage Capacity .............................. 458,368
Livestock (2014) Number Rank
All cattle and calves ................... Milk cows ...............................
11,000 800
40 58
Crop (2014) Acres Harvested Yield Per Acre Production Rank
Corn ........................................ Bu. Soybeans ................................ Bu. Other Hay ............................... Ton
3,600 3,220
17,900
151.4 47.2 3.00
545,000 152,000 53,400
71 77 3
Commodity (2012 Census) Cash Receipts Commodity (2012 Census) Cash Receipts
Corn ............................................................... Soybeans ....................................................... Wheat ............................................................. Vegetables ..................................................... Fruit & Berries ................................................. Nursery & Greenhouse ................................... Total Crop ....................................................... Poultry & Eggs ................................................
2,939,000 1,404,000
99,000 58,000
(D) (D)
7,769,000 (D)
Cattle & Calves ............................................. Milk ............................................................... Hogs & Pigs .................................................. Sheep & Goats ............................................. Total Livestock .............................................. Total Crop & Livestock ..................................
4,611,000 1,481,000
(D) 444,000
10,471,000
18,240,000
(D) Withheld to avoid disclosing data for individual operations.
78 Ohio Annual Bulletin (September 2015) USDA, National Agricultural Statistics Service
Henry County Farms (2012 Census) Number
Number of Farms .................................................... 848
Land (2012 Census) Acres
Land Area ............................................................... Land in Farms ......................................................... Cropland ................................................................. Harvested Cropland ................................................ Pastureland ............................................................. Woodland ...............................................................
266,246 235,919 221,399 217,383
1,228 6,235
Capacity (2012 Census) Bushels
On-farm Grain Storage Capacity ............................. 7,018,310
Livestock (2014) Number Rank
All cattle and calves .................. Milk cows ..............................
5,900 1,700
68 38
Crop (2014) Acres Harvested Yield Per Acre Production Rank
Corn ........................................ Bu. Soybeans ................................ Bu. Wheat ..................................... Bu. Alfalfa Hay .............................. Ton
82,000 101,400 25,600 2,690
190.9 50.4 80.1 4.00
15,650,000 5,109,000 2,050,000
10,700
9 22 3
21
Commodity (2012 Census) Cash Receipts Commodity (2012 Census) Cash Receipts
Corn ............................................................... Soybeans ....................................................... Wheat ............................................................ Vegetables ..................................................... Fruit & Berries ................................................ Nursery & Greenhouse .................................. Total Crop ...................................................... Poultry & Eggs ...............................................
54,094,000 67,380,000 12,072,000 5,453,000
(D) (D)
142,496,000 25,000
Cattle & Calves ............................................. Milk ............................................................... Hogs & Pigs .................................................. Sheep & Goats ............................................. Total Livestock .............................................. Total Crop & Livestock ..................................
4,615,000 4,978,000 3,339,000
39,000 13,013,000
155,509,000
(D) Withheld to avoid disclosing data for individual operations.
Highland County Farms (2012 Census) Number
Number of Farms .................................................... 1,412
Land (2012 Census) Acres
Land Area ............................................................... Land in Farms ......................................................... Cropland ................................................................. Harvested Cropland ................................................ Pastureland ............................................................. Woodland ...............................................................
353,974 264,521 197,691 173,105 34,019 27,873
Capacity (2012 Census) Bushels
On-farm Grain Storage Capacity ............................. 8,846,856
Livestock (2014) Number Rank
All cattle and calves .................. Milk cows ..............................
19,500 1,300
18 49
Crop (2014) Acres Harvested Yield Per Acre Production Rank
Corn ........................................ Bu. Soybeans ................................ Bu. Wheat ..................................... Bu.
45,000 106,100
4,130
177.8 50.2 72.2
8,000,000 5,322,000
298,000
36 17 40
Commodity (2012 Census) Cash Receipts Commodity (2012 Census) Cash Receipts
Corn ............................................................... Soybeans ....................................................... Wheat ............................................................ Tobacco ......................................................... Vegetables ..................................................... Fruit & Berries ................................................ Nursery & Greenhouse .................................. Total Crop ......................................................
42,072,000 57,133,000 2,566,000
412,000 653,000
(D) 1,130,000
106,277,000
Poultry & Eggs .............................................. Cattle & Calves ............................................. Milk ............................................................... Hogs & Pigs .................................................. Sheep & Goats ............................................. Total Livestock .............................................. Total Crop & Livestock ..................................
77,000 12,504,000 4,155,000 4,321,000
432,000 22,313,000
128,590,000
(D) Withheld to avoid disclosing data for individual operations.
Ohio Annual Bulletin (September 2015) 79 USDA, National Agricultural Statistics Service
Hocking County Farms (2012 Census) Number
Number of Farms .................................................. 367
Land (2012 Census) Acres
Land Area ............................................................. Land in Farms ....................................................... Cropland ............................................................... Harvested Cropland .............................................. Pastureland .......................................................... Woodland .............................................................
269,649 38,085 14,048 10,972 8,419
15,061
Capacity (2012 Census) Bushels
On-farm Grain Storage Capacity ........................... 119,000
Livestock (2014) Number Rank
All cattle and calves ................... Milk cows ...............................
2,200 (D)
81
(D) Withheld to avoid disclosing data for individual operations.
Crop (2014) Acres Harvested Yield Per Acre Production Rank
Corn ........................................ Bu. Soybeans ................................ Bu. Other Hay ............................... Ton
3,300 3,090 6,870
169.7 50.5 1.60
560,000 156,000 11,000
70 74 24
Commodity (2012 Census) Cash Receipts Commodity (2012 Census) Cash Receipts
Corn ............................................................... Soybeans ....................................................... Wheat ............................................................. Vegetables ..................................................... Fruit & Berries ................................................. Nursery & Greenhouse ................................... Total Crop ....................................................... Poultry & Eggs ................................................
1,370,000 1,488,000
(D) 65,000
(D) 537,000
4,254,000 36,000
Cattle & Calves ............................................. Milk ............................................................... Hogs & Pigs .................................................. Sheep & Goats ............................................. Total Livestock .............................................. Total Crop & Livestock ..................................
595,000 (D) (D)
58,000 1,049,000
5,303,000
(D) Withheld to avoid disclosing data for individual operations.
Holmes County Farms (2012 Census) Number
Number of Farms ..................................................... 1,969
Land (2012 Census) Acres
Land Area ................................................................ Land in Farms .......................................................... Cropland .................................................................. Harvested Cropland ................................................. Pastureland ............................................................. Woodland ................................................................
270,421 220,948 124,136 110,853 50,761 43,410
Capacity (2012 Census) Bushels
On-farm Grain Storage Capacity .............................. 3,751,083
Livestock (2014) Number Rank
All cattle and calves ................... Milk cows ...............................
55,000 17,400
3 3
Crop (2014) Acres Harvested Yield Per Acre Production Rank
Corn ........................................ Bu. Soybeans ................................ Bu. Alfalfa Hay .............................. Ton
14,000 12,000 11,900
154.3 49.5 2.70
2,160,000 594,000 32,300
61 66 2
Commodity (2012 Census) Cash Receipts Commodity (2012 Census) Cash Receipts
Corn ............................................................... Soybeans ....................................................... Wheat ............................................................. Vegetables ..................................................... Fruit & Berries ................................................. Nursery & Greenhouse ................................... Total Crop ....................................................... Poultry & Eggs ................................................
23,965,000 10,286,000
720,000 1,382,000
885,000 (D)
42,791,000 42,353,000
Cattle & Calves ............................................. Milk ............................................................... Hogs & Pigs .................................................. Sheep & Goats ............................................. Total Livestock .............................................. Total Crop & Livestock ..................................
33,347,000 77,934,000 2,871,000
(D) 162,074,000
204,865,000
(D) Withheld to avoid disclosing data for individual operations.

80 Ohio Annual Bulletin (September 2015) USDA, National Agricultural Statistics Service
Huron County Farms (2012 Census) Number
Number of Farms .................................................... 865
Land (2012 Census) Acres
Land Area ............................................................... Land in Farms ......................................................... Cropland ................................................................. Harvested Cropland ................................................ Pastureland ............................................................. Woodland ...............................................................
314,557 238,291 208,716 201,373
5,160 17,851
Capacity (2012 Census) Bushels
On-farm Grain Storage Capacity ............................. 13,024,645
Livestock (2014) Number Rank
All cattle and calves .................. Milk cows ..............................
8,700 3,500
55 21
Crop (2014) Acres Harvested Yield Per Acre Production Rank
Corn ........................................ Bu. Soybeans ................................ Bu. Wheat ..................................... Bu. Alfalfa Hay .............................. Ton Other Hay ............................... Ton
57,500 105,900 12,900 2,660 1,790
155.0 45.5 63.2 2.90 3.95
8,910,000 4,815,000
815,000 7,700 7,100
33 26 15 27 28
Commodity (2012 Census) Cash Receipts Commodity (2012 Census) Cash Receipts
Corn ............................................................... Soybeans ....................................................... Wheat ............................................................ Vegetables ..................................................... Fruit & Berries ................................................ Nursery & Greenhouse .................................. Total Crop ...................................................... Poultry & Eggs ...............................................
70,093,000 53,523,000 4,434,000
23,966,000 (D)
1,059,000 154,464,000
8,618,000
Cattle & Calves ............................................. Milk ............................................................... Hogs & Pigs .................................................. Sheep & Goats ............................................. Total Livestock .............................................. Total Crop & Livestock ..................................
8,402,000 14,624,000 4,015,000
169,000 36,200,000
190,664,000
(D) Withheld to avoid disclosing data for individual operations.
Jackson County Farms (2012 Census) Number
Number of Farms .................................................... 526
Land (2012 Census) Acres
Land Area ............................................................... Land in Farms ......................................................... Cropland ................................................................. Harvested Cropland ................................................ Pastureland ............................................................. Woodland ...............................................................
268,995 71,681 27,184 21,815 25,980 19,287
Capacity (2012 Census) Bushels
On-farm Grain Storage Capacity ............................. 407,400
Livestock (2014) Number Rank
All cattle and calves .................. Milk cows ..............................
10,800 300
43 69
Crop (2014) Acres Harvested Yield Per Acre Production Rank
Corn ........................................ Bu. Soybeans ................................ Bu. Wheat ..................................... Bu. Other Hay ............................... Ton
2,800 5,850
540 14,500
137.5 50.4 68.7 2.40
385,000 295,000 37,100 34,600
76 69 58 12
Commodity (2012 Census) Cash Receipts Commodity (2012 Census) Cash Receipts
Corn ............................................................... Soybeans ....................................................... Wheat ............................................................ Tobacco ......................................................... Vegetables ..................................................... Fruit & Berries ................................................ Nursery & Greenhouse .................................. Total Crop ......................................................
854,000 1,588,000
75,000 (D)
413,000 (D) (D)
4,716,000
Poultry & Eggs .............................................. Cattle & Calves ............................................. Milk ............................................................... Hogs & Pigs .................................................. Sheep & Goats ............................................. Total Livestock .............................................. Total Crop & Livestock ..................................
(D) 4,070,000
(D) 19,000
(D) 5,958,000
10,674,000
(D) Withheld to avoid disclosing data for individual operations.

Ohio Annual Bulletin (September 2015) 81 USDA, National Agricultural Statistics Service
Jefferson County Farms (2012 Census) Number
Number of Farms ..................................................... 493
Land (2012 Census) Acres
Land Area ................................................................ Land in Farms .......................................................... Cropland .................................................................. Harvested Cropland ................................................. Pastureland ............................................................. Woodland ................................................................
261,312 68,341 25,857 21,900 22,662 20,826
Capacity (2012 Census) Bushels
On-farm Grain Storage Capacity .............................. 173,495
Livestock (2014) Number Rank
All cattle and calves ................... Milk cows ...............................
9,500 1,800
46 36
Crop (2014) Acres Harvested Yield Per Acre Production Rank
Corn ........................................ Bu. Alfalfa Hay .............................. Ton
1,400 6,370
152.9 2.70
214,000 17,200
80 9
Commodity (2012 Census) Cash Receipts Commodity (2012 Census) Cash Receipts
Corn ............................................................... Soybeans ....................................................... Wheat ............................................................. Tobacco .......................................................... Vegetables ..................................................... Fruit & Berries ................................................. Nursery & Greenhouse ................................... Total Crop .......................................................
464,000 87,000 33,000
(D) 87,000 37,000
350,000 3,788,000
Poultry & Eggs .............................................. Cattle & Calves ............................................. Milk ............................................................... Hogs & Pigs .................................................. Sheep & Goats ............................................. Total Livestock .............................................. Total Crop & Livestock ..................................
23,000 2,464,000 1,315,000
57,000 83,000
4,040,000
7,829,000
(D) Withheld to avoid disclosing data for individual operations.
Knox County Farms (2012 Census) Number
Number of Farms ..................................................... 1,374
Land (2012 Census) Acres
Land Area ................................................................ Land in Farms .......................................................... Cropland .................................................................. Harvested Cropland ................................................. Pastureland ............................................................. Woodland ................................................................
336,324 186,047 128,695 118,527 23,830 26,343
Capacity (2012 Census) Bushels
On-farm Grain Storage Capacity .............................. 5,432,290
Livestock (2014) Number Rank
All cattle and calves ................... Milk cows ...............................
17,500 3,400
23 23
Crop (2014) Acres Harvested Yield Per Acre Production Rank
Corn ........................................ Bu. Soybeans ................................ Bu. Wheat ...................................... Bu.
49,500 57,100 3,700
156.2 48.6 58.4
7,730,000 2,777,000
216,000
37 41 44
Commodity (2012 Census) Cash Receipts Commodity (2012 Census) Cash Receipts
Corn ............................................................... Soybeans ....................................................... Wheat ............................................................. Vegetables ..................................................... Fruit & Berries ................................................. Nursery & Greenhouse ................................... Total Crop ....................................................... Poultry & Eggs ................................................
40,531,000 29,465,000 1,390,000
(D) 1,274,000 2,375,000
80,210,000 17,441,000
Cattle & Calves ............................................. Milk ............................................................... Hogs & Pigs .................................................. Sheep & Goats ............................................. Total Livestock .............................................. Total Crop & Livestock ..................................
5,173,000 9,316,000 7,514,000 1,236,000
41,232,000
121,442,000
(D) Withheld to avoid disclosing data for individual operations.

82 Ohio Annual Bulletin (September 2015) USDA, National Agricultural Statistics Service
Lake County Farms (2012 Census) Number
Number of Farms ................................................. 214
Land (2012 Census) Acres
Land Area ............................................................ Land in Farms ...................................................... Cropland .............................................................. Harvested Cropland ............................................. Pastureland .......................................................... Woodland ............................................................
145,944 17,125 8,561 6,731 1,697 5,393
Capacity (2012 Census) Bushels
On-farm Grain Storage Capacity .......................... 69,900
Livestock (2014) Number Rank
All cattle and calves .................. Milk cows ..............................
500 (D)
86
(D) Withheld to avoid disclosing data for individual operations.
Crop (2014) Acres Harvested Yield Per Acre Production Rank
Other Hay ............................... Ton 1,810 1.80 3,300 33
Commodity (2012 Census) Cash Receipts Commodity (2012 Census) Cash Receipts
Corn ............................................................... Soybeans ....................................................... Wheat ............................................................ Vegetables ..................................................... Fruit & Berries ................................................ Nursery & Greenhouse .................................. Total Crop ...................................................... Poultry & Eggs ...............................................
186,000 260,000 19,000
623,000 735,000
79,183,000 81,334,000
(D)
Cattle & Calves ............................................. Milk ............................................................... Hogs & Pigs .................................................. Sheep & Goats ............................................. Total Livestock .............................................. Total Crop & Livestock ..................................
241,000 (D)
23,000 63,000
489,000
81,823,000
(D) Withheld to avoid disclosing data for individual operations.
Lawrence County Farms (2012 Census) Number
Number of Farms ................................................. 592
Land (2012 Census) Acres
Land Area ............................................................ Land in Farms ...................................................... Cropland .............................................................. Harvested Cropland ............................................. Pastureland .......................................................... Woodland ............................................................
290,157 64,575 16,954 12,181 31,677 26,118
Capacity (2012 Census) Bushels
On-farm Grain Storage Capacity .......................... 106,800
Livestock (2014) Number Rank
All cattle and calves .................. Milk cows ..............................
5,500 (D)
69
(D) Withheld to avoid disclosing data for individual operations.
Crop (2014) Acres Harvested Yield Per Acre Production Rank
Corn ........................................ Bu. Soybeans ................................ Bu. Alfalfa Hay .............................. Ton Other Hay ............................... Ton
1,100 1,670
860 8,150
134.5 34.7 1.85 2.10
148,000 58,000 1,600
17,000
81 79 48 22
Commodity (2012 Census) Cash Receipts Commodity (2012 Census) Cash Receipts
Corn ............................................................... Soybeans ....................................................... Wheat ............................................................ Tobacco ......................................................... Vegetables ..................................................... Fruit & Berries ................................................ Nursery & Greenhouse .................................. Total Crop ......................................................
560,000 461,000
(D) (D)
288,000 (D)
210,000 2,777,000
Poultry & Eggs .............................................. Cattle & Calves ............................................. Milk ............................................................... Hogs & Pigs .................................................. Sheep & Goats ............................................. Total Livestock .............................................. Total Crop & Livestock ..................................
20,000 1,584,000
(D) 34,000 54,000
2,072,000
4,848,000
(D) Withheld to avoid disclosing data for individual operations.
Ohio Annual Bulletin (September 2015) 83 USDA, National Agricultural Statistics Service
Licking County Farms (2012 Census) Number
Number of Farms ..................................................... 1,484
Land (2012 Census) Acres
Land Area ................................................................ Land in Farms .......................................................... Cropland .................................................................. Harvested Cropland ................................................. Pastureland ............................................................. Woodland ................................................................
436,795 224,015 161,360 153,019 28,917 27,237
Capacity (2012 Census) Bushels
On-farm Grain Storage Capacity .............................. 8,528,523
Livestock (2014) Number Rank
All cattle and calves ................... Milk cows ...............................
22,500 3,400
14 23
Crop (2014) Acres Harvested Yield Per Acre Production Rank
Corn ........................................ Bu. Soybeans ................................ Bu. Wheat ...................................... Bu.
59,500 68,300 5,160
153.6 48.5 62.6
9,140,000 3,311,000
323,000
31 37 38
Commodity (2012 Census) Cash Receipts Commodity (2012 Census) Cash Receipts
Corn ............................................................... Soybeans ....................................................... Wheat ............................................................. Vegetables ..................................................... Fruit & Berries ................................................. Nursery & Greenhouse ................................... Total Crop ....................................................... Poultry & Eggs ................................................
48,501,000 34,704,000 2,066,000
732,000 1,846,000
10,026,000 101,728,000
(D)
Cattle & Calves ............................................. Milk ............................................................... Hogs & Pigs .................................................. Sheep & Goats ............................................. Total Livestock .............................................. Total Crop & Livestock ..................................
(D) 7,764,000
(D) 385,000
93,076,000
194,804,000
(D) Withheld to avoid disclosing data for individual operations.
Logan County Farms (2012 Census) Number
Number of Farms ..................................................... 868
Land (2012 Census) Acres
Land Area ................................................................ Land in Farms .......................................................... Cropland .................................................................. Harvested Cropland ................................................. Pastureland ............................................................. Woodland ................................................................
293,397 212,937 177,746 164,639
9,730 16,668
Capacity (2012 Census) Bushels
On-farm Grain Storage Capacity .............................. 10,247,657
Livestock (2014) Number Rank
All cattle and calves ................... Milk cows ...............................
9,500 2,400
46 33
Crop (2014) Acres Harvested Yield Per Acre Production Rank
Corn ........................................ Bu. Soybeans ................................ Bu. Wheat ...................................... Bu. Alfalfa Hay .............................. Ton
69,000 89,500 4,840 6,130
165.2 50.4 78.1 3.60
11,400,000 4,514,000
378,000 22,000
27 29 35 4
Commodity (2012 Census) Cash Receipts Commodity (2012 Census) Cash Receipts
Corn ............................................................... Soybeans ....................................................... Wheat ............................................................. Vegetables ..................................................... Fruit & Berries ................................................. Nursery & Greenhouse ................................... Total Crop ....................................................... Poultry & Eggs ................................................
63,287,000 53,406,000 2,251,000
640,000 92,000
(D) 122,173,000
(D)
Cattle & Calves ............................................. Milk ............................................................... Hogs & Pigs .................................................. Sheep & Goats ............................................. Total Livestock .............................................. Total Crop & Livestock ..................................
3,969,000 10,446,000 5,520,000
297,000 25,742,000
147,915,000
(D) Withheld to avoid disclosing data for individual operations.
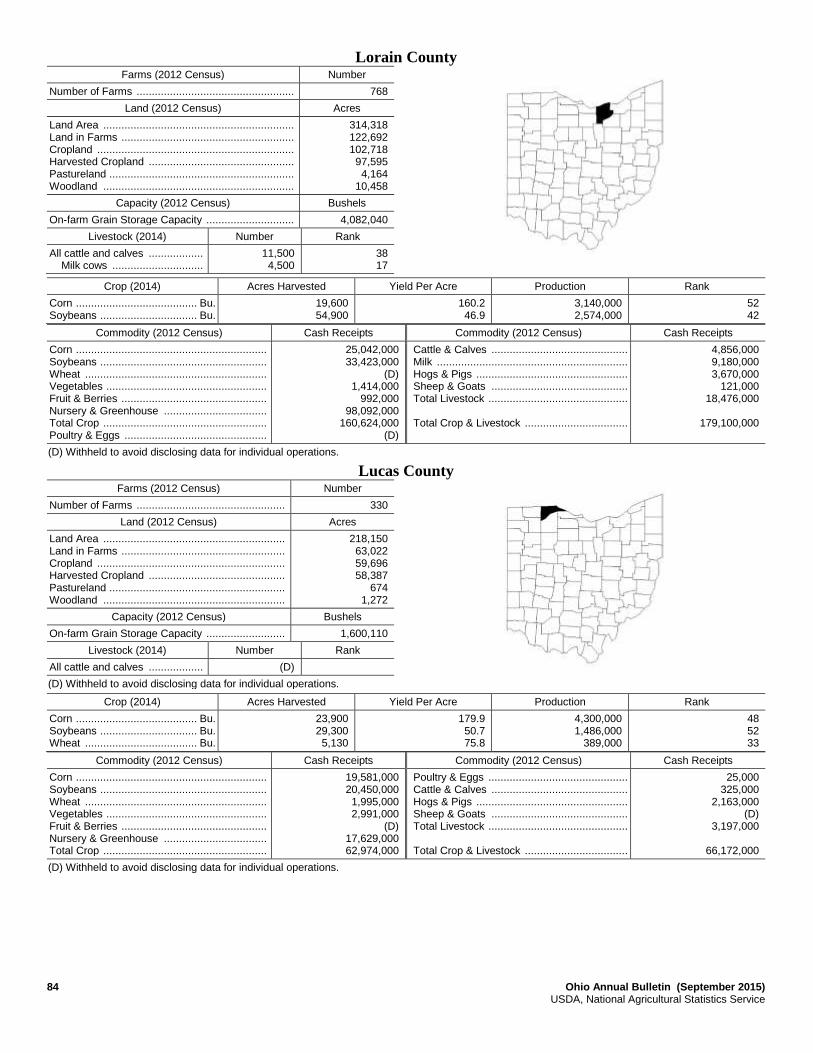
84 Ohio Annual Bulletin (September 2015) USDA, National Agricultural Statistics Service
Lorain County Farms (2012 Census) Number
Number of Farms .................................................... 768
Land (2012 Census) Acres
Land Area ............................................................... Land in Farms ......................................................... Cropland ................................................................. Harvested Cropland ................................................ Pastureland ............................................................. Woodland ...............................................................
314,318 122,692 102,718 97,595 4,164
10,458
Capacity (2012 Census) Bushels
On-farm Grain Storage Capacity ............................. 4,082,040
Livestock (2014) Number Rank
All cattle and calves .................. Milk cows ..............................
11,500 4,500
38 17
Crop (2014) Acres Harvested Yield Per Acre Production Rank
Corn ........................................ Bu. Soybeans ................................ Bu.
19,600 54,900
160.2 46.9
3,140,000 2,574,000
52 42
Commodity (2012 Census) Cash Receipts Commodity (2012 Census) Cash Receipts
Corn ............................................................... Soybeans ....................................................... Wheat ............................................................ Vegetables ..................................................... Fruit & Berries ................................................ Nursery & Greenhouse .................................. Total Crop ...................................................... Poultry & Eggs ...............................................
25,042,000 33,423,000
(D) 1,414,000
992,000 98,092,000
160,624,000 (D)
Cattle & Calves ............................................. Milk ............................................................... Hogs & Pigs .................................................. Sheep & Goats ............................................. Total Livestock .............................................. Total Crop & Livestock ..................................
4,856,000 9,180,000 3,670,000
121,000 18,476,000
179,100,000
(D) Withheld to avoid disclosing data for individual operations.
Lucas County Farms (2012 Census) Number
Number of Farms ................................................. 330
Land (2012 Census) Acres
Land Area ............................................................ Land in Farms ...................................................... Cropland .............................................................. Harvested Cropland ............................................. Pastureland .......................................................... Woodland ............................................................
218,150 63,022 59,696 58,387
674 1,272
Capacity (2012 Census) Bushels
On-farm Grain Storage Capacity .......................... 1,600,110
Livestock (2014) Number Rank
All cattle and calves .................. (D)
(D) Withheld to avoid disclosing data for individual operations.
Crop (2014) Acres Harvested Yield Per Acre Production Rank
Corn ........................................ Bu. Soybeans ................................ Bu. Wheat ..................................... Bu.
23,900 29,300 5,130
179.9 50.7 75.8
4,300,000 1,486,000
389,000
48 52 33
Commodity (2012 Census) Cash Receipts Commodity (2012 Census) Cash Receipts
Corn ............................................................... Soybeans ....................................................... Wheat ............................................................ Vegetables ..................................................... Fruit & Berries ................................................ Nursery & Greenhouse .................................. Total Crop ......................................................
19,581,000 20,450,000 1,995,000 2,991,000
(D) 17,629,000 62,974,000
Poultry & Eggs .............................................. Cattle & Calves ............................................. Hogs & Pigs .................................................. Sheep & Goats ............................................. Total Livestock .............................................. Total Crop & Livestock ..................................
25,000 325,000
2,163,000 (D)
3,197,000
66,172,000
(D) Withheld to avoid disclosing data for individual operations.

Ohio Annual Bulletin (September 2015) 85 USDA, National Agricultural Statistics Service
Madison County Farms (2012 Census) Number
Number of Farms ..................................................... 699
Land (2012 Census) Acres
Land Area ................................................................ Land in Farms .......................................................... Cropland .................................................................. Harvested Cropland ................................................. Pastureland ............................................................. Woodland ................................................................
298,159 263,275 244,231 235,000
7,580 5,733
Capacity (2012 Census) Bushels
On-farm Grain Storage Capacity .............................. 15,869,387
Livestock (2014) Number Rank
All cattle and calves ................... Milk cows ...............................
11,000 3,000
40 26
Crop (2014) Acres Harvested Yield Per Acre Production Rank
Corn ........................................ Bu. Soybeans ................................ Bu. Wheat ...................................... Bu. Alfalfa Hay .............................. Ton Other Hay ............................... Ton
107,000 122,300
7,000 2,250 2,090
170.6 54.3 76.7 4.10 2.85
18,250,000 6,644,000
537,000 9,200 6,000
4 6
23 25 30
Commodity (2012 Census) Cash Receipts Commodity (2012 Census) Cash Receipts
Corn ............................................................... Soybeans ....................................................... Wheat ............................................................. Vegetables ..................................................... Fruit & Berries ................................................. Nursery & Greenhouse ................................... Total Crop ....................................................... Poultry & Eggs ................................................
84,396,000 64,042,000 3,215,000
437,000 22,000
246,000 153,819,000
26,000
Cattle & Calves ............................................. Milk ............................................................... Hogs & Pigs .................................................. Sheep & Goats ............................................. Total Livestock .............................................. Total Crop & Livestock ..................................
7,309,000 20,979,000 9,234,000
59,000 39,965,000
193,784,000
Mahoning County Farms (2012 Census) Number
Number of Farms ..................................................... 578
Land (2012 Census) Acres
Land Area ................................................................ Land in Farms .......................................................... Cropland .................................................................. Harvested Cropland ................................................. Pastureland ............................................................. Woodland ................................................................
263,361 74,966 54,494 51,384 9,123 8,985
Capacity (2012 Census) Bushels
On-farm Grain Storage Capacity .............................. 1,504,570
Livestock (2014) Number Rank
All cattle and calves ................... Milk cows ...............................
14,000 5,200
30 15
Crop (2014) Acres Harvested Yield Per Acre Production Rank
Corn ........................................ Bu. Wheat ...................................... Bu. Alfalfa Hay .............................. Ton
11,800 2,580 2,140
149.2 54.3 3.00
1,760,000 140,000
6,400
65 50 33
Commodity (2012 Census) Cash Receipts Commodity (2012 Census) Cash Receipts
Corn ............................................................... Soybeans ....................................................... Wheat ............................................................. Vegetables ..................................................... Fruit & Berries ................................................. Nursery & Greenhouse ................................... Total Crop ....................................................... Poultry & Eggs ................................................
11,633,000 10,464,000
882,000 2,659,000 1,297,000 1,360,000
30,032,000 7,046,000
Cattle & Calves ............................................. Milk ............................................................... Hogs & Pigs .................................................. Sheep & Goats ............................................. Total Livestock .............................................. Total Crop & Livestock ..................................
4,839,000 22,779,000
120,000 32,000
35,417,000
65,449,000

86 Ohio Annual Bulletin (September 2015) USDA, National Agricultural Statistics Service
Marion County Farms (2012 Census) Number
Number of Farms .................................................... 578
Land (2012 Census) Acres
Land Area ............................................................... Land in Farms ......................................................... Cropland ................................................................. Harvested Cropland ................................................ Pastureland ............................................................. Woodland ...............................................................
258,404 189,210 174,829 163,671
2,869 6,684
Capacity (2012 Census) Bushels
On-farm Grain Storage Capacity ............................. 9,706,505
Livestock (2014) Number Rank
All cattle and calves .................. Milk cows ..............................
6,300 3,300
66 25
Crop (2014) Acres Harvested Yield Per Acre Production Rank
Corn ........................................ Bu. Soybeans ................................ Bu. Wheat ..................................... Bu.
58,500 107,800
6,680
171.8 50.7 74.0
10,050,000 5,465,000
494,000
29 15 25
Commodity (2012 Census) Cash Receipts Commodity (2012 Census) Cash Receipts
Corn ............................................................... Soybeans ....................................................... Wheat ............................................................ Vegetables ..................................................... Fruit & Berries ................................................ Nursery & Greenhouse .................................. Total Crop ...................................................... Poultry & Eggs ...............................................
53,917,000 54,605,000 2,787,000
(D) 104,000
(D) 112,350,000
(D)
Cattle & Calves ............................................. Milk ............................................................... Hogs & Pigs .................................................. Sheep & Goats ............................................. Total Livestock .............................................. Total Crop & Livestock ..................................
1,845,000 12,192,000 23,856,000
(D) 39,080,000
151,430,000
(D) Withheld to avoid disclosing data for individual operations.
Medina County Farms (2012 Census) Number
Number of Farms .................................................... 920
Land (2012 Census) Acres
Land Area ............................................................... Land in Farms ......................................................... Cropland ................................................................. Harvested Cropland ................................................ Pastureland ............................................................. Woodland ...............................................................
269,691 94,978 72,363 69,073 7,264
10,015
Capacity (2012 Census) Bushels
On-farm Grain Storage Capacity ............................. 2,553,540
Livestock (2014) Number Rank
All cattle and calves .................. Milk cows ..............................
9,200 2,700
50 32
Crop (2014) Acres Harvested Yield Per Acre Production Rank
Corn ........................................ Bu. Soybeans ................................ Bu. Wheat ..................................... Bu. Alfalfa Hay .............................. Ton Other Hay ............................... Ton
15,800 31,200 2,510 4,160 7,890
157.6 46.0 57.4 3.60 3.10
2,490,000 1,435,000
144,000 15,000 24,400
60 54 48 14 19
Commodity (2012 Census) Cash Receipts Commodity (2012 Census) Cash Receipts
Corn ............................................................... Soybeans ....................................................... Wheat ............................................................ Tobacco ......................................................... Vegetables ..................................................... Fruit & Berries ................................................ Nursery & Greenhouse .................................. Total Crop ......................................................
14,433,000 16,086,000
679,000 (D)
1,095,000 672,000
6,659,000 42,451,000
Poultry & Eggs .............................................. Cattle & Calves ............................................. Milk ............................................................... Hogs & Pigs .................................................. Sheep & Goats ............................................. Total Livestock .............................................. Total Crop & Livestock ..................................
(D) 6,722,000 9,767,000
168,000 154,000
18,081,000
60,533,000
(D) Withheld to avoid disclosing data for individual operations.

Ohio Annual Bulletin (September 2015) 87 USDA, National Agricultural Statistics Service
Meigs County Farms (2012 Census) Number
Number of Farms ..................................................... 588
Land (2012 Census) Acres
Land Area ................................................................ Land in Farms .......................................................... Cropland .................................................................. Harvested Cropland ................................................. Pastureland ............................................................. Woodland ................................................................
275,265 75,801 24,620 20,269 26,208 29,175
Capacity (2012 Census) Bushels
On-farm Grain Storage Capacity .............................. 176,670
Livestock (2014) Number Rank
All cattle and calves ................... Milk cows ...............................
9,500 1,900
46 35
Crop (2014) Acres Harvested Yield Per Acre Production Rank
Corn ........................................ Bu. Soybeans ................................ Bu. Alfalfa Hay .............................. Ton Other Hay ............................... Ton
2,700 2,990 1,920
13,700
151.9 51.5 2.95 2.20
410,000 154,000
5,700 30,000
75 75 36 15
Commodity (2012 Census) Cash Receipts Commodity (2012 Census) Cash Receipts
Corn ............................................................... Soybeans ....................................................... Wheat ............................................................. Vegetables ..................................................... Fruit & Berries ................................................. Nursery & Greenhouse ................................... Total Crop ....................................................... Poultry & Eggs ................................................
1,819,000 (D) (D)
1,974,000 (D)
2,917,000 9,671,000
99,000
Cattle & Calves ............................................. Milk ............................................................... Hogs & Pigs .................................................. Sheep & Goats ............................................. Total Livestock .............................................. Total Crop & Livestock ..................................
2,016,000 2,385,000
27,000 29,000
4,807,000
14,478,000
(D) Withheld to avoid disclosing data for individual operations.
Mercer County Farms (2012 Census) Number
Number of Farms ..................................................... 1,208
Land (2012 Census) Acres
Land Area ................................................................ Land in Farms .......................................................... Cropland .................................................................. Harvested Cropland ................................................. Pastureland ............................................................. Woodland ................................................................
295,967 273,152 248,701 242,939
2,930 10,312
Capacity (2012 Census) Bushels
On-farm Grain Storage Capacity .............................. 17,334,457
Livestock (2014) Number Rank
All cattle and calves ................... Milk cows ...............................
76,000 20,000
2 2
Crop (2014) Acres Harvested Yield Per Acre Production Rank
Corn ........................................ Bu. Soybeans ................................ Bu. Wheat ...................................... Bu. Alfalfa Hay .............................. Ton
97,000 101,900 15,600 3,160
193.8 62.2 84.4 6.40
18,800,000 6,336,000 1,316,000
20,200
2 9
10 7
Commodity (2012 Census) Cash Receipts Commodity (2012 Census) Cash Receipts
Corn ............................................................... Soybeans ....................................................... Wheat ............................................................. Vegetables ..................................................... Fruit & Berries ................................................. Nursery & Greenhouse ................................... Total Crop ....................................................... Poultry & Eggs ................................................
72,712,000 67,481,000 8,892,000
(D) (D)
476,000 153,143,000 229,740,000
Cattle & Calves ............................................. Milk ............................................................... Hogs & Pigs .................................................. Sheep & Goats ............................................. Total Livestock .............................................. Total Crop & Livestock ..................................
51,042,000 60,847,000
100,307,000 (D)
443,223,000
596,366,000
(D) Withheld to avoid disclosing data for individual operations.

88 Ohio Annual Bulletin (September 2015) USDA, National Agricultural Statistics Service
Miami County Farms (2012 Census) Number
Number of Farms .................................................... 1,068
Land (2012 Census) Acres
Land Area ............................................................... Land in Farms ......................................................... Cropland ................................................................. Harvested Cropland ................................................ Pastureland ............................................................. Woodland ...............................................................
260,211 184,233 164,828 160,378
6,600 7,342
Capacity (2012 Census) Bushels
On-farm Grain Storage Capacity ............................. 6,884,490
Livestock (2014) Number Rank
All cattle and calves .................. Milk cows ..............................
11,000 1,400
40 43
Crop (2014) Acres Harvested Yield Per Acre Production Rank
Corn ........................................ Bu. Soybeans ................................ Bu. Wheat ..................................... Bu. Other Hay ............................... Ton
71,000 82,700 6,450 1,950
178.9 54.6 71.9 2.90
12,700,000 4,518,000
464,000 5,700
19 28 29 31
Commodity (2012 Census) Cash Receipts Commodity (2012 Census) Cash Receipts
Corn ............................................................... Soybeans ....................................................... Wheat ............................................................ Vegetables ..................................................... Fruit & Berries ................................................ Nursery & Greenhouse .................................. Total Crop ...................................................... Poultry & Eggs ...............................................
54,195,000 41,137,000 2,237,000
(D) (D) (D)
101,093,000 (D)
Cattle & Calves ............................................. Milk ............................................................... Hogs & Pigs .................................................. Sheep & Goats ............................................. Total Livestock .............................................. Total Crop & Livestock ..................................
2,506,000 2,882,000
(D) 187,000
8,909,000
110,002,000
(D) Withheld to avoid disclosing data for individual operations.
Monroe County Farms (2012 Census) Number
Number of Farms .................................................... 823
Land (2012 Census) Acres
Land Area ............................................................... Land in Farms ......................................................... Cropland ................................................................. Harvested Cropland ................................................ Pastureland ............................................................. Woodland ...............................................................
291,661 111,161 29,697 24,654 48,865 41,892
Capacity (2012 Census) Bushels
On-farm Grain Storage Capacity ............................. 194,270
Livestock (2014) Number Rank
All cattle and calves .................. Milk cows ..............................
13,000 1,400
35 43
Crop (2014) Acres Harvested Yield Per Acre Production Rank
Corn ........................................ Bu. Alfalfa Hay .............................. Ton Other Hay ............................... Ton
500 3,610
17,100
146.0 3.30 2.70
73,000 11,900 46,500
83 19 7
Commodity (2012 Census) Cash Receipts Commodity (2012 Census) Cash Receipts
Corn ............................................................... Soybeans ....................................................... Wheat ............................................................ Tobacco ......................................................... Vegetables ..................................................... Fruit & Berries ................................................ Nursery & Greenhouse .................................. Total Crop ......................................................
443,000 (D) (D) (D)
148,000 (D)
417,000 4,428,000
Poultry & Eggs .............................................. Cattle & Calves ............................................. Milk ............................................................... Hogs & Pigs .................................................. Sheep & Goats ............................................. Total Livestock .............................................. Total Crop & Livestock ..................................
46,000 4,329,000 4,109,000
28,000 441,000
9,244,000
13,672,000
(D) Withheld to avoid disclosing data for individual operations.

Ohio Annual Bulletin (September 2015) 89 USDA, National Agricultural Statistics Service
Montgomery County Farms (2012 Census) Number
Number of Farms ..................................................... 770
Land (2012 Census) Acres
Land Area ................................................................ Land in Farms .......................................................... Cropland .................................................................. Harvested Cropland ................................................. Pastureland ............................................................. Woodland ................................................................
295,396 124,105 104,672 102,101
5,332 5,135
Capacity (2012 Census) Bushels
On-farm Grain Storage Capacity .............................. 4,564,867
Livestock (2014) Number Rank
All cattle and calves ................... Milk cows ...............................
9,000 500
52 64
Crop (2014) Acres Harvested Yield Per Acre Production Rank
Corn ........................................ Bu. Soybeans ................................ Bu.
34,200 42,800
187.1 57.0
6,400,000 2,440,000
40 43
Commodity (2012 Census) Cash Receipts Commodity (2012 Census) Cash Receipts
Corn ............................................................... Soybeans ....................................................... Wheat ............................................................. Vegetables ..................................................... Fruit & Berries ................................................. Nursery & Greenhouse ................................... Total Crop ....................................................... Poultry & Eggs ................................................
27,263,000 22,271,000
892,000 272,000
(D) 12,806,000 64,974,000
86,000
Cattle & Calves ............................................. Milk ............................................................... Hogs & Pigs .................................................. Sheep & Goats ............................................. Total Livestock .............................................. Total Crop & Livestock ..................................
7,976,000 1,620,000
(D) 40,000
11,791,000
76,765,000
(D) Withheld to avoid disclosing data for individual operations.
Morgan County Farms (2012 Census) Number
Number of Farms ..................................................... 510
Land (2012 Census) Acres
Land Area ................................................................ Land in Farms .......................................................... Cropland .................................................................. Harvested Cropland ................................................. Pastureland ............................................................. Woodland ................................................................
266,511 95,174 29,975 21,907 43,277 30,076
Capacity (2012 Census) Bushels
On-farm Grain Storage Capacity .............................. 347,017
Livestock (2014) Number Rank
All cattle and calves ................... Milk cows ...............................
13,000 1,100
35 51
Crop (2014) Acres Harvested Yield Per Acre Production Rank
Corn ........................................ Bu. Alfalfa Hay .............................. Ton Other Hay ............................... Ton
3,200 3,960
15,700
160.0 3.00 2.45
512,000 11,900 38,300
72 19 10
Commodity (2012 Census) Cash Receipts Commodity (2012 Census) Cash Receipts
Corn ............................................................... Soybeans ....................................................... Wheat ............................................................. Vegetables ..................................................... Fruit & Berries ................................................. Nursery & Greenhouse ................................... Total Crop ....................................................... Poultry & Eggs ................................................
1,750,000 (D)
33,000 65,000
164,000 673,000
5,078,000 36,000
Cattle & Calves ............................................. Milk ............................................................... Hogs & Pigs .................................................. Sheep & Goats ............................................. Total Livestock .............................................. Total Crop & Livestock ..................................
4,289,000 2,650,000
13,000 75,000
7,150,000
12,227,000
(D) Withheld to avoid disclosing data for individual operations.

90 Ohio Annual Bulletin (September 2015) USDA, National Agricultural Statistics Service
Morrow County Farms (2012 Census) Number
Number of Farms .................................................... 824
Land (2012 Census) Acres
Land Area ............................................................... Land in Farms ......................................................... Cropland ................................................................. Harvested Cropland ................................................ Pastureland ............................................................. Woodland ...............................................................
259,925 167,736 139,176 133,200
9,298 15,189
Capacity (2012 Census) Bushels
On-farm Grain Storage Capacity ............................. 8,254,140
Livestock (2014) Number Rank
All cattle and calves .................. Milk cows ..............................
9,700 1,700
45 38
Crop (2014) Acres Harvested Yield Per Acre Production Rank
Corn ........................................ Bu. Soybeans ................................ Bu.
46,500 68,700
153.8 46.5
7,150,000 3,194,000
38 40
Commodity (2012 Census) Cash Receipts Commodity (2012 Census) Cash Receipts
Corn ............................................................... Soybeans ....................................................... Wheat ............................................................ Vegetables ..................................................... Fruit & Berries ................................................ Nursery & Greenhouse .................................. Total Crop ...................................................... Poultry & Eggs ...............................................
44,474,000 42,115,000 3,778,000
492,000 (D)
316,000 93,344,000
56,000
Cattle & Calves ............................................. Milk ............................................................... Hogs & Pigs .................................................. Sheep & Goats ............................................. Total Livestock .............................................. Total Crop & Livestock ..................................
4,845,000 5,456,000
27,304,000 487,000
38,371,000
131,715,000
(D) Withheld to avoid disclosing data for individual operations.
Muskingum County Farms (2012 Census) Number
Number of Farms .................................................... 1,259
Land (2012 Census) Acres
Land Area ............................................................... Land in Farms ......................................................... Cropland ................................................................. Harvested Cropland ................................................ Pastureland ............................................................. Woodland ...............................................................
425,348 173,269 79,187 73,324 60,090 40,619
Capacity (2012 Census) Bushels
On-farm Grain Storage Capacity ............................. 1,697,407
Livestock (2014) Number Rank
All cattle and calves .................. Milk cows ..............................
30,000 1,500
7 42
Crop (2014) Acres Harvested Yield Per Acre Production Rank
Corn ........................................ Bu. Soybeans ................................ Bu. Wheat ..................................... Bu. Alfalfa Hay .............................. Ton Other Hay ............................... Ton
17,500 15,900 1,200 4,590
29,500
156.6 50.3 64.2 3.65 2.65
2,740,000 799,000 77,000 16,700 77,800
57 62 54 11 1
Commodity (2012 Census) Cash Receipts Commodity (2012 Census) Cash Receipts
Corn ............................................................... Soybeans ....................................................... Wheat ............................................................ Vegetables ..................................................... Fruit & Berries ................................................ Nursery & Greenhouse .................................. Total Crop ...................................................... Poultry & Eggs ...............................................
15,236,000 8,213,000
366,000 291,000 478,000
1,203,000 30,122,000
(D)
Cattle & Calves ............................................. Milk ............................................................... Hogs & Pigs .................................................. Sheep & Goats ............................................. Total Livestock .............................................. Total Crop & Livestock ..................................
17,158,000 3,828,000 3,535,000
329,000 27,979,000
58,101,000
(D) Withheld to avoid disclosing data for individual operations.

Ohio Annual Bulletin (September 2015) 91 USDA, National Agricultural Statistics Service
Noble County Farms (2012 Census) Number
Number of Farms .................................................. 595
Land (2012 Census) Acres
Land Area ............................................................. Land in Farms ....................................................... Cropland ............................................................... Harvested Cropland .............................................. Pastureland .......................................................... Woodland .............................................................
254,728 86,117 28,794 24,074 43,860 21,188
Capacity (2012 Census) Bushels
On-farm Grain Storage Capacity ........................... 58,970
Livestock (2014) Number Rank
All cattle and calves ................... Milk cows ...............................
12,000 (D)
37
(D) Withheld to avoid disclosing data for individual operations.
Crop (2014) Acres Harvested Yield Per Acre Production Rank
Corn ........................................ Bu. Alfalfa Hay .............................. Ton Other Hay ............................... Ton
800 2,660
14,000
156.3 1.90 2.15
125,000 5,100
30,100
82 37 14
Commodity (2012 Census) Cash Receipts Commodity (2012 Census) Cash Receipts
Corn ............................................................... Wheat ............................................................. Vegetables ..................................................... Fruit & Berries ................................................. Nursery & Greenhouse ................................... Total Crop ....................................................... Poultry & Eggs ................................................
324,000 (D) (D)
26,000 (D)
3,619,000 22,000
Cattle & Calves ............................................. Milk ............................................................... Hogs & Pigs .................................................. Sheep & Goats ............................................. Total Livestock .............................................. Total Crop & Livestock ..................................
5,563,000 (D)
39,000 227,000
6,141,000
9,760,000
(D) Withheld to avoid disclosing data for individual operations.
Ottawa County Farms (2012 Census) Number
Number of Farms .................................................. 620
Land (2012 Census) Acres
Land Area ............................................................. Land in Farms ....................................................... Cropland ............................................................... Harvested Cropland .............................................. Pastureland .......................................................... Woodland .............................................................
163,171 112,677 103,623 97,054 1,000 3,927
Capacity (2012 Census) Bushels
On-farm Grain Storage Capacity ........................... 1,975,554
Livestock (2014) Number Rank
All cattle and calves ................... Milk cows ...............................
1,200 (D)
84
(D) Withheld to avoid disclosing data for individual operations.
Crop (2014) Acres Harvested Yield Per Acre Production Rank
Corn ........................................ Bu. Soybeans ................................ Bu. Wheat ...................................... Bu. Alfalfa Hay .............................. Ton
22,800 66,700 5,600 3,950
160.5 50.8 72.3 4.20
3,660,000 3,389,000
405,000 16,500
50 36 31 12
Commodity (2012 Census) Cash Receipts Commodity (2012 Census) Cash Receipts
Corn ............................................................... Soybeans ....................................................... Wheat ............................................................. Vegetables ..................................................... Fruit & Berries ................................................. Nursery & Greenhouse ................................... Total Crop .......................................................
23,803,000 41,871,000 1,813,000 6,429,000
(D) (D)
77,847,000
Poultry & Eggs .............................................. Cattle & Calves ............................................. Hogs & Pigs .................................................. Sheep & Goats ............................................. Total Livestock .............................................. Total Crop & Livestock ..................................
18,000 764,000 204,000
(D) 1,205,000
79,052,000
(D) Withheld to avoid disclosing data for individual operations.

92 Ohio Annual Bulletin (September 2015) USDA, National Agricultural Statistics Service
Paulding County Farms (2012 Census) Number
Number of Farms .................................................... 676
Land (2012 Census) Acres
Land Area ............................................................... Land in Farms ......................................................... Cropland ................................................................. Harvested Cropland ................................................ Pastureland ............................................................. Woodland ...............................................................
266,521 220,878 205,293 194,725
1,468 7,372
Capacity (2012 Census) Bushels
On-farm Grain Storage Capacity ............................. 7,179,840
Livestock (2014) Number Rank
All cattle and calves .................. Milk cows ..............................
8,000 7,900
60 8
Crop (2014) Acres Harvested Yield Per Acre Production Rank
Corn ........................................ Bu. Soybeans ................................ Bu. Wheat ..................................... Bu. Alfalfa Hay .............................. Ton
61,000 112,900 27,900 1,260
191.8 55.7 74.3 2.55
11,700,000 6,289,000 2,074,000
3,200
25 11 2
44
Commodity (2012 Census) Cash Receipts Commodity (2012 Census) Cash Receipts
Corn ............................................................... Soybeans ....................................................... Wheat ............................................................ Vegetables ..................................................... Fruit & Berries ................................................ Nursery & Greenhouse .................................. Total Crop ...................................................... Poultry & Eggs ...............................................
36,460,000 56,942,000 8,654,000
8,000 (D) (D)
102,955,000 (D)
Cattle & Calves ............................................. Milk ............................................................... Hogs & Pigs .................................................. Sheep & Goats ............................................. Total Livestock .............................................. Total Crop & Livestock ..................................
3,493,000 33,089,000
(D) 32,000
84,205,000
187,160,000
(D) Withheld to avoid disclosing data for individual operations.
Perry County Farms (2012 Census) Number
Number of Farms .................................................... 699
Land (2012 Census) Acres
Land Area ............................................................... Land in Farms ......................................................... Cropland ................................................................. Harvested Cropland ................................................ Pastureland ............................................................. Woodland ...............................................................
261,112 107,224 67,787 61,138 21,715 17,982
Capacity (2012 Census) Bushels
On-farm Grain Storage Capacity ............................. 2,594,700
Livestock (2014) Number Rank
All cattle and calves .................. Milk cows ..............................
9,000 500
52 64
Crop (2014) Acres Harvested Yield Per Acre Production Rank
Corn ........................................ Bu. Soybeans ................................ Bu. Wheat ..................................... Bu. Other Hay ............................... Ton
19,100 17,300 1,080 7,750
157.6 47.9 45.8 1.95
3,010,000 829,000 49,500 15,200
54 61 56 23
Commodity (2012 Census) Cash Receipts Commodity (2012 Census) Cash Receipts
Corn ............................................................... Soybeans ....................................................... Wheat ............................................................ Vegetables ..................................................... Fruit & Berries ................................................ Nursery & Greenhouse .................................. Total Crop ...................................................... Poultry & Eggs ...............................................
16,028,000 10,908,000
(D) (D)
87,000 (D)
30,514,000 29,000
Cattle & Calves ............................................. Milk ............................................................... Hogs & Pigs .................................................. Sheep & Goats ............................................. Total Livestock .............................................. Total Crop & Livestock ..................................
(D) 258,000
(D) 143,000
6,585,000
37,099,000
(D) Withheld to avoid disclosing data for individual operations.

Ohio Annual Bulletin (September 2015) 93 USDA, National Agricultural Statistics Service
Pickaway County Farms (2012 Census) Number
Number of Farms ..................................................... 803
Land (2012 Census) Acres
Land Area ................................................................ Land in Farms .......................................................... Cropland .................................................................. Harvested Cropland ................................................. Pastureland ............................................................. Woodland ................................................................
320,845 293,684 265,843 250,218
9,751 10,104
Capacity (2012 Census) Bushels
On-farm Grain Storage Capacity .............................. 16,892,090
Livestock (2014) Number Rank
All cattle and calves ................... Milk cows ...............................
8,700 1,400
55 43
Crop (2014) Acres Harvested Yield Per Acre Production Rank
Corn ........................................ Bu. Soybeans ................................ Bu. Wheat ...................................... Bu. Alfalfa Hay .............................. Ton Other Hay ............................... Ton
93,000 117,400
9,600 2,390 2,670
179.6 53.7 80.0 2.80 2.70
16,700,000 6,304,000
768,000 6,700 7,200
6 10 18 32 27
Commodity (2012 Census) Cash Receipts Commodity (2012 Census) Cash Receipts
Corn ............................................................... Soybeans ....................................................... Wheat ............................................................. Vegetables ..................................................... Fruit & Berries ................................................. Nursery & Greenhouse ................................... Total Crop ....................................................... Poultry & Eggs ................................................
66,993,000 61,283,000
(D) 316,000 188,000
1,176,000 135,761,000
18,000
Cattle & Calves ............................................. Milk ............................................................... Hogs & Pigs .................................................. Sheep & Goats ............................................. Total Livestock .............................................. Total Crop & Livestock ..................................
3,367,000 5,517,000
27,293,000 48,000
36,570,000
172,331,000
(D) Withheld to avoid disclosing data for individual operations.
Pike County Farms (2012 Census) Number
Number of Farms ..................................................... 490
Land (2012 Census) Acres
Land Area ................................................................ Land in Farms .......................................................... Cropland .................................................................. Harvested Cropland ................................................. Pastureland ............................................................. Woodland ................................................................
281,780 97,446 53,230 45,797 18,662 22,670
Capacity (2012 Census) Bushels
On-farm Grain Storage Capacity .............................. 1,782,476
Livestock (2014) Number Rank
All cattle and calves ................... Milk cows ...............................
6,600 400
64 66
Crop (2014) Acres Harvested Yield Per Acre Production Rank
Corn ........................................ Bu. Soybeans ................................ Bu. Wheat ...................................... Bu. Other Hay ............................... Ton
11,200 14,600
400 7,550
165.6 47.5 82.0 2.50
1,855,000 694,000 32,800 18,800
64 64 59 20
Commodity (2012 Census) Cash Receipts Commodity (2012 Census) Cash Receipts
Corn ............................................................... Soybeans ....................................................... Wheat ............................................................. Tobacco .......................................................... Vegetables ..................................................... Fruit & Berries ................................................. Nursery & Greenhouse ................................... Total Crop .......................................................
10,434,000 8,994,000
(D) (D)
868,000 55,000
462,000 22,916,000
Poultry & Eggs .............................................. Cattle & Calves ............................................. Milk ............................................................... Hogs & Pigs .................................................. Sheep & Goats ............................................. Total Livestock .............................................. Total Crop & Livestock ..................................
14,000 2,418,000 1,093,000
106,000 44,000
3,963,000
26,879,000
(D) Withheld to avoid disclosing data for individual operations.

94 Ohio Annual Bulletin (September 2015) USDA, National Agricultural Statistics Service
Portage County Farms (2012 Census) Number
Number of Farms .................................................... 847
Land (2012 Census) Acres
Land Area ............................................................... Land in Farms ......................................................... Cropland ................................................................. Harvested Cropland ................................................ Pastureland ............................................................. Woodland ...............................................................
311,922 83,321 58,726 55,737 8,954
12,477
Capacity (2012 Census) Bushels
On-farm Grain Storage Capacity ............................. 1,854,715
Livestock (2014) Number Rank
All cattle and calves .................. Milk cows ..............................
7,500 1,700
61 38
Crop (2014) Acres Harvested Yield Per Acre Production Rank
Corn ........................................ Bu. Soybeans ................................ Bu. Wheat ..................................... Bu. Alfalfa Hay .............................. Ton Other Hay ............................... Ton
12,800 19,800 2,130 3,370 6,820
152.3 43.2 67.6 3.05 2.50
1,950,000 855,000 144,000 10,300 17,100
63 60 48 22 21
Commodity (2012 Census) Cash Receipts Commodity (2012 Census) Cash Receipts
Corn ............................................................... Soybeans ....................................................... Wheat ............................................................ Vegetables ..................................................... Fruit & Berries ................................................ Nursery & Greenhouse .................................. Total Crop ...................................................... Poultry & Eggs ...............................................
11,620,000 11,313,000
792,000 1,326,000
759,000 3,876,000
32,187,000 63,000
Cattle & Calves ............................................. Milk ............................................................... Hogs & Pigs .................................................. Sheep & Goats ............................................. Total Livestock .............................................. Total Crop & Livestock ..................................
2,635,000 5,832,000
(D) 167,000
11,493,000
43,681,000
(D) Withheld to avoid disclosing data for individual operations.
Preble County Farms (2012 Census) Number
Number of Farms .................................................... 1,088
Land (2012 Census) Acres
Land Area ............................................................... Land in Farms ......................................................... Cropland ................................................................. Harvested Cropland ................................................ Pastureland ............................................................. Woodland ...............................................................
271,437 224,243 195,108 189,110 10,828 13,969
Capacity (2012 Census) Bushels
On-farm Grain Storage Capacity ............................. 14,980,360
Livestock (2014) Number Rank
All cattle and calves .................. Milk cows ..............................
17,000 1,600
26 41
Crop (2014) Acres Harvested Yield Per Acre Production Rank
Corn ........................................ Bu. Soybeans ................................ Bu. Wheat ..................................... Bu.
80,000 85,800 4,790
186.3 59.7 83.3
14,900,000 5,121,000
399,000
13 21 32
Commodity (2012 Census) Cash Receipts Commodity (2012 Census) Cash Receipts
Corn ............................................................... Soybeans ....................................................... Wheat ............................................................ Vegetables ..................................................... Fruit & Berries ................................................ Nursery & Greenhouse .................................. Total Crop ...................................................... Poultry & Eggs ...............................................
52,541,000 44,541,000 2,506,000
519,000 (D) (D)
102,023,000 318,000
Cattle & Calves ............................................. Milk ............................................................... Hogs & Pigs .................................................. Sheep & Goats ............................................. Total Livestock .............................................. Total Crop & Livestock ..................................
16,041,000 (D)
21,138,000 240,000
52,801,000
154,824,000
(D) Withheld to avoid disclosing data for individual operations.

Ohio Annual Bulletin (September 2015) 95 USDA, National Agricultural Statistics Service
Putnam County Farms (2012 Census) Number
Number of Farms ..................................................... 1,272
Land (2012 Census) Acres
Land Area ................................................................ Land in Farms .......................................................... Cropland .................................................................. Harvested Cropland ................................................. Pastureland ............................................................. Woodland ................................................................
308,813 305,567 287,239 279,136
2,261 8,278
Capacity (2012 Census) Bushels
On-farm Grain Storage Capacity .............................. 10,012,439
Livestock (2014) Number Rank
All cattle and calves ................... Milk cows ...............................
13,400 4,400
34 18
Crop (2014) Acres Harvested Yield Per Acre Production Rank
Corn ........................................ Bu. Soybeans ................................ Bu. Wheat ...................................... Bu.
78,500 133,900 36,700
196.2 52.9 75.5
15,400,000 7,079,000 2,772,000
11 5 1
Commodity (2012 Census) Cash Receipts Commodity (2012 Census) Cash Receipts
Corn ............................................................... Soybeans ....................................................... Wheat ............................................................. Vegetables ..................................................... Fruit & Berries ................................................. Nursery & Greenhouse ................................... Total Crop ....................................................... Poultry & Eggs ................................................
67,966,000 92,888,000 14,086,000 3,696,000
(D) 964,000
181,931,000 7,256,000
Cattle & Calves ............................................. Milk ............................................................... Hogs & Pigs .................................................. Sheep & Goats ............................................. Total Livestock .............................................. Total Crop & Livestock ..................................
10,443,000 18,153,000 25,020,000
130,000 61,279,000
243,210,000
(D) Withheld to avoid disclosing data for individual operations.
Richland County Farms (2012 Census) Number
Number of Farms ..................................................... 1,010
Land (2012 Census) Acres
Land Area ................................................................ Land in Farms .......................................................... Cropland .................................................................. Harvested Cropland ................................................. Pastureland ............................................................. Woodland ................................................................
316,968 160,623 120,285 111,997 12,608 19,665
Capacity (2012 Census) Bushels
On-farm Grain Storage Capacity .............................. 6,850,100
Livestock (2014) Number Rank
All cattle and calves ................... Milk cows ...............................
22,000 6,100
15 12
Crop (2014) Acres Harvested Yield Per Acre Production Rank
Corn ........................................ Bu. Soybeans ................................ Bu.
36,400 45,200
167.9 53.3
6,110,000 2,407,000
42 44
Commodity (2012 Census) Cash Receipts Commodity (2012 Census) Cash Receipts
Corn ............................................................... Soybeans ....................................................... Wheat ............................................................. Vegetables ..................................................... Fruit & Berries ................................................. Nursery & Greenhouse ................................... Total Crop ....................................................... Poultry & Eggs ................................................
32,543,000 25,264,000 2,392,000
(D) (D)
3,213,000 66,519,000 10,470,000
Cattle & Calves ............................................. Milk ............................................................... Hogs & Pigs .................................................. Sheep & Goats ............................................. Total Livestock .............................................. Total Crop & Livestock ..................................
12,632,000 28,189,000 10,371,000
190,000 62,163,000
128,682,000
(D) Withheld to avoid disclosing data for individual operations.

96 Ohio Annual Bulletin (September 2015) USDA, National Agricultural Statistics Service
Ross County Farms (2012 Census) Number
Number of Farms .................................................... 980
Land (2012 Census) Acres
Land Area ............................................................... Land in Farms ......................................................... Cropland ................................................................. Harvested Cropland ................................................ Pastureland ............................................................. Woodland ...............................................................
441,080 221,723 153,693 124,639 25,647 37,052
Capacity (2012 Census) Bushels
On-farm Grain Storage Capacity ............................. 8,288,679
Livestock (2014) Number Rank
All cattle and calves .................. Milk cows ..............................
13,500 1,100
32 51
Crop (2014) Acres Harvested Yield Per Acre Production Rank
Corn ........................................ Bu. Soybeans ................................ Bu. Wheat ..................................... Bu. Other Hay ............................... Ton
50,000 63,700 6,850 8,350
173.4 52.0 70.7 3.00
8,670,000 3,311,000
484,000 25,000
35 37 27 18
Commodity (2012 Census) Cash Receipts Commodity (2012 Census) Cash Receipts
Corn ............................................................... Soybeans ....................................................... Wheat ............................................................ Tobacco ......................................................... Vegetables ..................................................... Fruit & Berries ................................................ Nursery & Greenhouse .................................. Total Crop ......................................................
34,461,000 29,442,000 3,112,000
(D) (D)
307,000 395,000
69,836,000
Poultry & Eggs .............................................. Cattle & Calves ............................................. Milk ............................................................... Hogs & Pigs .................................................. Sheep & Goats ............................................. Total Livestock .............................................. Total Crop & Livestock ..................................
(D) 5,022,000 4,065,000
281,000 116,000
9,967,000
79,803,000
(D) Withheld to avoid disclosing data for individual operations.
Sandusky County Farms (2012 Census) Number
Number of Farms .................................................... 737
Land (2012 Census) Acres
Land Area ............................................................... Land in Farms ......................................................... Cropland ................................................................. Harvested Cropland ................................................ Pastureland ............................................................. Woodland ...............................................................
261,411 181,440 166,275 161,691
4,485 6,449
Capacity (2012 Census) Bushels
On-farm Grain Storage Capacity ............................. 5,287,299
Livestock (2014) Number Rank
All cattle and calves .................. Milk cows ..............................
5,000 800
70 58
Crop (2014) Acres Harvested Yield Per Acre Production Rank
Corn ........................................ Bu. Soybeans ................................ Bu. Wheat ..................................... Bu. Alfalfa Hay .............................. Ton Other Hay ............................... Ton
67,700 95,900 9,650 4,860
710
183.9 52.5 73.4 4.30 2.80
12,450,000 5,038,000
708,000 20,900 2,000
21 24 20 5
39
Commodity (2012 Census) Cash Receipts Commodity (2012 Census) Cash Receipts
Corn ............................................................... Soybeans ....................................................... Wheat ............................................................ Vegetables ..................................................... Fruit & Berries ................................................ Nursery & Greenhouse .................................. Total Crop ...................................................... Poultry & Eggs ...............................................
57,606,000 54,938,000 3,733,000 7,516,000 1,263,000
(D) 126,460,000
67,000
Cattle & Calves ............................................. Milk ............................................................... Hogs & Pigs .................................................. Sheep & Goats ............................................. Total Livestock .............................................. Total Crop & Livestock ..................................
4,480,000 1,256,000 2,565,000
158,000 8,797,000
135,258,000
(D) Withheld to avoid disclosing data for individual operations.

Ohio Annual Bulletin (September 2015) 97 USDA, National Agricultural Statistics Service
Scioto County Farms (2012 Census) Number
Number of Farms .................................................. 689
Land (2012 Census) Acres
Land Area ............................................................. Land in Farms ....................................................... Cropland ............................................................... Harvested Cropland .............................................. Pastureland .......................................................... Woodland .............................................................
390,538 94,342 41,989 35,502 21,861 31,038
Capacity (2012 Census) Bushels
On-farm Grain Storage Capacity ........................... 1,061,340
Livestock (2014) Number Rank
All cattle and calves ................... Milk cows ...............................
9,000 (D)
52
(D) Withheld to avoid disclosing data for individual operations.
Crop (2014) Acres Harvested Yield Per Acre Production Rank
Corn ........................................ Bu. Soybeans ................................ Bu. Wheat ...................................... Bu.
7,600 15,900
410
152.6 47.0 61.7
1,160,000 748,000 25,300
67 63 61
Commodity (2012 Census) Cash Receipts Commodity (2012 Census) Cash Receipts
Corn ............................................................... Soybeans ....................................................... Wheat ............................................................. Tobacco .......................................................... Vegetables ..................................................... Fruit & Berries ................................................. Nursery & Greenhouse ................................... Total Crop .......................................................
4,632,000 7,076,000
(D) (D) (D)
292,000 (D)
14,093,000
Poultry & Eggs .............................................. Cattle & Calves ............................................. Milk ............................................................... Hogs & Pigs .................................................. Sheep & Goats ............................................. Total Livestock .............................................. Total Crop & Livestock ..................................
(D) 2,801,000
(D) (D)
252,000 8,112,000
22,206,000
(D) Withheld to avoid disclosing data for individual operations.
Seneca County Farms (2012 Census) Number
Number of Farms ..................................................... 1,113
Land (2012 Census) Acres
Land Area ................................................................ Land in Farms .......................................................... Cropland .................................................................. Harvested Cropland ................................................. Pastureland ............................................................. Woodland ................................................................
352,652 290,511 258,061 247,941
3,718 19,634
Capacity (2012 Census) Bushels
On-farm Grain Storage Capacity .............................. 11,049,608
Livestock (2014) Number Rank
All cattle and calves ................... Milk cows ...............................
9,500 700
46 61
Crop (2014) Acres Harvested Yield Per Acre Production Rank
Corn ........................................ Bu. Soybeans ................................ Bu. Wheat ...................................... Bu.
93,500 132,500 24,800
168.4 49.2 75.8
15,750,000 6,518,000 1,881,000
8 8 5
Commodity (2012 Census) Cash Receipts Commodity (2012 Census) Cash Receipts
Corn ............................................................... Soybeans ....................................................... Wheat ............................................................. Vegetables ..................................................... Fruit & Berries ................................................. Nursery & Greenhouse ................................... Total Crop ....................................................... Poultry & Eggs ................................................
73,457,000 64,879,000 7,791,000
869,000 (D) (D)
148,389,000 122,000
Cattle & Calves ............................................. Milk ............................................................... Hogs & Pigs .................................................. Sheep & Goats ............................................. Total Livestock .............................................. Total Crop & Livestock ..................................
6,787,000 1,215,000
17,490,000 235,000
26,183,000
174,572,000
(D) Withheld to avoid disclosing data for individual operations.
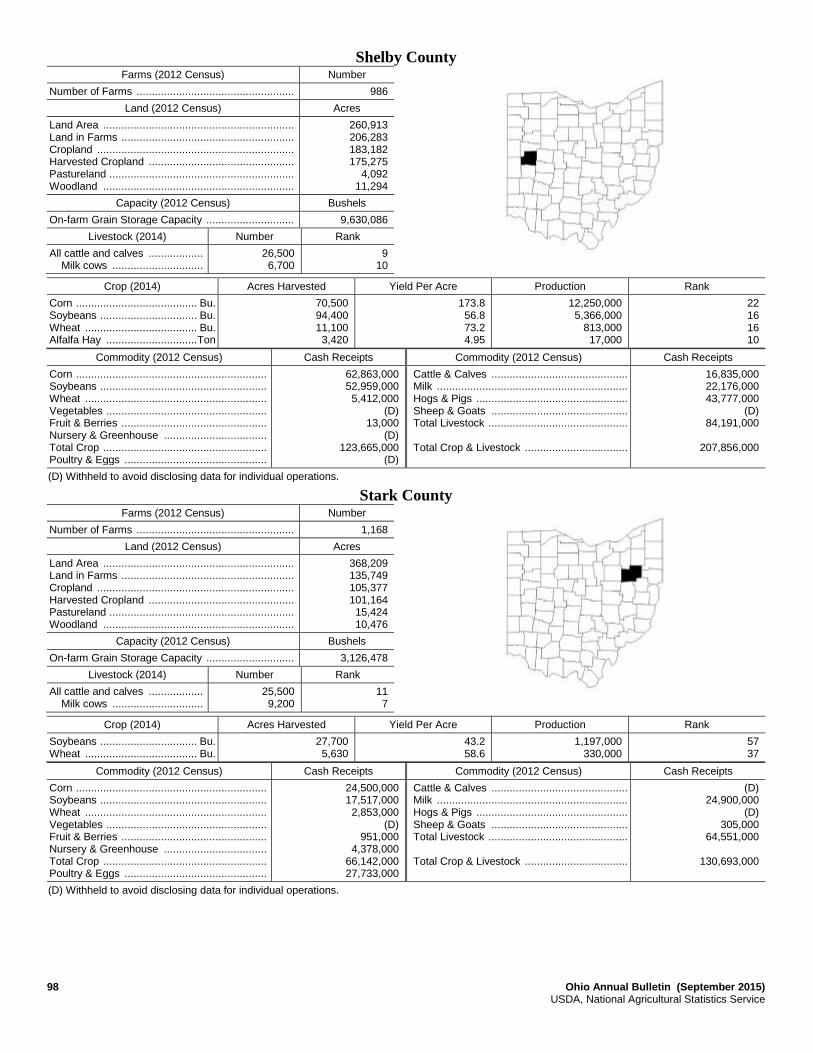
98 Ohio Annual Bulletin (September 2015) USDA, National Agricultural Statistics Service
Shelby County Farms (2012 Census) Number
Number of Farms .................................................... 986
Land (2012 Census) Acres
Land Area ............................................................... Land in Farms ......................................................... Cropland ................................................................. Harvested Cropland ................................................ Pastureland ............................................................. Woodland ...............................................................
260,913 206,283 183,182 175,275
4,092 11,294
Capacity (2012 Census) Bushels
On-farm Grain Storage Capacity ............................. 9,630,086
Livestock (2014) Number Rank
All cattle and calves .................. Milk cows ..............................
26,500 6,700
9 10
Crop (2014) Acres Harvested Yield Per Acre Production Rank
Corn ........................................ Bu. Soybeans ................................ Bu. Wheat ..................................... Bu. Alfalfa Hay .............................. Ton
70,500 94,400 11,100 3,420
173.8 56.8 73.2 4.95
12,250,000 5,366,000
813,000 17,000
22 16 16 10
Commodity (2012 Census) Cash Receipts Commodity (2012 Census) Cash Receipts
Corn ............................................................... Soybeans ....................................................... Wheat ............................................................ Vegetables ..................................................... Fruit & Berries ................................................ Nursery & Greenhouse .................................. Total Crop ...................................................... Poultry & Eggs ...............................................
62,863,000 52,959,000 5,412,000
(D) 13,000
(D) 123,665,000
(D)
Cattle & Calves ............................................. Milk ............................................................... Hogs & Pigs .................................................. Sheep & Goats ............................................. Total Livestock .............................................. Total Crop & Livestock ..................................
16,835,000 22,176,000 43,777,000
(D) 84,191,000
207,856,000
(D) Withheld to avoid disclosing data for individual operations.
Stark County Farms (2012 Census) Number
Number of Farms .................................................... 1,168
Land (2012 Census) Acres
Land Area ............................................................... Land in Farms ......................................................... Cropland ................................................................. Harvested Cropland ................................................ Pastureland ............................................................. Woodland ...............................................................
368,209 135,749 105,377 101,164 15,424 10,476
Capacity (2012 Census) Bushels
On-farm Grain Storage Capacity ............................. 3,126,478
Livestock (2014) Number Rank
All cattle and calves .................. Milk cows ..............................
25,500 9,200
11 7
Crop (2014) Acres Harvested Yield Per Acre Production Rank
Soybeans ................................ Bu. Wheat ..................................... Bu.
27,700 5,630
43.2 58.6
1,197,000 330,000
57 37
Commodity (2012 Census) Cash Receipts Commodity (2012 Census) Cash Receipts
Corn ............................................................... Soybeans ....................................................... Wheat ............................................................ Vegetables ..................................................... Fruit & Berries ................................................ Nursery & Greenhouse .................................. Total Crop ...................................................... Poultry & Eggs ...............................................
24,500,000 17,517,000 2,853,000
(D) 951,000
4,378,000 66,142,000 27,733,000
Cattle & Calves ............................................. Milk ............................................................... Hogs & Pigs .................................................. Sheep & Goats ............................................. Total Livestock .............................................. Total Crop & Livestock ..................................
(D) 24,900,000
(D) 305,000
64,551,000
130,693,000
(D) Withheld to avoid disclosing data for individual operations.

Ohio Annual Bulletin (September 2015) 99 USDA, National Agricultural Statistics Service
Summit County Farms (2012 Census) Number
Number of Farms .................................................. 304
Land (2012 Census) Acres
Land Area ............................................................. Land in Farms ....................................................... Cropland ............................................................... Harvested Cropland .............................................. Pastureland .......................................................... Woodland .............................................................
264,220 16,545 9,645 8,917 2,697 2,838
Capacity (2012 Census) Bushels
On-farm Grain Storage Capacity ........................... 237,100
Livestock (2014) Number Rank
All cattle and calves ................... Milk cows ...............................
1,000 (D)
85
(D) Withheld to avoid disclosing data for individual operations.
Crop (2014) Acres Harvested Yield Per Acre Production Rank
Alfalfa Hay .............................. Ton Other Hay ............................... Ton
1,040 1,900
3.05 1.55
3,170 2,900
45 36
Commodity (2012 Census) Cash Receipts Commodity (2012 Census) Cash Receipts
Corn ............................................................... Soybeans ....................................................... Wheat ............................................................. Vegetables ..................................................... Fruit & Berries ................................................. Nursery & Greenhouse ................................... Total Crop ....................................................... Poultry & Eggs ................................................
1,051,000 960,000 63,000
3,148,000 190,000
3,806,000 9,784,000
69,000
Cattle & Calves ............................................. Milk ............................................................... Hogs & Pigs .................................................. Sheep & Goats ............................................. Total Livestock .............................................. Total Crop & Livestock ..................................
289,000 (D)
19,000 30,000
1,499,000
11,284,000
(D) Withheld to avoid disclosing data for individual operations.
Trumbull County Farms (2012 Census) Number
Number of Farms ..................................................... 888
Land (2012 Census) Acres
Land Area ................................................................ Land in Farms .......................................................... Cropland .................................................................. Harvested Cropland ................................................. Pastureland ............................................................. Woodland ................................................................
395,709 113,896 77,462 72,250 11,176 21,907
Capacity (2012 Census) Bushels
On-farm Grain Storage Capacity .............................. 4,407,888
Livestock (2014) Number Rank
All cattle and calves ................... Milk cows ...............................
11,200 2,900
39 30
Crop (2014) Acres Harvested Yield Per Acre Production Rank
Corn ........................................ Bu. Soybeans ................................ Bu. Other Hay ............................... Ton
19,700 28,800 9,400
159.4 44.7 2.70
3,140,000 1,288,000
25,400
52 56 17
Commodity (2012 Census) Cash Receipts Commodity (2012 Census) Cash Receipts
Corn ............................................................... Soybeans ....................................................... Wheat ............................................................. Vegetables ..................................................... Fruit & Berries ................................................. Nursery & Greenhouse ................................... Total Crop ....................................................... Poultry & Eggs ................................................
20,729,000 20,801,000
733,000 461,000 142,000
1,656,000 47,859,000
(D)
Cattle & Calves ............................................. Milk ............................................................... Hogs & Pigs .................................................. Sheep & Goats ............................................. Total Livestock .............................................. Total Crop & Livestock ..................................
5,630,000 10,557,000
139,000 52,000
18,601,000
66,459,000
(D) Withheld to avoid disclosing data for individual operations.
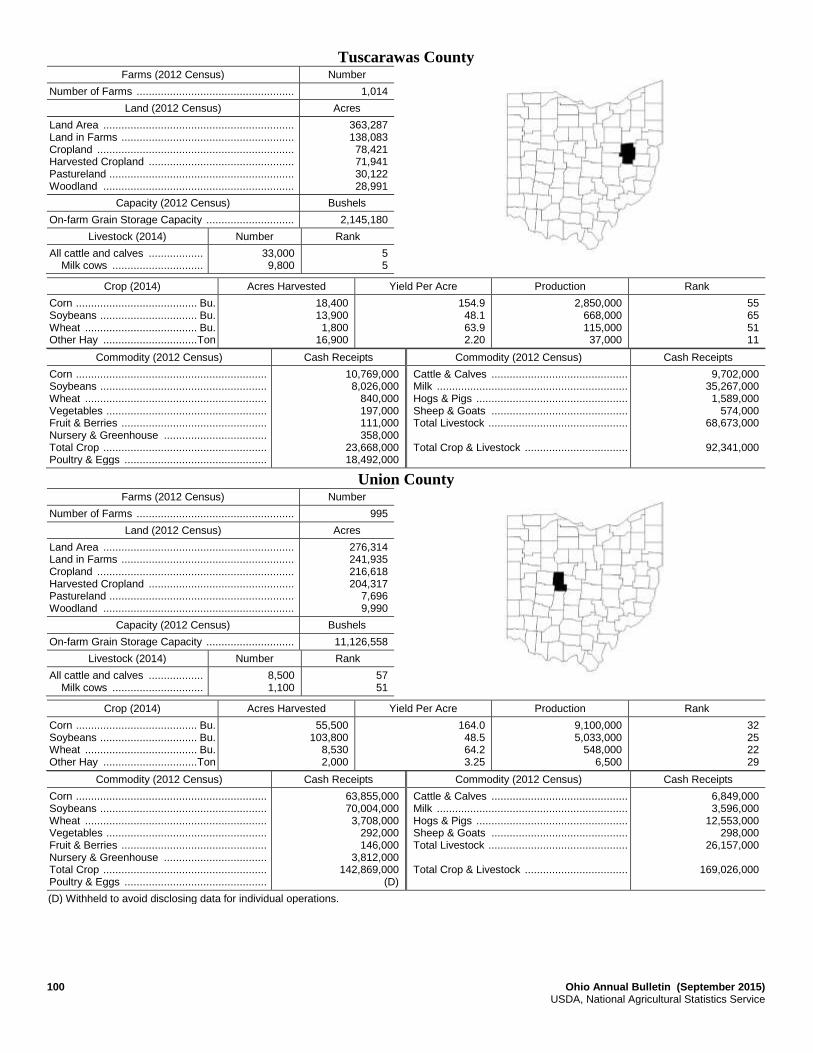
100 Ohio Annual Bulletin (September 2015) USDA, National Agricultural Statistics Service
Tuscarawas County Farms (2012 Census) Number
Number of Farms .................................................... 1,014
Land (2012 Census) Acres
Land Area ............................................................... Land in Farms ......................................................... Cropland ................................................................. Harvested Cropland ................................................ Pastureland ............................................................. Woodland ...............................................................
363,287 138,083 78,421 71,941 30,122 28,991
Capacity (2012 Census) Bushels
On-farm Grain Storage Capacity ............................. 2,145,180
Livestock (2014) Number Rank
All cattle and calves .................. Milk cows ..............................
33,000 9,800
5 5
Crop (2014) Acres Harvested Yield Per Acre Production Rank
Corn ........................................ Bu. Soybeans ................................ Bu. Wheat ..................................... Bu. Other Hay ............................... Ton
18,400 13,900 1,800
16,900
154.9 48.1 63.9 2.20
2,850,000 668,000 115,000 37,000
55 65 51 11
Commodity (2012 Census) Cash Receipts Commodity (2012 Census) Cash Receipts
Corn ............................................................... Soybeans ....................................................... Wheat ............................................................ Vegetables ..................................................... Fruit & Berries ................................................ Nursery & Greenhouse .................................. Total Crop ...................................................... Poultry & Eggs ...............................................
10,769,000 8,026,000
840,000 197,000 111,000 358,000
23,668,000 18,492,000
Cattle & Calves ............................................. Milk ............................................................... Hogs & Pigs .................................................. Sheep & Goats ............................................. Total Livestock .............................................. Total Crop & Livestock ..................................
9,702,000 35,267,000 1,589,000
574,000 68,673,000
92,341,000
Union County Farms (2012 Census) Number
Number of Farms .................................................... 995
Land (2012 Census) Acres
Land Area ............................................................... Land in Farms ......................................................... Cropland ................................................................. Harvested Cropland ................................................ Pastureland ............................................................. Woodland ...............................................................
276,314 241,935 216,618 204,317
7,696 9,990
Capacity (2012 Census) Bushels
On-farm Grain Storage Capacity ............................. 11,126,558
Livestock (2014) Number Rank
All cattle and calves .................. Milk cows ..............................
8,500 1,100
57 51
Crop (2014) Acres Harvested Yield Per Acre Production Rank
Corn ........................................ Bu. Soybeans ................................ Bu. Wheat ..................................... Bu. Other Hay ............................... Ton
55,500 103,800
8,530 2,000
164.0 48.5 64.2 3.25
9,100,000 5,033,000
548,000 6,500
32 25 22 29
Commodity (2012 Census) Cash Receipts Commodity (2012 Census) Cash Receipts
Corn ............................................................... Soybeans ....................................................... Wheat ............................................................ Vegetables ..................................................... Fruit & Berries ................................................ Nursery & Greenhouse .................................. Total Crop ...................................................... Poultry & Eggs ...............................................
63,855,000 70,004,000 3,708,000
292,000 146,000
3,812,000 142,869,000
(D)
Cattle & Calves ............................................. Milk ............................................................... Hogs & Pigs .................................................. Sheep & Goats ............................................. Total Livestock .............................................. Total Crop & Livestock ..................................
6,849,000 3,596,000
12,553,000 298,000
26,157,000
169,026,000
(D) Withheld to avoid disclosing data for individual operations.

Ohio Annual Bulletin (September 2015) 101 USDA, National Agricultural Statistics Service
Van Wert County Farms (2012 Census) Number
Number of Farms ..................................................... 655
Land (2012 Census) Acres
Land Area ................................................................ Land in Farms .......................................................... Cropland .................................................................. Harvested Cropland ................................................. Pastureland ............................................................. Woodland ................................................................
261,861 227,277 214,763 211,930
1,691 6,117
Capacity (2012 Census) Bushels
On-farm Grain Storage Capacity .............................. 10,353,227
Livestock (2014) Number Rank
All cattle and calves ................... Milk cows ...............................
7,000 3,000
63 26
Crop (2014) Acres Harvested Yield Per Acre Production Rank
Corn ........................................ Bu. Soybeans ................................ Bu. Wheat ...................................... Bu. Alfalfa Hay .............................. Ton
76,500 121,900 13,900
770
192.2 61.2 80.6 4.70
14,700,000 7,462,000 1,121,000
3,600
14 3
12 43
Commodity (2012 Census) Cash Receipts Commodity (2012 Census) Cash Receipts
Corn ............................................................... Soybeans ....................................................... Wheat ............................................................. Vegetables ..................................................... Fruit & Berries ................................................. Nursery & Greenhouse ................................... Total Crop ....................................................... Poultry & Eggs ................................................
58,146,000 78,838,000
(D) 64,000
(D) (D)
153,066,000 (D)
Cattle & Calves ............................................. Milk ............................................................... Hogs & Pigs .................................................. Sheep & Goats ............................................. Total Livestock .............................................. Total Crop & Livestock ..................................
14,281,000 (D)
25,782,000 81,000
56,592,000
209,657,000
(D) Withheld to avoid disclosing data for individual operations.
Vinton County Farms (2012 Census) Number
Number of Farms .................................................. 226
Land (2012 Census) Acres
Land Area ............................................................. Land in Farms ....................................................... Cropland ............................................................... Harvested Cropland .............................................. Pastureland .......................................................... Woodland .............................................................
263,910 33,400 11,827 8,806 8,750
12,606
Capacity (2012 Census) Bushels
On-farm Grain Storage Capacity ........................... 149,900
Livestock (2014) Number Rank
All cattle and calves ................... Milk cows ...............................
2,600 (D)
79
(D) Withheld to avoid disclosing data for individual operations.
Crop (2014) Acres Harvested Yield Per Acre Production Rank
Corn ........................................ Bu. Soybeans ................................ Bu. Alfalfa Hay .............................. Ton Other Hay ............................... Ton
2,200 1,790 1,180 5,880
147.7 51.7 1.80 1.65
325,000 92,500 2,100 9,700
79 78 47 25
Commodity (2012 Census) Cash Receipts Commodity (2012 Census) Cash Receipts
Corn ............................................................... Soybeans ....................................................... Wheat ............................................................. Vegetables ..................................................... Fruit & Berries ................................................. Nursery & Greenhouse ................................... Total Crop ....................................................... Poultry & Eggs ................................................
1,033,000 490,000
(D) 57,000 12,000
(D) 3,875,000
10,000
Cattle & Calves ............................................. Milk ............................................................... Hogs & Pigs .................................................. Sheep & Goats ............................................. Total Livestock .............................................. Total Crop & Livestock ..................................
668,000 60,000 25,000 14,000
827,000
4,702,000
(D) Withheld to avoid disclosing data for individual operations.

102 Ohio Annual Bulletin (September 2015) USDA, National Agricultural Statistics Service
Warren County Farms (2012 Census) Number
Number of Farms ................................................. 942
Land (2012 Census) Acres
Land Area ............................................................ Land in Farms ...................................................... Cropland .............................................................. Harvested Cropland ............................................. Pastureland .......................................................... Woodland ............................................................
256,847 106,624 80,238 76,785 12,167 9,410
Capacity (2012 Census) Bushels
On-farm Grain Storage Capacity .......................... 2,915,409
Livestock (2014) Number Rank
All cattle and calves .................. Milk cows ..............................
3,900 (D)
76
(D) Withheld to avoid disclosing data for individual operations.
Crop (2014) Acres Harvested Yield Per Acre Production Rank
Corn ........................................ Bu. Soybeans ................................ Bu. Wheat ..................................... Bu. Alfalfa Hay .............................. Ton
23,500 38,900 2,210 2,560
184.7 53.1 74.7 2.85
4,340,000 2,065,000
165,000 7,300
47 46 47 29
Commodity (2012 Census) Cash Receipts Commodity (2012 Census) Cash Receipts
Corn ............................................................... Soybeans ....................................................... Wheat ............................................................ Vegetables ..................................................... Fruit & Berries ................................................ Nursery & Greenhouse .................................. Total Crop ...................................................... Poultry & Eggs ...............................................
22,639,000 22,940,000
(D) 472,000 192,000
12,101,000 60,766,000
75,000
Cattle & Calves ............................................. Milk ............................................................... Hogs & Pigs .................................................. Sheep & Goats ............................................. Total Livestock .............................................. Total Crop & Livestock ..................................
1,573,000 872,000 232,000 77,000
5,942,000
66,708,000
(D) Withheld to avoid disclosing data for individual operations.
Washington County Farms (2012 Census) Number
Number of Farms .................................................... 1,122
Land (2012 Census) Acres
Land Area ............................................................... Land in Farms ......................................................... Cropland ................................................................. Harvested Cropland ................................................ Pastureland ............................................................. Woodland ...............................................................
404,462 138,940 49,522 44,473 49,404 46,858
Capacity (2012 Census) Bushels
On-farm Grain Storage Capacity ............................. 1,065,305
Livestock (2014) Number Rank
All cattle and calves .................. Milk cows ..............................
18,500 2,300
22 34
Crop (2014) Acres Harvested Yield Per Acre Production Rank
Corn ........................................ Bu. Soybeans ................................ Bu. Wheat ..................................... Bu. Alfalfa Hay .............................. Ton Other Hay ............................... Ton
8,600 7,380
920 4,090
16,300
175.6 55.6 50.2 3.90 2.40
1,510,000 410,000 46,200 15,900 39,300
66 67 57 13 9
Commodity (2012 Census) Cash Receipts Commodity (2012 Census) Cash Receipts
Corn ............................................................... Soybeans ....................................................... Wheat ............................................................ Vegetables ..................................................... Fruit & Berries ................................................ Nursery & Greenhouse .................................. Total Crop ...................................................... Poultry & Eggs ...............................................
6,744,000 4,817,000
319,000 2,053,000
290,000 837,000
18,051,000 40,000
Cattle & Calves ............................................. Milk ............................................................... Hogs & Pigs .................................................. Sheep & Goats ............................................. Total Livestock .............................................. Total Crop & Livestock ..................................
6,859,000 4,955,000
364,000 89,000
12,428,000
30,479,000
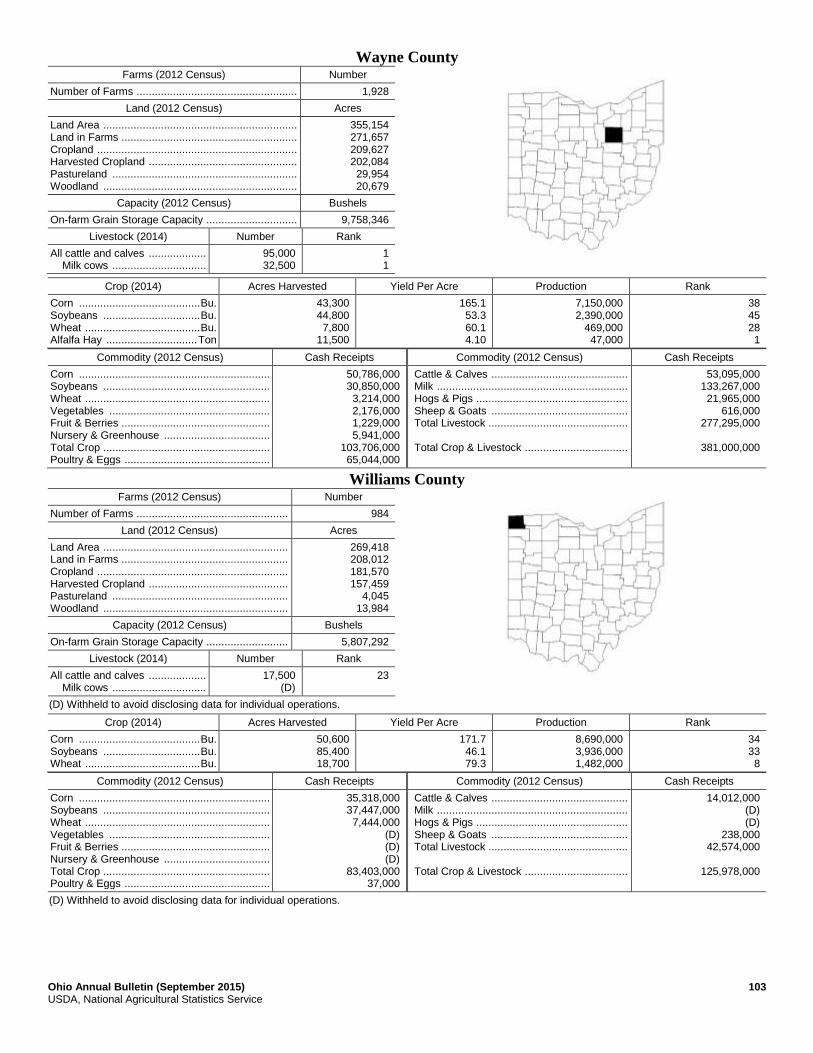
Ohio Annual Bulletin (September 2015) 103 USDA, National Agricultural Statistics Service
Wayne County Farms (2012 Census) Number
Number of Farms ..................................................... 1,928
Land (2012 Census) Acres
Land Area ................................................................ Land in Farms .......................................................... Cropland .................................................................. Harvested Cropland ................................................. Pastureland ............................................................. Woodland ................................................................
355,154 271,657 209,627 202,084 29,954 20,679
Capacity (2012 Census) Bushels
On-farm Grain Storage Capacity .............................. 9,758,346
Livestock (2014) Number Rank
All cattle and calves ................... Milk cows ...............................
95,000 32,500
1 1
Crop (2014) Acres Harvested Yield Per Acre Production Rank
Corn ........................................ Bu. Soybeans ................................ Bu. Wheat ...................................... Bu. Alfalfa Hay .............................. Ton
43,300 44,800 7,800
11,500
165.1 53.3 60.1 4.10
7,150,000 2,390,000
469,000 47,000
38 45 28 1
Commodity (2012 Census) Cash Receipts Commodity (2012 Census) Cash Receipts
Corn ............................................................... Soybeans ....................................................... Wheat ............................................................. Vegetables ..................................................... Fruit & Berries ................................................. Nursery & Greenhouse ................................... Total Crop ....................................................... Poultry & Eggs ................................................
50,786,000 30,850,000 3,214,000 2,176,000 1,229,000 5,941,000
103,706,000 65,044,000
Cattle & Calves ............................................. Milk ............................................................... Hogs & Pigs .................................................. Sheep & Goats ............................................. Total Livestock .............................................. Total Crop & Livestock ..................................
53,095,000 133,267,000 21,965,000
616,000 277,295,000
381,000,000
Williams County Farms (2012 Census) Number
Number of Farms .................................................. 984
Land (2012 Census) Acres
Land Area ............................................................. Land in Farms ....................................................... Cropland ............................................................... Harvested Cropland .............................................. Pastureland .......................................................... Woodland .............................................................
269,418 208,012 181,570 157,459
4,045 13,984
Capacity (2012 Census) Bushels
On-farm Grain Storage Capacity ........................... 5,807,292
Livestock (2014) Number Rank
All cattle and calves ................... Milk cows ...............................
17,500 (D)
23
(D) Withheld to avoid disclosing data for individual operations.
Crop (2014) Acres Harvested Yield Per Acre Production Rank
Corn ........................................ Bu. Soybeans ................................ Bu. Wheat ...................................... Bu.
50,600 85,400 18,700
171.7 46.1 79.3
8,690,000 3,936,000 1,482,000
34 33 8
Commodity (2012 Census) Cash Receipts Commodity (2012 Census) Cash Receipts
Corn ............................................................... Soybeans ....................................................... Wheat ............................................................. Vegetables ..................................................... Fruit & Berries ................................................. Nursery & Greenhouse ................................... Total Crop ....................................................... Poultry & Eggs ................................................
35,318,000 37,447,000 7,444,000
(D) (D) (D)
83,403,000 37,000
Cattle & Calves ............................................. Milk ............................................................... Hogs & Pigs .................................................. Sheep & Goats ............................................. Total Livestock .............................................. Total Crop & Livestock ..................................
14,012,000 (D) (D)
238,000 42,574,000
125,978,000
(D) Withheld to avoid disclosing data for individual operations.
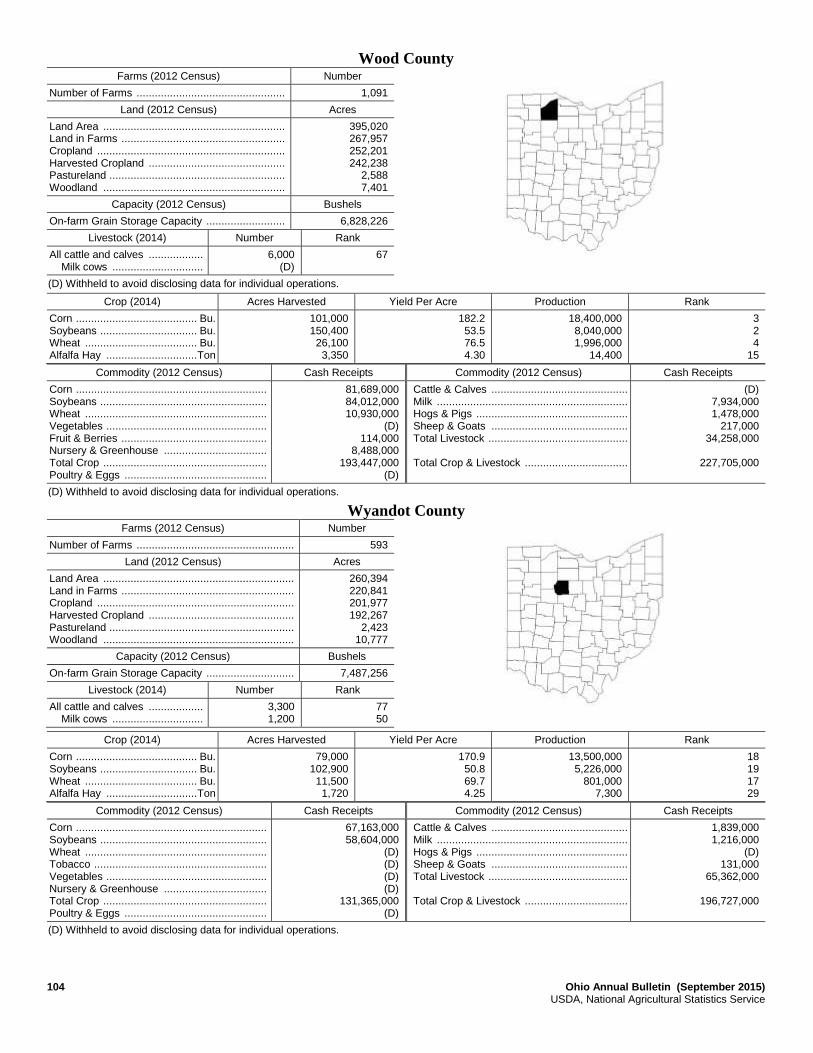
104 Ohio Annual Bulletin (September 2015) USDA, National Agricultural Statistics Service
Wood County Farms (2012 Census) Number
Number of Farms ................................................. 1,091
Land (2012 Census) Acres
Land Area ............................................................ Land in Farms ...................................................... Cropland .............................................................. Harvested Cropland ............................................. Pastureland .......................................................... Woodland ............................................................
395,020 267,957 252,201 242,238
2,588 7,401
Capacity (2012 Census) Bushels
On-farm Grain Storage Capacity .......................... 6,828,226
Livestock (2014) Number Rank
All cattle and calves .................. Milk cows ..............................
6,000 (D)
67
(D) Withheld to avoid disclosing data for individual operations.
Crop (2014) Acres Harvested Yield Per Acre Production Rank
Corn ........................................ Bu. Soybeans ................................ Bu. Wheat ..................................... Bu. Alfalfa Hay .............................. Ton
101,000 150,400 26,100 3,350
182.2 53.5 76.5 4.30
18,400,000 8,040,000 1,996,000
14,400
3 2 4
15
Commodity (2012 Census) Cash Receipts Commodity (2012 Census) Cash Receipts
Corn ............................................................... Soybeans ....................................................... Wheat ............................................................ Vegetables ..................................................... Fruit & Berries ................................................ Nursery & Greenhouse .................................. Total Crop ...................................................... Poultry & Eggs ...............................................
81,689,000 84,012,000 10,930,000
(D) 114,000
8,488,000 193,447,000
(D)
Cattle & Calves ............................................. Milk ............................................................... Hogs & Pigs .................................................. Sheep & Goats ............................................. Total Livestock .............................................. Total Crop & Livestock ..................................
(D) 7,934,000 1,478,000
217,000 34,258,000
227,705,000
(D) Withheld to avoid disclosing data for individual operations.
Wyandot County Farms (2012 Census) Number
Number of Farms .................................................... 593
Land (2012 Census) Acres
Land Area ............................................................... Land in Farms ......................................................... Cropland ................................................................. Harvested Cropland ................................................ Pastureland ............................................................. Woodland ...............................................................
260,394 220,841 201,977 192,267
2,423 10,777
Capacity (2012 Census) Bushels
On-farm Grain Storage Capacity ............................. 7,487,256
Livestock (2014) Number Rank
All cattle and calves .................. Milk cows ..............................
3,300 1,200
77 50
Crop (2014) Acres Harvested Yield Per Acre Production Rank
Corn ........................................ Bu. Soybeans ................................ Bu. Wheat ..................................... Bu. Alfalfa Hay .............................. Ton
79,000 102,900 11,500 1,720
170.9 50.8 69.7 4.25
13,500,000 5,226,000
801,000 7,300
18 19 17 29
Commodity (2012 Census) Cash Receipts Commodity (2012 Census) Cash Receipts
Corn ............................................................... Soybeans ....................................................... Wheat ............................................................ Tobacco ......................................................... Vegetables ..................................................... Nursery & Greenhouse .................................. Total Crop ...................................................... Poultry & Eggs ...............................................
67,163,000 58,604,000
(D) (D) (D) (D)
131,365,000 (D)
Cattle & Calves ............................................. Milk ............................................................... Hogs & Pigs .................................................. Sheep & Goats ............................................. Total Livestock .............................................. Total Crop & Livestock ..................................
1,839,000 1,216,000
(D) 131,000
65,362,000
196,727,000
(D) Withheld to avoid disclosing data for individual operations.