offshore technology report 2001/005
TRANSCRIPT
HSEHealth & Safety
Executive
Analysis of green water susceptibilityof FPSO/FSU’s on the UKCS
Prepared by BOMEL Limitedfor the Health and Safety Executive
OFFSHORE TECHNOLOGY REPORT
2001/005

HSEHealth & Safety
Executive
Analysis of green water susceptibilityof FPSO/FSU’s on the UKCS
BOMEL LimitedLedger House
Forest Green RoadFifield, Maidenhead
Berkshire SL6 2NRUnited Kingdom
HSE BOOKS

ii
© Crown copyright 2001Applications for reproduction should be made in writing to:Copyright Unit, Her Majesty’s Stationery Office,St Clements House, 2-16 Colegate, Norwich NR3 1BQ
First published 2001
ISBN 0 7176 2052 2
All rights reserved. No part of this publication may bereproduced, stored in a retrieval system, or transmittedin any form or by any means (electronic, mechanical,photocopying, recording or otherwise) without the priorwritten permission of the copyright owner.
This report is made available by the Health and SafetyExecutive as part of a series of reports of work which hasbeen supported by funds provided by the Executive.Neither the Executive, nor the contractors concernedassume any liability for the reports nor do theynecessarily reflect the views or policy of the Executive.

EXECUTIVE SUMMARY
Owing to the fundamental requirement of Floating Production, Storage and Offloading / FloatingStorage Units (FPSO/FSUs) to remain moored at their location, they are unable to avoid severeweather. The potential occurrence of unbroken waves (green water) landing on deck can causedamage and, over the past few years, a number of these Installations in UK and Norwegian watershave suffered in this respect. The Health and Safety Executive (HSE) commissioned this study toexamine the 16 UK FPSO/FSUs for green seas susceptibility specifically using the MARIN software‘GreenLab’.
It is important to note that this study considered only the susceptibility and not the consequences ofshipping green water on deck.
Basic comparisons of the Installation particulars at their fully-loaded draughts have initially been made.Where possible, Norwegian FPSOs were included in the comparisons of green water susceptibilityexpressed in terms of freeboard exceedence at defined points above the uppermost deck or bulwark.
A sensitivity analysis was carried out to investigate the separate effects of different wave parametersand draught changes on the magnitude of freeboard exceedence. Further, the mitigation of greenwater ‘risk’ was briefly studied to explore options available in design and operations to reduce thelikelihood of significant green water occurrences.
In an attempt to indicate the relative level of susceptibility for individual Installations based on the‘GreenLab’ predictions, band of green water severity have been defined for degrees of freeboardexceedence.
Conclusions have been reached in relation to the general population of the UK FPSO/FSUs, fullyloaded, for bow, side and stern green water as follows:-
� nearly one-half may be exposed to high bow green water susceptibility,� compared with the maximum design condition, significantly more green water volume is likely
to occur in certain situations with lower wave height and period,� freeboards are generally insufficient at maximum draughts to prevent green water occurring on
deck,� the majority are susceptible to side green water loading - the most likely area being aft of
midships, made worse by larger vessel heading angles relative to the waves,� none was at a high susceptibility to stern green water.
For each of the UKCS Installations, separate reports of the ‘GreenLab’ results were prepared andissued by the HSE to the individual Duty Holders. Furthermore, the results (in an anonymised andgeneralised form) were reviewed collectively by the HSE with the Duty Holders at a meeting inAberdeen during September 2000. At this meeting the HSE expected Duty Holder follow-up actionson the topic of green water susceptibility were agreed.
In a second part of this study, the recorded UKCS and Norwegian Waters wave incidents causingdamage to deck equipment and structures were sourced and collated. A comparison with the
iii

susceptibility levels of the FPSO/FSUs from the ‘GreenLab’ exercise confirmed a correlation with therecorded incidents. It also indicated that the months of January and February have the highest numberof green water events. There is a trend for an increased number of events as more Installations comeinto service. An analysis of green water incidents from 1995 would indicate a frequency rate of oneincident per Installation every 3.6 years approximately.
Differences between the ‘GreenLab’ predictions on the exposure to green water and the recordednumber of wave events may in part be due to operating practices and mitigation measures already inplace. There may also be a tendency not to record wave incidents if there is no resultant damage.
The incident data that has been recorded also confirms that the wave incidents have occurred in waveconditions less than the design maxima. This is in accordance with previous work that implies that thefrequency of wave events could be of concern for some FPSO/FSUs unless operationalprocedures/mitigation measures are introduced.
Finally, a summary is provided outlining an industry supported Joint Industry Project (JIP) currentlyunderway investigating the physics of green water and wave slam in order to improve knowledge andapplication in future FPSO/FSU projects.
MARIN have conducted a peer review of the technical quality of the ‘GreenLab’ results producedduring this study and their comments have been included in this report.
iv
CONTENTS
29FIGURES14
27REFERENCES13
2612.2 Research on Numerical Prediction of Green Water Loading
2512.1 The ‘FLOW’ - Joint Industry Project
25FUTURE RESEARCH DEVELOPMENT WORK12
23CONCLUSIONS FROM THE ‘GREENLAB’ ANALYSIS ANDINCIDENT CORRELATIONS
11
21GENERAL GUIDANCE ON MITIGATION OF RISK10
19GREEN WATER INCIDENTS AND ‘GREENLAB’ CORRELATION9
17SENSITIVITY OF BOW GREEN WATER TO Tp, Hs, FREEBOARDAND GAMMA
8
15RESULTS OF GREEN WATER SUSCEPTIBILITY ANALYSIS7
11BASIS OF ‘GREENLAB’ ANALYSIS6
9NORTH SEA FPSO/FSU LOCATIONS, SIZES ANDOPERATIONAL HISTORY
5
7BACKGROUND TO ‘GREENLAB’ DEVELOPMENT4
5GREEN WATER LOADING3
3INTRODUCTION2
1OBJECTIVE1
iiiEXECUTIVE SUMMARY
Page No
v

vi

1 OBJECTIVE
The objective of this study was to examine the 16 FPSO/FSUs operating in UK waters for green watersusceptibility using the MARIN software ‘GreenLab’.
This initiative follows several incidents of wave damage to this type of offshore Installation in UK andNorwegian waters - often occurring after short operational experience. Although none of the waveincidents directly endangered life, the unexpected nature of the events prompted this study toinvestigate the magnitude of green water likely to occur on deck i.e. calculated by ‘GreenLab’ in termsof freeboard exceedence.
Also, as a secondary objective to the study, the FPSO/FSU wave incidents that have occurred in theUK and Norwegian waters have been collated in a database. From this database a comparison of theareas of deck damage has been made with the ‘GreenLab’ predictions.
It is intended that Duty Holders, Operators and Designers benefit from this study, with a view toimproving the understanding of the circumstances under which green water occurs, and developingpossible methods to mitigate against risk.
1

2

2 INTRODUCTION
This report examines the green water susceptibility of 16 FPSO/FSUs operating on the UKCS usingthe MARIN ‘GreenLab’ software. The results give an indication of whether serious green water canbe expected, where on deck it might occur and the magnitude and the load levels that might beexperienced. Defined levels of susceptibility were attributed to each Installation at the bow, sides andstern regions based on the freeboard exceedences predicted. Anonimity of the FPSO/FSUInstallations has been respected by removing the Installation names in this report.
Section 3 describes the green water phenomenon, and Section 4 describes the background to the‘GreenLab’ software development. Brief details of the size and locations of the UK and NorwegianInstallations follow in Section 5. The basis of the ‘GreenLab’ analysis is given in Section 6 and theresults are described in Section 7 in terms of the susceptibility defined as levels of freeboardexceedence at the bow, sides and stern of the Installations.
Section 8 describes the sensitivity of green water to wave parameters and Installation draught. Thecorrelation of ‘GreenLab’ predictions with the recorded wave incidents is investigated in Section 9 andSection 10 contains some general guidance on mitigation of risk. The conclusions of the study aregiven in Section 11, followed by Section 12 on future research developments into the green water andwave slam physics to improve understanding.
3

4

3 GREEN WATER LOADING
Green water is defined as unbroken waves overtopping the bow, side or stern structures of monohullshaped FPSO/FSUs.
With the trend to install ‘permanent’ FPSO/FSUs in increasingly harsh environments, the problem ofgreen water spilling over the bow in large waves becomes an important design aspect. Due to theweathervaning character of turret moored systems, the bow of an FPSO/FSU is always exposed to thewaves. Green water can cause damage to sensitive equipment at the bow, such as control valves,ESD systems, fire detection / protection systems, cable trays etc.. For FPSO types with theaccommodation at the bow, the same susceptibility to damage applies to the front of theaccommodation deckhouse and helideck.
Recent experience with FPSOs in the North Sea confirms that green water loading can cause seriousdamage in the bow region. This can result in the need for repairs and production downtime. It has alsobeen observed that in slightly non-collinear wind, waves and current, green water can occur over thesides around midships. In addition, green water has been observed at the stern particularly in the caseof traditional tankers converted to FPSOs with no poop deck.
5

6

4 BACKGROUND TO 'GREENLAB' DEVELOPMENT
To take into account the aspect of green water loading in the design of FPSO/FSUs for harshenvironments, the Joint Industry Project 'F(P)SO Green Water Loading' was carried out in 1997 by theMaritime Research Institute Netherlands (MARIN). The main results of the Joint Industry Project(JIP) have been published in the open literature to make them available to the industry (Ref 1 - 5).
The JIP was based on extensive tests of instrumented models with different hull shapes and deckconfigurations. The JIP followed an integrated approach that considered green water loading incombination with drift forces and ship motions. Both new builds as well as existing tankers wereconsidered in the study.
The results and conclusions of the JIP were made available to the participants in a report together witha computer design tool ‘GreenLab’. This software can be applied to specific monohull-shapedFPSO/FSUs, enabling measures against green water to be evaluated interactively. It should be notedthat in developing the 'GreenLab' software package, it was not the intent to displace the value andimportance of running model tests to evaluate green water susceptibility.
The ‘GreenLab’ methodology for the prediction of extreme freeboard exceedences is based on acombination of linear diffraction analysis with non-linear corrections based on the JIP model testresults. The methodology is further described schematically in Figure 1. As soon as the maximumfreeboard exceedence is known, other aspects (such as water heights and impact loads) are calculatedbased on the relations found in the model tests. The relative motions between the waves and thevessel form the basis of the green water calculations. When these exceed the freeboard level, greenwater will flow over the deck or bulwark.
7

8
5 NORTH SEA FPSO/FSU LOCATIONS, SIZES ANDOPERATIONAL HISTORY
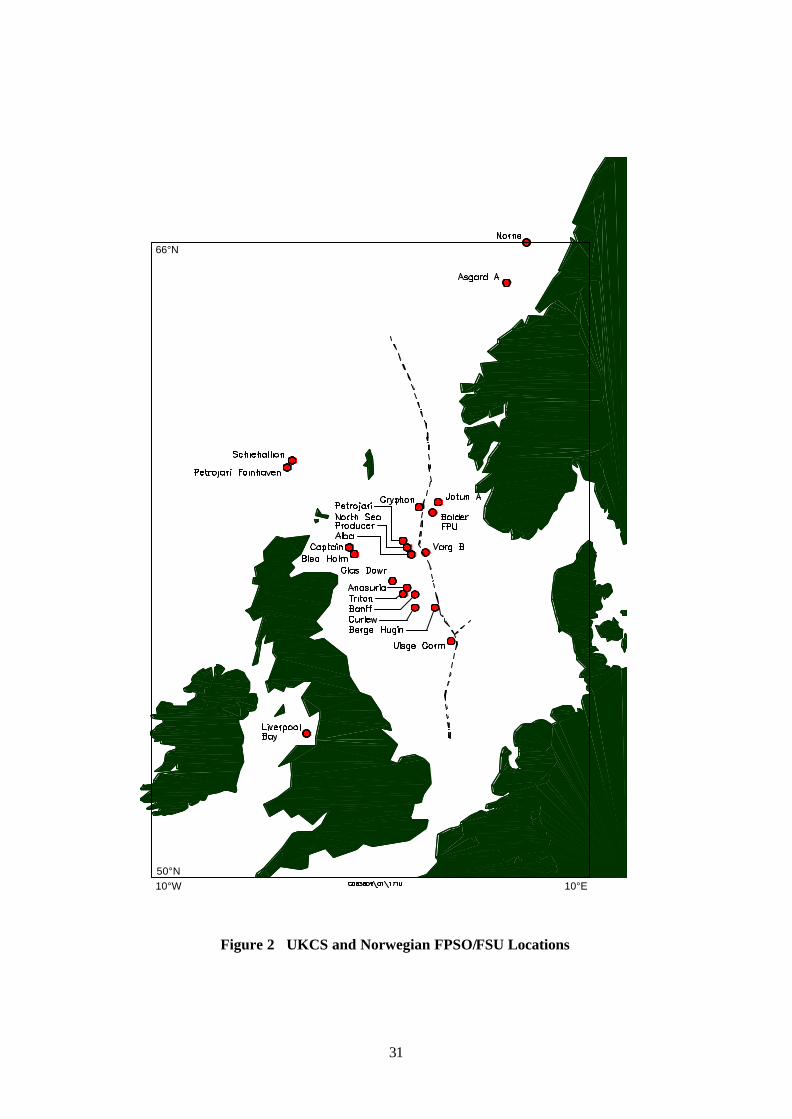
Recently there were 16 FPSOs located on the UK Continental Shelf: the majority situated in theCentral North Sea, two located West of Shetland and one in the Liverpool Bay area, (refer to Figure2).
'Schiehallion' is currently the largest with a displacement of nearly 200,000 tonnes and the smallest isthe 'Ramform Banff' at 32,000 tonnes. The average size is 120,000 tonnes displacement correspondingto the size of a medium crude carrier. Some are tanker conversions (Maersk D-class) or similar newhull designs.
There are also five FPSOs employed in Norwegian waters. The largest in displacement terms is'Asgard A' (slightly smaller than 'Schiehallion') and the smallest is 'Balder' which is slightly larger than'Petrojarl Foinaven'.
The increase in numbers of these North Sea Installations from 1982 onwards is shown in Figure 3 andthe approximate operational history is shown diagrammatically in Figure 4. The total operationalexperience amounts to some 88.5 vessel years. 'Petrojarl 1' has the longest track record of 12 yearsand has operated on several fields in both the UK and Norwegian sectors of the North Sea.
9

10

6 BASIS OF 'GREENLAB' ANALYSIS
Because this work formed part of a 'GreenLab' review exercise of UKCS FPSO/FSUs, certainassumptions were necessary which might not, in practice, best represent the true operational situation,particularly in adverse weather conditions. For example, the maximum operational draught and zerotrim have been assumed throughout the exercise. In all the green water calculations, a wave spectrumpeak enhancement factor (gamma) was assumed to have a value of 3.3 which is typical for a NorthSea environment.
'GreenLab' uses standard peak period values of 12, 14 and 16 seconds and the associated significantwave height defined by the user for the specific field location. It was necessary to devise arelationship between these peak periods and the corresponding wave heights. An approximate formulawas therefore developed to calculate the required wave heights for peak periods lower than themaximum, as follows:
H = (8Hs - 9(Tp-T))/8 (1)
where T is the period for which H is required, with the condition that H cannot be greater than theextreme design return values. This line would follow the upper contour of the scatter diagram (seeFigure 14 for a plot of this line for a representative FPSO).
The probability of exceedence of green water on deck calculated in 'GreenLab' is approximately 1 in1000 which corresponds to the most probable maximum value for a storm duration of 3 hours. Theprogram produces a curve of probability of exceedence vs relative motion that intersects this probabilitylevel to give a Most Probable Maximum (MPM) relative wave motion in metres, see Figure 5.
The 'GreenLab' program predicts green water exceedences at the bow, side and stern of anFPSO/FSU. More specifically, the water height on deck is determined at three locations at the bow,five positions along the side and one position at the extreme aft end as shown in Figure 6.
The side freeboard exceedence predictions are made at positions defined by the intersection with theside shell of 30-degree sectors from the vessel centre (in plan). Stern exceedence is determined at thetransom on the centre line.
In addition to the green water height predictions, the corresponding pressures are given as programoutput. Furthermore, for the FPSO/FSU bow, the loads on a reference structure and horizontal pipeare calculated although not included in this report.
The data required to run 'GreenLab' consists of the principal particulars of the hull, maximum loadeddraught, bow and stern shape, the contour of the deck edge (to define the freeboard), the maximumdesign environment in terms of significant wave height (Hs), the peak wave period (Tp) and the designcurrent (Vc).
The data was initially compiled from the Installation Safety Case (as submitted to the HSE) andrequests for information from the FPSO/FSU Duty Holder. The freeboard contour definition wasdetermined from the general arrangement drawings, and the bow flare determined from the body plan.
11

Before embarking on the analysis, this data was confirmed with the Installation Duty Holders as anaccurate basis for the study.
Definitions of the ‘GreenLab’ output are given in Tables 1 to 3 and the units are defined as follows:
� Freeboard exceedence in metres of water head (m)� Water velocity in m/s� Pressure in kPa = 0.01 Bar = 0.10 tonnes / m2� Force in kN = 0.102 tonnes� Moment in kNm
Total force(per meterlength) on a200 mmdiameterpipe on thebow atH2O,placedathwartshipand 0.5 mabove thedeck
Localpeakimpactpressureon thelowerpart ofthestructure
Maximumtotalmoment(aroundthe decklevel) onthestructure
Maximumtotalhorizontalforce onthestructure
Waterpressure onthe deck atthe foreperpendicular(P0) and 10m(P10) and20m (P20)aft of FP
Maximumexpectedvelocity ofthe greenwaterfront overthe deck
Actual greenwater heighton the deckat the foreperpendicular(FP), (H0)and 10m(H10) and20m (H20)aft of FP
Mostprobablemaximumexceedenceoffreeboardby the(relative)waves atthe bowcentreline
Press(kPa)
Mmt(kNm)
Load(kN)
Pipe load(kN/m)
Structural Load(A flat plate reference structure15 m wide and 20 m high at the
centreline of the Installation,with its flat front 20m from the
fore perpendicular)
Waterpressure
(kPa)
Velocity(m/s)
Green wateron deck
(m)
MPM F’bdExceedenc
e(m)
It should be noted in the above table all pressures and pipe loads assume a standard 1.4m high bulwark is installed.
Table 1 Bow Green Water
12

Local peak impact pressure on a structure placed10 m from side of the Installation (not directlyapplicable to slender structures such as pipes andcable trays).
Most probable maximum exceedence of thefreeboard (deck) level at 5 positions along theside of the Installation by the (relative) waves.
Positions are given relative to midships, positiveis to the bow. The local freeboard levels atthese points are taken into account.
Freeboard (m)Freeboard level at this point (m)
Position from midships (m)Position from midships (m)
Load at 10m from side (kPa)MPM Freeboard Exceedence
Table 2 Side Green Water
Local peak impact pressure on a structure placed10 m from stern of the Installation
Most probable maximum exceedence of thefreeboard (deck) level by the (relative) wavesat stern centreline.
Load at 10m from stern (kPa)MPM Freeboard Exceedence
Table 3 Stern Green Water
13

14

7 RESULTS OF GREEN WATER SUSCEPTIBILITY ANALYSIS
The most probable maximum (MPM) values of freeboard exceedence (i.e. the values that have aprobability of exceedence of about 1E-03 in the investigated storm condition and duration) werepredicted using 'GreenLab' for the bow, sides and stern regions of the UKCS Installations.
A LOW level of freeboard exceedence was defined as less than 3 metres water height, between 3 and6 metres was classed as a MEDIUM susceptibility, and above 6 metres as a HIGH susceptibility.These three categories of susceptibility were devised for reference only to indicate those areas of deckthat may be more prone to shipping green water.
Because of the unusual hull shape and dimensions of 'Ramform Banff', this FPSO was not included inthe analysis as it did not fit well with the model shapes and proportions tested during the JIPdevelopment of 'GreenLab'.
The ‘GreenLab’ analysis results for the remaining 15 UKCS Installations indicate the following notionalvalues for green water susceptibility at the bow, sides and stern. The 5 Norwegian Installations takenfrom Ref 7 are shown in brackets.
Bow Area� 7(3) Installations susceptible to a HIGH level� 5(1) Installations susceptible to a MEDIUM level� 3(1) Installations susceptible to a LOW level
Side AreaFor 15 degrees heading angle to waves� 2(1) Installations susceptible to a HIGH level� 12(4) Installations susceptible to a MEDIUM level� 1 Installation susceptible to a LOW level
For 30 degrees heading angle to waves� 13 Installations susceptible to a HIGH level� 2 Installations susceptible to a MEDIUM level
Stern Area� 10 Installations susceptible to a MEDIUM level� 3(2) Installations susceptible to a LOW level� 2(3) Installations not susceptible
It is important to note that the levels of green water susceptibility defined above (i.e. LOW, MEDIUMand HIGH) do not necessarily imply that there is likely to be a serious safety implication for theFPSO/FSU. The different 'levels' only give an indication of the likelihood of green water occurrencesand not the consequences of such events. An Installation with a HIGH ranking of green watersusceptibility can still be safe if appropriate prevention and/or protection measures have beenimplemented.
15

Conclusions from the 'GreenLab' predictions, stated above, can be summarised as follows:
Bow Area� Nearly one-half of UK FPSO/FSUs may be exposed to HIGH bow green water susceptibility
Side Area� The majority of FPSO/FSUs are susceptible to side green water� Vessel heading significantly influences green water on the side and the majority would be
highly exposed to waves for a high incident angle of 30 degrees relative to head seas
Stern Area� None of the FPSO/FSUs are at HIGH susceptibility to stern green water
16

8 SENSITIVITY OF BOW GREEN WATER TO TP, HS,FREEBOARD AND GAMMA
A limited sensitivity study was carried out for one of the Installations representative of a number ofInstallations susceptible to green water at the bow. The intention was to investigate how bow greenwater varies with wave height and period together, wave height separately, draught and gamma (thespectral peak factor).
Results from 'GreenLab' show the sensitivity of freeboard exceedence and hence water on deck overa range of periods and the corresponding significant wave heights derived from equation (1) in Section6. The conclusion was that the maximum freeboard exceedence (water on deck) occurs at conditionsless than the design maximum condition (refer to Figure 7). The significance of this is that thefrequency of bow green water occurring may be greater than was first thought, as the wave height andperiod (showing maximum response) could be closer to the 1-year return period values rather than thedesign return period (e.g. 100-year). For this representative Installation, the extent of bow green waterreduced steeply for smaller waves below the peak response.
With reference to Figure 8, a near linear increase of bow green water occurrence with increasingsignificant wave height was demonstrated (for the same Tp) for this representative hull shape and flareangle.
Bow green water becomes less likely with decreasing draught (as expected and demonstrated in Figure9). However, it should be noted that for a fixed draught, an increase in freeboard (by raising bulwarkheight) does not result in the same decrease in freeboard exceedence due to the non-linearities in thegreen water phenomenon (see Ref 4).
The wave spectrum is defined mathematically by a JONSWAP spectrum formulation matchingmeasured data for an area. The peak enhancement factor, gamma, depends principally on the sea andswell components, and a value of 3.3 is typically adopted for North Sea applications. However, gammacan vary between about 1.0 and 5. From the results of 'GreenLab' (for the same Hs and Tp), a lowergamma produced a lower freeboard exceedence and less green water on deck. The sensitivity isshown in the Figure 10 indicating approximately a 1.5 metre reduction in freeboard exceedencebetween a gamma of 5 and 1. Green water heights on deck will therefore be correspondingly less.
There appeared to be no correlation of freeboard exceedence with FPSO length, displacement,maximum design wave height and period or location. There was some correlation of freeboardexceedence with freeboard (rather obviously) at the bow, sides and stern regions (Figure 11).
17

18

9 GREEN WATER INCIDENTS AND 'GREENLAB' CORRELATION
Following a data collection exercise, recorded wave incidents on UKCS and Norwegian FPSO/FSUswere examined. From 1995 to date, 17 green water and 2 wave slam incidents have been identified on12 FPSO/FSU Installations, two of which are not currently operating. Some Installations haveexperienced more than one incident. No wave incidents have been reported prior to 1995, but half ofthe Installations have been affected to some extent by wave damage since then.
Figure 12 shows the cumulative number of incidents divided by the cumulative operating years. Todate, the available data indicates an average frequency of between 0.21 and 0.28 incidents peroperating year, depending on the number of operating years assumed. The lower figure includes anincident-free period prior to 1995, whereas the higher figure relates only to operating yearsaccumulated post 1995. These figures represent a frequency of 1 incident occurring every 3.6 to 4.8operating years approximately.
Further inspection of the data shows that January and February contain the highest number of events,which is to be expected, compared with summer months. It is further believed that the recorded waveevents were only the major incidents causing damage, and that there may be substantially moreunreported.
There is good correlation between the locations of wave incidents with the predetermined green watersusceptibility levels (Figure 13 refers). For example, 7 green water incidents at the bow occurred onthe 10 Installations categorised in Section 7 as having a HIGH susceptibility rating at the bow. Analmost equal number of incidents have occurred at the bow and sides of the Installations (which isperhaps surprising), whereas the stern has few recorded wave incidents.
Having established a correlation between the predictions of FPSO/FSU susceptibility to green waterevents and the wave incidents reported, the freeboard exceedences were estimated (again using'GreenLab') for the conditions prevailing at the time of the incidents.
The recorded wave incidents consisted of 26 areas of damage classified as at the bow, sides and stern.Two of these were bow slam incidents not expected to show green water on deck (and are notincluded in Figure 13). The ‘GreenLab’ analysis correctly predicted green water on the deck for all(24) of the recorded damage areas. 18 of the 24 damages (75%) show agreement with the predictedmaximum susceptibility levels (HIGH, MEDIUM or LOW). The remainder underpredicted by onesusceptibility category. This effectively gave confidence in the 'GreenLab' software to predict levels ofpotential freeboard exceedence and the areas susceptible to green water damage.
A comparison of the maximum design conditions for the Installations, with the Hs and Tp determined(as far as possible) at the time of the wave incidents, showed that all the incidents occurred at lowervalues of height and period than the design conditions (refer to Figure 14 where an example Hs-Tprelationship has been included). This is in agreement with previous work that implies that conditionslower than the design maxima for FPSO/FSUs are more likely to give rise to wave incidents. This hasimplications for the expected frequency of wave events, operational procedures and futurerequirements for design and model testing.
19

20

10 GENERAL GUIDANCE ON MITIGATION OF RISK
Several of the UK sector FPSO/FSUs have experienced green water damage to topside equipment tosome degree, and four out of the five Norwegian sector FPSOs have also reported such incidents (Ref.7). Some of the measures which can be investigated to reduce the effects of green water forFPSO/FSUs are summarised here.
The FPSO/FSU originated from tankers where green water is an accepted risk and the equipment isdesigned for resistance to green seas, although tankers have forward speed and are not tethered. Forearly FPSO/FSUs, the phenomenon of green water may not have been given the attention necessaryby the topside or hull designers, and model tests have not always included the critical wave conditionsfor green water. Recent experience has led to a greater awareness of potential damages from greenwater and in some cases actions and procedures have been implemented to reduce the risk. Theseinclude the following:
Physical actions� Bow protection structures such as breakwaters and higher bulwarks� Side protection walls� Raising poop deck or bulwark aft� Raising equipment / piping to reduce the loading� Protection of process, deck equipment, cable trays, hydrants and evacuation equipment� Resiting local services and structures� Redesign of structural details to resist wave loads� Reassessment of green water using mathematical or physical models
Operational actions� Restriction of draught (storage) particularly in winter conditions� Operation of the FPSO/FSU with stern trim where bow green water is more likely than
elsewhere� Heading control to reduce wave incidence angles and side green water� Restriction of personnel access in green water zones
All of these actions may not be possible or appropriate for any given existing Installation. Principalattention should be paid to personnel safety, evacuation and escape, and the safety of the Installation.Also, some actions may not be desirable for a particular FPSO/FSU. For instance the effect ofincreasing bulwarks could adversely impact on the environmental loads transmitted to the mooringsystem.
Because green water loading is an important aspect in the safety of FPSO/FSUs, it should be takeninto account in the design. Generally, there are three ways to manage the problem of green water:
� prevention� protection� prevent it as far as possible and protect against the remaining part.
21

This requires an optimum design of the hull shape and the (protecting) structure on the upper deck. Itshould be noted, however, that an optimisation with respect to green water prevention can affect otheraspects, such as wave drift (and mooring) forces on the ship. In Ref 3 it was concluded that "it is notpossible to optimise a bow of an FPSO/FSU on one aspect only. A bow optimised on green waterloading may increase the mooring forces and vice versa". An integrated approach is thereforenecessary, which considers green water loading, drift forces and ship motions. The optimum design isthen dependent on the combination of environmental conditions, water depth, functional requirementsand given boundary conditions.
22
11 CONCLUSIONS FROM THE 'GREENLAB' ANALYSIS ANDINCIDENT CORRELATIONS
This report has described a study for the UK Health and Safety Executive that examined thesusceptibility of UKCS FPSO/FSUs to green water. The intent was to raise awareness of potentialincidents and the predictions from the ‘GreenLab’ software have been communicated to the DutyHolders of these Installations.
The Norwegian FPSOs have been included (as far as possible) in the summaries of freeboardexceedence expressed in terms of susceptibility levels or bands of severity for bow, side and sternlocations. All Installations were subject to the assumptions of operating at full draught and even keelin environmental conditions up to and including their design maxima.
Observations have been made in relation to the general population of FPSO/FSUs installed in theUKCS and it is found that:
� nearly one-half may be exposed to HIGH bow green water levels� compared with the maximum design condition, significantly more green water volume is likely
to occur in certain situations with lower wave height and period� freeboards are generally insufficient to prevent green water occurrence in the fully-loaded
condition� the majority are susceptible to side green water loading - the worst area being aft of midships,
made worse by larger heading angles relative to waves� none is at a HIGH susceptibility to stern green water. There is, however, a trend for the larger,
longer period waves to show more green water at that location.
It is important to note that the analysis dealt with susceptibility and not the consequences of shippinggreen water on deck.
The greatest number of wave incidents occur in the winter months. Also, it was shown that with thegrowing number of these units in the UKCS and Norwegian waters, the incident rate is increasing.About half of the Installations currently in service have been affected by wave incidents of some kind.There appeared to be reasonable correlation between the recorded green water incidents and thepredictions produced by the ‘GreenLab’ software.
The data has shown that the 19 incidents have generally occurred in wave conditions much less severethan their design maxima. This is not a new finding, but the implication is that the frequency of waveincidents could be an annual event for some FPSO/FSUs unless operational procedures / mitigationmeasures are applied. However, the levels of green water susceptibility predicted do not necessarilyimply that there are serious safety implications for the FPSO/FSUs operating today providedappropriate prevention and/or protection measures have been implemented.
It should be emphasised that the 'GreenLab' software used in this present study indicated whether andwhere (heavy) green water can be expected. The study enabled a comparison to be made betweendifferent FPSO/FSUs. A more detailed diffraction analysis and a large-scale model test with the actual
23

deck configuration is still recommended for a complete analysis of a specific FPSO/FSU, with inputsand test parameters that reflect the actual operating conditions (e.g. draught, trim, environment etc.).
24

12 FUTURE RESEARCH DEVELOPMENT WORK
12.1 THE ‘FLOW’ - JOINT INDUSTRY PROJECT
The results presented in this paper have shown that green water loading and wave impact loading onthe hull are important aspects for FPSO/FSUs. To take these aspects into account in the design of safeand economical floaters, the 'FLOW' (Floater Loading by Waves)-JIP was initiated by a number ofspecialist companies/organisations in this field and co-ordinated by MARIN (see Ref 8).
The main objective of the FLOW-JIP is to develop guidance, calculation methods and risk assessmentprocedures for green water and wave impact loadings appropriate to each stage of an FPSO/FSUproject, namely: concept development, detailed design and operation. This will be achieved, firstly, byfully understanding the problem of green water and wave impact loading and then, by developingmethods either to avoid the problem, or to predict its effects so that these can be taken into account inthe design and operation of safe and economical FPSO/FSUs. It is also expected that the methodologyand design tools developed in this JIP will give valuable input to solving other important wave impactaspects like; run-up, wave-on-deck loads on fixed platforms etc.
The ‘FLOW’ - JIP focuses on all aspects that are important in the problem of green water and waveimpact loading. Four JIP subtasks and objectives have been identified:
� WAVES: Identification of critical wave (weather) conditions for wave impact problems andtheir physics and development of probabilistic wave models
� HYDRODYNAMIC LOADING: Understanding of wave impact and green water physics,and development of methodology for the prediction of impact loading.
� STRUCTURAL: Define a wave impact loading and response calculation methodology
� RISK AND DESIGN: Develop a risk-based methodology for wave impact loading issues indifferent phases of an FPSO/FSU project
JIP participants can be actively involved in the project, lessons learned from previous work will be usedin the project and there will be a strong coupling between different tasks. The JIP makes use ofstate-of-the-art numerical simulation methods, model tests and full-scale measurements on the bow ofthe UKCS ‘Schiehallion' FPSO.
There are two phases in the JIP:
� First phase: problem identification and preliminary design guidance� Second phase: development of prediction method and final design guidance
The main deliverable of the project will be a methodology for the evaluation of wave impact and greenwater effects in the design of FPSO/FSUs. All results of the project will be reported in detailed as wellas summary reports. A design tool will also be one of the deliverables. The project will be implementedin such a way that the results can be used by FPSO/FSU designers, oil companies, shipyards, ship
25

operators and Classification Societies. At the moment this JIP has 26 participants. It is to be started atthe end of this year and will be completed in 2002 (interim results will be available in 2001).
12.1 RESEARCH ON NUMERICAL PREDICTION OF GREEN WATER LOADING
Although green water on the decks of fishing vessels has been predicted numerically in the past, theuse of complex numerical methods for the prediction of green water loading on the bow of FPSO/FSUsis fairly recent. At the latest ‘Numerical Ship Hydrodynamics’ Symposium in July 1999 (Ref 6), newpromising results were presented for the software program ‘ComFlo’, of which an example is shown inFigure 15.
The typical flow and impact loading of the green water on the bow deck can be predicted surprisinglywell. Although their computation time is still enormous - four hours on a fast workstation for thesimulation of 10 seconds reality - in the future, these computer tools will be important for designevaluations and improvements.
26

13 REFERENCES
1. Buchner, B., “The Impact of Green Water on FPSO Design”, OTC 7698, May 1995, Houston.
2. Buchner, B., “On the Impact of Green Water Loading on Ship and Offshore Unit Design”,PRADS '95, September 1995, Seoul.
3. Buchner, B., “The Influence of the Bow Shape of FPSOs on Drift forces and Green Water”,OTC 8073, May 1996, Houston.
4. Buchner, B., “A New Method for the Prediction of Non-Linear Relative Wave Motions”, OMAE'98, June 1998, Lisbon.
5. Buchner, B., “Green water from the side of a weathervaning FPSO”, OMAE ’99, St. Johns, July1999
6. Veldman, A.E.P., Fekken, G and Buchner, B., “Simulation of Green Water Flow Using theNavier-Stokes Equations”, Seventh International Conference on Numerical Ship Hydromechanics,Nantes, July 1999.
7. Ersdal, G. and Kvitrud, A., “Green water on Norwegian Production Ships”, ISOPE ConferenceMay 2000.
8. Morris, W.D.M, Buchner, B. and Millar, J., “Green Water Susceptibility of North SeaFPSO/FSUs, IBC Conference: Floating Production Systems, December 2000.
27

28

FIGURES
29

Linear diffraction analysis Linear relative motions at bow, side and stern
Prediction of non-linear extremes (empirical data from model tests) at bow, side and stern
Most Probable Maximum (MPM) freeboard exceedence for Hs and Tp (16, 14 and 12 secs) at
bow, side and stern
For bow, side and stern, MPM freeboard exceedence, deck water height, pressure and velocity
load / pressure on structures load on horizontal pipes at bow breakwater evaluation at bow
Figure 1 ‘GreenLab’ Methodology
30
10°E10°W50°N
66°N
Figure 2 UKCS and Norwegian FPSO/FSU Locations
31

0
2
4
6
8
10
12
14
16
18
20
22
82 86 88 89 91 92 93 94 95 96 97 98 99 00
Nu
mb
er o
f In
stal
lati
on
s
Norway
UK
Figure 3 Growth of FPSO/FSUs in the UKCS and Norwegian Waters
Name Producing Decommissioned 82 86 88 89 91 92 93 94 95 96 97 98 99 2000 OperatingYears
1 Fulmar FSU 1982 1994 72 Petrojarl 1 1986 123 Seillean (SWOPS) 1988 1997 84 Ailsa Craig 1992 1996 45 Gryphon A 1993 76 Alba FSU 1994 67 Vinga STL 1994 1997 38 Uisge Gorm 1995 59 Liverpool Bay OSI 1996 410 Anasuria 1996 411 Captain 1997 312 Petrojarl Foinaven 1997 313 N.Sea Producer 1997 314 Glas Dowr 1997 stacked 2000 215 Curlew 1997 316 Norne 1997 317 Schiehallion 1998 218 Asgard A 1998 219 Varg B 1998 220 Ramform Banff 1999 121 Bleo Holm 1999 122 Berge Hugin 1999 123 Jotun 1999 124 Balder 1999 125 Triton 2000 0.5
88.5UK 1 1 2 2 3 4 5 7 7 9 13 12 15 15Norway 1 1 1 1 3 5 5Total Units 1 2 3 3 3 4 5 7 7 9 14 15 20 20Op Years 0 1 2 3 3 3 4 5 6 7 8 12 15 19.5Cum Years 0 1 3 6 9 12 16 21 27 34 42 54 69 88.5
Figure 4 Operating History of UKCS and Norwegian FPSO/FSUs
32

0.001
0.01
0.1
1
0 2 4 6 8 12 14 16 18 20
Example Relative Motion (m)
Pro
bab
ility
of E
xcee
den
ce
MPM
10
Figure 5 Probability of Exceedence vs Relative Motion (MPM = Most Probable Maximum)
Figure 6 Positions of Green Water Predictions
33

0
1
2
3
4
5
6
7
8
9
10
11
8 9 10 11 12 13 14 15 16 17
Peak Period (sec)
Fre
ebo
ard
Exc
eed
ence
(m
)
<---
----
----
----
----
-Per
iod
of M
axim
um R
espo
nse-
----
----
----
---
<---
---M
ax 5
0/10
0 - Y
ear D
esig
n P
erio
d---
---
Figure 7 Sensitivity of Green Water with Hs and Tp
0
2
4
6
8
10
12
14
16
4 5 6 7 8 9 10 11 12 13 14
Significant Wave Height (m)
Fre
ebo
ard
Exc
eed
ence
(m
)
Figure 8 Sens itivity of Green Water with Hs
34

0
1
2
3
4
5
6
7
8
9
10
11
12
5 6 7 8 9 10 11 12 13 14 15 16
F r e e b o a r d ( m )
Fre
ebo
ard
Exc
eed
ence
(m)
Figure 9 Sensitivity of Green Water with Freeboard (draught changes)
4
5
6
7
8
9
10
11
0 1 2 3 4 5 6
Gamma
Fre
ebo
ard
Exc
eed
ence
(m)
Figure 10 Sensitivity of Green Water with Gamma
35

-20
-15
-10
-5
0
5
10
15
1 2 3 4 5 6 7 8 9 10 11 12 13 14 15 16 17 18 19 20
(met
res)
Freeboard Exceedence Bow Freeboard
BOW
Reducing freeboard
-10
-8
-6
-4
-2
0
2
4
6
8
1 2 3 4 5 6 7 8 9 10 11 12 13 14 15 16 17 18 19 20
(met
res)
Freeboard Exceedence Side Freeboard
SIDE
Reducing freeboard
-14 -12 -10 -8 -6 -4 -2 0 2 4 6 8
1 2 3 4 5 6 7 8 9 10 11 12 13 14 15 16 17 18 19 20
(met
res)
Freeboard Exceedence Stern Freeboard
STERN
Reducing freeboard
Figure 11 Correlation of Green Water with Freeboard (for Installations numbers 1 to 20)
36

0.00
0.10
0.20
0.30
0.40
0.50
0.60
1994 1995 1996 1997 1998 1999 2000
Rat
io C
um
ula
tive
Inci
den
ts/C
um
ula
tive
O
per
atin
g Y
ears
from 1994from 1982
Figure 12 Statistics of Wave Incidents
Bow Side Stern 1 1 1 1 2 ** 3
Norne 1 1 1 ** 3 3 2 1 1 2 1 6 4 3 3 1 1 5 4 5 6 1 1 1 1 3 2 3
Varg B 2 1 2 1 4 4 2 8 1 1 1 1 2
10 1 1 1 1 2 12 1 1 1 1 7
Balder 2 1 2 3 3 1 Asgard A 1 1 1 1 2
16 1 ? 2
Totals 17 10 11 3 24 18 38
High susceptibility ** lower susceptibility predicted Medium susceptibility Low susceptibility
None / not known
Location
No 'GreenLab' Analysis
UKCS Installation No.
Norway (from Ref 7) Incidents Total Locations
Affected
VESSEL INCIDENTS FPSO/FSUs Freeboard Exceedence
Matching Susceptibility
Category
Operating Years
Figure 13 Green Water Incidents (1995 - 2000) and ‘GreenLab’ Comparisons
37

0
2
4
6
8
10
12
14
16
18
20
8 9 10 11 12 13 14 15 16 17 18 19
Peak Period Tp (sec)
Sig
nifi
can
t w
ave
hei
gh
t Hs
(m)
Design
Incident
Region for Hs/Tp Design Values
Section 6, equation (1)
Figure 14 Scatter Plot of Wave Incidents and Hs-Tp Design Maxima
Figure 15 Green Water Flow Prediction with the Program ‘ComFlo’
38
Printed and published by the Health and Safety Executive C0.50 06/01

OTO 2001/005
£10.00 9 780717 620524
ISBN 0-7176-2052-2