offshore proof - pwc · offshore proof turning windpower promise into performance pwc offshore...
TRANSCRIPT

Offshore proofTurning windpowerpromise into performance
www.pwc.com/utilities
PwC offshore windpowersurvey – based on fieldresearch conducted by GBI

Introduction 3
Executive summary 4
Promise, performance and costs 6
Offshore windpower in Asia 13
Global overview map of offshore windfarms 14
Make or break issues 16
Contacts 26
Contents
2 PwC offshore windpower survey
Methodology
PwC’s offshore windpower survey is based on field research conducted betweenDecember 2010 and February 2011. In total, 57 interviews were carried out withoffshore windpower executives in 12 countries by GBI Research. By country eightinterviews were conducted in Germany, six in Denmark, six in Finland, six in theUnited Kingdom, five in Belgium, five in the Netherlands, five in Sweden, five inSpain, four in Ireland, four in Norway, four in China and three in Japan.Respondents were senior managers and executives from offshore windfarmdevelopers and operators (13), utilities (10), contractor or turbine originalequipment manufacturers (14), government bodies (8) and financial institutionsinvolved in offshore windfarm finance (12). All interviews were conducted bytelephone. Due to rounding, totals may not add up to 100% in some cases.
PwC thanks all the participants who took time to complete the survey. We wouldalso like to thank our local PwC teams for their insightful contributions throughoutthis project.
57 interviews were carried outwith offshore windpowerexecutives in 12 countries
BelgiumChinaDenmarkFinlandGermanyIrelandJapanNetherlandsNorwaySpainSwedenUnited Kingdom

IntroductionOffshore wind generation is fast growing and has great potential to meetenergy needs in the future in a sustainable way. But many challenges –technical, financial and logistical – need to be overcome if this newenergy source is to come of age and take its place as an enduring andsignificant part of the generation mix. The coming few years will be‘make or break’ time in deciding whether offshore windpower will beable to get on track to prove its place as a source of large-scalegeneration. Ultimately, it needs to show it can reach efficiencies and costlevels near enough to onshore installations to make it competitive in theenergy mix.
In ‘Offshore Proof’ we look at this andother challenges, getting the views ofthe major players who are central todetermining the pace of growth of theindustry. We speak to developers,contractors/original equipmentmanufacturers (OEMs), utilitycompanies, government bodies andfinancial institutions. We gatherindustry data on the roll-out andperformance of offshore windgeneration so far. We discuss some ofthe main challenges that developersand contractors are facing. Finally, welook at the ‘make or break’ issues thatwill determine how quickly offshorewind will move from infancy tomaturity.
The findings give cause for optimismwhile sounding a note of caution onthe challenges that lie ahead.Emerging experience from Europeandevelopers suggests that thefoundations are in place for offshoretechnology to match or, if windpotential is realised, surpass onshoreperformance. But the need to reducecosts is immense and it remainsunclear just how far cost reduction cango and when it will be achieved.
PwC offshore windpower survey 3
Manfred Wiegand Global Utilities Leader
Paul NillesenEuropean Renewable Energy Leader

Executive summary
4 PwC offshore windpower survey
The offshore wind industry is coming of age as it moves from apioneering phase to one of large-scale industrial production.‘Offshore Proof’ looks at some of the important challenges facingthe industry with a survey of the views of some of the mainplayers involved – developers, contractors/original equipmentmanufacturers (OEMs), utility companies, government bodiesand financial institutions. Offshore windpower is furthestadvanced in Europe so our survey focuses on Europeanrespondents, but is supplemented with a small number ofinterviews in Asia, where offshore windpower projects arebeginning to be developed.
Much is expected of offshore windpower.Three-quarters of the survey respondentsfrom government bodies anticipate it willplay an enduring role in the energy mix inthe coming 20 years and nearly three-fifths(59%) expect it to be economic withoutsubsidies within 15 years. But doubtsremain about whether technologicaldevelopments will work in favour oragainst offshore wind generation.Although over three-fifths of thegovernment bodies we surveyed thinkthere is a medium to high chance oftechnological breakthroughs boostingoffshore windpower, the same proportionalso acknowledge it could get overtaken bybreakthroughs in other renewabletechnologies.
An important challenge facing the industrywill be to show that onshore turbineperformance can be matched by offshoreperformance. Survey results fromEuropean developers give some cause foroptimism. Offshore wind projects areachieving comparable levels of availabilityto onshore. Fewer than one in fivereported downtime being a greaterproblem than they had expected, with theremainder saying downtime matched theirpre-project expectations.
The biggest challenge facing the industry is to bring costsdown to a range where offshore windpower can compete in the energy mixwith little or no subsidy. But the outlook among contractors/OEMs for costreductions is mixed. The greatest expectation is of a cost decrease in realterms (42% of respondents) but many do not foresee any reduction and,indeed, a quarter actually forecast cost increases.
The prospects for offshorewindpower look bright, according to many of the government respondents to our survey. Three-quarters are reasonably confident that it will play anenduring part in the energy mix in the coming 20 years andthree-fifths expect it to be economic without subsidies within 15 years.

PwC offshore windpower survey 5
All of the European developers in oursurvey reported capacity availability ratesin the 90%-97% range. But availabilityneeds to be matched by good windconditions and, while some respondentsclaim that their wind projections areachievable, there has been concern aboutrecent low wind conditions in the NorthSea, particularly in the winter of 2009/10.
The biggest challenge facing the industry isto bring costs down to a range whereoffshore windpower can compete in theenergy mix with little or no subsidy. Howfar costs need to fall will partly be drivenby fossil fuel and carbon prices, but also byconsumer sentiment towards payingcontinuing subsidies. Will greater scaleand technological maturity translate intocost reductions? The outlook amongEuropean contractors/OEMs onconstruction and turbine costs is positivebut mixed. The greatest expectation (42%of contractor/OEM respondents) is of areal-terms cost decrease but many do notforesee any reduction and, indeed, aquarter actually forecast cost increases.
We also report on a number of other ‘makeor break’ issues. Construction andtechnological risk is a significant barrier toinvestment. But we found that the riskperception of offshore windpower isimproving in the minds of the Europeanfinancial institutions we surveyed. Nearlytwo-thirds said offshore windpowerinvestment risk was reducing and only asmall percentage (9%) thought that riskshad increased in the past two years.
Supply chain management is a majorchallenge. Nearly all of the developers saidsupply chain capacity constraints are asignificant problem for offshore windconstruction to such an extent that 82%said they create the risk of a seller’smarket. A majority saw supply chain risksas likely to increase in the future. But fewthought it would be harder for them tomanage future supply chain risks and two-thirds were satisfied with how theyhad managed such risks so far.
We tested investor sentiment towardsoffshore windpower compared to otherforms of clean energy investment. Onshorewind generation is favoured over offshoregeneration and biomass/biogas is viewedin particularly favourable terms. Incontrast, solar power is viewed lessfavourably, reflecting its immaturity as asource of utility-scale generation. In aquestion asked before the earthquake andnuclear emergency in Japan, theinvestment potential of nuclear wasfavoured over offshore windpower. But ina follow-up question asked six weeks afterthe earthquake, three-quarters of the samerespondents said their investmentsentiment had shifted negatively againstnuclear. Of course, the exact long-termimpact of the events at the Fukushimanuclear power plant is still uncertain.
The need for greater certainty andagreement between the industry andgovernments is illustrated by a mismatchbetween industry and government bodyperceptions of subsidy arrangements.Ninety per cent of the European utilitycompany survey respondents saiddiscussions between the industry andgovernments about financing and subsidymechanisms still needed improvement. Nogovernment body respondents were of thesame point of view. Set against this, thereis considerable consensus on matters suchas the need to improve grid access andtransmission capacity.
Bottlenecks and supply chainconstraints mean supply chain management is a major challenge facing developers. Nearly all of thedevelopers we surveyed said supply chain capacityconstraints are a significant problem for offshore windconstruction to such an extent that 82% said they create therisk of a seller’s market.
Offshore windpower risk perceptionsare improving. Nearly two-thirds of the European financialinstitutions we surveyed say offshore windpower investmentrisk has reduced in the past two years. Only a smallpercentage (9%) thought that the risks had increased.
6 PwC offshore windpower survey
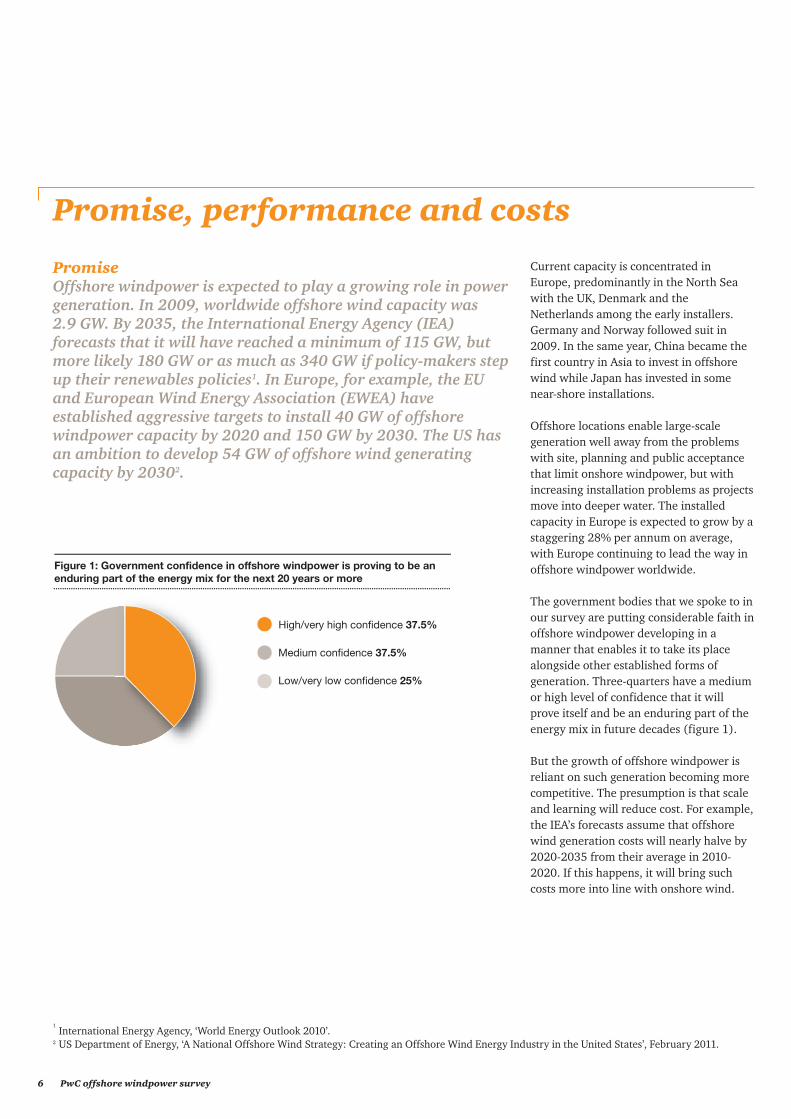
PromiseOffshore windpower is expected to play a growing role in powergeneration. In 2009, worldwide offshore wind capacity was 2.9 GW. By 2035, the International Energy Agency (IEA)forecasts that it will have reached a minimum of 115 GW, butmore likely 180 GW or as much as 340 GW if policy-makers stepup their renewables policies1. In Europe, for example, the EUand European Wind Energy Association (EWEA) haveestablished aggressive targets to install 40 GW of offshorewindpower capacity by 2020 and 150 GW by 2030. The US hasan ambition to develop 54 GW of offshore wind generatingcapacity by 20302.
Promise, performance and costs
Current capacity is concentrated inEurope, predominantly in the North Seawith the UK, Denmark and theNetherlands among the early installers.Germany and Norway followed suit in2009. In the same year, China became thefirst country in Asia to invest in offshorewind while Japan has invested in somenear-shore installations.
Offshore locations enable large-scalegeneration well away from the problemswith site, planning and public acceptancethat limit onshore windpower, but withincreasing installation problems as projectsmove into deeper water. The installedcapacity in Europe is expected to grow by astaggering 28% per annum on average,with Europe continuing to lead the way inoffshore windpower worldwide.
The government bodies that we spoke to inour survey are putting considerable faith inoffshore windpower developing in amanner that enables it to take its placealongside other established forms ofgeneration. Three-quarters have a mediumor high level of confidence that it willprove itself and be an enduring part of theenergy mix in future decades (figure 1).
But the growth of offshore windpower isreliant on such generation becoming morecompetitive. The presumption is that scaleand learning will reduce cost. For example,the IEA’s forecasts assume that offshorewind generation costs will nearly halve by2020-2035 from their average in 2010-2020. If this happens, it will bring suchcosts more into line with onshore wind.
Figure 1: Government confidence in offshore windpower is proving to be an enduring part of the energy mix for the next 20 years or more
High/very high confidence 37.5%
Medium confidence 37.5%
Low/very low confidence 25%
1International Energy Agency, ‘World Energy Outlook 2010’.
2 US Department of Energy, ‘A National Offshore Wind Strategy: Creating an Offshore Wind Energy Industry in the United States’, February 2011.

PwC offshore windpower survey 7
At present, offshore wind developmentrelies on government subsidy. Subsidypolicies, as well as being a means ofdelivering carbon reduction targets, areviewed by governments as a foundation onwhich offshore wind generation can growto a point where it can develop withoutsubsidy. Three-quarters of the governmentrespondents to our survey expect that thiswill happen within a 10-20 year timetable,with the majority of these anticipating thatoffshore windpower will be economic inthe marketplace within 15 years. Nearly afifth (17%) are more optimistic, pointingto a timetable of ten or fewer years (figure 2).
But these expectations are far fromcertain. A major uncertainty istechnological change. Breakthroughs intechnology could support offshorewindpower growth or, possibly, undermineit, if rival renewable technologies prove tobe more sustainable. Our governmentrespondents expect technologicalbreakthroughs to be more likely to work infavour than against offshore windpower(figure 3).
Over a third believe there is a high or veryhigh chance of technologicalbreakthroughs supporting its development.None gave such high ratings to the chanceof offshore windpower being overtaken bybreakthroughs in other renewabletechnologies that will undermine its partin the energy mix in the next 20 years. But over three-fifths sound a cautious note– saying that there is a medium chance ofoffshore wind being eclipsed by othertechnologies.
Figure 2: In what timeframe do governments expect offshore windpowerto become economic without subsidies?
10 to 15 years 42%
Less than 10 years 17%
15 to 20 years 17%
Not clear 16%
Never 8%
Figure 3: Technological uncertainty – will technological breakthroughs support or undermine offshore windpower in the energy mix over the next 20 years? (Government respondents)
High/very high chance
0 100%
37.5%
25%62.5%
37.5%37.5%
Medium chance
Low/very low chance
Support
Undermine
Turning or rusting?
Technological change can alter the landscape dramatically.Thirty years ago few knew about the potential of the internetor predicted the decline of traditional mail. In another 30years’ time, will offshore wind turbines be mainstay majorenergy sources? Or could they be rusting relics?
Where will technological breakthroughs take us? Nearly two-thirdsof government respondents think technological breakthroughs willspur offshore windpower. But the same proportion see a chance thatoffshore wind will be overtaken by breakthroughs in otherrenewable technologies in the next 20 years.
8 PwC offshore windpower survey
Performance
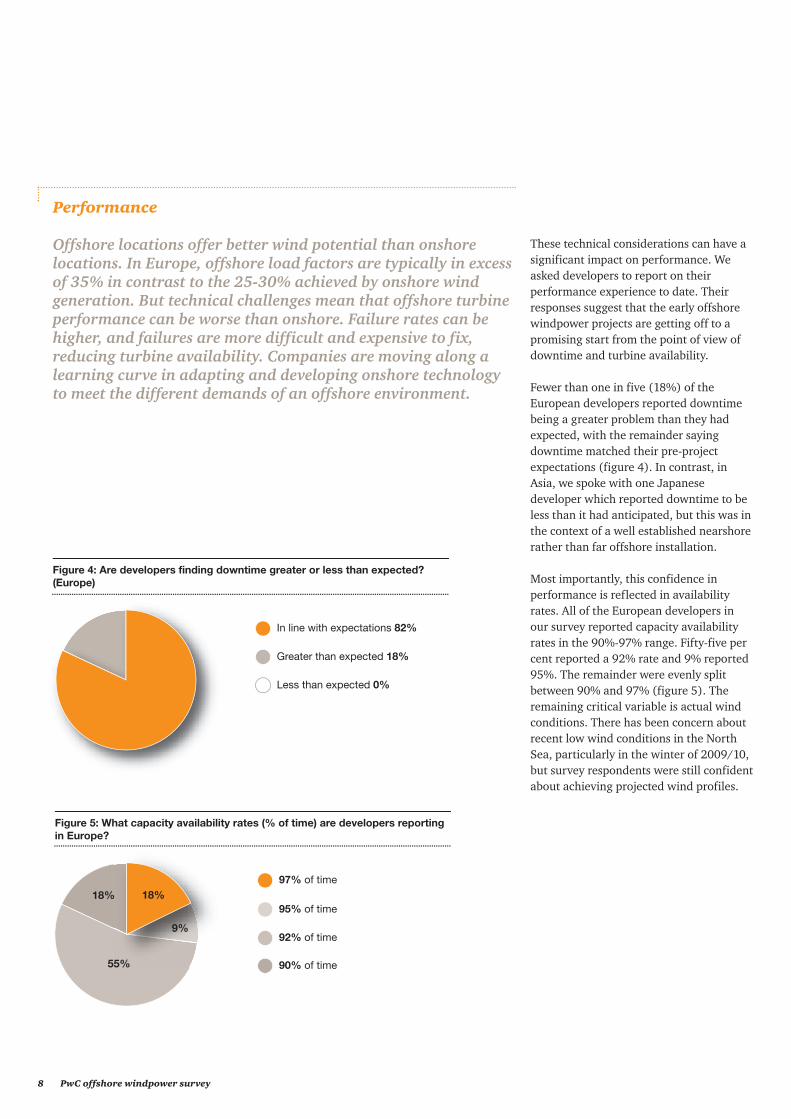
Offshore locations offer better wind potential than onshorelocations. In Europe, offshore load factors are typically in excessof 35% in contrast to the 25-30% achieved by onshore windgeneration. But technical challenges mean that offshore turbineperformance can be worse than onshore. Failure rates can behigher, and failures are more difficult and expensive to fix,reducing turbine availability. Companies are moving along alearning curve in adapting and developing onshore technologyto meet the different demands of an offshore environment.
These technical considerations can have asignificant impact on performance. Weasked developers to report on theirperformance experience to date. Theirresponses suggest that the early offshorewindpower projects are getting off to apromising start from the point of view ofdowntime and turbine availability.
Fewer than one in five (18%) of theEuropean developers reported downtimebeing a greater problem than they hadexpected, with the remainder sayingdowntime matched their pre-projectexpectations (figure 4). In contrast, inAsia, we spoke with one Japanesedeveloper which reported downtime to beless than it had anticipated, but this was inthe context of a well established nearshorerather than far offshore installation.
Most importantly, this confidence inperformance is reflected in availabilityrates. All of the European developers inour survey reported capacity availabilityrates in the 90%-97% range. Fifty-five percent reported a 92% rate and 9% reported95%. The remainder were evenly splitbetween 90% and 97% (figure 5). Theremaining critical variable is actual windconditions. There has been concern aboutrecent low wind conditions in the NorthSea, particularly in the winter of 2009/10,but survey respondents were still confidentabout achieving projected wind profiles.
Figure 4: Are developers finding downtime greater or less than expected?(Europe)
In line with expectations 82%
Greater than expected 18%
Less than expected 0%
Figure 5: What capacity availability rates (% of time) are developers reportingin Europe?
92% of time
90% of time
97% of time
95% of time18%
55%
9%
18%
PwC offshore windpower survey 9
Developers report that this earlyoperational performance is translating intoa robust return on investment. The surveygathered data on matters such as internalrates of return (IRRs) and other measuresof offshore wind investment value.Developers report post tax IRRs typically inthe 10-15% range. This was the case for82% of the European developers. None ofthe developers said that post-tax returnswere turning out lower than expected.Instead, all reported them to be on courseand, indeed, nearly a fifth (18%) said theywere higher than expected.
If the IRR exceeds the weighted averagecost of capital (WACC), the projects have apositive economic return. The WACC maydiffer between projects and countries dueto differences in the risk profile. In generalthe WACC for wind projects is relativelylow as the project returns are stable due tothe subsidy schemes. In European marketsthe WACC of developed offshore projects iscloser to 10% than to 15%. This suggeststhat the IRR of the majority of offshorewind projects exceeds the WACC and thatthe projects are economically profitable.
Classic ways to bring down costs are to focus on scale and scope.Scale allows players to benefit from standardisation, bulkpurchasing and learning effects. Scope, on the other hand, allowscompanies to benefit from using fixed investments for more thanone purpose.
In the case of offshore windpower, where scaling up is currentlyunderway, other ways to reduce or manage costs can come frommore effective allocation of risks between parties. Heregovernments can play a critical role, such as by taking away risksassociated with permitting. Another way to reduce costs is throughgreater cooperation, for example by enabling the sharing ofcertain facilities that all parties need, such as harbour facilities.
Offshore windpower dialogue:Reducing costs
Cost reduction is critical if offshore wind is to become economicwithout subsidies. But how can costs be brought down?

10 PwC offshore windpower survey
Costs
Cost is the most significant factor holding back offshore winddevelopment. High capital costs arise because turbines need tobe capable of withstanding hostile operating conditions at seaand there are increased costs related to turbine foundations,balance-of-system infrastructure, interconnection andinstallation. In addition, there are the costs of the facilitiesneeded for manufacturing and transportation, such as portinfrastructure, vessels and assembly facilities. Financing costsare also higher because of the increased risk perceived byinvestors and lower gearing possibilities.
A study commissioned by the UKgovernment, taking account of upfrontcapital costs and ongoing operating andmaintenance (O&M) costs, estimated thelevelised cost of offshore wind generationwas £144 per MWh in 2009. Thiscompared with the study’s assumed long-term estimate of £60/MWh for futurewholesale power3. The gap has to be metby subsidies. A 2011 US Department ofEnergy study reached similar conclusions,estimating that offshore windpower’s ‘costof energy’ projections would need to be cutby more than 50% for the country’soffshore wind strategy to be realisable (seepanel).
In our survey, around half of developersreport that high capex is a ‘significant’ or a‘major’ problem for their projects, causingdelays or bottlenecks as fundingdifficulties are overcome. Among thefinancial institutions that participated, thehigh investment cost is characterised as a‘high risk’ by nearly three-fifths ofrespondents (58%).
Construction costs account for a largeproportion of capex. The exact proportionvaries according to the exact projectcircumstances and is influenced by factorssuch as water depth, distance to the shoreand grid connection works. There issignificant variation in the constructioncosts reported by our survey respondents.One in three of the developer andcontractor/OEM respondents said thatconstruction costs accounted for more than40% of total capex in recent projects, whileover half (55%) said that they were lessthan a quarter of total capex.
3UK Department of Energy and Climate Change, ‘Cost of and financial support for offshore wind’, April 2009.
4US Department of Energy, ‘A National Offshore Wind Strategy: Creating an Offshore Wind Energy Industry in the United States’, February 2011.
Reducing the cost of offshore windpower
The US Department of Energy’s National Offshore Wind Strategy4
estimates the ‘cost of energy’ from offshore wind generation. In general terms, the ‘cost of energy’ is the sum of all up-frontannualised capital equipment costs and operating andmaintenance costs over the life of the project, divided by the totalenergy output of the project.
The strategy estimated the 2010 ‘cost of energy’ from offshorewindpower as US$270/MWh. It envisages this falling toUS$100/MWh by 2020 and US$70/MWh by 2030. These costreductions come from (1) increased system efficiency and decreasedcapital costs as larger, more integrated and innovative systems arerolled out; (2) reduced operational and replacement costs throughhigher reliability and innovative, low-maintenance designs; and (3)reduced financing costs, with the discount rate declining from acurrent estimate of 20% to a target level of 8% by reducingperceived risks to investors.

PwC offshore windpower survey 11
Over half of European contractors/OEMs(53%) reported average construction costsin the US$3-5m/MW range, although morethan a third (38%) estimated per MWconstruction costs to be less than US$3m(figure 6). We also spoke to fourcontractors/OEMs in Asia. Again there wassignificant variation, reflecting projectcircumstances. They estimate averageconstruction costs broadly in line with thosein Europe – two in the US$3-4m/MW rangebut also with one less than US$3m and oneover US$5m/MW.
Control of capital expenditure is critical foroffshore power projects. Not only is therealready a gap between their costs andmarket sustainability, making them relianton subsidy, but there is little opportunityto recover cost overruns through adjustedoperational returns given the nature of thesubsidy mechanisms. The only big outsidevariable comes from wind conditions butthese are beyond anyone’s control. Thus,capex increases can have a very damagingeffect on capital returns.
Figure 6: What are the average construction costs per MW in the most recent projects? (European developers and contractors/OEMs)
Less than US$3 million 38%
US$4-5 million 31%
US$3-4 million 22%
Don’t know 8%
As the offshore wind market develops, it is unavoidable thatimbalances will occur in the market between suppliers anddevelopers. As the market matures, new entrants will lead to arebalancing of power. In the short term, a number of playershave invested in the value chain themselves, for example bypurchasing the necessary vessels to transport equipment or bysigning long term partnership contracts with suppliers.
For larger players with the ambition and balance sheets to play amajor role in offshore windpower this is easier to achieve thanfor smaller, one-off players. The latter group will need to seekalliances with others and collaborate, rather than compete, toprovide the right counterbalance. There is also a potential rolefor governments by reducing or removing barriers to entry in thevalue chain.
Offshore windpower dialogue:Avoiding a ‘sellers’ market’ in the supply chain
Three-quarters of developers said supply chain constraintscreate the risk of a seller’s market. How can this be avoided?How can developers maintain control and the balance ofpower in their relationship with suppliers?

12 PwC offshore windpower survey
There was significant variation in projectO&M costs reported by developers. A thirdof European contractors/OEMs put thesein the US$14-28/MWh range or lower butdevelopers said they were higher, with55% putting them in the US$28-42/MWhrange. A further 27% of Europeandevelopers said they were overUS$50/MWh. But, although the reportedlevel varied, European developers said thattheir O&M costs were in line with theirbudget expectations (figure 8).
European developers and contractor/OEMs have the most offshore wind projectexperience and the majority of themreported that construction costs of recentprojects were in line with budgetexpectations. But a quarter (26%) saidconstruction costs had turned out abovebudget (figure 7). In Asia, offshore wind ismore in its infancy. We spoke with fourdevelopers and contractors/OEMs andthree of the four reported cost overruns.
Figure 7: Was there a difference between actual construction cost and the budget? (European developers and contractors/OEMs)
No, actual cost was same as the budget 57%
Yes, actual cost was higher than the budget 26%
Yes, actual cost was lower than the budget 9%
No response 8%
Figure 8: Was there a difference between actual O&M cost and the budget? (European developers)
No, actual cost was same as the budget 82%
Yes, actual cost was higher than the budget 9%
Yes, actual cost was lower than the budget 9%

PwC offshore windpower survey 13
Offshore windpower in Asia
Offshore windpower installations in the Asia-Pacific region arecurrently confined to China and Japan. China commissioned the102 MW Shanghai Donghai Bridge windfarm in 2009, taking itscumulative installed capacity to 109.5 MW. China’s National EnergyBureau says it intends to start construction on 1,200 MW ofoffshore windpower projects. Some observers expect China to haveinstalled 30,000 MW of offshore capacity by 2020.
While Chinese projects are expected to form a major part ofoffshore windpower growth in the region, developments in Japanand South Korea are also significant. Japan is the onlyother country in Asia with offshore windpower currently beingproduced. There are three offshore windpower sites with a totalof 14 turbines with a total capacity of 25.2 MW (Sakata (2 MWx5),Kamisu(2 MWx7) and Setana (0.6 MWx2)).
In May 2010, the Tokyo Electric Power Company announced plansto run a 2 MW test plant in Chiba. There were no reports of damage to existing installations after the 2011 earthquake andevents following that tragedy may spur further offshore windpowerexpansion. South Korea is focusing offshore for its windpowergrowth as it has unfavourable conditions for onshore development.It is aiming for nearly 4,000 MW of offshore windpower capacity by 2020.
Our survey included a small number of respondents from Chinaand Japan. Their responses provide a snapshot rather than a surveyand mirror many of the same concerns expressed in our Europesurvey. One financier we spoke to, for example, highlighted thehigh degree of technological operating and maintenance risk thatwill be associated with offshore windpower and, perhaps reflectingthe less mature stage of evolution compared with Europe, said thatoffshore windpower risk had increased rather than decreased inrecent years.
Again reflecting the later development of the sector, the Chineseand Asian developers we spoke with were less concerned aboutexisting supply chain bottlenecks than their Europeancounterparts. But they were inclined to recognise that suchconstraints were likely to occur in the future as expansion gatherspace. Also, three of the four developers and contractors/OEMs thatwe spoke with reported project cost overruns (see pp 11-12).
In operation Under construction Planned
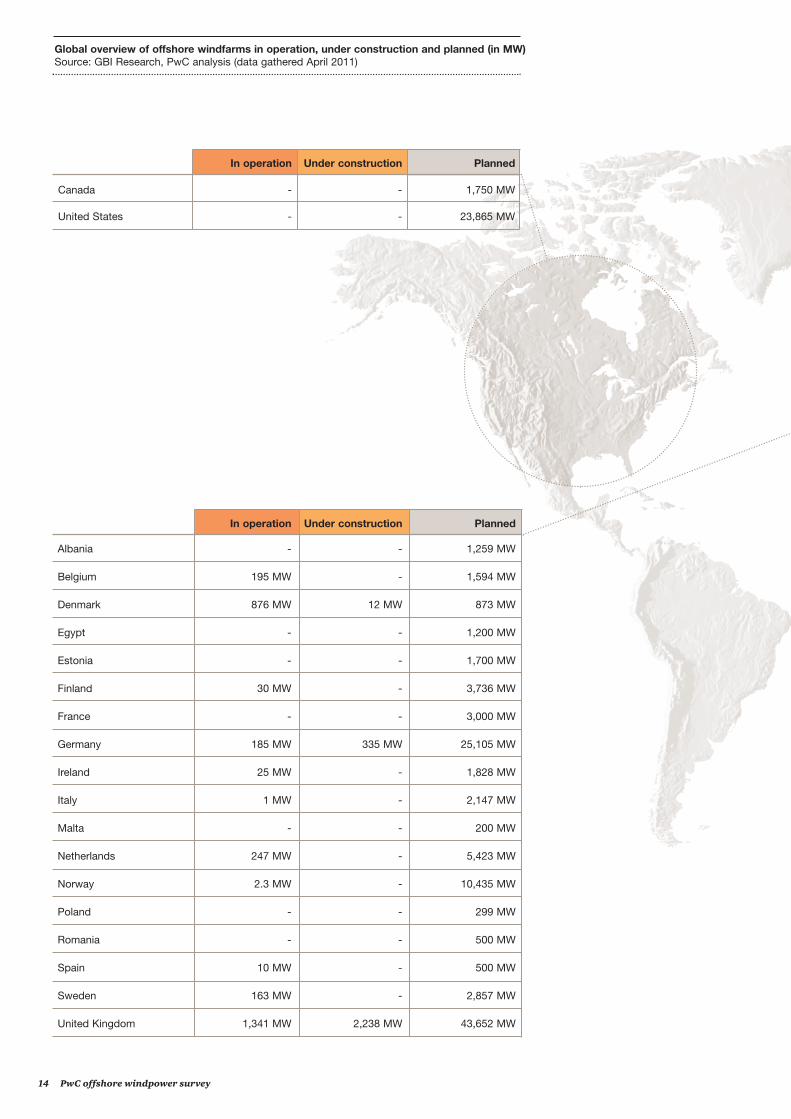
Canada - - 1,750 MW
United States - - 23,865 MW
Global overview of offshore windfarms in operation, under construction and planned (in MW)Source: GBI Research, PwC analysis (data gathered April 2011)
14 PwC offshore windpower survey
In operation Under construction Planned
Albania - - 1,259 MW
Belgium 195 MW - 1,594 MW
Denmark 876 MW 12 MW 873 MW
Egypt - - 1,200 MW
Estonia - - 1,700 MW
Finland 30 MW - 3,736 MW
France - - 3,000 MW
Germany 185 MW 335 MW 25,105 MW
Ireland 25 MW - 1,828 MW
Italy 1 MW - 2,147 MW
Malta - - 200 MW
Netherlands 247 MW - 5,423 MW
Norway 2.3 MW - 10,435 MW
Poland - - 299 MW
Romania - - 500 MW
Spain 10 MW - 500 MW
Sweden 163 MW - 2,857 MW
United Kingdom 1,341 MW 2,238 MW 43,652 MW

PwC offshore windpower survey 15
In operation Under construction Planned
China 110 MW 1,200 MW 28,691 MW
Hong Kong - - 300 MW
Japan 25 MW - -
South Korea - - 3,827 MW
Taiwan - - 600 MW

16 PwC offshore windpower survey
The big ‘make or break’ issue for the offshore wind sector is theextent to which it will be successful in getting its cost base down.Its survival and growth will depend on the long-term costoutlook. The industry is in a classic ‘chicken and egg’ situation.To get the cost base down it needs economies of scale. To geteconomies of scale it needs to make a convincing case that costscan come down. We asked our survey respondents about the bigissue of cost and a range of other ‘make or break’ issues.
Make or break issues
Four-fifths (79%) of European developersand contractors/OEMs in our surveyreported turbine sizes in the 3-5 MWrange. But plans for larger capacities of 6 MW or above are becoming morecommon. One in six of the Europeansurvey respondents reported plans forturbine sizes of 5-6 MW or above. Plans forturbine sizes in Asia were smaller – withsome below 3 MW and others of 4-5 MWcapacity – reflecting the less maturedevelopment of offshore wind in thatcontinent.
But will increases in turbine and overallproject size translate into decreases incost? Figure 9 shows the views ofcontractors and OEMs. We have reportedthe European results only, as the samplefor Asian contractors/OEMs was too smallto give meaningful results. The outlookamong European contractors/OEMs ismixed. The greatest expectation is of a real-terms cost decrease (42% ofrespondents) but many do not foresee anyreduction and, indeed, 25% forecast real-terms cost increases.
Interestingly, of those forecasting real-terms cost changes, either upward ordownward, most thought that suchchanges would be quite significant.Offered a range of 0-10% or 10-20%, four-fifths (80%) of those forecastingdecreases said that it was likely to be in the10-20% range, with the remaining fifthopting for a 0-10% decrease. Similarly, halfof those forecasting cost increases chosethe higher 10-20% range.
Cost reduction
Cost reduction is critical if offshore wind isto become economic without subsidies.How can costs be brought down and whatis the cost outlook among our surveyrespondents? Scale and smartertechnological and engineering solutionsare the main routes. Scale is beingachieved by larger turbine size as well aslarger windfarms.
Figure 9: What is your forecast for construction costs and turbine prices in the next five years? (European contractors/OEMs)
Real-terms decrease 42%
Real-terms increase 25%
Stay the same 33%
PwC offshore windpower survey 17
Another major opportunity for costreduction is in offshore turbinefoundations. The monopile design incurrent use accounts for about a quarter ofthe total investment cost of an offshorewindfarm. The trend is towards floating orgravity foundation design, adapted fromthe offshore oil and gas industry. Suchdesigns allow much of the construction totake place onshore with potential forreduced cost and they enable installationin deeper water conditions.
Looking along the cost curve
In the space of just ten years to 2008, the cost of purchasing amotor vehicle fell in real terms by 39%5. In recent years, the priceof many electronic goods has shrunk even more dramatically. For example, audio-visual equipment prices in 2004 were lessthan a quarter of their level in 19876. But can the cost of offshorewindpower halve, which is the magnitude of cost reductionneeded for it to be fully competitive in the energy mix?
It is possible to envisage design and technological innovationreducing some aspects of cost significantly. But, unlike the dramaticreductions in small component electronics, much of the cost ofoffshore windpower comes from heavy engineering, steel and otherraw materials inputs. Trends in commodity prices make it difficult toenvisage major cost savings for these elements. The jury is still outon just how far the offshore windpower cost curve can movedownward.
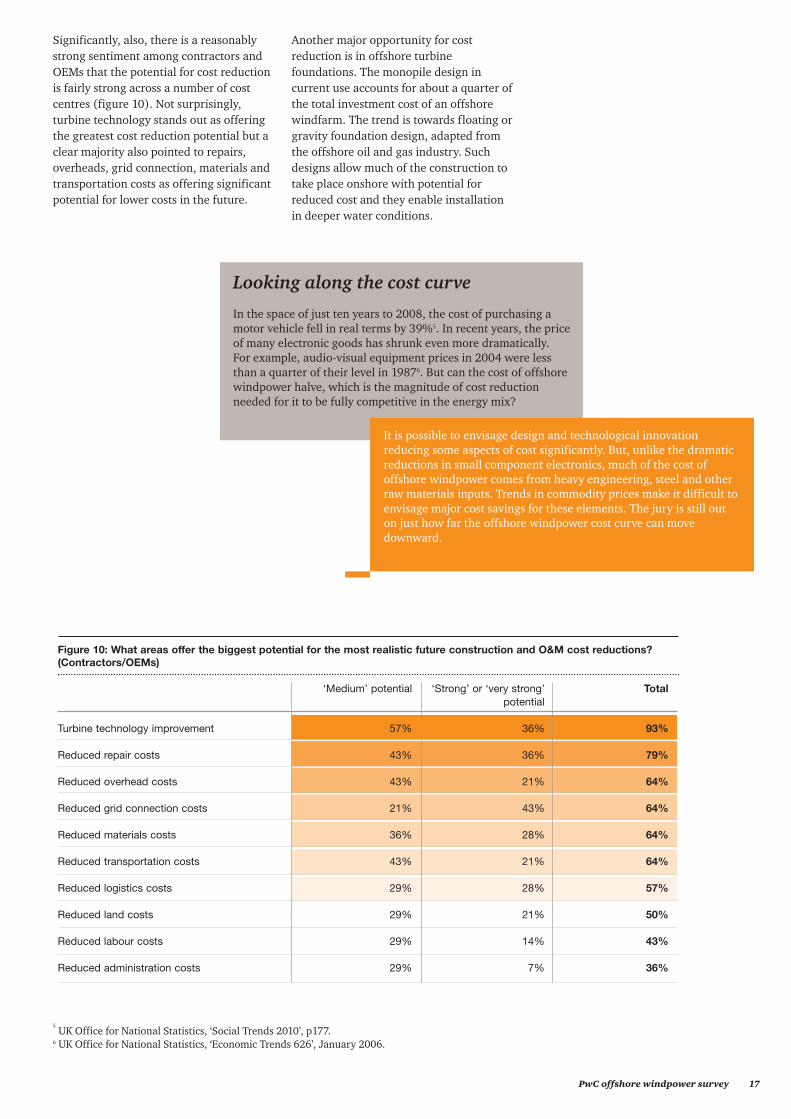
Significantly, also, there is a reasonablystrong sentiment among contractors andOEMs that the potential for cost reductionis fairly strong across a number of costcentres (figure 10). Not surprisingly,turbine technology stands out as offeringthe greatest cost reduction potential but aclear majority also pointed to repairs,overheads, grid connection, materials andtransportation costs as offering significantpotential for lower costs in the future.
Figure 10: What areas offer the biggest potential for the most realistic future construction and O&M cost reductions? (Contractors/OEMs)
‘Medium’ potential ‘Strong’ or ‘very strong’ Totalpotential
Turbine technology improvement 57% 36% 93%
Reduced repair costs 43% 36% 79%
Reduced overhead costs 43% 21% 64%
Reduced grid connection costs 21% 43% 64%
Reduced materials costs 36% 28% 64%
Reduced transportation costs 43% 21% 64%
Reduced logistics costs 29% 28% 57%
Reduced land costs 29% 21% 50%
Reduced labour costs 29% 14% 43%
Reduced administration costs 29% 7% 36%
5UK Office for National Statistics, ‘Social Trends 2010’, p177.
6 UK Office for National Statistics, ‘Economic Trends 626’, January 2006.
18 PwC offshore windpower survey
Construction risk and financing
As we discussed in the ‘promise, performance and cost’ chapter,the construction phase is critical for offshore wind projects. It isthe point at which the project economics are won or lost. Delaysor cost overruns in construction can fundamentally alter theproject economics. When a project becomes operational, theoptions for creating upside returns are restricted tooutperformance on expected operating costs.
In part, this reflects the history of projectsthat they have knowledge of – for some,the construction phase is completed butpotential O&M and technologyperformance hazards still lie ahead. It alsoreflects uncertainty arising fromgovernment reviews of subsidy regimes. Inthe UK, there is a review of ElectricityMarket Reform (EMR) and the renewablesobligation certificate (ROC) bandingreview. In the background, reviews ofother renewables subsidy regimes have cutsolar feed-in tariffs in countries such asFrance, Italy and Spain. Thesedevelopments have added to uncertaintyabout government subsidy arrangements.
Despite continuing review of theregulatory background, the risk perceptionof offshore windpower is improving in theminds of the financial institutions that wesurveyed in Europe. Only a smallpercentage (9%) thought that risks wereincreasing. Instead, nearly two-thirds(64%) said they were reducing, with therest (27%) saying that the risks had stayedthe same (figure 12).
For this reason, financial institutions andother investors look very cautiously atconstruction risk. Stand-alone financing,with banks taking the construction risk,were possible in Europe in 2006 and 2007.But the credit crisis resulted in thewithdrawal of many lenders from projectfinance and reduced appetite from others.There is now an increased involvement ofpublic funding institutions such as theEuropean Investment Bank.
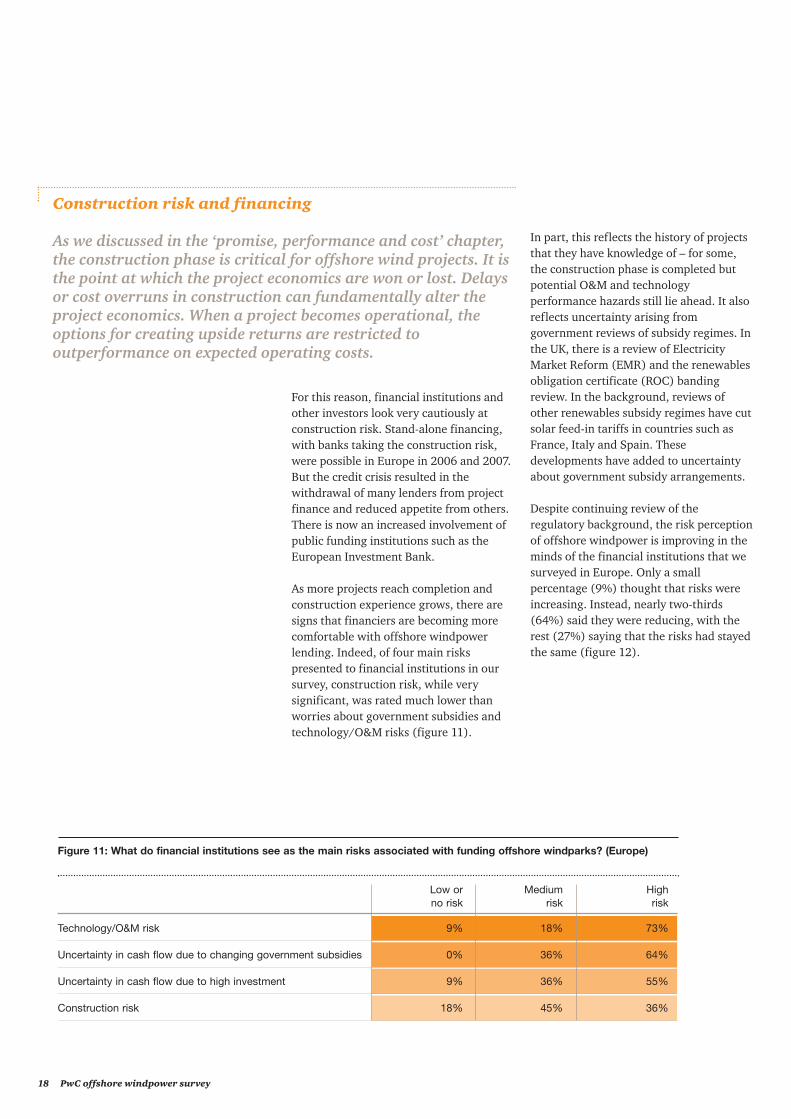
As more projects reach completion andconstruction experience grows, there aresigns that financiers are becoming morecomfortable with offshore windpowerlending. Indeed, of four main riskspresented to financial institutions in oursurvey, construction risk, while verysignificant, was rated much lower thanworries about government subsidies andtechnology/O&M risks (figure 11).
Figure 11: What do financial institutions see as the main risks associated with funding offshore windparks? (Europe)
Low or Medium Highno risk risk risk
Technology/O&M risk 9% 18% 73%
Uncertainty in cash flow due to changing government subsidies 0% 36% 64%
Uncertainty in cash flow due to high investment 9% 36% 55%
Construction risk 18% 45% 36%

PwC offshore windpower survey 19
Nearly all (91%) of the developers wesurveyed said supply chain capacityconstraints are a significant problem foroffshore wind construction to such anextent that 82% said they create the risk ofa seller’s market (figure 13). Fifty-five percent of developers saw supply chain risksas likely to increase in the future. But fewthought it would be harder for them tomanage future supply chain risks and two-thirds (64%) were satisfied with howthey had managed such risks so far.
Supply chain management
The complexity of offshore windpower projects means that themarket for turnkey contracts, where a contractor takes theconstruction risk, has been slow to develop. Instead, multi-contracting with three to four suppliers of key work packages isa more common arrangement. Or, in some cases, developersseek to manage the whole supply chain themselves rather thanbundle it into packages.
Figure 12: Do financial institutions think offshore windpower risks have got better or worse in the last two years? (Europe)
Decreasing 64%
No change 27%
Increasing 9%
Figure 13: Developers’ views on supply chain constraints and management of supply chain risk (Europe)
Agree Disagree Neither agreeor disagree
Supply chain capacity constraints are a significant problem for offshore 91% 0% 9% wind construction
Supply chain capacity constraints in offshore wind construction create 82% 9% 9%the risk of a ‘seller’s market’
My company has been able to manage risk and mitigate supply chain 64% 0% 36%constraints so far
Such risks are likely to intensify in the future 55% 9% 36%
It will become harder to manage the risk arising from future supply 9% 64% 27%chain constraints
Such arrangements inevitably heightensupply chain management demands. Inturn, these demands are more complex inan environment such as offshorewindpower where project experience isrelatively low and the learning curve isvery steep. Particularly in Europe,bottlenecks along the key parts of thesupply chain, such as vessel availability,port infrastructure and engineeringavailability, have negatively affectedprojects.

20 PwC offshore windpower survey
But, even if projects are connected to thegrid, power has to be transported to theconsumer. In Germany, the majority ofconsumers are located in the middle or inthe south of the country, and not near thecoast in the north. At present, a timetableof 10-15 years for a grid connection fromone part of the country to another is notunusual. This could prove a majorstumbling block for the expansion ofoffshore windpower.
Grid systems also have to be smarter torespond to the variability in wind output.Much will depend on progress towards thecreation of a North Sea supergrid, alongthe lines proposed by the European WindEnergy Association and a working group inthe European Commission’s energydepartment7.
While companies seem confident aboutmanaging supply chain risk, it appearshigh on the list of key things they wouldseek to change in future projects as a resultof learning on projects so far (figure 14).Correctly setting up, managing andcontrolling the supply chain is one of thekey success factors for projects. The type ofprocurement approach is an importantfactor in whether a project delivery turnsout to be successful or not.
Grid access
Grid access is one of the biggest issues facing offshore winddevelopment in Europe. There are two aspects to the issue. First,projects need to be connected to the grid. Different countriestake different approaches to this. For example, in contrast to theUK market, the grid operator in Germany is obliged to connectthe projects to the electricity grid and to bear the cost.
The importance of improved grid accesswas emphasised by our surveyrespondents. For example, all of theEuropean government respondents saidthat improved grid access was necessary,with 80% saying it would make a ‘strong’or ‘very strong’ impact on offshorewindpower development. Investment intransmission infrastructure was seen asbeing most important with, again, 80%saying it would make a ‘strong’ or ‘verystrong’ impact.
Such views are reflected in the responsesof power utility companies themselves.They emphasised the importance of bettergovernment policy on grid access. Nearlyall (90%) of the European utility companyrespondents we interviewed said thatgovernment policies on offshorewindpower offtake and laying grid linesneeded improvement, with 30% sayingthey needed a lot of improvement.
Figure 14: With the experience obtained from previous projects, what would be the main changes in new projects? (European developers and contractors/OEMs)
‘Significant’ or ‘No change’ or ‘major’ change ‘minor’ change
Type of regulatory support 66% 34%
Location selection 66% 34%
Supply chain management 65% 35%
Type of turbine 61% 39%
Environment analysis 48% 52%
Raw materials procurement 35% 65%
In the best case it protects project valuebut, in the worst case, it can destroy value.Once the procurement stage is passed,owners start losing flexibility on how tocreate and retain value. They have lockedin the delivery of the business case and arein the hands of the supply chain.
7Georg Wilhelm Adamowitsch, European Coordinator’s Third Annual Report, ‘Projects of European Interest, Connection to offshore windpower in Northern Europe (North Sea – Baltic Sea)’, Dec 2009-Oct 2010.

PwC offshore windpower survey 21
European power utility companyrespondents also stressed the importanceof stronger directives and financial supportfor new grid lines (figure 15). Theimportance of a supergrid comes as muchfrom recognition of its importance inmaking more efficient use of a diverserange of generation sources, throughbetter pooling and management ofspinning reserves, as from its importancefor optimal integration of windpower(figure 16).
Figure 16: What do power utility companies believe are the most important reasons for a European supergrid and how much improvement is needed?
Needs ‘a lot of Needs ‘some It is alreadyimprovement’ improvement’ satisfactory or good
To pool load variability and power station unreliability 50% 20% 30%
To reduce the margin of inefficient spinning reserve and 20% 70% 10%standby that have to be supplied
To lower the cost of power in all participating countries by 0% 70% 30%allowing the entire region to share the most efficient power plants
To allow for much wider use of renewable energy, particularly 0% 60% 40%windpower
Figure 15: In the minds of European power utility companies, what areas need the greatest improvement if governments are to improve offshore wind grid access?
Needs Needs ‘a lot of improvement’ ‘some improvement’
Mandating utilities to lay grid lines 40% 50%
Financial support for laying grid lines 30% 50%
Transmission infrastructure investment 30% 40%
Implementation of smart grid technology 10% 70%
Encouragement of public private partnerships 10% 30%
Investment in advanced technologies to reduce transmission losses 0% 70%

22 PwC offshore windpower survey
As we discussed under ‘construction riskand financing’ earlier in this chapter,financial institutions perceive theconstruction stage of offshore windprojects to be inherently risky. They arealso concerned about technology risk, withthe ongoing performance of turbinetechnology yet to be fully proven inoffshore environments. In the renewablesfield, offshore wind generation has tocompete for capital with othertechnologies such as onshore windpowerand solar technology. In terms of cleanerenergy, offshore wind is in competitionwith nuclear power for investment andalso with expansion of gas as areplacement for coal-fired generation.
Investment attractiveness
Considerable investment needs to be attracted into the offshorewind sector if expansion plans are to be realised. The IEA‘current policies’ scenario estimates a minimum of US$260bnoffshore windpower investment is needed worldwide between2010 and 2035, rising to US$400bn or as much as US$640bn ifthe policy stance of governments shifts further towardsrenewables8. In Europe, data from NLD Taskforce Offshore WindEnergy indicates that an additional 40 GW of offshore windenergy will require finance of €150bn in the period to 2020 witha financing gap of €95bn9.
We asked the European financialinstitutions in our survey for theirperceptions of the relative attractiveness ofoffshore windpower investment comparedwith some of these other energy sectors(figure 17). The survey was conductedbefore the nuclear emergency thatunfolded after the earthquake in Japan. The striking result was how far theinvestment potential of nuclear wasfavoured over offshore windpower in theminds of the survey respondents.
Clearly, in the policy context that prevailedbefore the events at the strickenFukushima plant, nuclear was seen as amature, proven technology offering marketexpansion potential compared to therelatively unproven offshore windgeneration technology. But in a follow-upquestion asked six weeks after theearthquake, three-quarters of the samerespondents said their investmentsentiment had shifted negatively againstnuclear.
Turning to other generation sources, hydrois also mature and proven but is not seenas attractive because of its limitedexpansion potential. Onshore wind isfavoured over offshore generation andbiomass/biogas is viewed in particularlyfavourable terms. In contrast, solar poweris viewed less favourably, perhapsreflecting its immaturity as a source ofutility-scale generation and concern aboutrecent regulatory changes.
8International Energy Agency, ‘World Energy Outlook 2010’.
9Ecofys, Fraunhofer ISI, TU Vienna EEG and Ernst & Young, ‘Financing Renewable Energy in the European Energy Market’, January 2011.
A nuclear wind of change
Even before the Japan nuclear emergency, a trend of nuclearcompanies extending their low carbon offering throughpurchases of windpower and other renewables companies wasalready evident. US and French nuclear power generators andengineering firms have bought into the wind and solar sectors.
Many of these moves by nuclear companies are driven bydiversification. The reaction to the Japanese nuclear situation hasbeen to take stock. Whatever the exact outcome, the Fukushimaemergency is likely to shift the energy policy balance towardsrenewables. While it won’t raise a red flag to investment in nuclear,it could spur further moves by nuclear companies into renewables.

PwC offshore windpower survey 23
Figure 17: How do European financial institutions rate the investment potential of offshore windpower relative to other energy sectors?
Offshore is less or Offshore is neither Offshore is more or much less attractive more nor less attractive much more attractive
Thermal 27% 45% 27%
Hydro 27% 27% 45%
Nuclear 55% 36% 9%
Onshore wind 36% 45% 18%
Solar power 27% 18% 55%
Solar thermal 27% 36% 36%
Geothermal 27% 27% 45%
Biomass and biogas 55% 36% 9%
Finding the right location for offshore windpower is subject to manycriteria. The investment required to find the right location and toundertake all the necessary research (environmental analysis, windmeasurement, foundation surveys etc.) is substantial and is a lostcost if no project funding is found.
Substantial economies of scale can be achieved if some of the ‘pre-work’ is done collectively or by governments. For example, pre-assigning suitable plots, and doing the environmental analysisand other analysis that is common for all players, will save costs,reduce risks and increase the speed with which offshore windparkscan be developed.
Offshore windpower dialogue:Location selection
Developers report that location selection is a difficult challengeand something that they would change for future projects. Whatare the main problems that companies are encountering andwhat steps can they take to tackle them?

24 PwC offshore windpower survey
Governments will be keen to avoid aninvestment hiatus as they review subsidyframeworks but, nonetheless, this may beinevitable. Given the central part that aregulated return plays, regulatorycertainty is very important for investors insuch projects. The need for greatercertainty and agreement between theindustry and governments is illustrated bythe results reported in figure 18.
Regulatory certainty
A number of governments are weighing up the best way tobalance the triple objectives of affordability, security of supplyand cleaner energy in a context of tighter public finances. Withreviews in countries such as the UK and Germany, there is likelyto be a further pause for breath among investors as they wait forclarity on the exact subsidy environment.
Ninety per cent of the European utilitycompany survey respondents saiddiscussions between the industry andgovernment about financing and subsidymechanisms still needed improvement. No government respondents were of thesame point of view. Instead, they all ratedliaison on financing and subsidymechanisms as good or satisfactory. Therewas also a gap in perceptions on the needfor improvements to the licensing andpermitting process. In contrast, utilities areless worried than governments about theneed for better liaison on tariff regulatoryframeworks, perhaps mindful that theimmediate challenge lies in scaling up theoffshore side of the development pipeline.
Part of the challenge for governments is todevise an optimal framework to secure amatch between the risk-averserequirements of pension funds and otherlarge institutional investors that haveaccess to the large pools of capital requiredto fund capital expenditure on offshorewindpower expansion. We askedrespondents what government measureswould most help to stimulate theavailability of funding for offshorewindpower (figure 19). The responsesindicate a clear preference for directmeasures – such as increased returns,government involvement in underwritingproject risk, funding grid investment andtaking direct equity stakes – over indirectmeasures such as the creation of green tax-free investment wrappers for privateinvestors.
Governments hold the key
Regulatory support and certainty are central to investment in andexpansion of offshore windpower. Reviews by some governmentshave added an element of uncertainty but, in general, thedirection of government support is clear. The nuclear emergencyin Japan has added a new factor into the equation, the fullimpact of which is yet to be seen.
The importance of regulatory certainty is highlighted by thefinancial institutions we spoke with in the survey. Over half (55%)said that they regarded uncertainty in cash flow due to changinggovernment subsidies as a very high risk, with the remainderviewing it as a medium risk. None were comfortable enough toregard government support as a low risk.

PwC offshore windpower survey 25
Figure 18: Interaction between the offshore windpower sector and government – what needs improving? (Europe)
Needs ‘some’ or ‘a lot’ of improvement Utility company Governmentrespondents respondents
Financing and subsidy mechanisms 90% 0%
Licensing/permit processes 70% 50%
Grid and other infrastructure developments 40% 50%
Tariff regulatory frameworks 20% 33%
Figure 19: What innovations and developments would improve the availability of funding for offshore windpower projects? (European developers, contractors/OEMs and governments)
‘Strong’ or ‘very strong’ impact
Increased returns to developers through improved support mechanisms such as 65%tax rebates (capital subsidies), duty waivers, soft loan programmes
Government underwriting project risk (through consumer levies, providing loan guarantees, 59% regulated asset structures, financing facilities)
Government bearing cost of laying grid lines 57%
Government taking equity stakes 52%
Development of insurance products to underwrite construction risks 42%
Access to new sources of institutional capital, e.g., pension and insurance funds 42%
Tax-sheltered green investment schemes for private investors 28%
Grid access is proving a bottleneck in all countries trying to realiseoffshore wind capacity. Connecting windparks is expensive. Withambitious plans, a key question is whether each park should beconnected individually or whether planning ahead for aseries of parks makes more sense. There are also questions aroundwho should be responsible for the connection – the developer, thenational transmission system operator (TSO) or other players?
A modular approach where each park is connected on a stand-alone basis makes sense only if other windpark plans are notyet definite. But if they are, planning the grid connectioncollectively could allow valuable economies of scale and scope tobe achieved that will benefit all offshore windparks and,ultimately, the taxpayer.
Offshore windpower dialogue:Improved grid access
Improved grid access is seen as critical to offshore windpowerexpansion. But what is the best way of improving access?

26 PwC offshore wind survey
Contacts
Global contacts
Manfred WiegandGlobal Utilities LeaderTelephone: +49 201 438 1517Email: [email protected]
Paul NillesenEuropean Renewable Energy LeaderTelephone: +31 88 792 7237Email: [email protected]
Olesya HatopGlobal Energy, Utilities & Mining MarketingTelephone: +49 201 438 1431Email: [email protected]
Territory contacts
AfricaStanley SubramoneyTelephone: +27 11 797 4380Email: [email protected]
ArgentinaJorge BacherTelephone: +54 11 5811 6952Email: [email protected]
AustralasiaPeter MunnsTelephone: +61 3 8603 4464Email: [email protected]
AustriaGerhard PrachnerTelephone: +43 1 501 88 1800Email: [email protected]
BrazilGuilherme ValleTelephone: +55 21 3232 6011Email: [email protected]
CanadaAlistair BrydenTelephone: +1 403 509 7354Email: [email protected]
ChinaGavin ChuiTelephone: +86 10 6533 2188Email: [email protected]
DenmarkPer TimmermannTelephone: +45 3945 3945Email: [email protected]

PwC offshore wind survey 27
FinlandMauri HätönenTelephone: +358 9 2280 1946Email: [email protected]
FrancePhilippe GiraultTelephone: +33 1 5657 8897Email: [email protected]
Alexis Chauffert-YvartTelephone: +33 1 5657 8045 Email: [email protected]
GermanyHeiko StohlmeyerTelephone: +49 40 6378 1532Email: [email protected]
Janosch OndraczekTelephone: +49 40 6378 1506Email: [email protected]
GreeceSocrates Leptos-BourgiTelephone: +30 210 687 4693Email: [email protected]
IndiaKameswara RaoTelephone: +91 40 6624 6688Email: [email protected]
IrelandAnn O’ConnellTelephone: +353 1 792 8512Email: [email protected]
ItalyGiovanni PoggioTelephone: +39 06 570 252588Email: [email protected]
Angela Margherita BellomoTelephone: +39 06 570 252581Email: [email protected]
JapanKoji HaraTelephone: +81 90 1618 5601Email: [email protected]
Middle EastPaul NavratilTelephone: +973 17540554Email: [email protected]
NetherlandsEsther van der VleutenTelephone: +31 88 792 3655Email: [email protected]
Jeroen van HoofTelephone: +31 88 792 1328Email: [email protected]
New ZealandCraig RiceTelephone: +64 9 355 8641Email: [email protected]
NorwayStåle JohansenTelephone: +47 9526 0476Email: [email protected]
PolandOlga GrygierTelephone: +48 22 523 4214Email: [email protected]
Piotr LubaTelephone: +48 22 523 4679Email: [email protected]
PortugalLuis FerreiraTelephone: +351 213 599 296Email: [email protected]
Russia & Central and Eastern EuropeMichael O’RiordanTelephone: +7 495 232 5774Email: [email protected]
SingaporePaul CorneliusTelephone: +65 6236 3718Email: [email protected]
SpainIñaki GoirienaTelephone: +34 915 684 469Email: [email protected]
Carlos Fernández LandaTelephone: +34 915 684 839Email: [email protected]
SwedenMartin GaveliusTelephone: +46 8 555 33529Email: [email protected]
SwitzerlandMarc SchmidliTelephone: +41 58 792 1564Email: [email protected]
United KingdomSteve JenningsTelephone: +44 20 7212 1449Email: [email protected]
Ronan O’ReganTelephone: +44 20 7804 4259Email: [email protected]
United StatesDavid EtheridgeTelephone: +1 415 498 7168Email: [email protected]
UruguayPatricia MarquesTelephone: +598 2916 0463Email: [email protected]

This publication has been prepared for general guidance on matters of interest only, and does not constitute professional advice. You should notact upon the information contained in this publication without obtaining specific professional advice. No representation or warranty (express orimplied) is given as to the accuracy or completeness of the information contained in this publication, and, to the extent permitted by law, PwCdoes not accept or assume any liability, responsibility or duty of care for any consequences of you or anyone else acting, or refraining to act, inreliance on the information contained in this publication or for any decision based on it.
© 2011 PwC. All rights reserved. Not for further distribution without the permission of PwC. “PwC” refers to the network of member firms ofPricewaterhouseCoopers International Limited (PwCIL), or, as the context requires, individual member firms of the PwC network. Each memberfirm is a separate legal entity and does not act as an agent of PwCIL or any other member firm. PwCIL does not provide any services to clients.PwCIL is not responsible or liable for the acts or omissions of any of its member firms nor can it control the exercise of their professionaljudgment or bind them in any way. No member firm is responsible or liable for the acts or omissions of any other member firm nor can it controlthe exercise of another member firm’s professional judgment or bind another member firm or PwCIL in any way.
PwC firms provide industry-focused assurance, tax andadvisory services to enhance value for their clients. Morethan 161,000 people in 154 countries in firms across the PwCnetwork share their thinking, experience and solutions todevelop fresh perspectives and practical advice.
The Global Energy, Utilities and Mining group(www.pwc.com/energy) is the professional services leader inthe international energy, utilities and mining community,advising clients through a global network of fully dedicatedspecialists.
For further information, please visit:www.pwc.com/offshorewind