offshore injury, ill health and incident statistics … · this is the eleventh report in a series...
TRANSCRIPT
OFFSHORE INJURY, ILL HEALTH
AND INCIDENT STATISTICS 2011/2012
HID STATISTICS REPORT HSR 2012 - 1
Date of Issue: December 2012 Health and Safety Executive

OFFSHORE INJURY AND INCIDENT STATISTICS 2011/2012
Health & Safety Executive Hazardous Installations Directorate
Offshore Division (OSD)
i

Preface This is the eleventh report in a series of HID Statistics reports covering offshore injury and incident statistics, which continues from the previous OTO series. It is the sixteenth under the Reporting of Injuries, Diseases and Dangerous Occurrences Regulations 1995 (RIDDOR), and presents data on injuries, diseases and incidents reported for the period 1 April 2008 to 31 March 2012. Copies of this report can be downloaded from HSE’s website at
http://www.hse.gov.uk/offshore
Copies of this report can also be obtained from:
Health and Safety Executive Hazardous Installations Directorate (OSD3.1)
5N.2 Redgrave Court Merton Road
Bootle Merseyside L20 7HS
Tel: 0151 951 3157 Fax: 0151 951 3260
e-mail: [email protected]
ii

iii
CONTENTS
SECTION PAGE
Summary 1
Introduction 2
Commentary 3 - 6
Further analysis of major injuries 7 - 10
Hydrocarbon Releases 11 - 12
Other Key Performance Indicators 12
Annex 1 Data for 2011/12 13 - 43
Contents 13 - 14
Tables 15 - 24
Figures 25 - 43
Annex 2 Oil and Gas UK - Key Industry Performance Indicators 44 - 46
1. KPI-2 Verification Non-Compliance 44 - 45
2. KPI-3 Safety Critical Maintenance Backlog 45 - 46

SUMMARY This report contains details of offshore accidents, dangerous occurrences and ill health reported to HSE from 1 April 2011 to 31 March 2012, with summarised data back to 1995/96 for comparison. The main points are: 2 fatalities arising from offshore work activities regulated by HSE were
reported in 2011/12, the first fatalities on offshore installations since 2006/07.
36 major injuries were reported, compared to 42 in 2010/11 and 50 in 2009/10.
The major injury rate per 100,000 workers fell from last year’s figure of 152 to 123.9 the second lowest rate in the reporting period. The combined fatal and major injury rate also fell to the second lowest recorded.
95 ‘over-3-day’ injuries were reported, a reduction of 11 compared to the previous year. The over-3-day injury rate decreased from 383.2 per 100,000 workers to 326.9 – a decrease of 14.7% compared to 2010/11. This is 75% lower than the peak of 1293 in 1995/96.
409 dangerous occurrences were reported, compared to 430 in 2010/11, a decrease of 21. This is 46.5% less than the peak of 764 in 2000/01.
The estimated offshore workforce was 29,058 compared to 27,660 in 2010/11 - an increase of 5%.
The ‘Maintenance/construction’ work process environment continued to produce the highest number of ‘all injuries’ this year, followed by ‘Deck operations’. ‘Maintenance/construction and ‘Production’ activities produced the most ‘major’ injuries in 2011/12.
‘Struck by moving objects’ and ‘Slips, trips and falls’ produced the most injuries in a single category followed by ‘Injuries from handling, lifting or carrying’ and ‘Falls from height’. These four categories account for 80% of all injuries. Injuries from slips, trips and falls, including falls from height, account for 47.2% of all major injuries. Approximately 92% of major injuries were to limbs.
The ratio of over-3-day to major injuries increased by 3.5% in 2011/12 to 2.64. This reflects the reduction in the proportion of major injuries among the total of all reportable injuries compared to the previous year and continues the overall downward trend in reportable injuries over the last five years.
This year the three-year rolling average of injury rate for combined fatal and major injuries rose slightly compared to last year though overall there remains a continuation of the overall downward trend over the last ten years. The three-year rolling average rate for over-3-day injuries continued to decline.
.
1

INTRODUCTION
1.1 This report covers the period from April 2011 to March 2012, with summary data from 1995/96 included for comparison. It is based on incidents reported under the Reporting of Injuries, Diseases and Dangerous Occurrences Regulations 1995 (RIDDOR)1. For offshore operations, this covers incidents directly affecting offshore installations or workers or visitors on offshore installations2. It also includes certain diving operations in connection with operations on an offshore installation3. 1.2 Commentary is provided on the statistics as a whole as well as more detailed analysis of major injuries. Annex 1 contains tables and graphs of the 2011/12 statistics. 1.3 An additional commentary is provided at Annex 2 relating to monitoring activities undertaken by the UK offshore oil and gas industry’s representative body Oil & Gas UK (OGUK) in respect of Key Performance Indicators. 1.4 Provisional headline data on fatalities, injuries, and other reportable incidents was published on the HSE website in the Offshore Safety Statistics Bulletin 2011/2012 (http://www.hse.gov.uk/offshore/statistics.htm) in August 2012. This data was based on analysis of data conducted at quarterly intervals throughout the operating year. Data in the bulletin is regarded as provisional due to the potential for late submission or amendment of reported incident data. The data contained in this full annual report for 2011/2012 has undergone a detailed review for the whole operating year and contains a few minor amendments to the headline statistics contained in the bulletin. 1.5 OSD commissioned a review of the pre-1996/97 data to reclassify injuries from that period in line with the RIDDOR requirements. All data in this report now conforms to the RIDDOR classification. Care should be taken in making comparisons, particularly where small numbers of incidents are involved, to avoid reading too much significance into variations.
1 Reportable injuries and dangerous occurrences are defined in regulation 3 of RIDDOR. Further description of ‘Major Injuries’ is provided in RIDDOR under Schedule 1. Reference to over-3-day injuries in this annual report includes all other RIDDOR reportable injuries that are less severe than Major Injuries. Description of reportable Dangerous Occurrences is provided in Schedule 2. 2 The report does not include incidents arising from marine activities that are not directly connected with offshore operations (e.g. vessels or rigs in transit) or air transport activities (including transport to, from or between installations), except incidents affecting helicopters whilst located on an installation which are included if they occur. The report does include offshore wells and most activities in connection with them, as well as offshore pipelines, pipeline works and certain activities in connection with pipeline works. Incidents on offshore wind farms are included. 3 Whilst HSE Offshore Division retains responsibility for all aspects of offshore diving and inshore commercial diving, statistics stated in this report are for offshore diving and diving support activities associated with an offshore installation only.
2
COMMENTARY Population 2.1 Injury rates are calculated using offshore population data from the industry’s Vantage personnel tracking system. Up to and including 2003/04, data from the Inland Revenue was used. For 2011/12, the estimated offshore population (based on total number of hours worked divided by 2000 hours per worker year) was 29,058, a 5% increase compared to the previous year’s figure of 27,660. Fatal injuries 2.2 Two fatalities occurred in 2011/12. The first occurred in Q1, due to a fall from height during a work shift. The second, a fatality during a diving operation which was reported as a recordable fatality in Q3, should be considered as still provisional with investigations continuing. Major injuries 2.3 The number of major injuries (36) decreased by six over the previous year. The major injury rate per 100,000 workers fell 18.5% to 123.9. The combined number of fatal and major injuries also fell by four to 38 resulting in a reduction in the combined fatal and major injury rate per 100,000 workers to 130.8. Over-3-day injuries 2.4 The number of over-3-day injuries (95) decreased 10.4% compared to 2010/11. The over-3-day injury rate also decreased by 14.7% to 326.9. This is a new low figure reflecting the continuing reduction in the number of injuries in a consistently high offshore working population. Ratio of over-3-day to major injuries 2.5 Table 4 and Figure 5 show the ratio of over-3-day to major injuries for the last fifteen years. The significant rise in the ratio in 2008/09 was followed by a drop in 2009/10 but has shown a return to improvement in 2011/12. Overall there has been a decline in the total number of reportable injuries in 2011/12, however it should be noted that conclusions derived from the ratio should be tempered by the extent to which over 3-day injuries might have had the potential to lead to major injuries if less fortunate circumstances had occurred and vice versa. Three-year rolling averages 2.6 Three-year rolling averages smooth out variations and give a clearer picture of overall trends - see Tables 3 and 3a and Figures 4 and 4a. The three-year rolling average for the combined number of fatal and major injuries showed a small increase (6.4%) in 2011/12 reflecting the sharp rise in major injuries in 2009/10 included in this 3 year period. The average for the fatal and major injury rate, which takes account of the working population, has also risen 5.3% over the last 12 months. The rolling average for over-3-day injuries has fallen by 12.6% which is similar to the reduction in the over-3-day injury rate rolling average which has shown a 13.3% fall to a new low of 373.4 per 100,000 workers. This reflects the consistent fall in over-3-day injuries over the last five years.
3

Details of injuries Nature of injury 2.7 Table 5 categorises injuries by severity and nature of injury, and Figures 6 and 6a illustrate their distribution. The most frequent types of all injuries were fractures (29.3% - 39 injuries), sprains and strains (27% – 36 injuries), lacerations (15% - 20 injuries) and contusions (10.5% - 14 injuries). For major injuries, fracture was the most commonly occurring type, with 23 incidents which represents 64% of all major injuries (36). For over-3-day injuries, sprains and strains were the most common type of injury, with 35 incidents (36.8% of over-3-day injuries). Other frequent types of over-3-day injuries included lacerations (17 incidents – 17.9%), fractures (16 incidents – 16.8%) and contusions (14 incidents – 14.7%). Part of body injured 2.8 Table 6 and Figures 7 and 7a provide information on the site of injury. The upper limb4 accounted for 44.4% (59) of all injuries for 2011/12 and the lower limb accounted for 34.6% (46). The torso accounted for 14.3% (19) of all injuries. The number of head injuries (6) accounted for 4.5% of the total. Injuries to the limbs accounted for 33 (91.7%) of all major injuries. For over-3-day injuries, injuries to the limbs accounted for 72 injuries (75.8% of over-3-day injuries). There were 43 incidents (45.3% of over-3-day injuries or 59.7% of over-3-day limb injuries) affecting the upper limbs and 29 (30.5% of all over-3-day injuries) to the lower limbs. Of all upper limb injuries, 31 (52.5%) were attributed to injury to one or more fingers or thumbs (of which 90% were over-3-day injuries). Injuries to the torso accounted for 17.9% of all over-3-day incidents, with 17 incidents reported. Kind of accident 2.9 Table 7 and Figures 8 and 8a record the breakdown of the kind of accident against severity of injury. 28 (21%) of all injuries were associated with handling, lifting or carrying activities, 31 (23.3%) from being struck by moving, flying or falling objects, of which 7 resulted in major injury. 31 incidents (23.3% of all injuries) were as a result of slips, trips or falls at the same level and a further 17 (14.1%) involved a fall from height, resulting in a total 48 (36.1%) of all injuries being associated with slips, trips and falls of all types. Age of injured person 2.10 Table 8 and Figures 9 and 9a show the age of the injured persons. The majority of injuries (60.9%) were spread between ages ranging from 25 to 49 years of age, with the 30-34 year band recording the highest number of injuries with 21 (15.8%) incidents. The 30-34 year age band also recorded the highest number of major injuries (7 incidents, 19.4% major injuries) closely followed by 40-44 year band with 6 incidents (16.7% major injuries).
4 Upper limb includes the fingers and the thumb, hand and wrist.
4

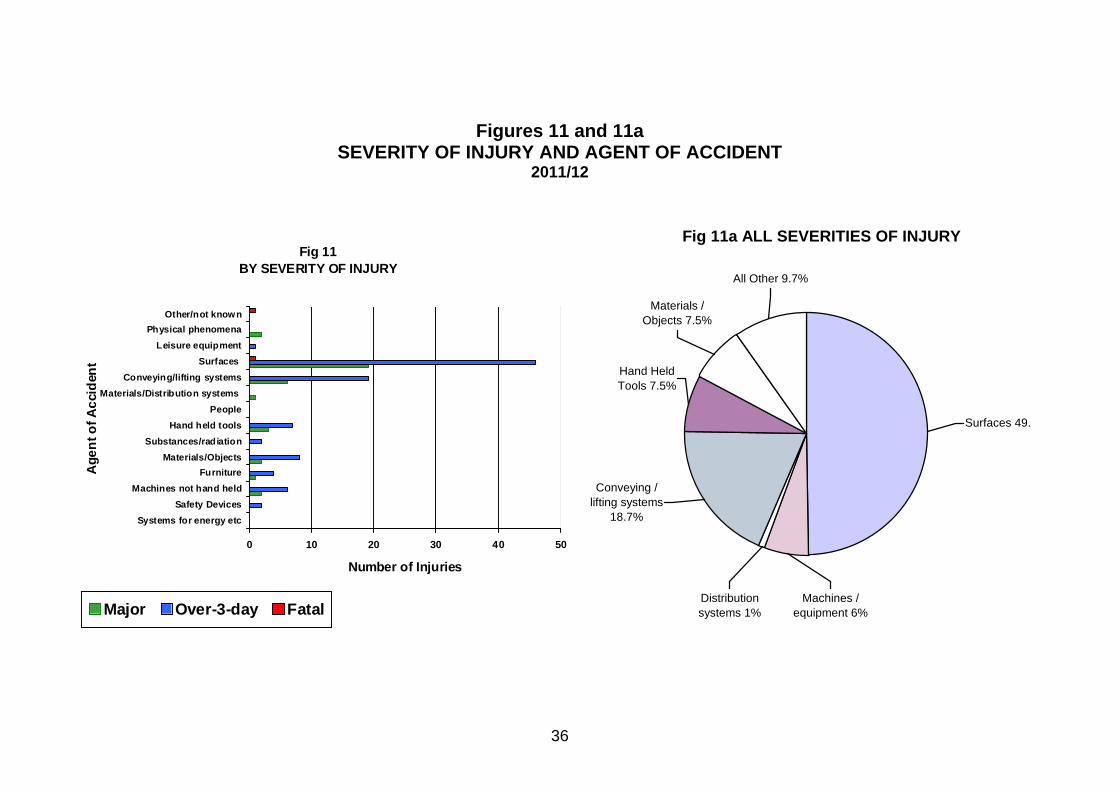
Work Process Environment 2.11 Table 9 and Figures 10 and 10a describe the type of activity being carried out when the incident occurred. Work Process Environment categories were introduced for offshore incidents from April 2001. Prior to that, categories under ‘operation’ were used. Any direct comparisons of these categories should therefore be used with care. Most injuries occurred in the ‘maintenance and construction’ environment (50 incidents, or 37.6% of all injuries). Along with the production activity, maintenance and construction had the most major injuries (11 incidents each, or 30.5% of all major injuries - a small reduction compared to last year (16), followed by deck operations and drilling which produced 7 (19.4%) and 5 (13.9%) major injuries respectively. Agent of Accident 2.12 Table 10 and Figures 11 & 11a give information on the agent of accident against severity of injury. 49.6% of all injuries (66 incidents) involved ‘surfaces, structures and building access equipment’. 25 incidents (18.8% of the total) involved ‘conveying, lifting storage systems and hand-held pushed/pulled transport equipment’. The majority of major injuries involved two categories, ‘surfaces, structures and building access equipment’ (52.8%) and ‘conveying, lifting storage systems and hand-held pushed / pulled transport equipment’ (16.7%). Hand held tools and equipment accounted for 8.3% of major injuries. Reportable Diseases 2.13 Table 11 indicates there were 14 cases of disease or ill health reported in 2011/12, compared with 7 in 2010/11. There were 6 cases of chickenpox , 4 cases of decompression illness, 3 cases of hand-arm vibration and 1 case of scarlet fever. Dangerous Occurrences 2.14 The total of 409 reported dangerous occurrences (DO) for 2011/12 represents a modest 4.9% decrease compared to the figure for 2010/11 (430 incidents). The more frequently occurring types of dangerous occurrences reported in 2011/12 were:
DO type 01 (failure of lifting machinery, etc.) with 17 events accounted for 4% of incidents
DO type 13 (well related activities) accounted for 23 events - 5.6% DO type 14 (pipeline related incidents) accounted for 32 events - 7.8% DO type 73 (release of hydrocarbon) accounted for 31.1% of all
incidents (132). DO type 74 (Fire or explosion not linked to a loss of petroleum
hydrocarbon) decreased to 29, representing 6.8% of the total. DO type 77 (station-keeping, dropped objects and weather) accounting
for 30.9% (131). Figure 12 provides a summary of hydrocarbon release dangerous occurrences by severity with Figures 12(a) and 12(b) showing the number of well related and pipeline incidents respectively.
5
2.15 Figures 13,14,15 and 16 provide a summary of dangerous occurrences for types DO 01 (Failure of lifting machinery), DO 78/79 (Collision/Possible collision offshore), DO 80/81 (Subsidence or collapse of seabed/Loss of stability or buoyancy) and DO 82 (Evacuation of an installation) over a ten year period. Fig 13 shows incidents involving the failure of lifting machinery to be in
a steady decline since 2001/02. The 2011/12 figure (17) is the lowest recorded over the decade and is a 37% reduction compared to 2010/11 (27). Overall type DO 01 accounted for 4% of all dangerous occurrences in 2011/12.
Fig 14 shows the split between collision and possible collision incidents
offshore. Collisions account for the majority of these incidents since 2001/02 at 68 compared to only 19 for possible collisions over the same period. The highest level reported was in 2007/08 (12) with a gradual reduction since, falling to one of the lowest levels in 2011/12 (5).
DO type 80 (Subsidence or collapse of seabed) and DO type 81 (Loss
of stability or buoyancy) are illustrated in Fig 15. The total of both types reported since 2001/02 is 8 with 7 of these occurring 2008/09 onwards and this after several years without incident.
Fig 16 shows the number of installation evacuations (DO type 82)
reported since 2001/02, a total of 30 to 2011/12. Early years show relatively low figures with modest reductions in incidents to 2006/07. Of the 10 year total (30), 21 occurred from 2007/08 an average of approx 1% of the total of dangerous occurrences each year.
6

FURTHER ANALYSIS OF MAJOR INJURIES 3.1 This section compares the numbers of reported major injuries for the last four years and examines the links between the main data categories and other aspects. Major Injuries by Work Process Environment 3.2 The chart below shows the numbers of reported major injuries over the last four years (158), sorted by the main work process environments. ‘Maintenance/Construction’ injuries (51) and ‘Deck Operations’ (including air and sea transport) injuries (35) have dominated the last 4 years with 54.4% of all major injuries, followed by ‘Production’ (33) and ‘Drilling’ (23) activities which account for a further 35.4%.
0
2
4
6
8
10
12
14
16
18
2008/09 2009/10 2010/11 2011/12
No
.of
Inci
den
ts
DIVING
DECK OPERATIONS
DRILLING
MAINTENANCE/CONSTRUCTION
MANAGEMENT
PRODUCTION
Major Injuries in Offshore Maintenance & Construction 3.3 The chart below shows the relationship between ‘offshore maintenance/ construction’ and a subset of common kinds of accident. The total number of major injuries in maintenance and construction activities (11) for 2011/12 fell by five compared to the previous year (16). The dominant kind of incident was handling, lifting or carrying (4) followed by struck by moving, flying or falling objects (3) with one incident for each of the following, falls from height, slips, trips and falls, contact with machinery and struck against. Five injuries resulted in fractures and six incidents involved injury to ankles, finger, hand, trunk and upper limb.
7

0
1
2
3
4
5
6
7
2008/09 2009/10 2010/11 2011/12
No
. o
f in
cid
ents
STRUCK BY
STRUCK AGAINST
SLIP, TRIP
HANDLING
FALLS FROM HEIGHT
EXPOSED TO DANGEROUSSUBSTANCEFIRE
ELECTRICITY
MACHINERY
Major Injuries in Offshore Deck Operations (including Transport) 3.4 The chart below shows the links between offshore deck operations and kind of accident. Major injuries in this discipline (7) fell by 1 from last year and represent 19% of all major injuries for the year. Historically, deck operations have been a significant contributor to major injury totals, with deck operations injuries occurring over the last four years accounting for 22% of all major injuries. In 2011/12, six major injury incidents arising from deck operations resulted in fractures with the remaining one being a laceration.
0
1
2
3
4
5
6
2008/09 2009/10 2010/11 2011/12
No
. of
inci
den
ts
STRUCK BY
STRUCK AGAINST
HANDLING
SLIP, TRIP
FALLS FROM HEIGHT
8
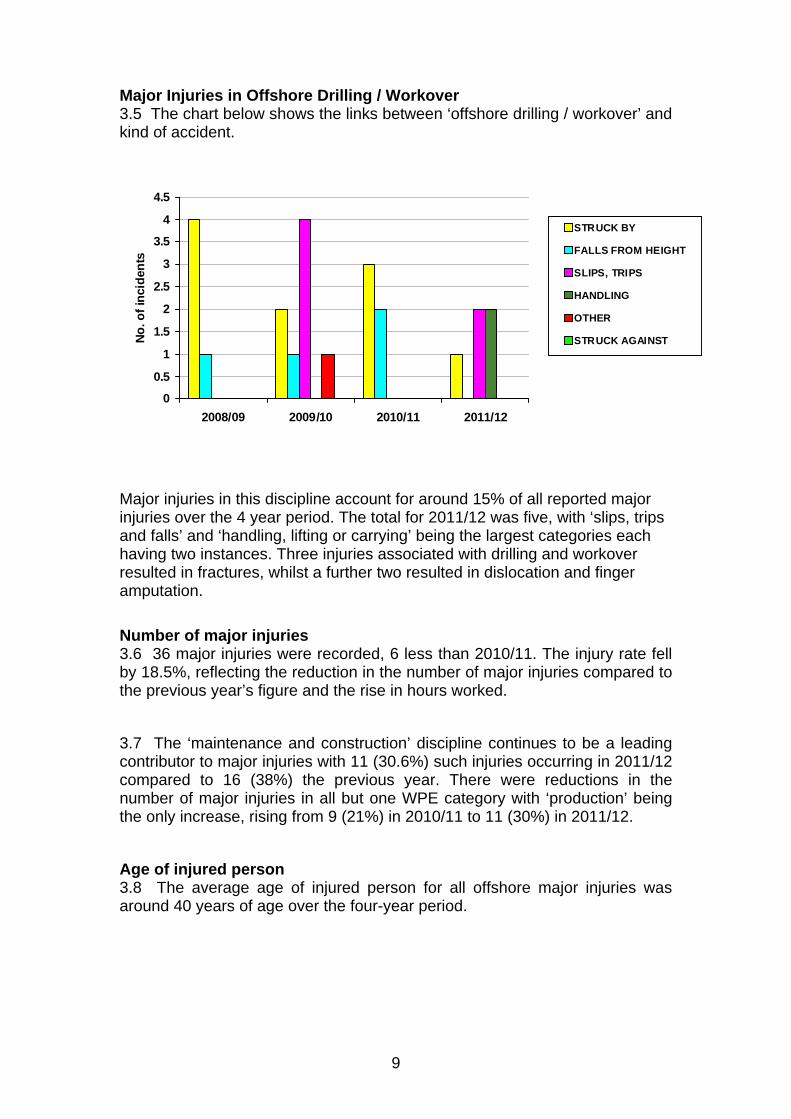
Major Injuries in Offshore Drilling / Workover 3.5 The chart below shows the links between ‘offshore drilling / workover’ and kind of accident.
0
0.5
1
1.5
2
2.5
3
3.5
4
4.5
2008/09 2009/10 2010/11 2011/12
No
. of
inci
den
ts
STRUCK BY
FALLS FROM HEIGHT
SLIPS, TRIPS
HANDLING
OTHER
STRUCK AGAINST
Major injuries in this discipline account for around 15% of all reported major injuries over the 4 year period. The total for 2011/12 was five, with ‘slips, trips and falls’ and ‘handling, lifting or carrying’ being the largest categories each having two instances. Three injuries associated with drilling and workover resulted in fractures, whilst a further two resulted in dislocation and finger amputation.
Number of major injuries 3.6 36 major injuries were recorded, 6 less than 2010/11. The injury rate fell by 18.5%, reflecting the reduction in the number of major injuries compared to the previous year’s figure and the rise in hours worked.
3.7 The ‘maintenance and construction’ discipline continues to be a leading contributor to major injuries with 11 (30.6%) such injuries occurring in 2011/12 compared to 16 (38%) the previous year. There were reductions in the number of major injuries in all but one WPE category with ‘production’ being the only increase, rising from 9 (21%) in 2010/11 to 11 (30%) in 2011/12.
Age of injured person 3.8 The average age of injured person for all offshore major injuries was around 40 years of age over the four-year period.
9

Nature and Site of injury 3.9 ‘Fracture’ continues as the most frequently recorded single kind of major injury accounting for 64% of major injuries in 2011/12. Fracture is also the highest occurring outcome of all injuries (i.e. including over-3-day injuries) with 29% of all injuries. The majority of fractures classed as major injuries were to the hand/wrist or foot/ankle or limbs. Amputations accounted for two major injuries, all involving loss of finger parts.
Kind of Accident 3.10 The single main category for ‘kind of major accident’ during 2011/12, was ‘slips trips and falls’ with 13 incidents (36% major injuries) followed by ‘handling, lifting or carrying’ and ‘struck by moving, flying or falling objects’ each with 7 incidents (19% of major injuries). Taken together, slips trips and falls of all types accounted for a total of 17 major injuries (47% major injuries).
Other trends 3.11 Both the number of major injuries and over-3-day injuries decreased in 2011/12 (36 and 95 compared to the previous year 42 and 106 respectively). Overall including the two fatalities this year the total number of all reportable injuries for the year is therefore down by 16 (10.8%) compared to the previous year.
10

HYDROCARBON RELEASES (HCRs) 4.1 This section provides outline details relating to HCRs between 1998/99 and 2011/12. Fig. 12 shows the split between releases described as ‘Minor’ and those that are described as either ‘Major’ or ‘Significant’, based on severity classification definitions5 agreed with the offshore industry. 4.2 RIDDOR reportable HCRs are unintended releases of petroleum gas or liquids from an offshore installation that either result in fire or explosion or require action to prevent or limit the consequences of a potential fire or explosion if ignited, or which have the potential to cause death or major injury. During 2011/12 two releases (i.e. 1.5% of all reported HCRs) were reported as ignited events. 4.3 Detailed supplementary data (upon which Fig 12 is based) relating to HCRs reported under RIDDOR are voluntarily reported to HSE by offshore operators on Form OIR/12. Only those releases reported via Form OIR/12 are shown in Figure 12. Note that only releases occurring on an installation or within the 500 meter safety zone surrounding the installation are covered by the reported data in this report. 6 4.4 The details below are based on dangerous occurrences involving a release of hydrocarbon and are predominantly dangerous occurrence code 73 events. However a few events reported under other dangerous occurrence codes may also involve a release of hydrocarbon for which a Form OIR/12 has been submitted and which are therefore included in the details below. The reported number of hydrocarbon releases (DO73) shown on Table 12 may therefore differ slightly to the numbers reported below and in Figure 12. 4.5 Few reported HCRs gave rise to incidents which could, in whole or in part, be considered as "oil spills"6. The number of the liquid based HCR incidents where a quantity of hydrocarbon liquid was released to the sea in 2011/12 was very small - seven in total – with the amounts ranging from minimal to 19000kg. 4.6 The combined number of major and significant (56) HCRs in 2011/12 was a notable reduction compared to the previous year (73) and are the lowest reported since records began. 4.7 The number of minor releases fell by 18.3% in 2011/12 (76) compared to 2010/11 (93).
5 ‘Severity Classification’ guidance for Major, Significant and Minor HCRs can be found on the HSE website at https://www.hse.gov.uk/hcr3/help/help_public.asp 6 Dept. of Energy and Climate Change (DECC) Petroleum Operations Notice 1 (PON1) report form is used by
operators to report all releases of oils and chemicals of whatever size to sea from offshore installations and pipelines under the Offshore Petroleum Activities (Oil Pollution Prevention and Control) Regulations 2005 (OPPC)(as amended) and Offshore Chemicals Regulations 2002 (OCR) (as amended) to DECC and other authorities. For details of spills to sea refer to DECC.
11

4.8 Overall, the total number of releases of all severities reported on Form OIR/12 in 2011/12 (132) fell by 20.5% compared to 2010/11 (166). 4.9 Hydrocarbon gas releases accounted for 71% of all major and significant releases in 2011/12 compared to 64.4% the previous year. There was one reported major gas releases in 2011/12 (defined as being greater than 300kg gas and having the potential to quickly impact outside the local area and be likely to cause a ‘Major Accident’ as defined in the Offshore Installations (Safety Case) Regulations 2005). Larger gas releases pose a significant risk of escalation to a more serious event, if ignited, due to the greater migration potential of gas clouds to other areas of an installation compared to an accumulated (pool of) liquid release. 21.4% of the combined total of all types of major and significant HCRs were major or significant gas releases greater than 25kg and 7% were gas releases greater than 100kg. The classification of a hydrocarbon release incident as ‘Significant’ or ‘Major’ implies the potential for that release, if ignited, to directly cause or escalate to an event severe enough to be viewed as a ‘Major Accident’. Emergency action is normally required to be taken to limit the potential consequences of ignition of a reportable leak of hydrocarbon. OTHER KEY INDUSTRY PERFORMANCE INDICATORS (KPIs) Hydrocarbon releases are regarded as potential precursors to major accidents if ignited, and HSE monitors the number of major and significant hydrocarbon releases as a KPI of the offshore industry’s effectiveness of process health and safety management on offshore installations. Annex 2 provides supplementary information relating to activity that the offshore industry representative body Oil and Gas UK have been undertaking in respect of additional KPI monitoring activities. This monitoring activity is not undertaken by HSE and is included in this report for information only in the context of providing a more complete picture of UK offshore KPI monitoring processes undertaken by both HSE and the industry.
12

Annex 1
CONTENTS
Page
Table 1 Summary of injuries and dangerous occurrences April 1995 – March 2012
15
Table 2
Injury rates per 100,000 workers April 1995 – March 2012
15
Table 3 Three-year rolling average of number of injuries April 1995 – March 2012
16
Table 3a Three-year rolling average of injury rates per 100,000 workers April 1995 – March 2012
16
Table 4 Ratio of over-3-day to major injuries 1995/06 – 2011/12 17
Table 5 Severity of injury and nature of injury 2011/12 17
Table 6 Severity of injury and part of body injured 2011/12 18
Table 7 Severity of injury and kind of accident 2011/12 19
Table 8 Severity of injury and age of injured person 2011/12 20
Table 9 Severity of injury and work process environment 2011/12 20
Table 10 Severity of injury and agent of accident 2011/12 21
Table 11 Ill-health incidents April 1998 – March 2012 22
Table 12 Dangerous occurrence by type 2011/12 23
Table 12(a) Well related dangerous occurrences 2011/12 23
Table 12(b) Well related dangerous occurrences 2011/12 recorded under other type codes
24
Table 12(c) Pipeline related dangerous occurrences 2011/12 24
Figure 1 Injuries by severity April 1995 – March 2012 25
Figure 2 Combined fatal and major injury rate April 1995 – March 2012
26
Figure 3 Over-3-day injury rate April 1995 – March 2012 27
Figure 4 3-year rolling average of number of injuries April1995 – March 2012
28
Figure 4a 3-year rolling average of injury rates April 1995 – March 2012
29
Figure 5 Ratio of over-3-day to major injuries April 1995 – March 2012
30
Figure 6 & 6a Severity of injury and nature of injury 2011/12 31
Figure 7 & 7a Severity of injury and part of body 2011/12 32
Figure 8 & 8a Severity of injury and kind of accident 2011/12 33
Figure 9 & 9a Severity of injury and age of injured person 2011/12 34
13

14
CONTENTS
Figure 10 & 10a Severity of injury and work process environment 2011/12 35
Figure 11 & 11a Severity of injury and agent of accident 2011/12 36
Figure 12 Offshore Hydrocarbon Releases 1996/97 to 2011/12 37
Figure 12(a) Well related dangerous occurrences 2003/04 to 2011/12 38
Figure 12(b) Pipeline related dangerous occurrences 2010/11 to 2011/12
39
Figure 13 Failure of lifting machinery etc 2001/02 to 2011/12 40
Figure 14 Collision/Possible collision offshore 2001/02 to 2011/12 41
Figure 15 Installation stability 2001/02 to 2011/12 42
Figure 16 Evacuation of an installation 2001/02 to 2011/12 43

TABLE 1 – SUMMARY OF INJURIES AND DANGEROUS OCCURRENCES APRIL 1995 – MARCH 2012
95/96 96/97 97/98 98/99 99/ 00 00/01 01/02 02/03 03/04 04/05 05/06 06/07 07/08 08/09 09/10 10/11 11/12
Fatalities 5 2 3 1 2 3 3 0 3 0 2 2 0 0 0 0 2
Major injuries
42 44 74 74 53 53 47 64 48 48 50 39 44 30 *50(1) *42(3) 36
Total fatalities & major injuries
47 46 77 75 55 56 50 64 51 48 52 41 44 30 50(1)* *42(3) 38
Over-3-day injuries
375 302 291 245 193 177 187 120 103 111 125 164 148 140 *110(1) *106(4) *95(8)
Total Injuries
422 348 368 320 248 233 237 184 154 159 177 205 192 170 *160(2) *148(7) *133(8)
Dangerous occurrence
528 569 649 693 647 764 661 635 530 558 491 485 509 477 434 430 409
Figure in brackets are offshore windfarm incidents included in the total
TABLE 2 – I NJURY RATES PER 100,000 WORKERS APRIL 1995 – MARCH 2012
95/96 96/97 97/98 98/99 99/00 00/01 01/02 02/03 03/04 04/05 05/06 06/07 07/08 08/09 09/10 10/11 11/12
Workforce 29,003 26,853 23,000 25,500 19,000 23,330 23,206 20,619 18,793 18,940 23,072 28,176 28,132 28,224 26,598 27660 29058
Fatal injury rate
17.2 7.4 13.0 3.9 10.5 12.9 12.9 0 16.0 0 8.7 7.1 0 0 0 0 6.9
Major injury rate
144.8 163.9 321.7 290.2 278.9 227.2 202.5 310.4 255.4 253.4 216.7 138.4 156.4 106.3 188.0 152 123.9
Fatal + major injury rate
162.1 171.3 334.8 294.1 289.5 240.0 215.5 310.4 271.4 253.4 225.4 145.5 156.4 106.3 188.0 152 130.8
Over-3-day injury rate
1293 1124.6 1265.2 960.8 1015.8 758.7 805.8 582.0 548.1 586 541.8 582.1 526.1 496 413.6 383.2 326.9
15

TABLE 3 – THREE-YEAR ROLLING AVERAGE OF NUMBER OF INJURIES APRIL 1995 – MARCH 2012
1995/96
1996/97 1996/971998/99
1997/98 1999/00
1998/992000/01
1999/002001/02
2000/012002/03
2001/022003/04
2002/03 2004/05
2003/042005/06
2004/052006/07
2005/062007/08
2006/072008/09
2007/082009/10
2008/09 2010/11
2009/10 2011/12
Total fatalities + major injuries
56.7 66 69 62 53.4 56.7 55 54.3 50.3 47 45.7 38.3 41.3 40.7 43.3
Over-3-day injuries
323 279 243 205 185.7 161.3 136.7 111.3 113 133.3 145.7 150.7 132.7
118.7 103.7
TABLE 3a THREE-YEAR ROLLING AVERAGE OF INJURY RATES PER 100,000 WORKERS APRIL 1995 – MARCH 2012
1995/96
1996/97 1996/971998/99
1997/98 1999/00
1998/992000/01
1999/002001/02
2000/012002/03
2001/022003/04
2002/03 2004/05
2003/042005/06
2004/052006/07
2005/062007/08
2006/072008/09
2007/082009/10
2008/09 2010/11
2009/10 2011/12
Average workforce
26,285 25,118 22,500 22,610 21,845 22,385 20,873 19,451 20,268 23,396 26,460 28177 27651 27494 27772
Fatal + major injury rate
216.9 262.8 306.7 274.2 247.2 254.6 263.5 277.6 248.3 200.9 172.7 136.1 149.4 148 155.9
Over-3-day injury rate
1228.8 1110.8 1080.0 906.7 851.5 719.2 656.4 572.4 557.5 569.9 550.6 534.7 479.9 430.9 373.4
16

17
TABLE 4 – RATIO OF OVER-3-DAY TO MAJOR INJURIES 1997/98 – 2011/12
97/98 98/99 99/00 00/01 01/02 02/03 03/04 04/05 05/06 06/07 07/08 08/09 09/10 10/11 11/12
MAJOR 74 74 53 53 47 64 48 48 50 39 44 30 50 42 36 OVER-3-DAY 291 245 193 177 187 120 103 111 125 164 148 140 110 106 95 Ratio 3.9 3.3 3.6 3.3 4 1.9 2.14 2.31 2.5 4.2 3.36 4.67 2.2 2.52 2.64
TABLE 5 – SEVERITY OF INJURY AND NATURE OF INJURY
2011/12
SEVERITY OF INJURY NATURE OF INJURY
FATAL MAJOR OVER-3-DAY ALL INJURIES
Amputation 0 2 0 2 Contusion 0 0 14 14 Dislocation 0 5 2 7 Fracture 0 23 16 39 Laceration & open wound 0 3 17 20 Loss of sight 0 0 2 2 Injuries of more than one of the other natures
0 1 2 3
Injuries not classified elsewhere
2 1 2 5
Sprains & strains 0 1 35 36 Superficial injury 0 0 3 3 Burn 0 0 2 2
Total 2 36 95 133

TABLE 6 – SEVERITY OF INJURY AND PART OF BODY INJURED 2011/12
SEVERITY OF INJURY
SITE OF INJURY FATAL MAJOR
OVER-3-DAY
ALL INJURIES
Eye 0 0 3 3 Other parts of face 0 0 2 2 Head excluding face 0 1 0 1 Several locations of head 0 0 0 0
TOTAL: HEAD 0 1 5 6
Neck 0 0 3 3 Back 0 0 9 9 Trunk 0 2 4 6 Several locations of torso 0 0 1 1
TOTAL: TORSO 0 2 17 19
One or more finger(s) or thumb(s)
0 3 28 31
Hand 0 2 6 8 Wrist 0 5 1 6 Rest of upper limb 0 6 6 12 Several locations of upper limb
0 0 2 2
TOTAL: UPPER LIMB 0 16 43 59
One or more toes 0 0 3 3 Foot 0 4 3 7 Ankle 0 7 14 21 Rest of lower limb 0 6 9 15 Several locations of lower limb
0 0 0 0
TOTAL: LOWER LIMB 0 17 29 46
Several locations 0 0 1 1 General locations 0 0 0 0 Unspecified locations 2 0 0 2
GRAND TOTAL 2 36 95 133
18

TABLE 7 – SEVERITY OF INJURY AND KIND OF ACCIDENT 2011/12
SEVERITY OF INJURY
KIND OF ACCIDENT FATAL MAJOR OVER-3-DAY
ALL INJURIES
Contact with moving machinery or material being machined 0 2 7 9
Struck by moving, including flying or falling object 0 7 24 31
Struck against something fixed or stationary 0 3 10 13
Injured whilst handling, lifting or carrying 0 7 21 28
Slip, trip or fall on same level 0 13 18 31
Fall from height (number over 2m in brackets) 1 4 12 17
Exposed to, or in contact with, a harmful substance 0 0 3 3
Exposed to fire 0 0 0 0
Contact with electricity 0 0 0 0
Other / not recorded 1 0 0 1
TOTAL 2 36 95 133
19

TABLE 8 – SEVERITY OF INJURY AND AGE OF INJURED PERSON – 2011/12
SEVERITY OF INJURY AGE OF INJURED
PERSON FATAL MAJOR OVER-3-DAY ALL INJURIES
Less than 20 0 1 1 20 – 24 1 9 10 25 – 29 3 12 15 30 – 34 1 7 13 21 35 – 39 1 2 13 16 40 – 44 6 9 15 45 – 49 2 12 14 50 – 54 5 3 8 55 – 59 5 11 16 60 – 64 2 6 8 65 – 69 0 0 0
Not recorded 3 6 9 TOTAL 2 36 95 133
TABLE 9 – SEVERITY OF INJURY AND WORK PROCESS ENVIRONMENT – 2011/12
SEVERITY OF IN JURY
WORK PROCESS ENVIRONMENT FATAL MAJOR OVER-3-DAY
ALL INJURIES
DECK OPERATIONS 0 7 23 30 DRILLING 1 5 11 17 MANAGEMENT 0 2 9 11 PRODUCTION 0 11 10 21 MAINTENANCE / CONSTRUCTION 0 11 39 50 OFFSHORE DIVING* 1 0 3 4
TOTAL 2 36 95 133 * HSE Offshore Division retains responsibility for all aspects of offshore diving and inshore diving. Statistics stated are for offshore diving and diving support activities only.
20

TABLE 10 – SEVERITY OF INJURY AND AGENT OF ACCIDENT – 2011/12
SEVERITY OF INJURY AGENT OF ACCIDENT
FATAL MAJOR OVER-3-DAY ALL INJURIES
Surfaces, structures and building access equipment 1 19 46 66
Systems for the distribution of materials or substances 0 1 0 1
Hand held tools and equipment 0 3 7 10
Systems for energy and storage, motors 0 0 0 0
Conveying, lifting storage systems and hand-held pushed / pulled transport equipment
0 6 19 25
Machines and equipment – not hand tools 0 2 6 8
Materials, objects, products, machine components 0 2 8 10
Substances and radiation 0 0 2 2
Safety devices and equipment 0 0 2 2
Furniture, washing and bathing facilities, office and personal equipment
0 1 4 5
Leisure equipment 0 0 1 1
People 0 0 0 0
Physical phenomena and natural elements 0 2 0 2
Other, not known 1 0 0 1
TOTAL 2 36 95 133
21

22
TABLE 11 – ILL HEALTH INCIDENTS APRIL 1998 – MARCH 2012
DESCRIPTION 1998/99 1999/00 2000/01 2001/02 2002/03 2003/04 2004/05 2005/06 2006/07 2007/08 2008/09 2009/10 2010/11 2011/12 TOTAL
Decompression illness
3 2 1 5 4 1 2 8 2 1 1 4 34
Barotrauma 1 1 1 3 Cramp repetitive 1 1 2 Beat knee 1 1 1 3 Inflamation of tendons 1 1 1 2 1
6
Hand-arm vibration
1 2 4 3
3 13
Occupational dermatitis
4 2 5 2 1 3
17
Chickenpox 6 7 10 6 13 6 8 6 9 4 7 4 5 6 97 Food poisoning 1* 1 3 2** 1 8 Ma laria 1 1 Meningitis 1 1 1 3 Rub ella 1 1 2 Mumps 1 1 6 1 1 1 11 Scarlet fe ver 1 1 2 Mea sles 1 1 Legionellosis 1 1
TOTAL 16 15 20 13 19 13 11 18 21 6 21 10 7 14 204 * This incident resulted in twelve people being affected ** One incident involved 21 workers, the other incident affected 16 workers
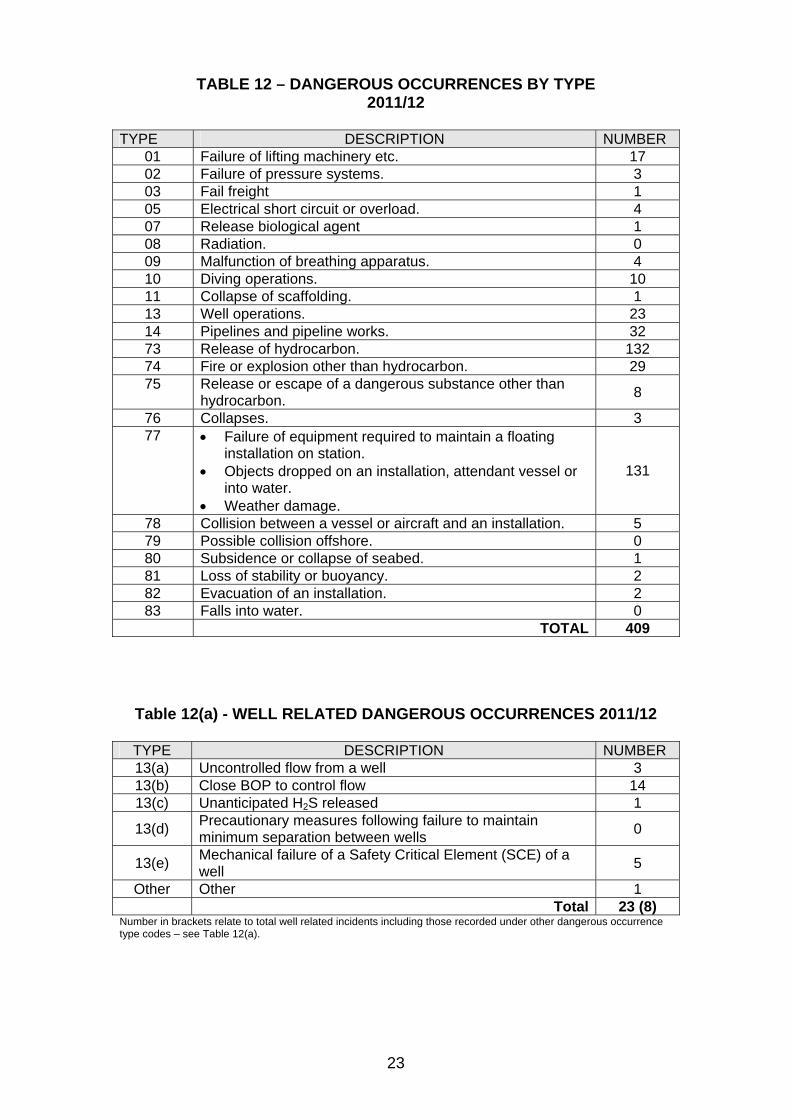
TABLE 12 – DANGEROUS OCCURRENCES BY TYPE 2011/12
TYPE DESCRIPTION NUMBER
01 Failure of lifting machinery etc. 17 02 Failure of pressure systems. 3 03 Fail freight 1 05 Electrical short circuit or overload. 4 07 Release biological agent 1 08 Radiation. 0 09 Malfunction of breathing apparatus. 4 10 Diving operations. 10 11 Collapse of scaffolding. 1 13 Well operations. 23 14 Pipelines and pipeline works. 32 73 Release of hydrocarbon. 132 74 Fire or explosion other than hydrocarbon. 29 75 Release or escape of a dangerous substance other than
hydrocarbon. 8
76 Collapses. 3 77 Failure of equipment required to maintain a floating
installation on station. Objects dropped on an installation, attendant vessel or
into water. Weather damage.
131
78 Collision between a vessel or aircraft and an installation. 5 79 Possible collision offshore. 0 80 Subsidence or collapse of seabed. 1 81 Loss of stability or buoyancy. 2 82 Evacuation of an installation. 2 83 Falls into water. 0
TOTAL 409
Table 12(a) - WELL RELATED DANGEROUS OCCURRENCES 2011/12
TYPE DESCRIPTION NUMBER 13(a) Uncontrolled flow from a well 3 13(b) Close BOP to control flow 14 13(c) Unanticipated H2S released 1
13(d) Precautionary measures following failure to maintain minimum separation between wells
0
13(e) Mechanical failure of a Safety Critical Element (SCE) of a well
5
Other Other 1 Total 23 (8)
Number in brackets relate to total well related incidents including those recorded under other dangerous occurrence type codes – see Table 12(a).
23
24
Table 12(b) – WELL RELATED DANGEROUS OCCURRENCES 2011/12 RECORDED UNDER OTHER TYPE.
TYPE DESCRIPTION NUMBER
73 Release of Hydrocarbon 8 Total 8
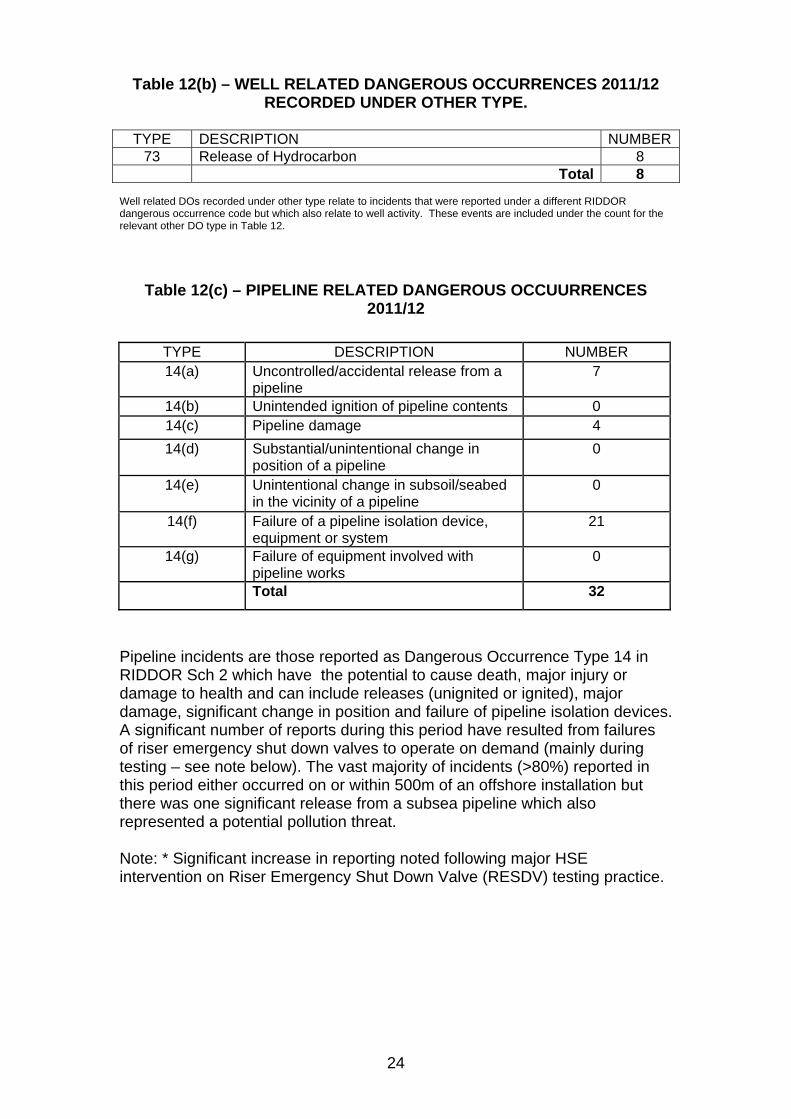
Well related DOs recorded under other type relate to incidents that were reported under a different RIDDOR dangerous occurrence code but which also relate to well activity. These events are included under the count for the relevant other DO type in Table 12.
Table 12(c) – PIPELINE RELATED DANGEROUS OCCUURRENCES 2011/12
TYPE DESCRIPTION NUMBER 14(a) Uncontrolled/accidental release from a
pipeline 7
14(b) Unintended ignition of pipeline contents 0 14(c) Pipeline damage 4
14(d) Substantial/unintentional change in position of a pipeline
0
14(e) Unintentional change in subsoil/seabed in the vicinity of a pipeline
0
14(f) Failure of a pipeline isolation device, equipment or system
21
14(g) Failure of equipment involved with pipeline works
0
Total 32
Pipeline incidents are those reported as Dangerous Occurrence Type 14 in RIDDOR Sch 2 which have the potential to cause death, major injury or damage to health and can include releases (unignited or ignited), major damage, significant change in position and failure of pipeline isolation devices. A significant number of reports during this period have resulted from failures of riser emergency shut down valves to operate on demand (mainly during testing – see note below). The vast majority of incidents (>80%) reported in this period either occurred on or within 500m of an offshore installation but there was one significant release from a subsea pipeline which also represented a potential pollution threat. Note: * Significant increase in reporting noted following major HSE intervention on Riser Emergency Shut Down Valve (RESDV) testing practice.

Figure 1
INJURIES BY SEVERITY APRIL 1995 – MARCH 2012
0
50
100
150
200
250
300
350
400
450
1995
/96
1996
/97
1997
/98
1998
/99
1999
/200
020
00/0
120
01/0
220
02/0
320
03/0
420
04/0
520
05/0
620
06/0
720
07/0
820
08/0
920
09/1
020
10/1
120
11/1
2N
um
be
r o
f in
juri
esFatalities
Major
Over-3-day
25
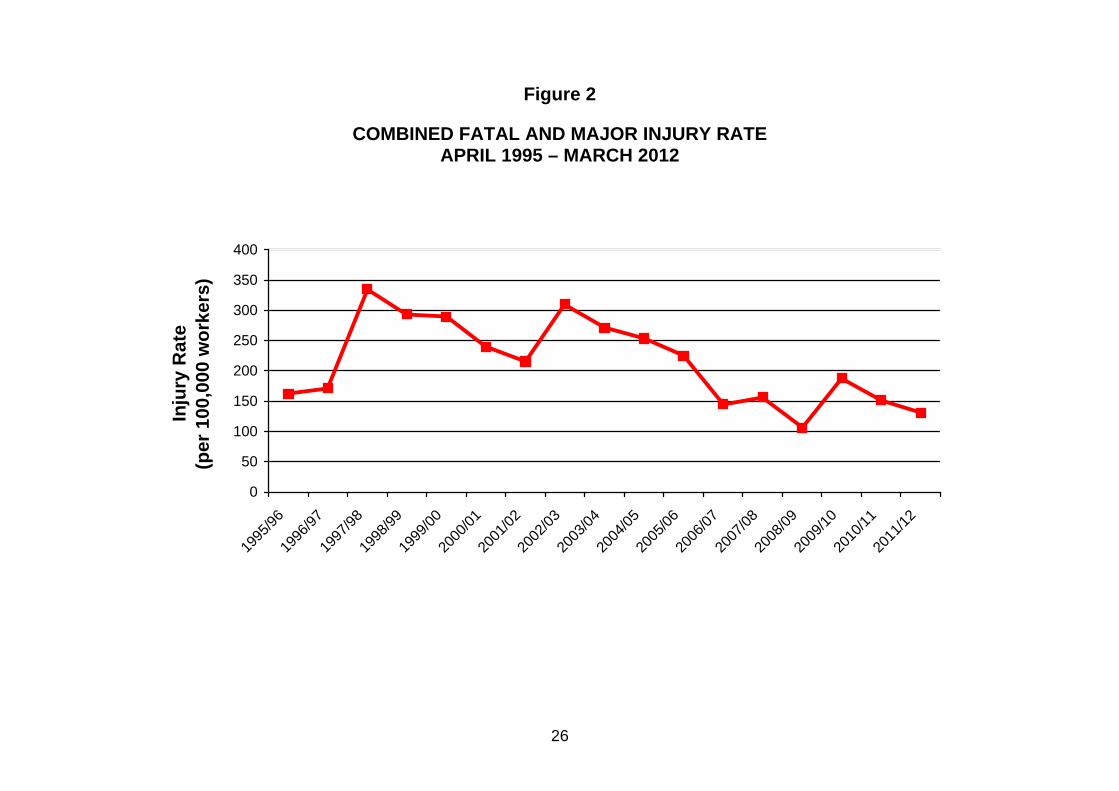
Figure 2
COMBINED FATAL AND MAJOR INJURY RATE APRIL 1995 – MARCH 2012
0
50
100
150
200
250
300
350
400
1995
/96
1996
/97
1997
/98
1998
/99
1999
/00
2000
/01
2001
/02
2002
/03
2003
/04
2004
/05
2005
/06
2006
/07
2007
/08
2008
/09
2009
/10
2010
/11
2011
/12
Inju
ry R
ate
(per
100
,000
wo
rker
s)
26

Figure 3
OVER-3-DAY INJURY RATE APRIL 1995 – MARCH 2012
0
200
400
600
800
1000
1200
1400
1995
/96
1996
/97
1997
/98
1998
/99
1999
/200
020
00/0
120
01/0
220
02/0
320
03/0
420
04/0
520
05/0
620
06/0
720
07/0
820
08/0
920
09/1
020
10/1
120
11/1
2
Inju
ry R
ate
(per
100
,00
wo
rker
s)
27

Figure 4
3-YEAR ROLLING AVERAGE OF NUMBER OF INJURIES
APRIL 1995 – MARCH 2012
0
50
100
150
200
250
300
350
1995/96
-1997
/98
1996/97-
1998/9
9
1997/98-
1999/2
000
1998
/99-2
000/01
1999/0
0-2001
/02
2000/01-2
002/03
2001/02-
2003/0
4
2002/03-2
004/05
2003/0
4-2005
/06
2004/05-2
006/07
2005/06-
2007/0
8
2006/07-20
08/09
2007/08-2
009/10
2008/0
9-2010
/11
2009/10-
2011
/12
Nu
mb
er o
f In
juri
es
Combined fatal & major injuries Over-3-day
28

Figure 4a
3-YEAR ROLLING AVERAGE OF INJURY RATES APRIL 1995 – MARCH 2012
0
200
400
600
800
1000
1200
1400
1995
/96-
1997
/98
1996
/97-
1998
/99
1997
/98-
1999
/200
0
1998
/99-
2000
/01
1999
/200
0-01
/02
2000
/01-
2002
/03
2001
/02-
2003
/04
2002
/03-
2004
/05
2003
/04-
2005
/06
2004
/05-
2006
/07
2005
/06-
2007
/08
2006
/07-
2008
/09
2007
/08-
2009
/10
2008
/09-
2010
/11
2009
/10-
2011
/12
Inju
ry R
ate
(per
100
,000
wo
rker
s)
Combined fatalities & major injuries Over-3-day
29
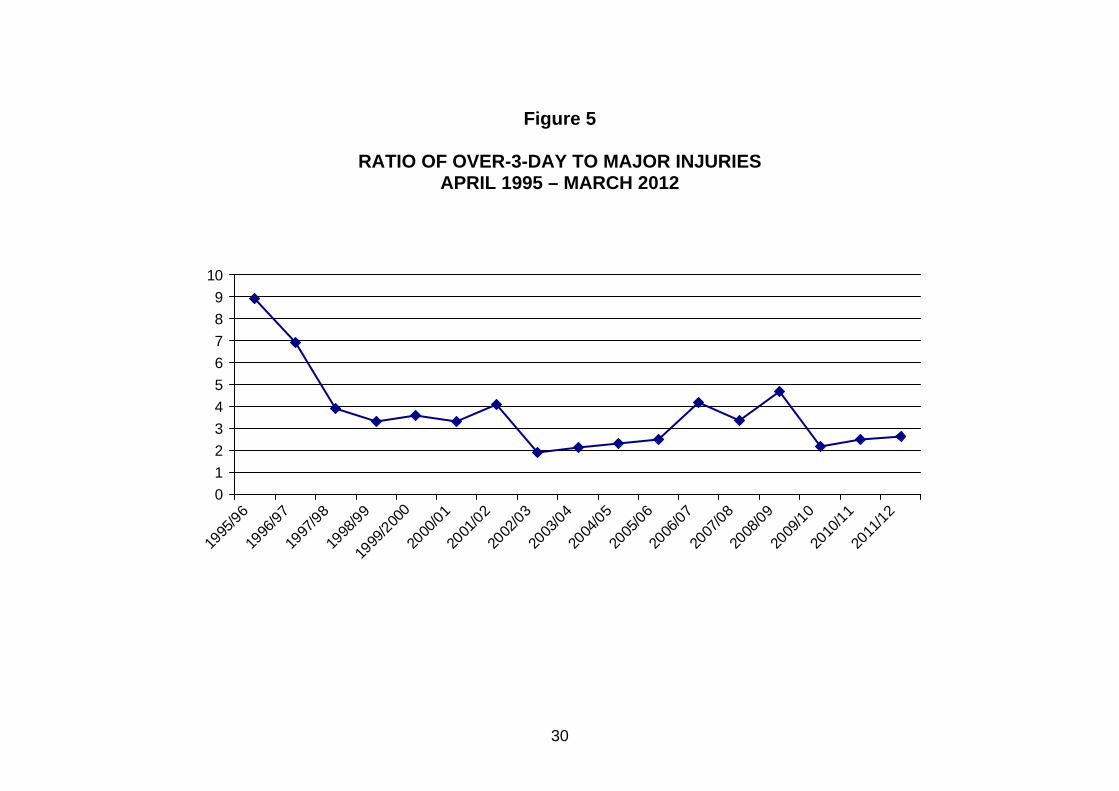
Figure 5
RATIO OF OVER-3-DAY TO MAJOR INJURIES
APRIL 1995 – MARCH 2012
0
1
2
3
4
5
6
7
8
9
10
1995
/96
1996
/97
1997
/98
1998
/99
1999
/200
020
00/0
120
01/0
220
02/0
320
03/0
420
04/0
520
05/0
620
06/0
720
07/0
820
08/0
920
09/1
020
10/1
120
11/1
2
30

Figure 6 and 6a
SEVERITY OF INJURY AND NATURE OF INJURY 2011/12
Fig 6a ALL SEVERITIES OF INJURY
Fractures 29.4%
Amputations 1.5%
Contusions 10.5%
Sprains & Strains 27.1%
All Others 16.5%
Lacerations 15%
Fig 6BY SEVERITY OF INJURY
0 10 20 30 40 50 60 70
Burns
Superficial
Sprains
Other
Several causes
Loss of sight
Lacerations
Fractures
Dislocations
Contusions
Amputations
Kin
d o
f A
ccid
ent
Number of Injuries
Major Over-3-day Fatal
31

Figures 7 and 7a
SEVERITY OF INJURY AND PART OF BODY 2011/12
0
5
10
15
20
25
30
35
40
45
Nu
mb
er o
f in
juri
es
Upper li
mb
Torso
Lower li
mb
Head
Sever
al lo
catio
ns
Unspec
ified
loca
tions
Site of injuries
Fig 7 BY SEVERITY OF INJURY
Major
Over-3-day
Fatal
Fig 7a ALL SEVERITIES OF INJURY
Head 4.5%All Others 2.3%
Upper Limb 44.4%
Torso 14.3%
Lower Limb 34.5%
32

Figures 8 and 8a
SEVERITY OF INJURY AND KIND OF ACCIDENT
2011/12
Fig 8BY SEVERITY OF INJURY
0 10 20 30 40 50 60 70
Exposed substance
Exposed fire
Other
Electricity
Contact machinery
Struck against
Low fall
High fall
Struck by
Slip/trip
Handling
Kin
d o
f A
ccid
ent
Number of Injuries
Major Over-3-day Fatal
Fig 8a ALL SEVERITIES OF INJURY
Slip /trip 23.3%
Struck by 23.3%
Handling 21.1%
All falls from height 12.8%
All others 19.5%
33

Figures 9 and 9a
SEVERITY OF INJURY AND AGE OF INJURED PERSON 2011/12
Fig 9A - ALL SEVERITIES
<20 1%
20-248%
25-2911%
30-3415%
35-3912%40-44
11%
45-4911%
50-546%
55-5912%
60-646%
65-690%
NR7%
Fig 9 BY SEVERITY OF INJURY
0 5 10 15 20 25
<20
20-24
25-29
30-34
35-39
40-44
45-49
50-54
55-59
60-64
65-69
Not recorded
Ag
e G
rou
pin
gs
Number of Injuries
Major Over-3-day Fatal
34

Figures 10 and 10a
SEVERITY OF INJURY AND WORK PROCESS ENVIRONMENT
2011/12
Fig 10SEVERITY OF INJURY
0 10 20 30 40 50 60 70
Production
Management
Drilling
Deck
Maint. / Const.
Dive
Wo
rk P
roc
es
s E
nv
.
Number of Injuries
Major Over-3-day Fatal
Fig 8a ALL SEVERITIES OF INJURY
Deck 22.5%
Maint. / Const. 37.6%
Dive 3%
Drilling 12.8%
Management 8.3%
Production 15.8%
35
Figures 11 and 11a SEVERITY OF INJURY AND AGENT OF ACCIDENT
2011/12
Fig 11BY SEVERITY OF INJURY
0 10 20 30 40 50
Systems for energy etc
Safety Devices
Machines not hand held
Furniture
Materials/Objects
Substances/radiation
Hand held tools
People
Materials/Distribution systems
Conveying/lifting systems
Surfaces
Leisure equipment
Physical phenomena
Other/not known
Ag
en
t o
f A
cci
den
t
Number of Injuries
Major Over-3-day Fatal
Fig 11a ALL SEVERITIES OF INJURY
All Other 9.7%
Surfaces 49.
Materials / Objects 7.5%
Machines / equipment 6%
Distribution systems 1%
Conveying / lifting systems
18.7%
Hand Held Tools 7.5%
36

Figure 12
OFFSHORE HYDROCARBON RELEASE DANGEROUS OCCURRENCES (DO73)
1996/97 TO 2011/12
0
50
100
150
200
250
300N
um
ber of re
leases
1996
/97
1997
/98
1998
/99
99/200
0
2000
/01
2001
/02
2002
/03
2003
/04
2004
/05
2005
/06
2006
/07
2007
/08
2008
/09
2009
/10
2010
/11
2011
/12
FIG.12 HYDROCARBON RELEASES
Minor Significant Major
Fig 12 based on hydrocarbon releases (HCRs) reported on Form OIR/12. Form OIR/12 is a voluntary offshore industry system of data reporting for HCRs. Non-attributable data from Form OIR/12 is available to authorised users on the Hydrocarbon Releases System on the Offshore Oil & Gas pages on the HSE website. ‘Severity Classification’ guidance for Major, Significant and Minor HCRs can be found on the HSE website at https://www.hse.gov.uk/hcr3/help/help_public.asp
37

Figure 12(a)
WELL RELATED DANGEROUS OCCURRENCES (DO 13) 2003/04 TO 2011/12
Fig. 12(a) WELL RELATED DANGEROUS OCCURRENCES
0
10
20
30
40
50
60
2003
/04
2004
/05
2005
/06
2006
/07
2007
/08
2008
/09
2009
/10
2010
/11
2011
/12
Nu
mb
er o
f O
ccu
rren
ces
Figure 12(a) Well Related Incidents includes those incidents reported under RIDDOR Schedule 2 - DO13.
38
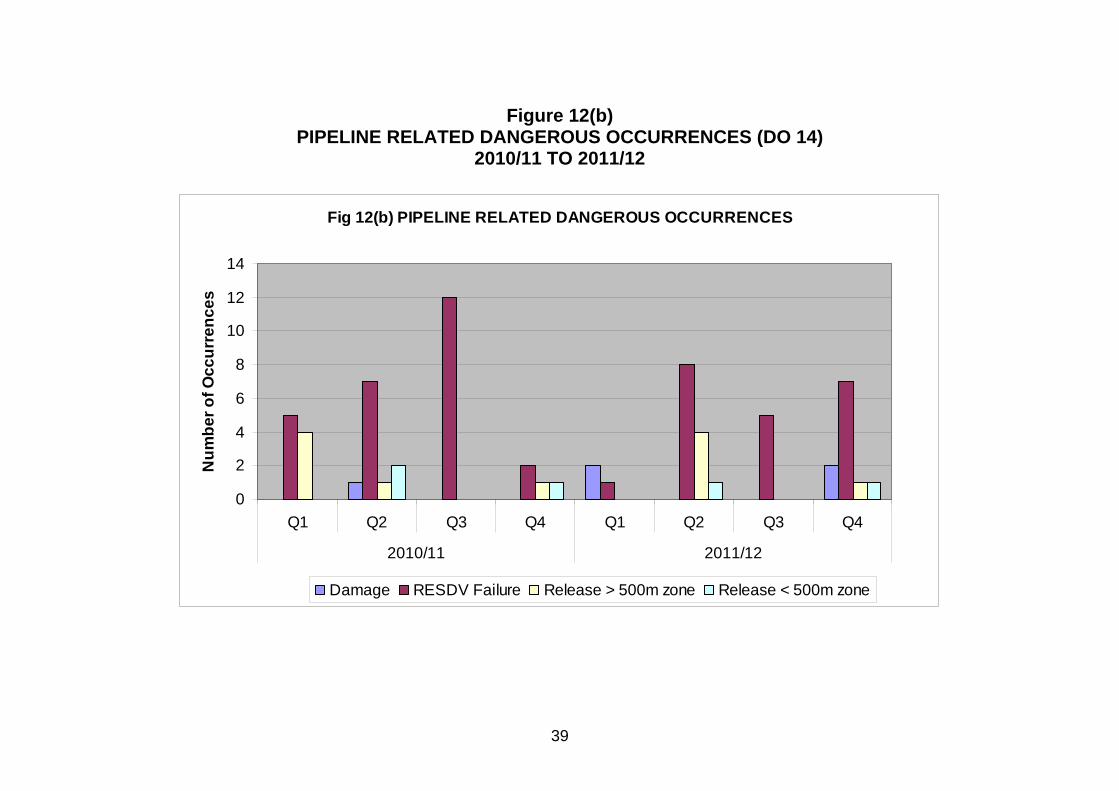
Figure 12(b)
PIPELINE RELATED DANGEROUS OCCURRENCES (DO 14) 2010/11 TO 2011/12
Fig 12(b) PIPELINE RELATED DANGEROUS OCCURRENCES
0
2
4
6
8
10
12
14
Q1 Q2 Q3 Q4 Q1 Q2 Q3 Q4
2010/11 2011/12
Nu
mb
er
of
Oc
cu
rre
nc
es
Damage RESDV Failure Release > 500m zone Release < 500m zone
39

Figure 13
FAILURE OF LIFTING MACHINERY (DO1) 2001/02 - 2011/12.
Fig. 13 FAILURE OF LIFTING MACHINERY etc.
0
10
20
30
40
50
60
70
80
90
2001/02
2002/03
2003/04
2004/05
2005/06
2006/07
2007/08
2008/09
2009/10
2010/11
2011/12
Nu
mb
er o
f In
cid
ents
40

Figure 14
COLLISION/POSSIBLE COLLISION OFFSHORE (DO78/79)
2001/02 - 2011/12.
Fig. 14 COLLISION/POSSIBLE COLLISION OFFSHORE
0
2
4
6
8
10
12
14
16
Nu
mb
er
of
Inc
ide
nts
Possible collision offshore. 5 6 0 1 1 4 1 1 0 0 0
Collision 7 8 6 3 3 6 12 9 5 4 5
2001/02 2002/03 2003/04 2004/05 2005/06 2006/07 2007/08 2008/09 2009/10 2010/11 2011/12
41

Figure 15
INSTALLATION STABILITY (DO 80/81) 2001/02 - 2011/12.
Fig. 15 INSTALLATION STABILITY
0
1
2
3
4
Nu
mb
er
of
Inc
ide
nts
Loss of stability or buoyancy. 1 0 0 0 0 0 0 0 1 1 2
Subsidence or collapse of seabed. 0 0 0 0 0 0 0 1 1 0 1
2001/02 2002/03 2003/04 2004/05 2005/06 2006/07 2007/08 2008/09 2009/10 2010/11 2011/12
42

Fig. 16 EVACUATION OF AN INSTALLATION
0
1
2
3
4
5
6
7
8
9
2001
/02
2002
/03
2003
/04
2004
/05
2005
/06
2006
/07
2007
/08
2008
/09
2009
/10
2010
/11
2011
/12
Nu
mb
er o
f In
cid
ents
43
Figure 16
EVACUATION OF AN INSTALLATION (DO82) 2001/02 - 2011/12.
Annex 2 OIL AND GAS UK (OGUK) - KEY INDUSTRY PERFORMANCE INDICATORS The following information has been produced by OGUK for inclusion in this annual statistics report. Queries relating to the information contained below should be directed to OGUK. The UK offshore oil and gas industry has a voluntary asset integrity KPI scheme in place and data have been collected since 2008. The scheme is administered by Oil & Gas UK and collates data from 21 duty holders covering over 200 installations. Forums to discuss the KPI trends and to promote the development of KPIs are also conducted on a quarterly basis. The three current cross industry asset integrity related KPIs are:
KPI-1: Hydrocarbon Releases; KPI-2: Verification Non-Compliance; KPI-3: Safety-Critical Maintenance Backlog.
KPI-1 is clearly a lagging indicator and is also monitored by HSE through RIDDOR incident reporting mechanisms. KPI-2 and KPI-3 serve as leading indicators looking at performance relating to safety-critical elements. They enable the industry to monitor and measure a key aspect of its overall effort and performance in relation to asset integrity management.
1. KPI-2 Verification Non-Compliance
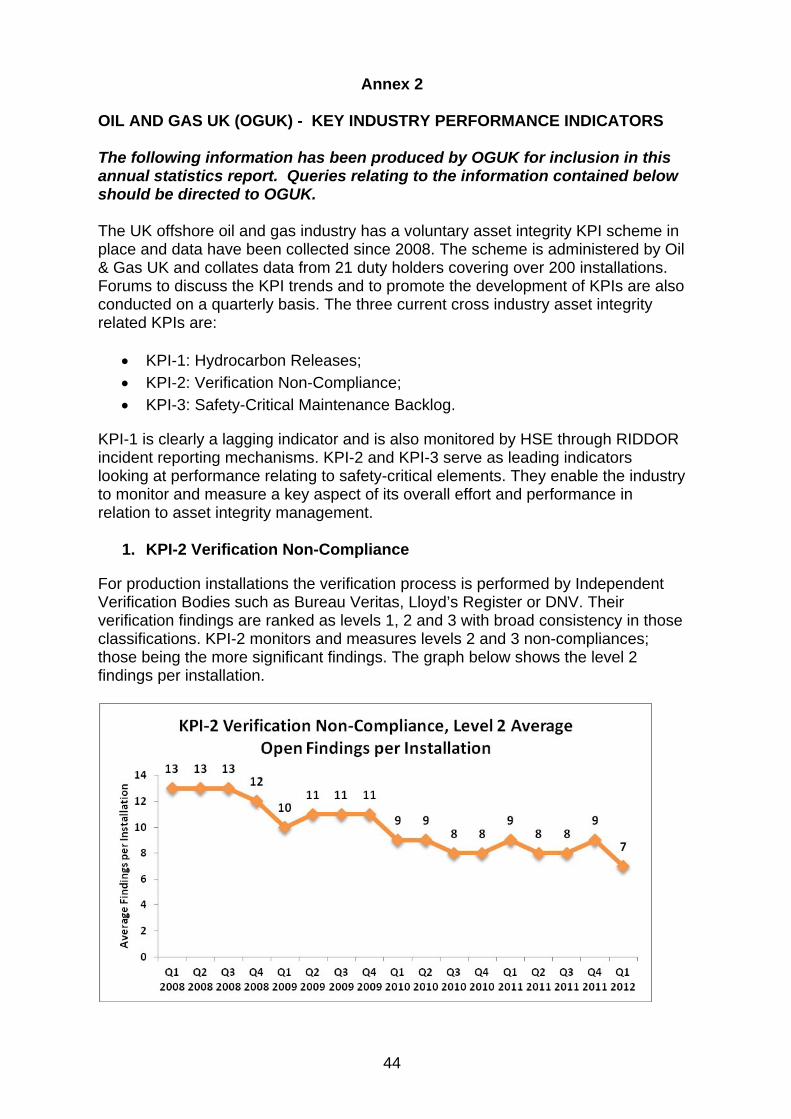
For production installations the verification process is performed by Independent Verification Bodies such as Bureau Veritas, Lloyd’s Register or DNV. Their verification findings are ranked as levels 1, 2 and 3 with broad consistency in those classifications. KPI-2 monitors and measures levels 2 and 3 non-compliances; those being the more significant findings. The graph below shows the level 2 findings per installation.
44

Figure 1. KPI-2: Average level 2 findings per installation (2008 – Q1 2012) Average Level 2 findings have decreased by 46% in the period, improving from 13 to 7 open findings per installation. Sustained effort is applied to further improve this performance and to progress from the evident plateau shown in the graph.
Figure 2. KPI-2: Verification Non-Compliance: level 3 industry total findings (2008 – Q1 2012). The level 3 findings represent relatively more serious matters of concern identified by the Independent Competent Person. As might be expected, the average level 3 findings per installation are very small so the total number of level 3 across all contributing installations is monitored. Over the period, the industry has consistently reduced the number of level 3 findings from 35 to 7 (80% improvement). As is the case for level 2 non-compliances, the industry continues to focus effort and attention on this critical area of performance and strives to further drive down the number of level 3 non-compliances.
2. KPI-3 Safety Critical Maintenance Backlog
45

46
Figure 3. KPI-3: Safety Critical Maintenance Backlog (2008 – Q1 2012). KPI-3 produces a report of the total number of backlog man-hours per installation of planned safety-critical maintenance that is beyond its completion date. This excludes backlog maintenance that has been subject to a formal and robust deferral process involving relevant technical or engineering authorities. This data collection also covers 21 duty holders and over 200 installations. As can be seen in Figure 3, the data shows a seasonal (cyclic) nature probably reflecting campaign maintenance patterns (e.g. planned major maintenance shutdowns). Nonetheless the data set shows a slight overall improvement over the past three years.