offshore cost of energy: forecasts based on the … of next generation drive trains improvements in...
TRANSCRIPT

Offshore cost of energy: Forecasts based on the European Story so far…
NREL 3rd WESE Workshop Boulder Bruce Valpy 14 January 2015
© BVG Associates 2015

• Cost of Energy calculation • EU CAPEX trend to date • Reported • Modelled • Differences • Causes
• EU LCOE trend to date • Future • The Crown Estate study and beyond • System engineering opportunities
Contents
Agenda
Selected clients
BVG Associates • Market and supply chain
• Analysis and forecasting • Strategic advice • Business and supply chain development
• Technology • Engineering services • Due diligence • Strategy and R&D support
• Economics • Socioeconomics and local benefits • Technology and project economic modelling • Policy and local content assessment
2/12 © BVG Associates 2015

Cost of energy Basics
LCOE breakdown – for specific US site; FID in 2020 LCOE
© BVG Associates 2015 3/12
Where: LCOE Levelised cost of energy in £/MWh = revenue needed (from whatever source) to obtain rate of
return W on investment over life of the wind farm (tax, inflation etc. not modelled)
Ci Capital expenditure in £ in year i Oi Operational expenditure in £ in year i Di Decommissioning expenditure in £ in year i Et Energy production in MWh in year i W Weighted average cost of capital in % (real) = (cost of debt x % dept ) + (return on equity x equity portion) n Operating lifetime of wind farm (baseline 20 years) m Years before start of operation when expenditure first
incurred i i year of lifetime (-m, ..., 1, 2, …n)
Project development and permitting up to FID
1% Project management and contingencies from FID
to WCD2%
Nacelle20%
Rotor15%
Tower5%
Foundation supply11%
Array cables2%
Foundationinstallation
5%Array cableinstallation
2%
Turbineinstallation
1%
Transmissioncharges
20%
Unplannedservice
8%
Operation and planned maintenance
5%Other
4%
Decommissioning1%
CAPEX64%
Balance of plant supply
13%
Operation, maintenance and service
35%
Turbinesupply39%
Installation8%
Project4%
Project development and permitting up to FID
1% Project management and contingencies from FID
to WCD1%
Nacelle12%
Rotor9%
Tower3%
Foundation supply7%
Array cables1%
Foundationinstallation
3%
Array cableinstallation
1%Turbine
installation1%
Transmissioncharges
12%Unplannedservice
4%
Operation and planned maintenance
3%
Other2%
Decommissioning0%
Capital41%
CAPEX38%
Balance of plant supply
8%Operation, maintenance and service
21%
Turbinesupply23%
Installation5%
Project2%

0
20
40
60
80
100
2002 2004 2006 2008 2010 2012 2014 2016 2018
Dis
tanc
e to
O&
M p
ort (
km)
0
5
10
15
20
25
30
35
2000 2002 2004 2006 2008 2010 2012 2014 2016 2018
Ave
rage
wat
er d
epth
(m)
8
8.5
9
9.5
10
10.5
2000 2002 2004 2006 2008 2010 2012 2014 2016 2018
Ave
rage
win
d sp
eed
(m/s
)
0
1
2
3
4
5
6
7
2000 2002 2004 2006 2008 2010 2012 2014 2016 2018
Turb
ine
ratin
g (M
W)
EU Sites 33 projects across Northern Europe
Significant variation, but upward trends in difficulty and turbine size
© BVG Associates 2015 4/12

• Used in-house spatial, multi-variable module-based LCOE model • Assumed 2011 technology, costs and 4MW turbines (selectable) • Difference with reported should remove effect of site conditions • Average matches to 2% • Period of widest variation in CAPEX matches • Gradient quite different
CAPEX 33 projects across Northern Europe
Average calculated CAPEX Average reported CAPEX
© BVG Associates 2015 5/12
• Little logic in trends between bubbles – wide scatter • Sensitivity about the use of bubbles - confidentiality • Averaged over 5 years • Derived a smoothed ±1SD range • Slope due to changes in site conditions and other effects • Not sure reached point of inflection

00.2
0.40.6
0.81
1.21.4
1.61.82
20052010
2015
€/£
0
1
2
3
4
2007 2008 2009 2010 2011 2012 2013 2014
Ave
rage
repo
rted
CA
PEX
(£m
/MW
)
• Change in site conditions only explains about 25% of change in CAPEX
• Still £1.4m/MW gap
CAPEX Much steeper increase in CAPEX than modelled
Much steeper increase in CAPEX than modelled
© BVG Associates 2015 6/12
6 main causes of the £1.4m/MW gap?
£1.9
m/M
W
£0.5
m/M
W
£1.4
m/M
W
0
0.2
0.4
0.6
0.8
1
1.2
1.4
Steel price
Cost of capital (SC)
Prof iteering / risk
Underpricing
Inf lation
Exchange rate

0
0.2
0.4
0.6
0.8
1
1.2
1.4
1.6
2000 2002 2004 2006 2008 2010 2012 2014 2016
Nor
mal
ised
LC
OE
Cost of Energy Raw trend could have levelled off
Normalised LCOE for 33 projects • Combines reported CAPEX with modelled OPEX and AEP • All in 2011 terms; constant WACC
© BVG Associates 2015 7/12
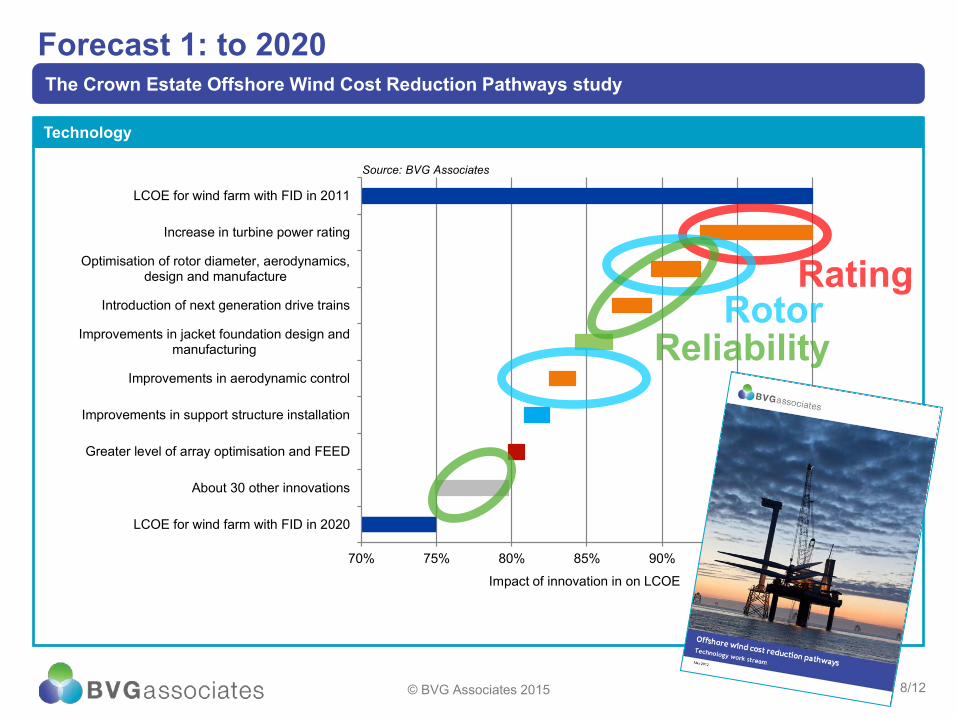
Forecast 1: to 2020 The Crown Estate Offshore Wind Cost Reduction Pathways study
Technology
70% 75% 80% 85% 90% 95% 100%
LCOE for wind farm with FID in 2011
Increase in turbine power rating
Optimisation of rotor diameter, aerodynamics,design and manufacture
Introduction of next generation drive trains
Improvements in jacket foundation design andmanufacturing
Improvements in aerodynamic control
Improvements in support structure installation
Greater level of array optimisation and FEED
About 30 other innovations
LCOE for wind farm with FID in 2020
Impact of innovation in on LCOE
Source: BVG Associates
© BVG Associates 2015 8/12

Technical potential impact for given Site Type, turbine size and year
Anticipated technical impact for given Site Type, turbine size and year
Maximum technical potential impact of innovation under best circumstances
Technical potential impact for a given Site Type and turbine size Relevance to turbine size &
site type
Commercial readiness
Market share
• Models changes in risk, with resulting impact on financing cost • Numerous other stated assumptions, agreed with industry
Methodology Robust cost model and industry-supported baselines
Cost Model Wind turbines
Wind farm sites
Impact of innovations
Baselines
© BVG Associates 2015 9/12

Forecast 2: to 2025 KIC InnoEnergy Future Renewable Energy Costs: Offshore Wind (June 2014)
Technology
© BVG Associates 2014 10/12

011Project Turbine Balance of plant Installation Wind Farm Transmission Energy production Cost of capital
137
109
84
-28
-25
0
20
40
60
80
100
120
140
160
LCO
E (£
MW
h)
-28
-25
0
20
40
60
80
100
120
140
160
LCO
E (£
MW
h)
Forecast 3: to 2030 The Committee on Climate Change (May 2015)
Technology, supply chain and policy drivers
© BVG Associates 2015 11/12
Market scale, visibility and confidence
Confidence in future levels of own supply
Public funded RD&D and skills development
De-risked investment in projects
A well-structured supply chain
A cost-efficient support mechanism
Availability of lower cost of energy sites
Strategic transmission planning

Future System engineering approach
© BVG Associates 2015 12/12
Turbine rating, rotor diameter and drive train (concept)
Turbine reliability and OPEX (component level)
Aerodynamics and control inc. inflow measurement
Turbine float-out installation methods
Standardisation of interfaces
Multi-variable wind farm layout design
Plus: • Operations management with advanced
weather forecasting • Holistic tower and foundation design • FEED geophysical geotechnical studies • …
Systems engineering opportunities with largest remaining potential LCOE impact (to 2030)
6%
6%
6%
4%
2%
2%

Thank you
BVG Associates Ltd. The Blackthorn Centre Purton Road Cricklade, Swindon SN6 6HY England, UK tel +44 1793 752 308 [email protected] @bvgassociates www.bvgassociates.co.uk
The Boathouse Silversands Aberdour, Fife KY3 0TZ Scotland, UK tel +44 1383 870 014
This presentation and its content is copyright of BVG Associates Limited - © BVG Associates 2015. All rights are reserved.
You may not, except with our express written permission, commercially exploit the content.
4444 Second Avenue Detroit, MI 48201 USA tel +1 206 459 8506
Charlie Nordstrom US [email protected]
Bruce Valpy UK [email protected]