office of waste reduction and recycling
TRANSCRIPT

The University of North Carolina at Chapel Hill
Office of Waste Reduction and Recycling
2013-2014 Fiscal Year Recycling Trend Report
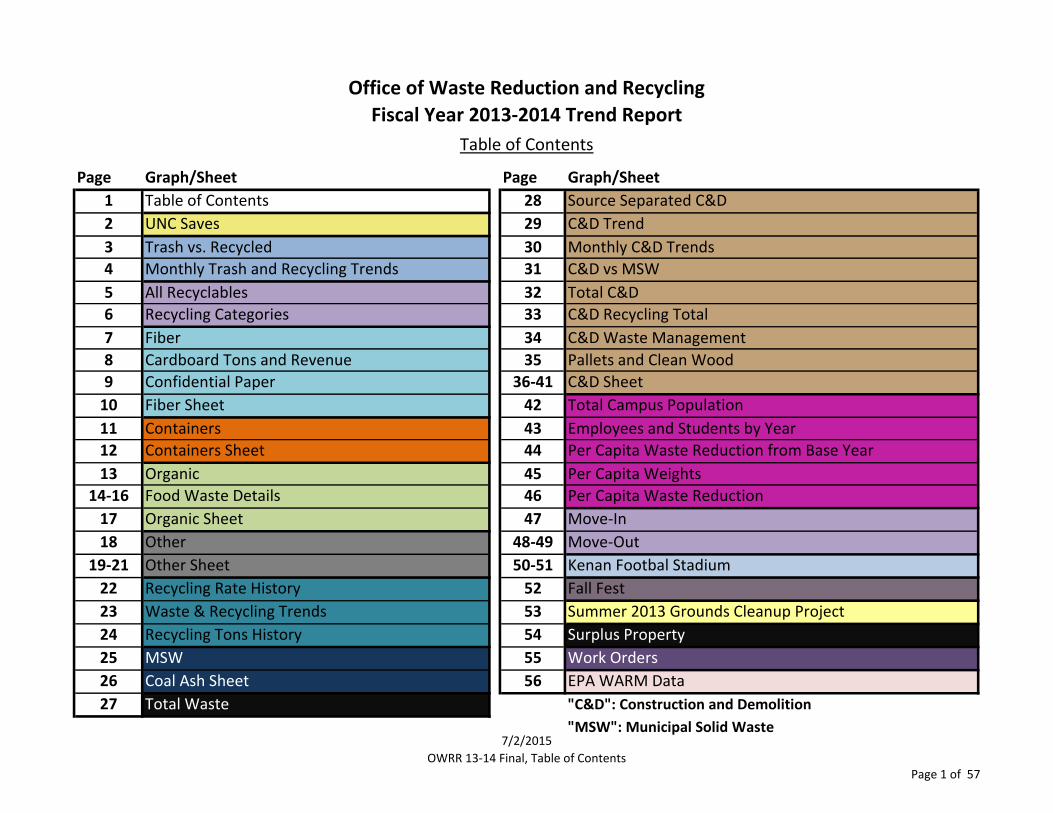
Page Graph/Sheet Page Graph/Sheet
1 Table of Contents 28 Source Separated C&D
2 UNC Saves 29 C&D Trend
3 Trash vs. Recycled 30 Monthly C&D Trends
4 Monthly Trash and Recycling Trends 31 C&D vs MSW
5 All Recyclables 32 Total C&D
6 Recycling Categories 33 C&D Recycling Total
7 Fiber 34 C&D Waste Management
8 Cardboard Tons and Revenue 35 Pallets and Clean Wood
9 Confidential Paper 36-41 C&D Sheet
10 Fiber Sheet 42 Total Campus Population
11 Containers 43 Employees and Students by Year
12 Containers Sheet 44 Per Capita Waste Reduction from Base Year
13 Organic 45 Per Capita Weights
14-16 Food Waste Details 46 Per Capita Waste Reduction
17 Organic Sheet 47 Move-In
18 Other 48-49 Move-Out
19-21 Other Sheet 50-51 Kenan Footbal Stadium
22 Recycling Rate History 52 Fall Fest
23 Waste & Recycling Trends 53 Summer 2013 Grounds Cleanup Project
24 Recycling Tons History 54 Surplus Property
25 MSW 55 Work Orders
26 Coal Ash Sheet 56 EPA WARM Data
27 Total Waste "C&D": Construction and Demolition
"MSW": Municipal Solid Waste
Table of Contents
Fiscal Year 2013-2014 Trend Report
Office of Waste Reduction and Recycling
7/2/2015
OWRR 13-14 Final, Table of ContentsPage 1 of 57
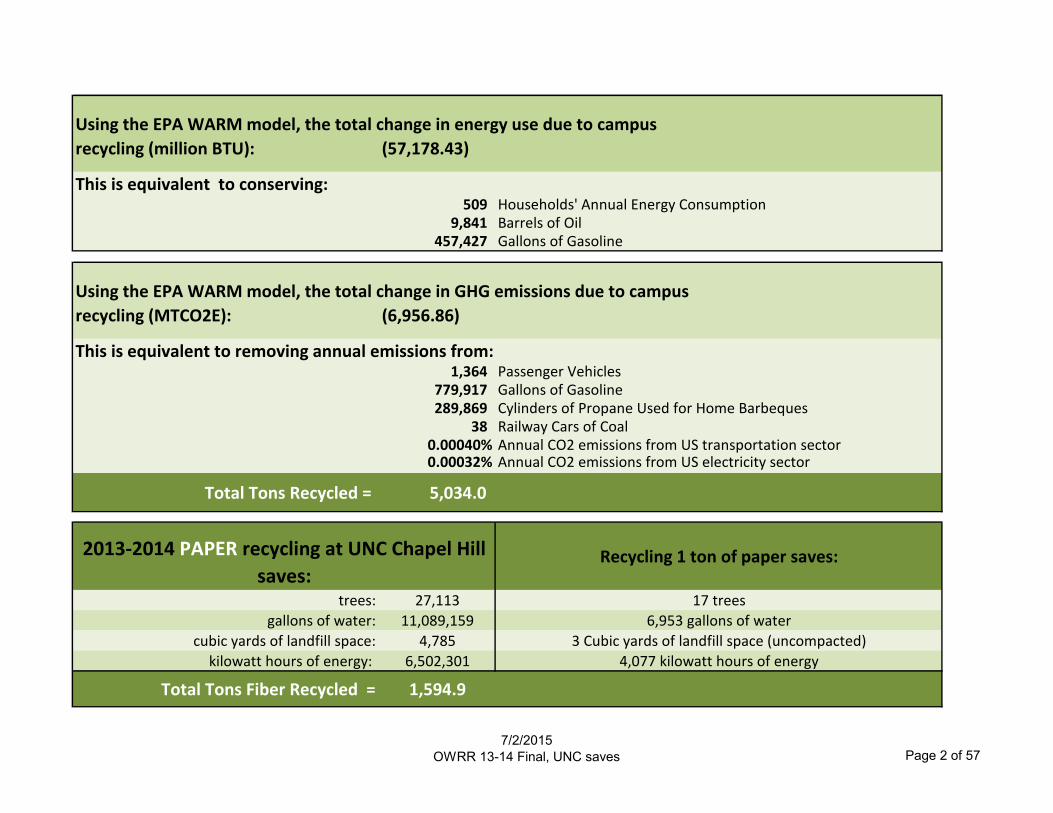
Using the EPA WARM model, the total change in energy use due to campus
recycling (million BTU): (57,178.43)
This is equivalent to conserving:509 Households' Annual Energy Consumption
9,841 Barrels of Oil457,427 Gallons of Gasoline
Using the EPA WARM model, the total change in GHG emissions due to campus
recycling (MTCO2E): (6,956.86)
This is equivalent to removing annual emissions from:1,364 Passenger Vehicles
779,917 Gallons of Gasoline289,869 Cylinders of Propane Used for Home Barbeques
38 Railway Cars of Coal0.00040% Annual CO2 emissions from US transportation sector0.00032% Annual CO2 emissions from US electricity sector
Total Tons Recycled = 5,034.0
2013-2014 PAPER recycling at UNC Chapel Hill
saves:Recycling 1 ton of paper saves:
trees: 27,113 17 trees
gallons of water: 11,089,159 6,953 gallons of water
cubic yards of landfill space: 4,785 3 Cubic yards of landfill space (uncompacted)
kilowatt hours of energy: 6,502,301 4,077 kilowatt hours of energy
Total Tons Fiber Recycled = 1,594.9
7/2/2015
OWRR 13-14 Final, UNC saves Page 2 of 57

7/2/2015
OWRR 13-14 Final, Trash vs. Recycled 3 of 57
Trash, 5,788.88, 53%
Recycled, 5,033.97, 47%
Amount Landfilled and Recycled 2013-2014 (tons)
(Does Not Include Coal Ash)
Fiscal Year 2013-2014
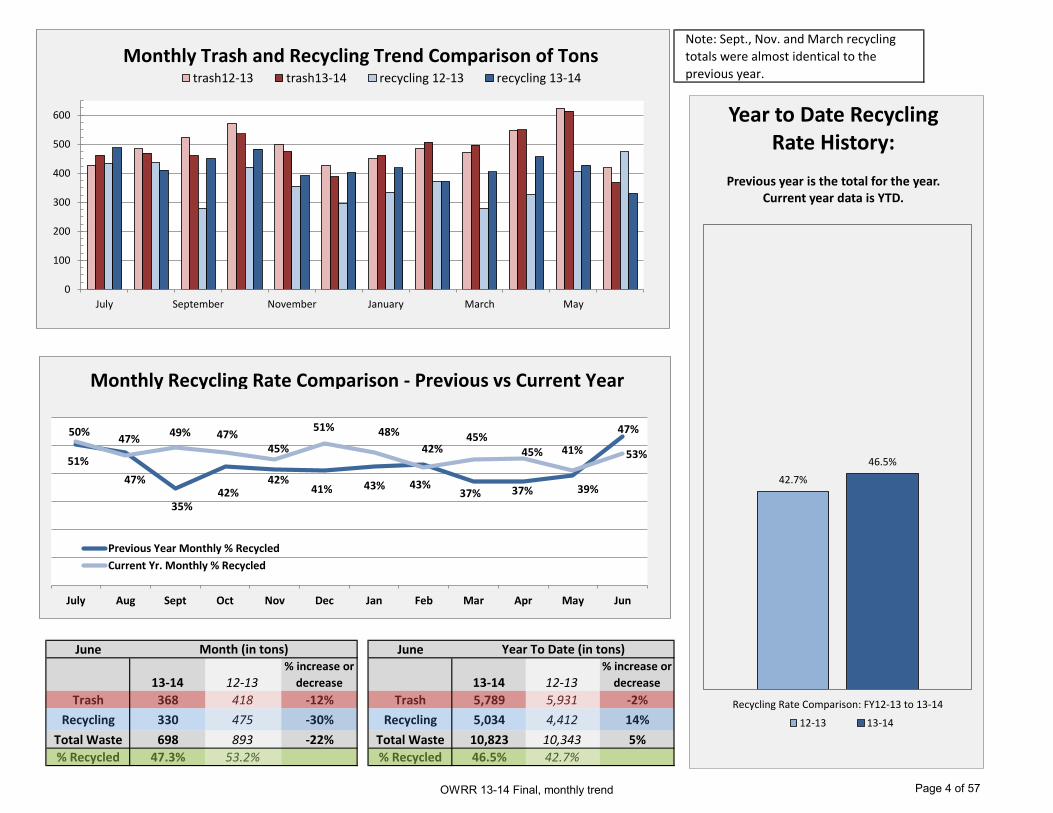
Note: Sept., Nov. and March recycling
totals were almost identical to the
previous year.
June June
13-14 12-13% increase or
decrease 13-14 12-13% increase or
decrease
Trash 368 418 -12% Trash 5,789 5,931 -2%
Recycling 330 475 -30% Recycling 5,034 4,412 14%
Total Waste 698 893 -22% Total Waste 10,823 10,343 5%
% Recycled 47.3% 53.2% % Recycled 46.5% 42.7%
Year To Date (in tons)Month (in tons)
0
100
200
300
400
500
600
July September November January March May
trash12-13 trash13-14 recycling 12-13 recycling 13-14
Monthly Trash and Recycling Trend Comparison of Tons
42.7%
46.5%
Recycling Rate Comparison: FY12-13 to 13-14
Year to Date Recycling Rate History:
Previous year is the total for the year.
Current year data is YTD.
12-13 13-14
50% 47%
35% 42%
42% 41% 43% 43%
37% 37% 39%
53% 51%
47%
49% 47% 45%
51% 48%
42% 45%
45% 41%
47%
July Aug Sept Oct Nov Dec Jan Feb Mar Apr May Jun
Previous Year Monthly % Recycled
Current Yr. Monthly % Recycled
Monthly Recycling Rate Comparison - Previous vs Current Year
OWRR 13-14 Final, monthly trend Page 4 of 57

7/2/2015
OWRR 13-14 Final, All Recyclables 5 of 57
Corrugated Cardboard, 656.2, 13%
Contracted Confidential Paper, 189.3, 5%
OWRR Confidential Paper
22.6, 1%
Mixed Paper, 340.5, 12% Hardback
Books, 48.1, 1%
Indoor ORS, 46.3, 1%
Indoor OWRR, 6.2, 0%
Kenan Stadium 7.2, 0%
Containers: Outdoors, 162.3, 3% Cooking Grease
17.1, 0%
Food Waste, 648.9, 13%
Yard Waste, 1,899.2, 38%
Batteries, 2.1, 0%
Polystyrene, 0.2, 0% Tires, 9.3, 0%
E-Waste, 137.5, 3%
Mattresses, 0.4, 0% Plastic Film, 0.4, 0% Printer Cartridges, 16.8 0%
Auto Oil 5.4, 0%
Auto Oil Filters 1.6, 0%
Auto Coolant , 0.2, 0% Bulk Solvent, 27.6, 1%
Fluorescent Bulbs, 7.6, 0%
Pallets/Clean Wood, 79.0, 2%
Scrap Metal 177.0, 5%
Concrete 34.0, 1%
Recycled C&D, 1.1, 0%
2013-2014
Recyclables
by Ton and Percent of Total
NOTE: In July 2013, a project at Carolina North was responsible for 45 tons of stumps (yard waste ).
Containers:
Other:
7/2/2015
OWRR 13-14 Final, Recycling Categories Page 6 of 57
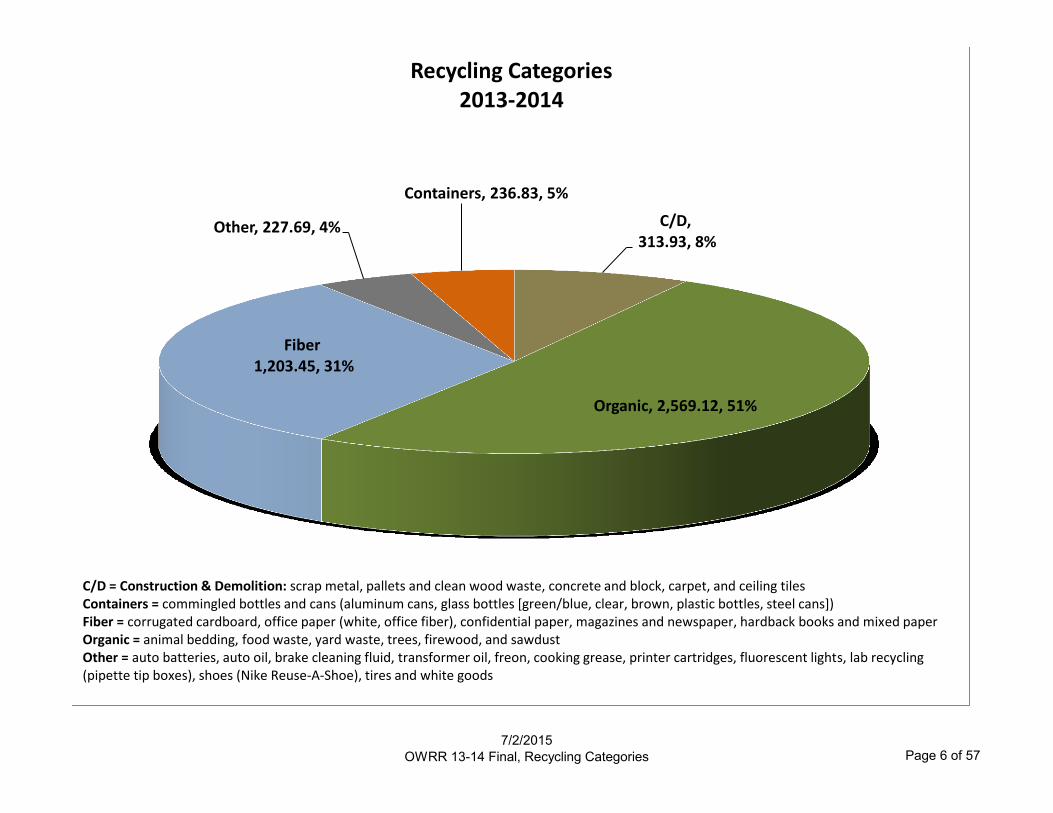
C/D, 313.93, 8%
Organic, 2,569.12, 51%
Fiber 1,203.45, 31%
Other, 227.69, 4%
Containers, 236.83, 5%
Recycling Categories 2013-2014
C/D = Construction & Demolition: scrap metal, pallets and clean wood waste, concrete and block, carpet, and ceiling tiles Containers = commingled bottles and cans (aluminum cans, glass bottles [green/blue, clear, brown, plastic bottles, steel cans]) Fiber = corrugated cardboard, office paper (white, office fiber), confidential paper, magazines and newspaper, hardback books and mixed paper Organic = animal bedding, food waste, yard waste, trees, firewood, and sawdust Other = auto batteries, auto oil, brake cleaning fluid, transformer oil, freon, cooking grease, printer cartridges, fluorescent lights, lab recycling (pipette tip boxes), shoes (Nike Reuse-A-Shoe), tires and white goods

7/2/2015
OWRR 13-14 Final, Fiber Page 7 of 57
Corrugated Cardboard, 656.17, 41%
News, Mags, Mixed Paper, 585.00, 37%
Hardback Books, 48.13, 4%
Contracted Confidential Paper, 257.25, 16%
OWRR Confidential Paper, 38.77, 2%
Fiber 2013-2014
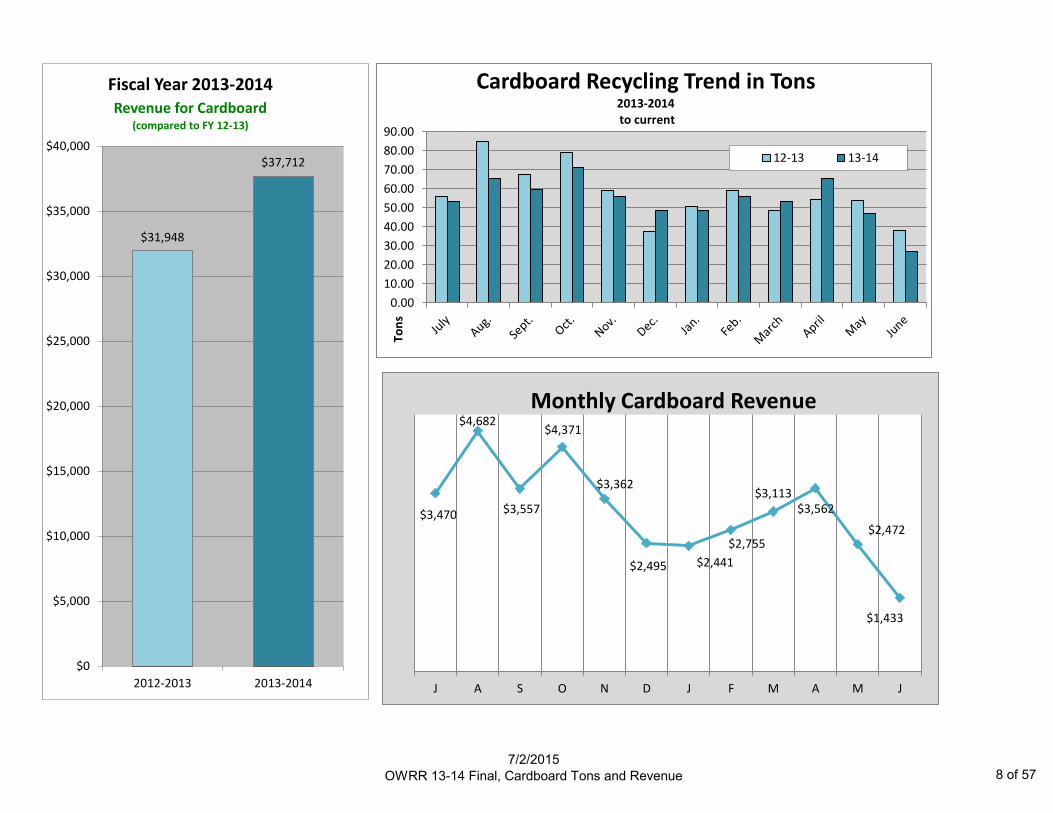
$31,948
$37,712
$0
$5,000
$10,000
$15,000
$20,000
$25,000
$30,000
$35,000
$40,000
2012-2013 2013-2014
Fiscal Year 2013-2014 Revenue for Cardboard
(compared to FY 12-13)
$3,470
$4,682
$3,557
$4,371
$3,362
$2,495 $2,441
$2,755
$3,113 $3,562
$2,472
$1,433
J A S O N D J F M A M J
Monthly Cardboard Revenue
0.00
10.00
20.00
30.00
40.00
50.00
60.00
70.00
80.00
90.00
Ton
s
Cardboard Recycling Trend in Tons 2013-2014 to current
12-13 13-14
7/2/2015
OWRR 13-14 Final, Cardboard Tons and Revenue 8 of 57

7/2/2015
OWRR 13-14 Final, Confidential Paper Page 9 of 57
292.6
204.2
241.2 252.9 257.3
65.6
48.7
28.8 37.1 38.8
0
50
100
150
200
250
300
350
FY09-10 FY10-11 FY11-12 FY12-13 FY13-14
Via Hospital Contract UNC OWRR
ton
s Confidential Paper Trends
Contractor Collected vs. UNC OWRR Collected (in tons)

FISCAL YEAR 2013-2014 RECYCLING TREND REPORT
FIBER
CORRUGATED CARDBOARDCORRUGATED CARDBOARD Jul-13 Aug-13 Sep-13 Oct-13 Nov-13 Dec-13 Jan-14 Feb-14 Mar-14 Apr-14 May-14 Jun-14
Month Tons 57.83 65.31 59.74 71.09 56.03 48.65 48.81 55.78 53.45 65.32 46.86 27.30Y-T-D Tons 57.83 123.14 182.88 253.97 310.00 358.65 407.46 463.24 516.69 582.01 628.87 656.17
Last Year Monthly Tons 56.16 84.93 67.69 79.29 58.99 37.80 50.94 59.40 48.77 54.40 53.67 38.07% Incr./Decr. Monthly 3% -23% -12% -10% -5% 29% -4% -6% 10% 20% -13% -28%
NEWSPAPERS, MAGAZINES AND MIXED PAPER MIXED PAPER Jul-13 Aug-13 Sep-13 Oct-13 Nov-13 Dec-13 Jan-14 Feb-14 Mar-14 Apr-14 May-14 Jun-14
Indoor Sites (Contractor-hauled) 41.50 43.28 31.92 30.63 28.84 27.05 33.41 24.70 30.07 33.91 37.58 35.10Indoor Sites (OWRR-hauled) 3.88 2.43 3.50 12.28 4.53 3.20 7.05 6.86 4.15 4.87 7.82 4.79
Outdoor Sites 8.62 6.90 9.81 11.03 11.77 8.34 10.53 11.08 9.36 12.64 15.30 6.27
Month Tons 54.00 52.61 45.23 53.94 45.14 38.59 50.99 42.64 43.58 51.42 60.70 46.16Y-T-D Tons 54.00 106.61 151.84 205.78 250.92 289.51 340.50 383.14 426.72 478.14 538.84 585.00
Last Year Monthly Tons 62.00 60.09 43.91 47.89 50.65 32.21 57.27 52.75 40.46 45.40 51.27 53.67% Incr./Decr. Monthly -13% -12% 3% 13% -11% 20% -11% -19% 8% 13% 18% -14%
OFFICE PAPERCONFIDENTIAL PAPER Jul-13 Aug-13 Sep-13 Oct-13 Nov-13 Dec-13 Jan-14 Feb-14 Mar-14 Apr-14 May-14 Jun-14
CP-OWRR Collected 19.28 0.00 0.00 0.00 0.00 0.00 0.00 0.00 0.00 19.49 0.00 0.00CP - Contractor Collected 24.18 19.59 20.19 25.23 17.83 20.05 23.50 19.38 19.38 36.37 21.18 10.37
Month Tons 43.46 19.59 20.19 25.23 17.83 20.05 23.50 19.38 19.38 55.86 21.18 10.37Y-T-D Tons 43.46 63.05 83.24 108.47 126.30 146.35 169.85 189.23 208.61 264.47 285.65 296.02
Last Year Monthly Tons 34.66 22.46 19.48 35.87 26.26 20.42 23.15 23.47 19.33 20.13 23.80 21.00% Incr./Decr. Monthly 25% -13% 4% -30% -32% -2% 1% -17% 0% 178% -11% -51%
HARDBACK BOOKS Jul-13 Aug-13 Sep-13 Oct-13 Nov-13 Dec-13 Jan-14 Feb-14 Mar-14 Apr-14 May-14 Jun-14Month Tons 3.93 0.48 9.51 2.80 8.08 6.36 6.13 6.35 4.49 2.09 3.52 3.95Y-T-D Tons 3.93 4.41 13.92 16.72 24.80 31.16 37.29 43.64 48.13 50.22 53.74 57.69
Last Year Monthly Tons 5.30 2.66 2.38 3.76 2.11 1.74 1.44 1.20 3.23 3.27 4.68 4.92% Incr./Decr. Monthly -26% -82% 300% -26% 283% 266% 326% 429% 39% -36% -25% -20%
OFFICE FIBER TOTAL TONS Jul-13 Aug-13 Sep-13 Oct-13 Nov-13 Dec-13 Jan-14 Feb-14 Mar-14 Apr-14 May-14 Jun-14Month Tons 47.39 20.07 29.70 28.03 25.91 26.41 29.63 25.73 23.87 57.95 24.70 14.32Y-T-D Tons 47.39 67.46 97.16 125.19 151.10 177.51 207.14 232.87 256.74 314.69 339.39 353.71
Last Year Monthly Tons 39.96 25.12 21.86 39.63 28.37 22.16 24.59 24.67 22.56 23.40 28.48 25.92% Incr./Decr. Monthly 19% -20% 36% -29% -9% 19% 20% 4% 6% 148% -13% -45%
TOTAL FIBER TONSTOTAL FIBER Jul-13 Aug-13 Sep-13 Oct-13 Nov-13 Dec-13 Jan-14 Feb-14 Mar-14 Apr-14 May-14 Jun-14Month Tons 159.21 137.99 134.67 153.06 127.08 113.65 129.43 124.15 120.90 174.69 132.26 87.78Y-T-D Tons 159.21 297.20 431.87 584.93 712.01 825.66 955.09 1,079.24 1,200.14 1,374.83 1,507.09 1,594.87
Last Year Monthly Tons 158.12 170.14 133.46 166.81 138.01 92.17 132.80 136.82 111.79 123.20 133.42 117.66% Incr./Decr. Monthly 1% -19% 1% -8% -8% 23% -3% -9% 8% 42% -1% -25%
7/2/2015
OWRR 13-14 Final, Fiber Sheet Page 10 of 57

7/2/2015
OWRR 13-14 Final, Containers Page 11 of 57
Indoor ORS, 51.80, 26% Indoor OWRR,
4.61, 2%
Outdoor, 162.33, 68%
Kenan Stadium, 7.23, 3%
Containers* 2013-2014
*Containers = commingled bottles and cans (aluminum cans, glass bottles [green/blue, clear, brown, plastic bottles, steel cans])
Note: "Indoor " and "Outdoor " refers to where materials are collected. Our Indoor program is inside all buildings on campus. Our Outdoor program is outside all residence halls, buildings with high volumes or catering kitchens, etc. Outdoor numbers include materials collected from the "walkway sites". Materials collected from home football games are recorded under the "Kenan Stadium" heading. Bottles and cans from buildings serviced by OWRR are taken to the outdoor sites. Thus these statistics aren't a true representation of amounts collected from each area.

COMMINGLED Jul-13 Aug-13 Sep-13 Oct-13 Nov-13 Dec-13 Jan-14 Feb-14 Mar-14 Apr-14 May-14 Jun-14Indoor ORS 5.13 5.48 6.55 5.50 5.31 3.82 4.56 4.94 5.00 5.51 4.72 4.52
Indoor OWRR (Rolloff)* 0.00 0.00 0.00 0.00 1.41 0.45 0.50 0.51 0.80 0.94 0.61 1.01Outdoor** 11.64 9.67 14.92 16.24 16.09 11.62 12.27 14.23 12.46 17.22 17.87 8.10
Football Recycling*** 0.00 0.00 3.18 1.77 2.28 0.00 0.00 0.00 0.00 0.00 0.00 0.00
TOTAL CONTAINERS Jul-13 Aug-13 Sep-13 Oct-13 Nov-13 Dec-13 Jan-14 Feb-14 Mar-14 Apr-14 May-14 Jun-14Month Tons 16.77 15.15 24.65 23.51 25.09 15.89 17.33 19.68 18.26 23.67 23.20 13.63Y-T-D Tons 16.77 31.92 56.57 80.08 105.17 121.06 138.39 158.07 176.33 200.00 223.20 236.83
Last Year Monthly Tons 16.08 18.99 22.23 24.27 20.77 17.11 18.57 18.73 15.92 20.18 23.88 15.96% Incr./Decr. Monthly 4% -20% 11% -3% 21% -7% -7% 5% 15% 17% -3% -15%
*On November 7, 2013, we began taking commingled bottles, cans and plastics to Orange County's recycling processing area. They are mixed with County recyclables and sent to
Sonoco in Raleigh. Prior to that, commingled bottles and cans were put in outdoor carts.
** Outdoor statistics should show a slight decrease in November on, when we began putting commingled bottles and cans from the in-house indoor collection in a rolloff that is
delivered to Orange County instead of various outdoor cart sites.
***Football statistics are from Kenan Stadium. Tailgate recyclables are included in the outdoor statistics.
FISCAL YEAR 2013-2014 RECYCLING TREND REPORT
BOTTLES AND CANS
TOTAL BOTTLES AND CANS TONS
7/2/2015
OWRR 13-14 Final, Containers Sheet Page 12 of 57
7/2/2015
OWRR 13-14 Final, Organic Page 13 of 57
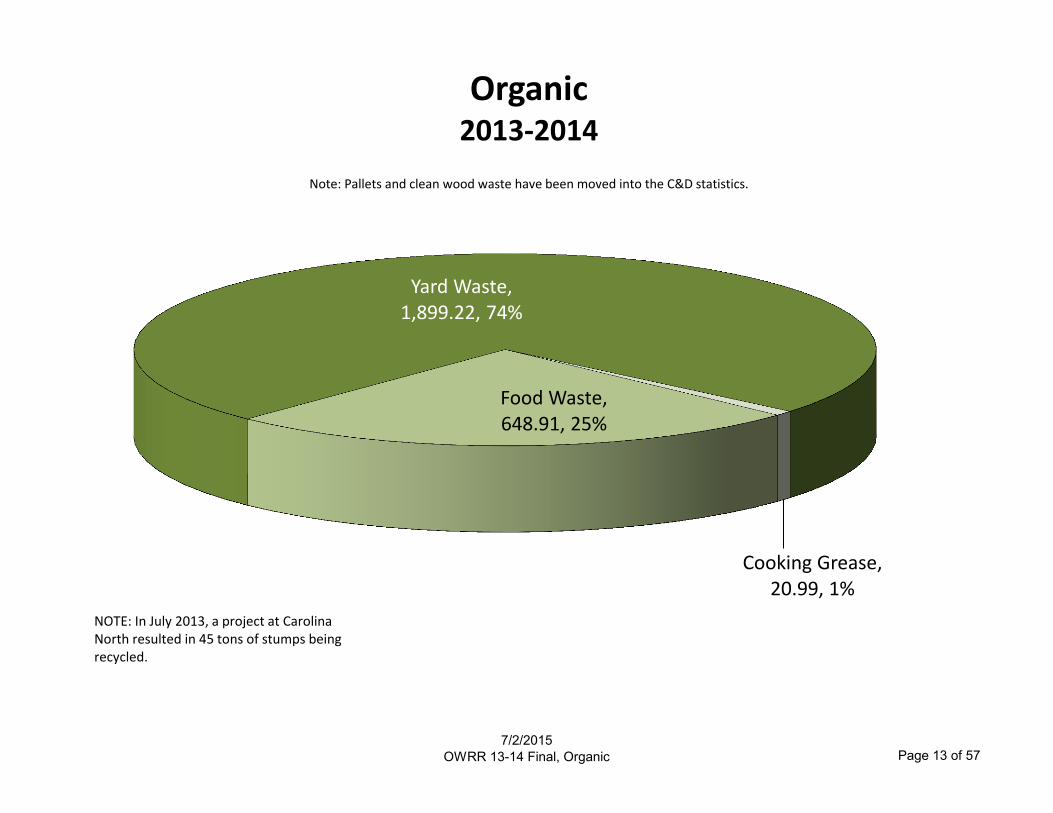
Cooking Grease, 20.99, 1%
Food Waste, 648.91, 25%
Yard Waste, 1,899.22, 74%
Organic 2013-2014
Note: Pallets and clean wood waste have been moved into the C&D statistics.
NOTE: In July 2013, a project at Carolina North resulted in 45 tons of stumps being recycled.

0
100
200
300
400
500
600
700
00
-01
01
-02
02
-03
03
-04
04
-05
05
-06
06
-07
07
-08
08
-09
09
-10
10
-11
11
-12
12
-13
13
-14
Total Food Waste Composted In Tons
0
50
100
150
200
250
300
350
400
450 LenoirRam's HeadFriday CenterThe BeachWendy'sBlue Zone
Annual Compostables by Location
0
5
10
15
20
25
30
35
40
Lenoir
Ram's Head
Lenoir vs. Rams Head Monthly Compost in Tons
0.0
0.5
1.0
1.5
2.0
2.5
3.0
3.5
4.0
4.5
Friday Center
The Beach
Wendy's
The Friday Center and The Beach Cafe Monthly Compost in Tons
7/2/2015
OWRR 13-14 Final, Food Waste Details Page 14 of 57
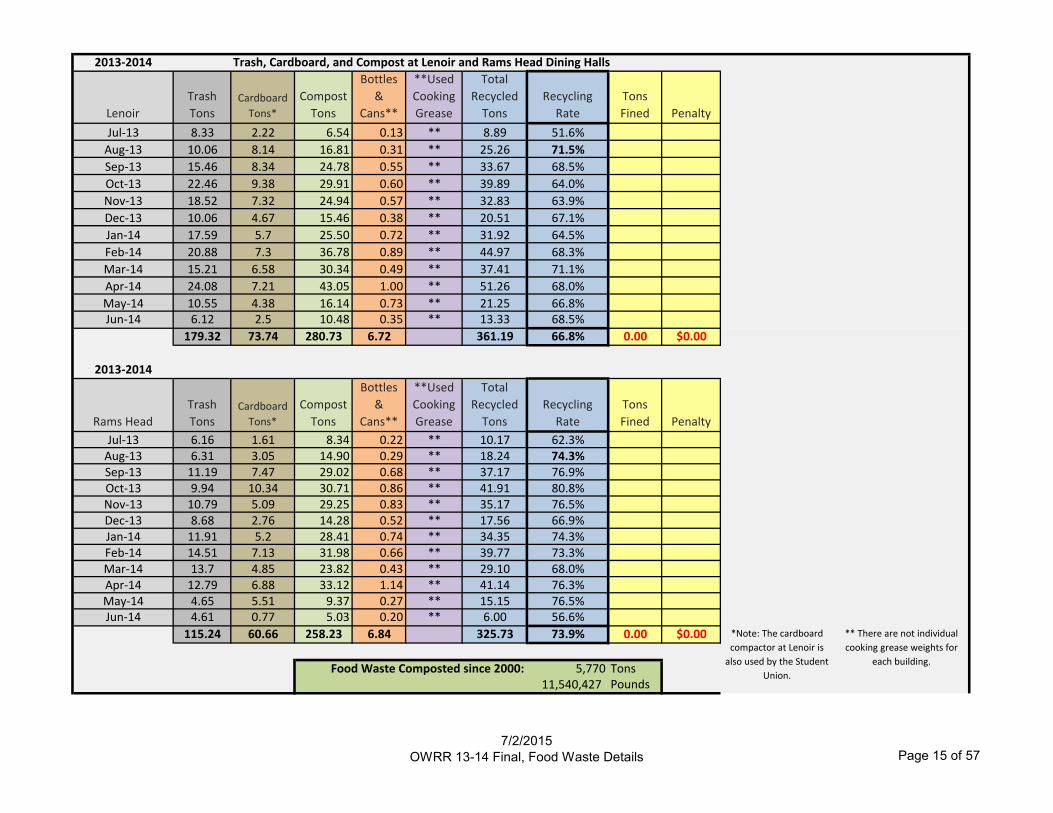
2013-2014 Trash, Cardboard, and Compost at Lenoir and Rams Head Dining Halls
Lenoir
Trash
TonsCardboard
Tons*
Compost
Tons
Bottles
&
Cans**
**Used
Cooking
Grease
Total
Recycled
Tons
Recycling
Rate
Tons
Fined Penalty
Jul-13 8.33 2.22 6.54 0.13 ** 8.89 51.6%
Aug-13 10.06 8.14 16.81 0.31 ** 25.26 71.5%
Sep-13 15.46 8.34 24.78 0.55 ** 33.67 68.5%
Oct-13 22.46 9.38 29.91 0.60 ** 39.89 64.0%
Nov-13 18.52 7.32 24.94 0.57 ** 32.83 63.9%
Dec-13 10.06 4.67 15.46 0.38 ** 20.51 67.1%
Jan-14 17.59 5.7 25.50 0.72 ** 31.92 64.5%
Feb-14 20.88 7.3 36.78 0.89 ** 44.97 68.3%
Mar-14 15.21 6.58 30.34 0.49 ** 37.41 71.1%
Apr-14 24.08 7.21 43.05 1.00 ** 51.26 68.0%
May-14 10.55 4.38 16.14 0.73 ** 21.25 66.8%Jun-14 6.12 2.5 10.48 0.35 ** 13.33 68.5%
179.32 73.74 280.73 6.72 361.19 66.8% 0.00 $0.00
2013-2014
Rams Head
Trash
TonsCardboard
Tons*
Compost
Tons
Bottles
&
Cans**
**Used
Cooking
Grease
Total
Recycled
Tons
Recycling
Rate
Tons
Fined Penalty
Jul-13 6.16 1.61 8.34 0.22 ** 10.17 62.3%Aug-13 6.31 3.05 14.90 0.29 ** 18.24 74.3%Sep-13 11.19 7.47 29.02 0.68 ** 37.17 76.9%Oct-13 9.94 10.34 30.71 0.86 ** 41.91 80.8%Nov-13 10.79 5.09 29.25 0.83 ** 35.17 76.5%Dec-13 8.68 2.76 14.28 0.52 ** 17.56 66.9%Jan-14 11.91 5.2 28.41 0.74 ** 34.35 74.3%Feb-14 14.51 7.13 31.98 0.66 ** 39.77 73.3%Mar-14 13.7 4.85 23.82 0.43 ** 29.10 68.0%Apr-14 12.79 6.88 33.12 1.14 ** 41.14 76.3%May-14 4.65 5.51 9.37 0.27 ** 15.15 76.5%Jun-14 4.61 0.77 5.03 0.20 ** 6.00 56.6%
115.24 60.66 258.23 6.84 325.73 73.9% 0.00 $0.00
Food Waste Composted since 2000: 5,770 TonsPounds
*Note: The cardboard
compactor at Lenoir is
also used by the Student
Union.
** There are not individual
cooking grease weights for
each building.
11,540,427
7/2/2015
OWRR 13-14 Final, Food Waste Details Page 15 of 57

2013-2014Food Waste Jul-13 Aug-13 Sep-13 Oct-13 Nov-13 Dec-13 Jan-14 Feb-14 Mar-14 Apr-14 May-14 Jun-14
(tons) 25.77 38.58 62.22 71.68 62.75 35.66 60.86 77.90 64.86 87.68 37.06 23.89 648.91
Lenoir 6.54 16.81 24.78 29.91 24.94 15.46 25.50 36.78 30.34 43.05 16.14 10.48 280.73
Friday Center 1.73 2.33 2.08 2.61 2.19 1.72 1.09 1.78 3.29 3.56 3.49 3.74 29.61
Ram's Head 8.34 14.90 29.02 30.71 29.25 14.28 28.41 31.98 23.82 33.12 9.37 5.03 258.23
The Beach 1.87 2.30 2.11 2.50 2.23 1.64 2.03 2.24 2.31 3.15 2.62 2.29 27.29
Wendy's 1.16 1.54 2.87 4.01 2.58 1.29 1.58 1.94 1.87 2.16 1.39 0.72 23.11
Blue Zone 0.00 0.00 0.23 0.65 0.53 0.27 0.13 2.24 2.31 0.00 2.62 0.00 8.98
Special Events* 0.00 0.08 0.00 0.00 0.00 0.00 0.72 0.14 0.12 0.22 0.23 0.14 1.65
Genome Building 0.00 0.62 1.13 1.29 1.03 1.00 1.40 0.80 0.80 2.42 1.20 1.49 13.18
The Tar Heel Café 0.0 0.0 0.0 0.0 0.0 0.0 0.0 0.0 0.0 0.0 0.0 0.0 0.0
The Athletic Table 0.0 0.0 0.0 0.0 0.0 0.0 0.0 0.0 0.0 0.0 0.0 0.0 0.0
Rizzo Center begain in Feb. 2008. It is not counted as University.
Carolina Inn added in October 2009. It is not counted as University.
Hospital began in 2008. Not counted as University.
*The Special Events site collects waste from the residence hall compost program and several pilot locations on campus such as the Botanical Gardens, School of
Government, Global Education Center, and individual events.
Year To
Date:
7/2/2015
OWRR 13-14 Final, Food Waste Details Page 16 of 57
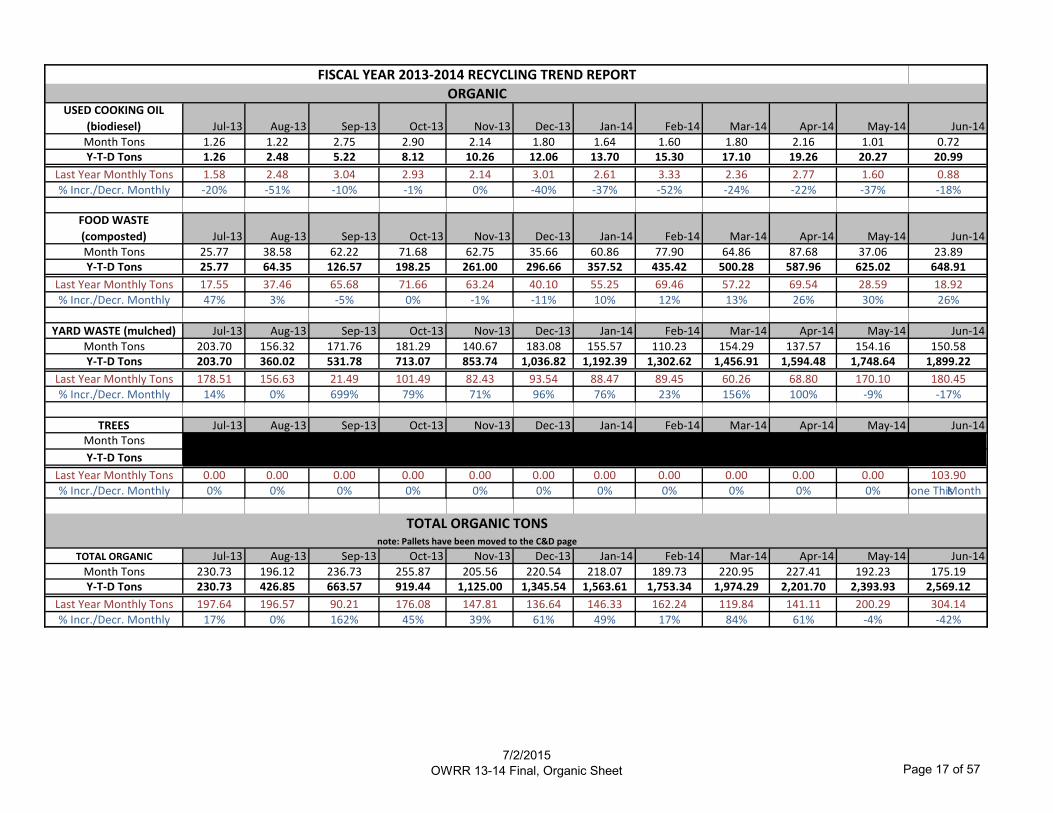
FISCAL YEAR 2013-2014 RECYCLING TREND REPORT
ORGANICUSED COOKING OIL
(biodiesel) Jul-13 Aug-13 Sep-13 Oct-13 Nov-13 Dec-13 Jan-14 Feb-14 Mar-14 Apr-14 May-14 Jun-14Month Tons 1.26 1.22 2.75 2.90 2.14 1.80 1.64 1.60 1.80 2.16 1.01 0.72Y-T-D Tons 1.26 2.48 5.22 8.12 10.26 12.06 13.70 15.30 17.10 19.26 20.27 20.99
Last Year Monthly Tons 1.58 2.48 3.04 2.93 2.14 3.01 2.61 3.33 2.36 2.77 1.60 0.88% Incr./Decr. Monthly -20% -51% -10% -1% 0% -40% -37% -52% -24% -22% -37% -18%
FOOD WASTE
(composted) Jul-13 Aug-13 Sep-13 Oct-13 Nov-13 Dec-13 Jan-14 Feb-14 Mar-14 Apr-14 May-14 Jun-14Month Tons 25.77 38.58 62.22 71.68 62.75 35.66 60.86 77.90 64.86 87.68 37.06 23.89Y-T-D Tons 25.77 64.35 126.57 198.25 261.00 296.66 357.52 435.42 500.28 587.96 625.02 648.91
Last Year Monthly Tons 17.55 37.46 65.68 71.66 63.24 40.10 55.25 69.46 57.22 69.54 28.59 18.92% Incr./Decr. Monthly 47% 3% -5% 0% -1% -11% 10% 12% 13% 26% 30% 26%
YARD WASTE (mulched) Jul-13 Aug-13 Sep-13 Oct-13 Nov-13 Dec-13 Jan-14 Feb-14 Mar-14 Apr-14 May-14 Jun-14Month Tons 203.70 156.32 171.76 181.29 140.67 183.08 155.57 110.23 154.29 137.57 154.16 150.58Y-T-D Tons 203.70 360.02 531.78 713.07 853.74 1,036.82 1,192.39 1,302.62 1,456.91 1,594.48 1,748.64 1,899.22
Last Year Monthly Tons 178.51 156.63 21.49 101.49 82.43 93.54 88.47 89.45 60.26 68.80 170.10 180.45% Incr./Decr. Monthly 14% 0% 699% 79% 71% 96% 76% 23% 156% 100% -9% -17%
TREES Jul-13 Aug-13 Sep-13 Oct-13 Nov-13 Dec-13 Jan-14 Feb-14 Mar-14 Apr-14 May-14 Jun-14Month Tons 0.00 0.00 0.00 0.00 0.00 0.00 0.00
Y-T-D Tons 0.00 0.00 0.00 0.00 0.00 0.00 0.00 0.00 0.00 0.00 0.00 0.00
Last Year Monthly Tons 0.00 0.00 0.00 0.00 0.00 0.00 0.00 0.00 0.00 0.00 0.00 103.90% Incr./Decr. Monthly 0% 0% 0% 0% 0% 0% 0% 0% 0% 0% 0% None ThisMonth
TOTAL ORGANIC TONSnote: Pallets have been moved to the C&D page
TOTAL ORGANIC Jul-13 Aug-13 Sep-13 Oct-13 Nov-13 Dec-13 Jan-14 Feb-14 Mar-14 Apr-14 May-14 Jun-14Month Tons 230.73 196.12 236.73 255.87 205.56 220.54 218.07 189.73 220.95 227.41 192.23 175.19Y-T-D Tons 230.73 426.85 663.57 919.44 1,125.00 1,345.54 1,563.61 1,753.34 1,974.29 2,201.70 2,393.93 2,569.12
Last Year Monthly Tons 197.64 196.57 90.21 176.08 147.81 136.64 146.33 162.24 119.84 141.11 200.29 304.14% Incr./Decr. Monthly 17% 0% 162% 45% 39% 61% 49% 17% 84% 61% -4% -42%
7/2/2015
OWRR 13-14 Final, Organic Sheet Page 17 of 57
7/2/2015
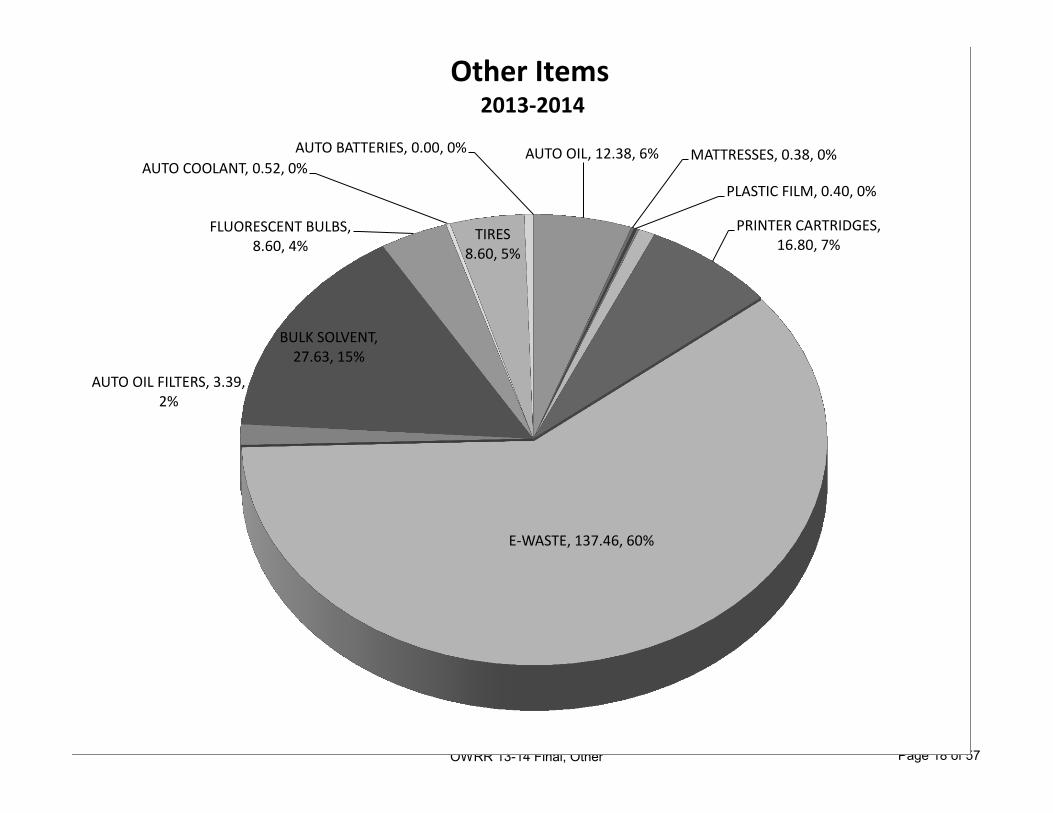
OWRR 13-14 Final, Other Page 18 of 57
AUTO BATTERIES, 0.00, 0% AUTO OIL, 12.38, 6% MATTRESSES, 0.38, 0%
PLASTIC FILM, 0.40, 0%
PRINTER CARTRIDGES, 16.80, 7%
E-WASTE, 137.46, 60%
AUTO OIL FILTERS, 3.39, 2%
BULK SOLVENT, 27.63, 15%
FLUORESCENT BULBS, 8.60, 4%
AUTO COOLANT, 0.52, 0%
TIRES 8.60, 5%
Other Items 2013-2014
FISCAL YEAR 2013-2014 RECYCLING TREND REPORT
OTHER ITEMS
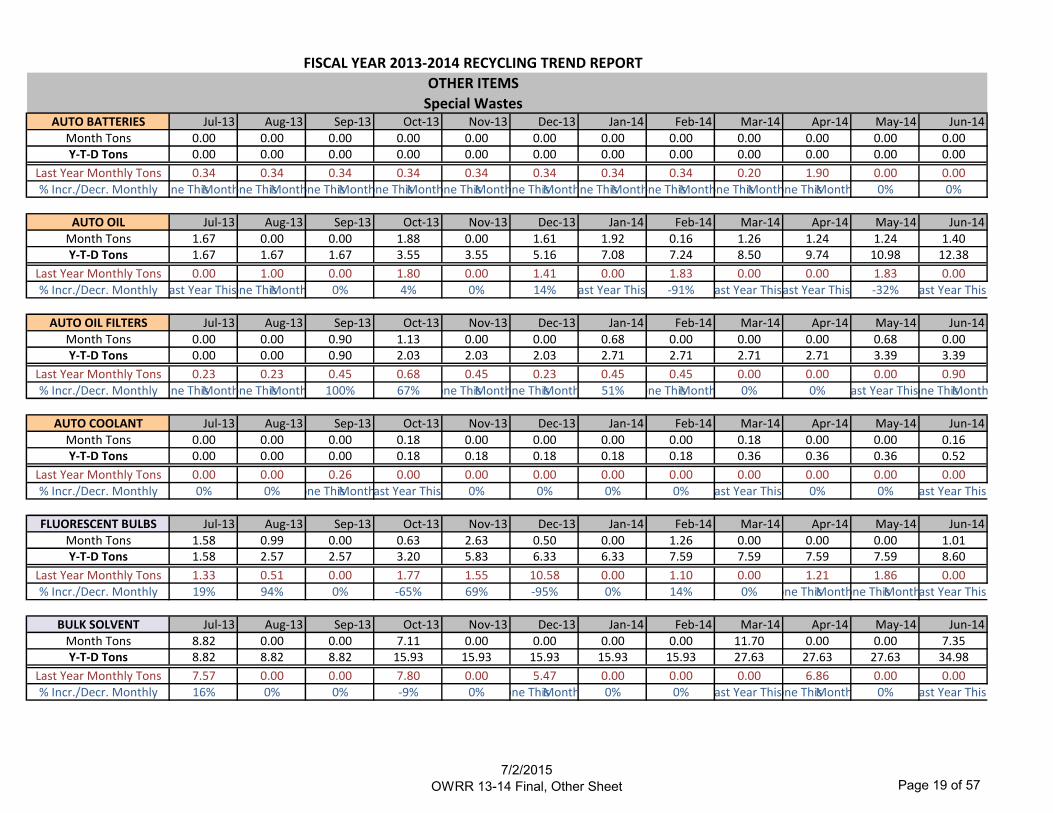
Special WastesAUTO BATTERIES Jul-13 Aug-13 Sep-13 Oct-13 Nov-13 Dec-13 Jan-14 Feb-14 Mar-14 Apr-14 May-14 Jun-14
Month Tons 0.00 0.00 0.00 0.00 0.00 0.00 0.00 0.00 0.00 0.00 0.00 0.00Y-T-D Tons 0.00 0.00 0.00 0.00 0.00 0.00 0.00 0.00 0.00 0.00 0.00 0.00
Last Year Monthly Tons 0.34 0.34 0.34 0.34 0.34 0.34 0.34 0.34 0.20 1.90 0.00 0.00% Incr./Decr. MonthlyNone ThisMonthNone ThisMonthNone ThisMonthNone ThisMonthNone ThisMonthNone ThisMonthNone ThisMonthNone ThisMonthNone ThisMonthNone ThisMonth 0% 0%
AUTO OIL Jul-13 Aug-13 Sep-13 Oct-13 Nov-13 Dec-13 Jan-14 Feb-14 Mar-14 Apr-14 May-14 Jun-14Month Tons 1.67 0.00 0.00 1.88 0.00 1.61 1.92 0.16 1.26 1.24 1.24 1.40Y-T-D Tons 1.67 1.67 1.67 3.55 3.55 5.16 7.08 7.24 8.50 9.74 10.98 12.38
Last Year Monthly Tons 0.00 1.00 0.00 1.80 0.00 1.41 0.00 1.83 0.00 0.00 1.83 0.00% Incr./Decr. MonthlyNone Last Year This MonthNone ThisMonth 0% 4% 0% 14%None Last Year This Month-91%None Last Year This MonthNone Last Year This Month-32%None Last Year This Month
AUTO OIL FILTERS Jul-13 Aug-13 Sep-13 Oct-13 Nov-13 Dec-13 Jan-14 Feb-14 Mar-14 Apr-14 May-14 Jun-14Month Tons 0.00 0.00 0.90 1.13 0.00 0.00 0.68 0.00 0.00 0.00 0.68 0.00Y-T-D Tons 0.00 0.00 0.90 2.03 2.03 2.03 2.71 2.71 2.71 2.71 3.39 3.39
Last Year Monthly Tons 0.23 0.23 0.45 0.68 0.45 0.23 0.45 0.45 0.00 0.00 0.00 0.90% Incr./Decr. MonthlyNone ThisMonthNone ThisMonth 100% 67% None ThisMonthNone ThisMonth 51% None ThisMonth 0% 0%None Last Year This MonthNone ThisMonth
AUTO COOLANT Jul-13 Aug-13 Sep-13 Oct-13 Nov-13 Dec-13 Jan-14 Feb-14 Mar-14 Apr-14 May-14 Jun-14Month Tons 0.00 0.00 0.00 0.18 0.00 0.00 0.00 0.00 0.18 0.00 0.00 0.16Y-T-D Tons 0.00 0.00 0.00 0.18 0.18 0.18 0.18 0.18 0.36 0.36 0.36 0.52
Last Year Monthly Tons 0.00 0.00 0.26 0.00 0.00 0.00 0.00 0.00 0.00 0.00 0.00 0.00% Incr./Decr. Monthly 0% 0% None ThisMonthNone Last Year This Month0% 0% 0% 0%None Last Year This Month0% 0%None Last Year This Month
FLUORESCENT BULBS Jul-13 Aug-13 Sep-13 Oct-13 Nov-13 Dec-13 Jan-14 Feb-14 Mar-14 Apr-14 May-14 Jun-14Month Tons 1.58 0.99 0.00 0.63 2.63 0.50 0.00 1.26 0.00 0.00 0.00 1.01Y-T-D Tons 1.58 2.57 2.57 3.20 5.83 6.33 6.33 7.59 7.59 7.59 7.59 8.60
Last Year Monthly Tons 1.33 0.51 0.00 1.77 1.55 10.58 0.00 1.10 0.00 1.21 1.86 0.00% Incr./Decr. Monthly 19% 94% 0% -65% 69% -95% 0% 14% 0% None ThisMonthNone ThisMonthNone Last Year This Month
BULK SOLVENT Jul-13 Aug-13 Sep-13 Oct-13 Nov-13 Dec-13 Jan-14 Feb-14 Mar-14 Apr-14 May-14 Jun-14Month Tons 8.82 0.00 0.00 7.11 0.00 0.00 0.00 0.00 11.70 0.00 0.00 7.35Y-T-D Tons 8.82 8.82 8.82 15.93 15.93 15.93 15.93 15.93 27.63 27.63 27.63 34.98
Last Year Monthly Tons 7.57 0.00 0.00 7.80 0.00 5.47 0.00 0.00 0.00 6.86 0.00 0.00% Incr./Decr. Monthly 16% 0% 0% -9% 0% None ThisMonth 0% 0%None Last Year This MonthNone ThisMonth 0%None Last Year This Month
7/2/2015
OWRR 13-14 Final, Other Sheet Page 19 of 57

MATTRESSES Jul-13 Aug-13 Sep-13 Oct-13 Nov-13 Dec-13 Jan-14 Feb-14 Mar-14 Apr-14 May-14 Jun-14Month Tons 0.00 0.00 0.38 0.00 0.00 0.00 0.00 0.00 0.00 0.00 0.00 0.00Y-T-D Tons 0.00 0.00 0.38 0.38 0.38 0.38 0.38 0.38 0.38 0.38 0.38 0.38
Last Year Monthly Tons 10.15 0.00 0.00 0.00 0.00 0.00 0.00 0.00 0.00 0.00 0.00 0.00% Incr./Decr. MonthlyNone ThisMonth 0%None Last Year This Month0% 0% 0% 0% 0% 0% 0% 0% 0%
PLASTIC FILM Jul-13 Aug-13 Sep-13 Oct-13 Nov-13 Dec-13 Jan-14 Feb-14 Mar-14 Apr-14 May-14 Jun-14Month Tons 0.00 0.40 0.00 0.00 0.00 0.00 0.00 0.00 0.00 0.00 0.00 0.00Y-T-D Tons 0.00 0.40 0.40 0.40 0.40 0.40 0.40 0.40 0.40 0.40 0.40 0.40
Last Year Monthly Tons 0.23 0.23 0.23 0.23 0.23 0.23 0.23 0.23 0.23 0.23 0.23 0.23% Incr./Decr. MonthlyNone ThisMonth 74% None ThisMonthNone ThisMonthNone ThisMonthNone ThisMonthNone ThisMonthNone ThisMonthNone ThisMonthNone ThisMonthNone ThisMonthNone ThisMonth
POLYSTYRENE (loose) Jul-13 Aug-13 Sep-13 Oct-13 Nov-13 Dec-13 Jan-14 Feb-14 Mar-14 Apr-14 May-14 Jun-14Month Tons 0.00 0.23 0.00 0.00 0.00 0.00 0.00 0.00 0.00 0.00 0.00 0.00Y-T-D Tons 0.00 0.23 0.23 0.23 0.23 0.23 0.23 0.23 0.23 0.23 0.23 0.23
Last Year Monthly Tons 0.11 0.00 0.00 0.00 0.00 0.00 0.00 0.00 0.00 0.00 0.00 0.00% Incr./Decr. MonthlyNone ThisMonthNone Last Year This Month0% 0% 0% 0% 0% 0% 0% 0% 0% 0%
BATTERIES Jul-13 Aug-13 Sep-13 Oct-13 Nov-13 Dec-13 Jan-14 Feb-14 Mar-14 Apr-14 May-14 Jun-14Month Tons 0.00 0.55 0.00 0.00 0.00 0.00 0.00 0.00 1.53 0.00 0.00 0.00Y-T-D Tons 0.00 0.55 0.55 0.55 0.55 0.55 0.55 0.55 2.08 2.08 2.08 2.08
Last Year Monthly Tons 0.00 0.00 0.00 0.00 0.00 0.00 0.00 0.00 0.00 0.00 0.00 0.00% Incr./Decr. MonthlyNone ThisMonthNone Last Year This Month0% 0% 0% 0% 0% 0%None Last Year This Month0% 0% 0%
PRINTER CARTRIDGES Jul-13 Aug-13 Sep-13 Oct-13 Nov-13 Dec-13 Jan-14 Feb-14 Mar-14 Apr-14 May-14 Jun-14Month Tons 0.00 0.00 7.20 0.00 0.00 0.00 0.00 0.00 0.00 0.00 9.60 0.00Y-T-D Tons 0.00 0.00 7.20 7.20 7.20 7.20 7.20 7.20 7.20 7.20 16.80 16.80
Last Year Monthly Tons 0.00 14.20 0.00 6.03 0.00 0.00 0.00 6.80 0.00 0.00 6.20 0.00% Incr./Decr. Monthly 0% None ThisMonthNone Last Year This MonthNone ThisMonth 0% 0% 0% None ThisMonth 0% 0% 55% 0%
E-WASTE Jul-13 Aug-13 Sep-13 Oct-13 Nov-13 Dec-13 Jan-14 Feb-14 Mar-14 Apr-14 May-14 Jun-14Month Tons 8.69 19.72 23.20 13.77 8.71 10.73 11.07 10.10 5.93 6.44 9.55 9.55Y-T-D Tons 8.69 28.41 51.61 65.38 74.09 84.82 95.89 105.99 111.92 118.36 127.91 137.46
Last Year Monthly Tons 4.23 3.91 7.13 4.64 8.40 6.12 7.99 3.95 1.98 1.97 3.73 5.74% Incr./Decr. Monthly 105% 404% 225% 197% 4% 75% 39% 156% 199% 227% 156% 66%
7/2/2015
OWRR 13-14 Final, Other Sheet Page 20 of 57

TIRES Jul-13 Aug-13 Sep-13 Oct-13 Nov-13 Dec-13 Jan-14 Feb-14 Mar-14 Apr-14 May-14 Jun-14Month Tons 2.01 3.48 0.56 0.62 0.51 0.45 0.43 0.00 0.54 0.00 0.73 0.00Y-T-D Tons 2.01 5.49 6.05 6.67 7.18 7.63 8.06 8.06 8.60 8.60 9.33 9.33
Last Year Monthly Tons 0.00 0.98 0.63 0.00 0.55 0.57 0.46 1.30 0.00 0.40 0.60 0.00% Incr./Decr. MonthlyNone Last Year This Month255% -11%None Last Year This Month-7% -21% -7% None ThisMonthNone Last Year This MonthNone ThisMonth 22% 0%
METAL ITEMS Jul-13 Aug-13 Sep-13 Oct-13 Nov-13 Dec-13 Jan-14 Feb-14 Mar-14 Apr-14 May-14 Jun-14Month Tons 0.00 0.00 0.00 0.00 0.00 0.00 0.14 0.32 0.15 0.23 0.15 0.15Y-T-D Tons 0.00 0.00 0.00 0.00 0.00 0.00 0.14 0.45 0.61 0.83 0.98 1.13
Last Year Monthly Tons 0.00 0.00 0.00 0.00 0.00 0.00 0.00 0.00 0.00 0.00 0.00 0.00% Incr./Decr. Monthly 0% 0% 0% 0% 0% 0%None Last Year This MonthNone Last Year This MonthNone Last Year This MonthNone Last Year This MonthNone Last Year This MonthNone Last Year This Month
Other Totals(note: scrap metal, surplus and concrete/brick have been moved to the C&D page)
TOTAL Jul-13 Aug-13 Sep-13 Oct-13 Nov-13 Dec-13 Jan-14 Feb-14 Mar-14 Apr-14 May-14 Jun-14Month Tons 22.77 25.37 32.24 25.32 11.85 13.29 14.24 11.84 21.30 7.91 21.95 19.62Y-T-D Tons 22.77 48.14 80.38 105.70 117.55 130.84 145.08 156.91 178.21 186.12 208.07 227.69
Last Year Monthly Tons 25.44 21.16 8.81 23.06 11.29 24.71 9.24 15.77 2.18 12.34 14.22 6.64% Incr./Decr. Monthly -10% 20% 266% 10% 5% -46% 54% -25% 877% -36% 54% 195%
7/2/2015
OWRR 13-14 Final, Other Sheet Page 21 of 57

7/2/2015
OWRR 13-14 Final, Recycling Rate History Page 22 of 57
12% 12%
18% 17%
26%
31%
42%
35% 35% 33%
34% 33%
39% 40% 41%
39%
43%
45%
38%
45%
41%
37%
43%
47%
0.0%
10.0%
20.0%
30.0%
40.0%
50.0%
60.0%
90-9
1
91-9
2
92-9
3
93-9
4
94-9
5
95-9
6
96-9
7
97-9
8
98-9
9
99-0
0
00-0
1
01-0
2
02-0
3
03-0
4
04-0
5
05-0
6
06-0
7
07-0
8
08-0
9
09-1
0
10-1
1
11-1
2
12-1
3
13-1
4
Recycling Rate History

7/2/2015
OWRR 13-14 Final, waste & recycling trends Page 23 of 57
5,694
8,140
7,672
7,758
6,829
6,581
6,035
6,177
5,754
6,612
6,819
6,647
6,083
5,872
5,559
5,701
5,785
5,558
5,473
5,146
5,764
5,856
5,931
5,789
771
1,156
1,628
1,546
2,459
3,011
4,301
3,391
3,120
3,239
3,556
3,304
3,923
3,853
3,888
3,666
4,331
4,604
3,371
4,164
4,084
3,483
4,412
5,034
0 2,000 4,000 6,000 8,000 10,000 12,000
90-91
91-92
92-93
93-94
94-95
95-96
96-97
97-98
98-99
99-00
00-01
01-02
02-03
03-04
04-05
05-06
06-07
07-08
08-09
09-10
10-11
11-12
12-13
13-14
Tons
Fiscal Year
UNC-Chapel Hill Waste Disposal & Recycling Trends (without Coal Ash)
Trash tonnage (without ash) Recycling tonnage (without ash)
7/2/2015
OWRR 13-14 Final, Recycling Tons History Page 24 of 57
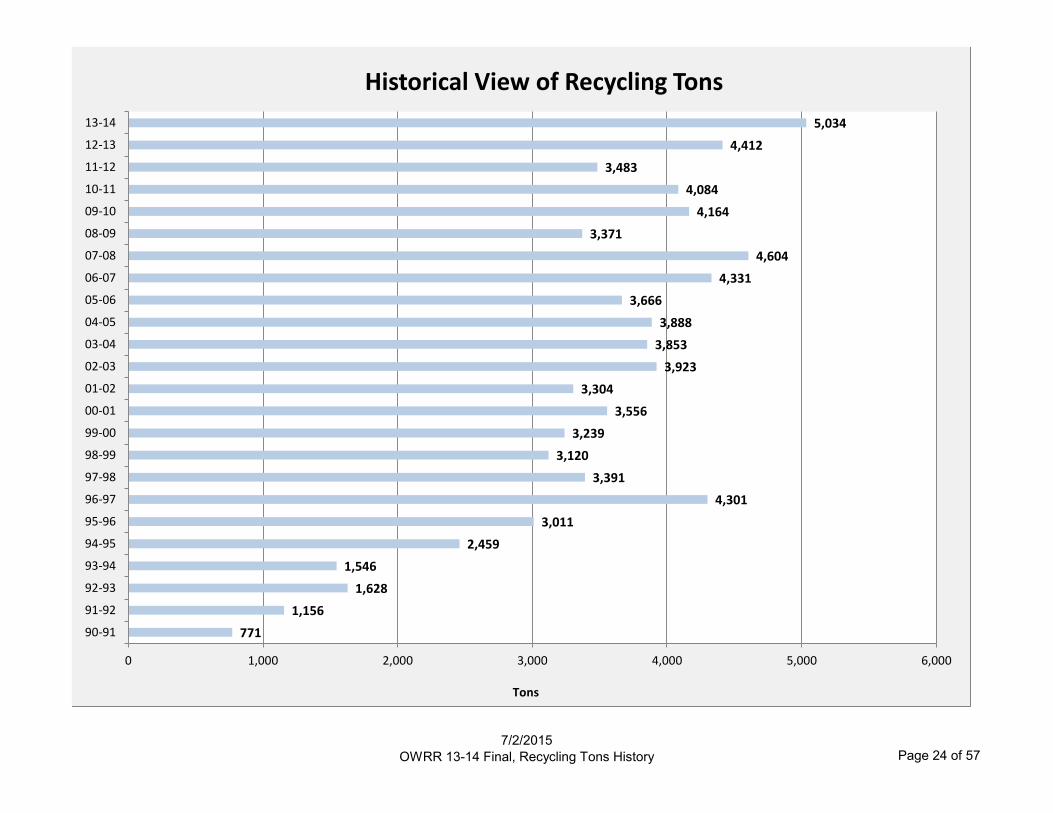
771
1,156
1,628
1,546
2,459
3,011
4,301
3,391
3,120
3,239
3,556
3,304
3,923
3,853
3,888
3,666
4,331
4,604
3,371
4,164
4,084
3,483
4,412
5,034
0 1,000 2,000 3,000 4,000 5,000 6,000
90-91
91-92
92-93
93-94
94-95
95-96
96-97
97-98
98-99
99-00
00-01
01-02
02-03
03-04
04-05
05-06
06-07
07-08
08-09
09-10
10-11
11-12
12-13
13-14
Tons
Historical View of Recycling Tons

FISCAL YEAR 2012-2013 RECYCLING TREND REPORTMSW SOLID WASTE
MSW FRONT LOAD Jul-13 Aug-13 Sep-13 Oct-13 Nov-13 Dec-13 Jan-14 Feb-14 Mar-14 Apr-14 May-14 Jun-14Month Tons 244.23 250.93 264.80 308.58 270.00 246.63 236.61 240.52 268.07 283.43 303.25 162.26Y-T-D Tons 244.23 495.16 759.96 1,068.54 1,338.54 1,585.17 1,821.78 2,062.30 2,330.37 2,613.80 2,917.05 3,079.31
Last Year Monthly Tons 229.06 251.99 283.65 306.65 270.32 213.05 250.26 251.7 249.4 285.21 298.49 219.6% Incr./Decr. Monthly 7% 0% -7% 1% 0% 16% -5% -4% 7% -1% 2% -26%
MSW ROLLOFF Jul-13 Aug-13 Sep-13 Oct-13 Nov-13 Dec-13 Jan-14 Feb-14 Mar-14 Apr-14 May-14 Jun-14Waste Industries Hauled 119.01 119.01 119.01 150.85 124.16 84.14 160.49 206.68 161.34 196.32 200.80 139.83
OWRR Hauled 0.00 6.52 0.00 4.90 0.79 0.00 0.00 0.00 0.00 2.88 22.31 1.83
Month Tons 119.01 125.53 119.01 155.75 124.95 84.14 160.49 206.68 161.34 199.20 223.11 141.66Y-T-D Tons 119.01 244.54 363.55 519.30 644.25 728.39 888.88 1,095.56 1,256.90 1,456.10 1,679.21 1,820.87
Last Year Monthly Tons 102.63 134.89 151.43 183.87 155.98 136.01 118.19 157.55 148.83 173.17 235.71 119.01% Incr./Decr. Monthly 16% -7% -21% -15% -20% -38% 36% 31% 8% 15% -5% 19%
UNC (non rolloff) Jul-13 Aug-13 Sep-13 Oct-13 Nov-13 Dec-13 Jan-14 Feb-14 Mar-14 Apr-14 May-14 Jun-14Month Tons 0.00 0.00 0.00 0.00 0.00 0.00 0.00 0.00 0.00 0.00 0.00 0.00Y-T-D Tons 0.00 0.00 0.00 0.00 0.00 0.00 0.00 0.00 0.00 0.00 0.00 0.00
Last Year Monthly Tons 0 1.69 0 0 0 0 1.45 0 0 0 1.1 2% Incr./Decr. Monthly 0% -100% 0% 0% 0% 0% None ThisYTD 0% 0% 0% None ThisYTD None ThisYTD
ANIMAL BEDDING Jul-13 Aug-13 Sep-13 Oct-13 Nov-13 Dec-13 Jan-14 Feb-14 Mar-14 Apr-14 May-14 Jun-14Month Tons Gen Med 29.63 40.13 22.81 34.79 31.18 26.42 29.95 26.61 35.91 27.48 35.51 29.10Month Tons Rear Load 52.94 52.94 52.94 36.25 29.49 31.44 29.00 32.06 31.44 35.62 42.24 35.18
Month Tons 82.57 93.07 75.75 71.04 60.67 57.86 58.95 58.67 67.35 63.10 77.75 64.28Y-T-D Tons 82.57 175.64 251.39 322.43 383.10 440.96 499.91 558.58 625.93 689.03 766.78 831.06
Last Year Monthly Tons 80.57 77.77 79.42 76.23 70.45 68.44 69.83 67.72 70.94 69.27 78.83 76.64% Incr./Decr. Monthly 2% 20% -5% -7% -14% -15% -16% -13% -5% -9% -1% -16%
TOTAL Jul-13 Aug-13 Sep-13 Oct-13 Nov-13 Dec-13 Jan-14 Feb-14 Mar-14 Apr-14 May-14 Jun-14Month Tons 445.81 469.53 459.56 535.37 455.62 388.63 456.05 505.87 496.76 545.73 604.11 368.20Y-T-D Tons 445.81 915.34 1,374.90 1,910.27 2,365.89 2,754.52 3,210.57 3,716.44 4,213.20 4,758.93 5,363.04 5,731.24
Last Year Monthly Tons 412.26 466.34 514.5 566.75 496.75 417.5 439.73 476.97 469.17 527.65 614.13 417.25% Incr./Decr. Monthly 8% 1% -11% -6% -8% -7% 4% 6% 6% 3% -2% -12%
7/2/2015
OWRR 13-14 Final, msw Page 25 of 57

FISCAL YEAR 2013-2014 RECYCLING TREND REPORT
Coal Ash RECYCLED Jul-13 Aug-13 Sep-13 Oct-13 Nov-13 Dec-13 Jan-14 Feb-14 Mar-14 Apr-14 May-14 Jun-14
Month Tons 0.00 0.00 0.00 0.00 0.00 0.00 0.00 0.00 0.00 0.00 0.00 0.00Y-T-D Tons 0.00 0.00 0.00 0.00 0.00 0.00 0.00 0.00 0.00 0.00 0.00 0.00
Last Year Monthly Tons 275.62 205.29 0 0 0 0 0 0 0 0 0 0% Incr./Decr. MonthlyNone ThisMonthNone ThisMonth 0% 0% 0% 0% 0% 0% 0% 0% 0% 0%
COMPOSTED Jul-13 Aug-13 Sep-13 Oct-13 Nov-13 Dec-13 Jan-14 Feb-14 Mar-14 Apr-14 May-14 Jun-14Month Tons 0.00 0.00 0.00 0.00 0.00 0.00 0.00 0.00 0.00 0.00 0.00 0.00Y-T-D Tons 0.00 0.00 0.00 0.00 0.00 0.00 0.00 0.00 0.00 0.00 0.00 0.00
Last Year Monthly Tons 0.00 0.00 0.00 0.00 0.00 0.00 145.23 221.49 0.00 0.00 0.00 0.00% Incr./Decr. Monthly 0% 0% 0% 0% 0% 0% None ThisMonthNone ThisMonth 0% 0% 0% 0%
REUSED* Jul-13 Aug-13 Sep-13 Oct-13 Nov-13 Dec-13 Jan-14 Feb-14 Mar-14 Apr-14 May-14 Jun-14Structural Fill 816.62 1275.63 1347.90 1208.66 2070.52 2816.90 3564.27 2857.35 2509.95 1712.51 1773.41 1816.65
Sand Replacement CoGen 0.00 0.00 15.00 14.95 39.75 0.00 0.00 25.74 0.00 9.25 0.00 0.00
Month Tons 816.62 1,275.63 1,362.90 1,223.61 2,110.27 2,816.90 3,564.27 2,883.09 2,509.95 1,721.76 1,773.41 1,816.65Y-T-D Tons 816.62 2,092.25 3,455.15 4678.76 6789.03 9605.93 13170.20 16,053.29 18,563.24 20,285.00 22,058.41 23,875.06
Last Year Monthly Tons 1,114.64 670.29 1,189.89 837.85 1,367.47 1,380.96 3,181.82 1,980.16 2,530.78 834.01 1,889.15 733.29% Incr./Decr. Monthly -27% 90% 15% 46% 54% 104% 12% 46% -1% 106% -6% 148%
LANDFILLED Jul-13 Aug-13 Sep-13 Oct-13 Nov-13 Dec-13 Jan-14 Feb-14 Mar-14 Apr-14 May-14 Jun-14Month Tons 0.00 0.00 0.00 0.00 0.00 0.00 0.00 0.00 0.00 0.00 0.00 0.00Y-T-D Tons 0.00 0.00 0.00 0.00 0.00 0.00 0.00 0.00 0.00 0.00 0.00 0.00
Last Year Monthly Tons 0.00 0.00 0.00 0.00 0.00 0.00 0.00 0.00 0.00 0.00 0.00 0.00% Incr./Decr. Monthly 0% 0% 0% 0% 0% 0% 0% 0% 0% 0% 0% 0%
Coal Ash TotalsTOTAL COAL ASH Jul-13 Aug-13 Sep-13 Oct-13 Nov-13 Dec-13 Jan-14 Feb-14 Mar-14 Apr-14 May-14 Jun-14
Month Tons 816.62 1,275.63 1,362.90 1,223.61 2,110.27 2,816.90 3,564.27 2,883.09 2,509.95 1,721.76 1,773.41 1,816.65Y-T-D Tons 816.62 2,092.25 3,455.15 4678.76 6789.03 9605.93 13170.20 16,053.29 18,563.24 20,285.00 22,058.41 23,875.06
Last Year Monthly Tons 1,390.26 875.58 1,189.89 837.85 1,367.47 1,380.96 3,327.05 2,201.65 2,530.78 834.01 1,889.15 733.29% Incr./Decr. Monthly -41% 46% 15% 46% 54% 104% 7% 31% -1% 106% -6% 148%
Recycled: Made into new products like concrete or absorbant (Mintek)*Reused: Can be used for structural fill, alternative daily cover at landfills, sand replacement in boiler start up, and sometimes beneficial fill. Between July and Dec 2013, 9,536.23 tons used for structural fill and 69.7 tons used as sand replacement in boiler start up at CoGen.Composted: Made into a new product via decomposition or compost processing.Landfilled: Buried as waste.
7/2/2015
OWRR 13-14 Final, Coal Ash Sheet Page 26 of 57
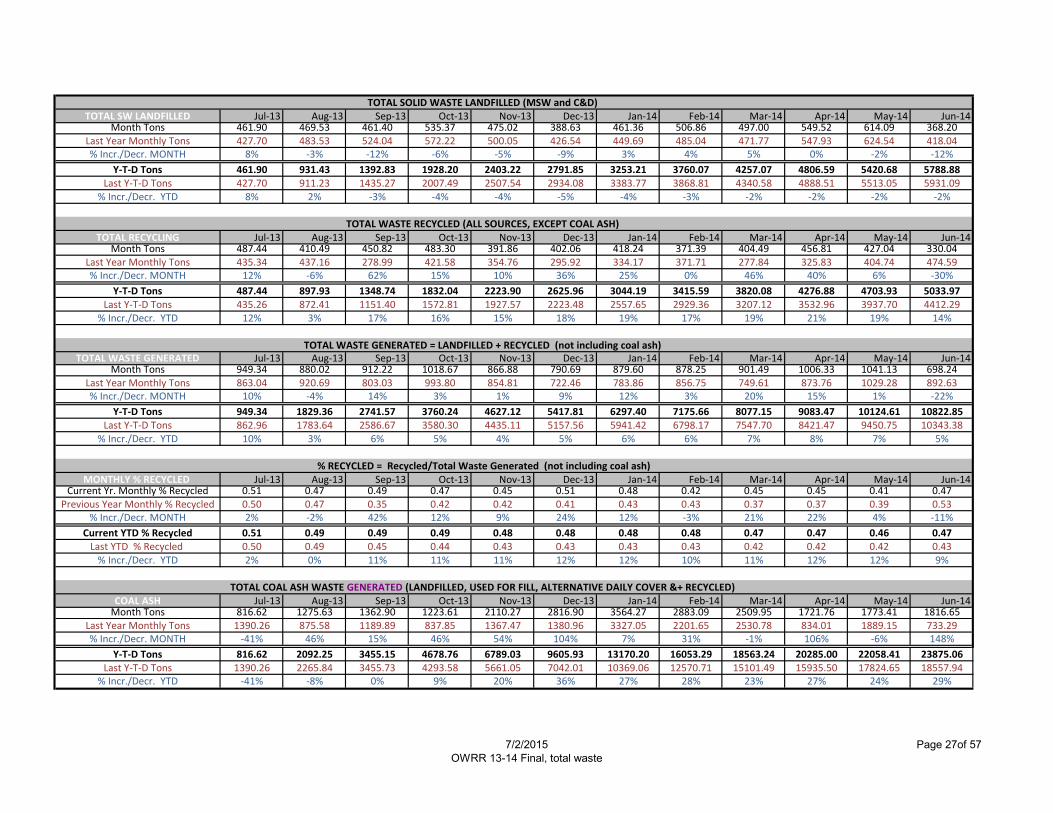
TOTAL SOLID WASTE LANDFILLED (MSW and C&D)TOTAL SW LANDFILLED Jul-13 Aug-13 Sep-13 Oct-13 Nov-13 Dec-13 Jan-14 Feb-14 Mar-14 Apr-14 May-14 Jun-14
Month Tons 461.90 469.53 461.40 535.37 475.02 388.63 461.36 506.86 497.00 549.52 614.09 368.20Last Year Monthly Tons 427.70 483.53 524.04 572.22 500.05 426.54 449.69 485.04 471.77 547.93 624.54 418.04% Incr./Decr. MONTH 8% -3% -12% -6% -5% -9% 3% 4% 5% 0% -2% -12%
Y-T-D Tons 461.90 931.43 1392.83 1928.20 2403.22 2791.85 3253.21 3760.07 4257.07 4806.59 5420.68 5788.88Last Y-T-D Tons 427.70 911.23 1435.27 2007.49 2507.54 2934.08 3383.77 3868.81 4340.58 4888.51 5513.05 5931.09
% Incr./Decr. YTD 8% 2% -3% -4% -4% -5% -4% -3% -2% -2% -2% -2%
TOTAL WASTE RECYCLED (ALL SOURCES, EXCEPT COAL ASH)TOTAL RECYCLING Jul-13 Aug-13 Sep-13 Oct-13 Nov-13 Dec-13 Jan-14 Feb-14 Mar-14 Apr-14 May-14 Jun-14
Month Tons 487.44 410.49 450.82 483.30 391.86 402.06 418.24 371.39 404.49 456.81 427.04 330.04Last Year Monthly Tons 435.34 437.16 278.99 421.58 354.76 295.92 334.17 371.71 277.84 325.83 404.74 474.59% Incr./Decr. MONTH 12% -6% 62% 15% 10% 36% 25% 0% 46% 40% 6% -30%
Y-T-D Tons 487.44 897.93 1348.74 1832.04 2223.90 2625.96 3044.19 3415.59 3820.08 4276.88 4703.93 5033.97Last Y-T-D Tons 435.26 872.41 1151.40 1572.81 1927.57 2223.48 2557.65 2929.36 3207.12 3532.96 3937.70 4412.29
% Incr./Decr. YTD 12% 3% 17% 16% 15% 18% 19% 17% 19% 21% 19% 14%
TOTAL WASTE GENERATED = LANDFILLED + RECYCLED (not including coal ash)TOTAL WASTE GENERATED Jul-13 Aug-13 Sep-13 Oct-13 Nov-13 Dec-13 Jan-14 Feb-14 Mar-14 Apr-14 May-14 Jun-14
Month Tons 949.34 880.02 912.22 1018.67 866.88 790.69 879.60 878.25 901.49 1006.33 1041.13 698.24Last Year Monthly Tons 863.04 920.69 803.03 993.80 854.81 722.46 783.86 856.75 749.61 873.76 1029.28 892.63% Incr./Decr. MONTH 10% -4% 14% 3% 1% 9% 12% 3% 20% 15% 1% -22%
Y-T-D Tons 949.34 1829.36 2741.57 3760.24 4627.12 5417.81 6297.40 7175.66 8077.15 9083.47 10124.61 10822.85Last Y-T-D Tons 862.96 1783.64 2586.67 3580.30 4435.11 5157.56 5941.42 6798.17 7547.70 8421.47 9450.75 10343.38
% Incr./Decr. YTD 10% 3% 6% 5% 4% 5% 6% 6% 7% 8% 7% 5%
% RECYCLED = Recycled/Total Waste Generated (not including coal ash)MONTHLY % RECYCLED Jul-13 Aug-13 Sep-13 Oct-13 Nov-13 Dec-13 Jan-14 Feb-14 Mar-14 Apr-14 May-14 Jun-14
Current Yr. Monthly % Recycled 0.51 0.47 0.49 0.47 0.45 0.51 0.48 0.42 0.45 0.45 0.41 0.47Previous Year Monthly % Recycled 0.50 0.47 0.35 0.42 0.42 0.41 0.43 0.43 0.37 0.37 0.39 0.53
% Incr./Decr. MONTH 2% -2% 42% 12% 9% 24% 12% -3% 21% 22% 4% -11%
Current YTD % Recycled 0.51 0.49 0.49 0.49 0.48 0.48 0.48 0.48 0.47 0.47 0.46 0.47Last YTD % Recycled 0.50 0.49 0.45 0.44 0.43 0.43 0.43 0.43 0.42 0.42 0.42 0.43
% Incr./Decr. YTD 2% 0% 11% 11% 11% 12% 12% 10% 11% 12% 12% 9%
TOTAL COAL ASH WASTE GENERATED (LANDFILLED, USED FOR FILL, ALTERNATIVE DAILY COVER &+ RECYCLED)COAL ASH Jul-13 Aug-13 Sep-13 Oct-13 Nov-13 Dec-13 Jan-14 Feb-14 Mar-14 Apr-14 May-14 Jun-14
Month Tons 816.62 1275.63 1362.90 1223.61 2110.27 2816.90 3564.27 2883.09 2509.95 1721.76 1773.41 1816.65Last Year Monthly Tons 1390.26 875.58 1189.89 837.85 1367.47 1380.96 3327.05 2201.65 2530.78 834.01 1889.15 733.29% Incr./Decr. MONTH -41% 46% 15% 46% 54% 104% 7% 31% -1% 106% -6% 148%
Y-T-D Tons 816.62 2092.25 3455.15 4678.76 6789.03 9605.93 13170.20 16053.29 18563.24 20285.00 22058.41 23875.06Last Y-T-D Tons 1390.26 2265.84 3455.73 4293.58 5661.05 7042.01 10369.06 12570.71 15101.49 15935.50 17824.65 18557.94
% Incr./Decr. YTD -41% -8% 0% 9% 20% 36% 27% 28% 23% 27% 24% 29%
7/2/2015
OWRR 13-14 Final, total waste
Page 27of 57
7/2/2015
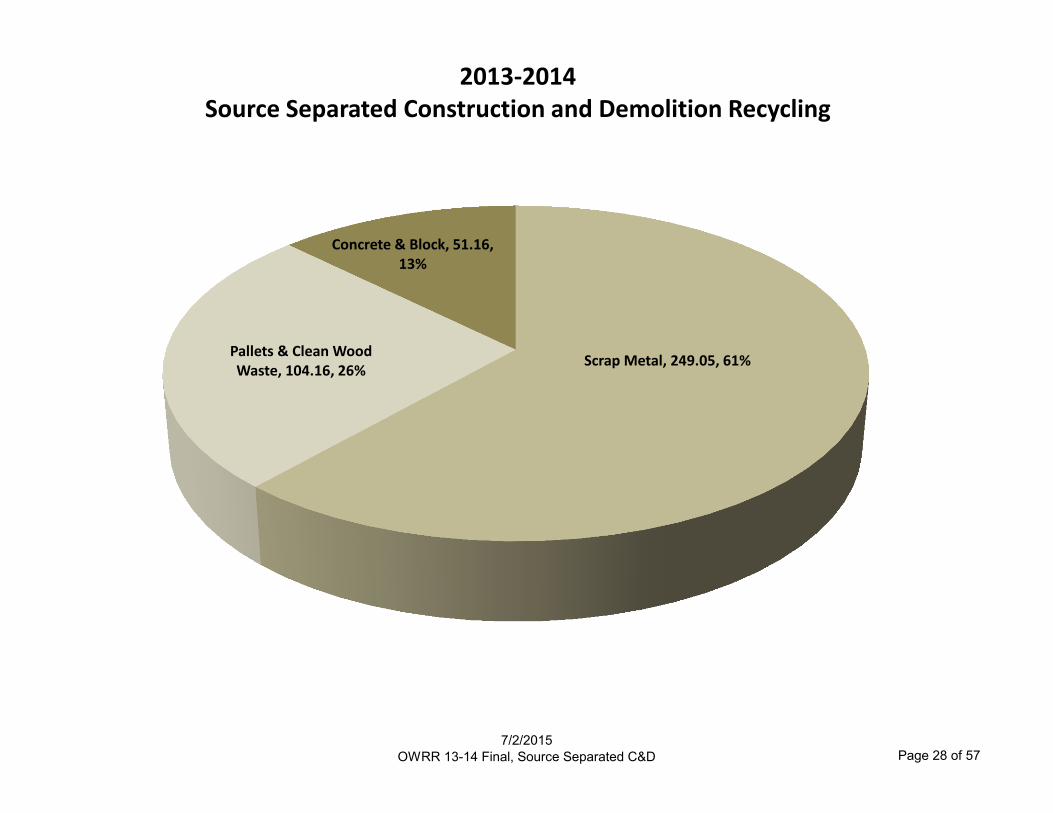
OWRR 13-14 Final, Source Separated C&D Page 28 of 57
Scrap Metal, 249.05, 61% Pallets & Clean Wood Waste, 104.16, 26%
Concrete & Block, 51.16, 13%
2013-2014 Source Separated Construction and Demolition Recycling

21%
35% 43%
83% 67% 65%
77%
52%
0%
20%
40%
60%
80%
100%
2006-2007 2007-2008 2008-2009 2009-2010 2010-2011 2011-2012 2012-2013 2013-2014
Construction and Demolition Recycling Rate
161
253 185
309 272 269 371
405
602
463
246
64
133 142 112 58 0.00
100.00
200.00
300.00
400.00
500.00
600.00
700.00
2006-2007 2007-2008 2008-2009 2009-2010 2010-2011 2011-2012 2012-2013 2013-2014
Construction and Demolition Total Waste in Tons Landfilled vs. Recycled
7/2/2015
OWRR 13-14 Final, C&D Trend 29 of 57
7/2/2015
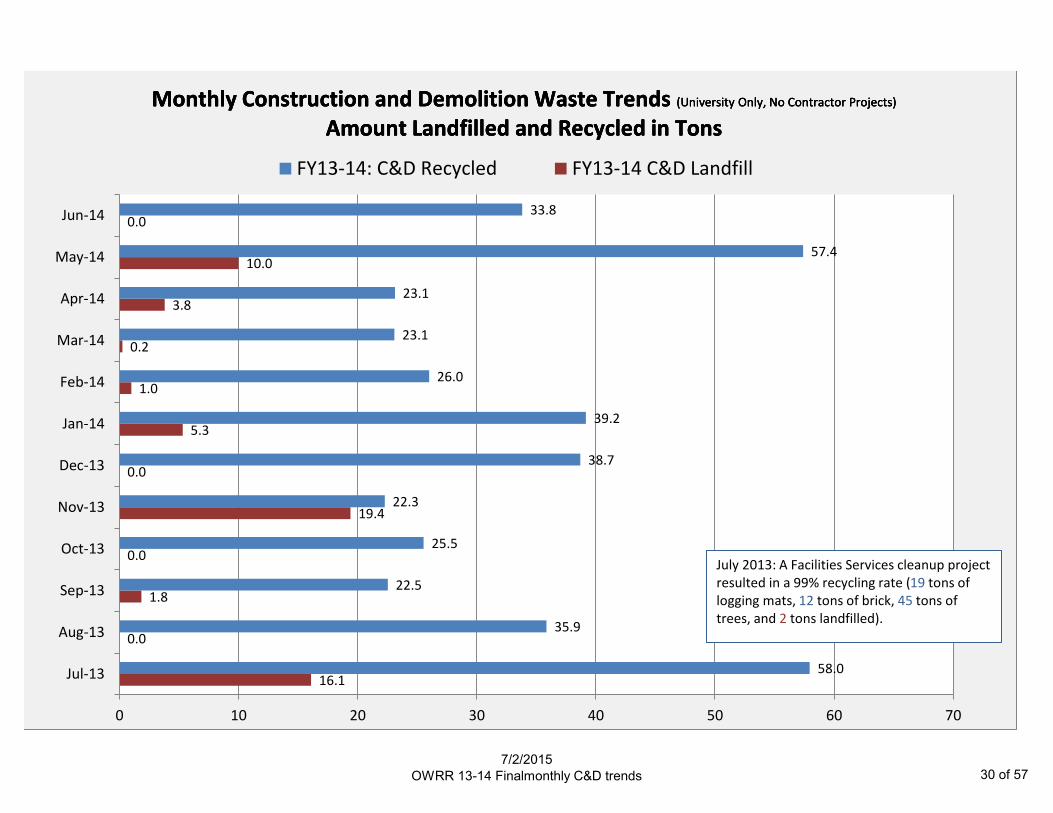
OWRR 13-14 Finalmonthly C&D trends 30 of 57
16.1
0.0
1.8
0.0
19.4
0.0
5.3
1.0
0.2
3.8
10.0
0.0
58.0
35.9
22.5
25.5
22.3
38.7
39.2
26.0
23.1
23.1
57.4
33.8
0 10 20 30 40 50 60 70
Jul-13
Aug-13
Sep-13
Oct-13
Nov-13
Dec-13
Jan-14
Feb-14
Mar-14
Apr-14
May-14
Jun-14
FY13-14: C&D Recycled FY13-14 C&D Landfill
Monthly Construction and Demolition Waste Trends (University Only, No Contractor Projects)
Amount Landfilled and Recycled in Tons Monthly Construction and Demolition Waste Trends (University Only, No Contractor Projects)
Amount Landfilled and Recycled in Tons Monthly Construction and Demolition Waste Trends (University Only, No Contractor Projects)
Amount Landfilled and Recycled in Tons
July 2013: A Facilities Services cleanup project resulted in a 99% recycling rate (19 tons of logging mats, 12 tons of brick, 45 tons of trees, and 2 tons landfilled).

7/2/2015
OWRR 13-14 Final, C&D vs. MSW Page 31 of 57
MSW, 5,731.24, 99%
C/D, 57.64, 1%
Waste Landfilled 2013-2014
Note: The Construction and Demolition Landfill figure includes the amount disposed by Material Recovery
Facilities (MRFs) based on the overall disposal percentages reported by the facilities used.

7/2/2015
OWRR 13-14 Final, Total C&D Page 32 of 57
Total C/D Landfilled, 405.45,
88%
Total C/D Recycled, 57.64, 12%
2013-2014 Construction and Demolition Waste
Campus Operations, Maintenance, Repair and Construction Activities

7/2/2015
OWRR 13-14 Final, C&D Recycling Total Page 33 of 57
MRF: RECYCLED, 1.08, 0%
SOURCE SEPARATED RECYCLING, 404.37,
100%
2013-2014 Total Construction and Demolition Recycling
MRF stands for Material Recovery Facility which is a facility that separates mixed loads into materials that can be recycled and those for which no market exists (thus they are landfilled). This represents the amount recycled from the total amount taken to the MRF. See the previous graph for total amount of mixed load construction and demolition waste that University shops and departments sent to MRFs.

7/2/2015
OWRR 13-14 Final, C&D Waste Management Page 34 of 57
Orange County Landfill, 57.64, 13%
Source Separated Recycling, 404.37, 87%
MRF: Recycled, 1.08, 0%
Construction and Demolition Waste Management
Source Separation, Mixed Load Processing (MRF), & Landfill 2013-2014
MRF stands for Material Recovery Facility which is a facility that separates mixed loads into materials that can be recycled and those for which no market exists (thus they are landfilled). During FY13-14, UNC has used Raleigh Reclamation (aka Raleigh Processing, owned by Waste Industries) and Red Rock mixed load C&D processing facilities. Note: A mixed load may contain construction and demolition waste (which is landfilled) AND materials that can be recycled (clean wood waste, pallets, scrap metal, concrete and brick, and other materials of value.)

7/2/2015
OWRR 13-14 Final, Pallets and Clean Wood Page 35 of 57
12.6
10.6
5.5
8.5
7.7
9.3 8.7 8.9
7.2
8.4
9.1
7.7
0.0
2.0
4.0
6.0
8.0
10.0
12.0
14.0
16.0
18.0
Pallets and Clean Wood Waste by Year in Tons FY09-10: 128 tons
FY10-11: 141 tons
FY11-12: 129 tons
FY13-14: 104 tons
Data is missing for November 2008. OWRR began collecting pallets from campus via bi-weekly routes in 2010-11.

SCRAP METALBALLASTS Jul-13 Aug-13 Sep-13 Oct-13 Nov-13 Dec-13 Jan-14 Feb-14 Mar-14 Apr-14 May-14 Jun-14
Month Tons 0.00 3.22 0.00 0.00 0.00 1.31 0.00 0.28 0.00 2.98 0.00 2.72Y-T-D Tons 0.00 3.22 3.22 3.22 3.22 4.53 4.53 4.81 4.81 7.79 7.79 10.51
Last Year Monthly Tons 2.07 0.00 0.00 0.00 1.33 0.63 0.00 0.00 0.00 0.00 3.17 0.00% Incr./Decr. Monthly None ThisMonthNone Last Year This Month0% 0% None ThisMonth 110% 0%None Last Year This Month0%None Last Year This MonthNone ThisMonthNone Last Year This Month
COPPER WIRE Jul-13 Aug-13 Sep-13 Oct-13 Nov-13 Dec-13 Jan-14 Feb-14 Mar-14 Apr-14 May-14 Jun-14Month TonsY-T-D Tons 0.00 0.00 0.00 0.00 0.00 0.00 0.00 0.00 0.00 0.00 0.00 0.00
Last Year Monthly Tons 0.00 0.00 0.00 0.00 0.00 0.00 0.00 0.00 0.00 0.00 0.00 0.00% Incr./Decr. Monthly 0% 0% 0% 0% 0% 0% 0% 0% 0% 0% 0% 0%
SCRAP METAL Jul-13 Aug-13 Sep-13 Oct-13 Nov-13 Dec-13 Jan-14 Feb-14 Mar-14 Apr-14 May-14 Jun-14Month Tons 23.39 22.00 17.00 17.00 13.50 28.07 18.52 16.87 15.84 11.77 31.17 23.41Y-T-D Tons 23.39 45.39 62.39 79.39 92.89 120.96 139.48 156.35 172.19 183.96 215.13 238.54
Last Year Monthly Tons 21.90 14.58 15.00 14.93 12.50 10.00 11.83 13.02 17.64 15.72 17.26 17.99% Incr./Decr. Monthly 7% 51% 13% 14% 8% 181% 57% 30% -10% -25% 81% 30%
TOTAL Jul-13 C Sep-13 Oct-13 Nov-13 Dec-13 Jan-14 Feb-14 Mar-14 Apr-14 May-14 Jun-14Month Tons 23.39 25.22 17.00 17.00 13.50 29.38 18.52 17.15 15.84 14.75 31.17 26.13Y-T-D Tons 23.39 48.61 65.61 82.61 96.11 125.49 144.01 161.16 177.00 191.75 222.92 249.05
Last Year Monthly Tons 23.97 14.58 15.00 14.93 13.83 10.63 11.83 13.02 17.64 15.72 20.43 17.99% Incr./Decr. Monthly -2% 73% 13% 14% -2% 177% 57% 32% -10% -6% 53% 45%
PALLETS AND CLEAN WOOD--SOURCE SEPARATEDPALLETS & CLEAN WOOD Jul-13 Aug-13 Sep-13 Oct-13 Nov-13 Dec-13 Jan-14 Feb-14 Mar-14 Apr-14 May-14 Jun-14
Month Tons 12.57 10.64 5.53 8.54 7.69 9.31 8.65 8.85 7.24 8.38 9.07 7.69Y-T-D Tons 12.57 23.21 28.74 37.28 44.97 54.28 62.93 71.78 79.02 87.40 96.47 104.16
Last Year Monthly Tons 10.94 15.71 9.28 14.55 12.05 14.66 15.40 13.13 9.58 13.29 12.50 7.09% Incr./Decr. Monthly 15% -32% -40% -41% -36% -36% -44% -33% -24% -37% -27% 8%
SOURCE SEPARATED CONSTRUCTION AND DEMOLITION MATERIALS (RECYCLED)FISCAL YEAR 2013-2014 RECYCLING TREND REPORT
7/2/2015
OWRR 13-14 Final, C&D Sheet Page 36 of 57
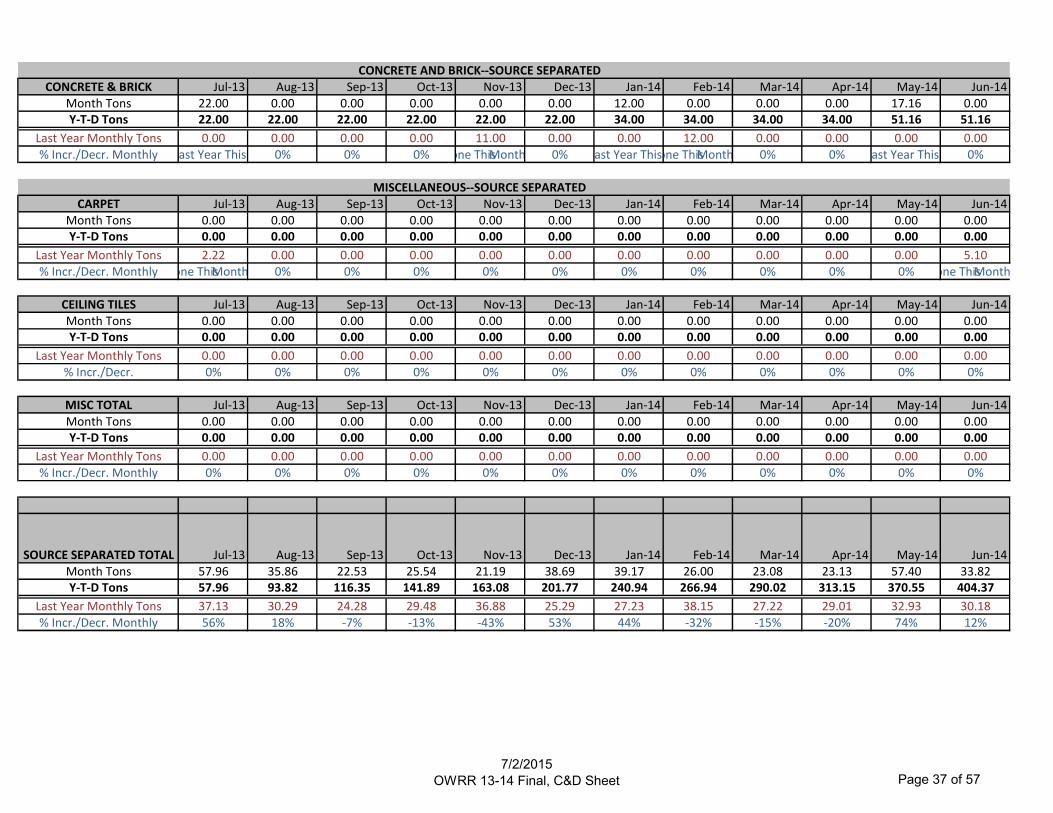
CONCRETE AND BRICK--SOURCE SEPARATEDCONCRETE & BRICK Jul-13 Aug-13 Sep-13 Oct-13 Nov-13 Dec-13 Jan-14 Feb-14 Mar-14 Apr-14 May-14 Jun-14
Month Tons 22.00 0.00 0.00 0.00 0.00 0.00 12.00 0.00 0.00 0.00 17.16 0.00Y-T-D Tons 22.00 22.00 22.00 22.00 22.00 22.00 34.00 34.00 34.00 34.00 51.16 51.16
Last Year Monthly Tons 0.00 0.00 0.00 0.00 11.00 0.00 0.00 12.00 0.00 0.00 0.00 0.00% Incr./Decr. MonthlyNone Last Year This Month0% 0% 0% None ThisMonth 0%None Last Year This MonthNone ThisMonth 0% 0%None Last Year This Month0%
MISCELLANEOUS--SOURCE SEPARATEDCARPET Jul-13 Aug-13 Sep-13 Oct-13 Nov-13 Dec-13 Jan-14 Feb-14 Mar-14 Apr-14 May-14 Jun-14
Month Tons 0.00 0.00 0.00 0.00 0.00 0.00 0.00 0.00 0.00 0.00 0.00 0.00Y-T-D Tons 0.00 0.00 0.00 0.00 0.00 0.00 0.00 0.00 0.00 0.00 0.00 0.00
Last Year Monthly Tons 2.22 0.00 0.00 0.00 0.00 0.00 0.00 0.00 0.00 0.00 0.00 5.10% Incr./Decr. Monthly None ThisMonth 0% 0% 0% 0% 0% 0% 0% 0% 0% 0% None ThisMonth
CEILING TILES Jul-13 Aug-13 Sep-13 Oct-13 Nov-13 Dec-13 Jan-14 Feb-14 Mar-14 Apr-14 May-14 Jun-14Month Tons 0.00 0.00 0.00 0.00 0.00 0.00 0.00 0.00 0.00 0.00 0.00 0.00Y-T-D Tons 0.00 0.00 0.00 0.00 0.00 0.00 0.00 0.00 0.00 0.00 0.00 0.00
Last Year Monthly Tons 0.00 0.00 0.00 0.00 0.00 0.00 0.00 0.00 0.00 0.00 0.00 0.00% Incr./Decr. 0% 0% 0% 0% 0% 0% 0% 0% 0% 0% 0% 0%
MISC TOTAL Jul-13 Aug-13 Sep-13 Oct-13 Nov-13 Dec-13 Jan-14 Feb-14 Mar-14 Apr-14 May-14 Jun-14Month Tons 0.00 0.00 0.00 0.00 0.00 0.00 0.00 0.00 0.00 0.00 0.00 0.00Y-T-D Tons 0.00 0.00 0.00 0.00 0.00 0.00 0.00 0.00 0.00 0.00 0.00 0.00
Last Year Monthly Tons 0.00 0.00 0.00 0.00 0.00 0.00 0.00 0.00 0.00 0.00 0.00 0.00% Incr./Decr. Monthly 0% 0% 0% 0% 0% 0% 0% 0% 0% 0% 0% 0%
SOURCE SEPARATED TOTAL Jul-13 Aug-13 Sep-13 Oct-13 Nov-13 Dec-13 Jan-14 Feb-14 Mar-14 Apr-14 May-14 Jun-14Month Tons 57.96 35.86 22.53 25.54 21.19 38.69 39.17 26.00 23.08 23.13 57.40 33.82Y-T-D Tons 57.96 93.82 116.35 141.89 163.08 201.77 240.94 266.94 290.02 313.15 370.55 404.37
Last Year Monthly Tons 37.13 30.29 24.28 29.48 36.88 25.29 27.23 38.15 27.22 29.01 32.93 30.18% Incr./Decr. Monthly 56% 18% -7% -13% -43% 53% 44% -32% -15% -20% 74% 12%
7/2/2015
OWRR 13-14 Final, C&D Sheet Page 37 of 57

NON-MSW LANDFILLS (Construction/Demolition or Land Clearing and Inert Debris)CONSTRUCTION AND DEMOLITION LANDFILL (ORANGE COUNTY)
WI Jul-13 Aug-13 Sep-13 Oct-13 Nov-13 Dec-13 Jan-14 Feb-14 Mar-14 Apr-14 May-14 Jun-14Month Tons 0.00 0.00 0.00 0.00 0.00 0.00 0.00 0.00 0.00 0.00 2.00 0.00Y-T-D Tons 0.00 0.00 0.00 0.00 0.00 0.00 0.00 0.00 0.00 0.00 2.00 2.00
Last Year Monthly Tons 0.00 1.85 0.00 0.00 1.74 0.00 2.03 0.00 0.00 0.00 0.00 0.00% Incr./Decr. Monthly 0% None ThisMonth 0% 0% None ThisMonth 0% None ThisMonth 0% 0% 0%None Last Year This Month0%
UNC(OWRR rolloffs & UNC trucks) Jul-13 Aug-13 Sep-13 Oct-13 Nov-13 Dec-13 Jan-14 Feb-14 Mar-14 Apr-14 May-14 Jun-14Month Tons 16.09 0.00 1.84 0.00 19.40 0.00 5.31 0.99 0.24 3.79 7.98 0.00Y-T-D Tons 16.09 16.09 17.93 17.93 37.33 37.33 42.64 43.63 43.87 47.66 55.64 55.64
Last Year Monthly Tons 15.44 15.34 9.54 5.47 1.56 9.04 7.93 8.07 2.60 20.28 10.41 0.79% Incr./Decr. Monthly 4% None ThisMonth -81% None ThisMonth 1144% None ThisMonth -33% -88% -91% -81% -23% None ThisMonth
TOTAL C/D (ORANGE CO.) Jul-13 Aug-13 Sep-13 Oct-13 Nov-13 Dec-13 Jan-14 Feb-14 Mar-14 Apr-14 May-14 Jun-14Month Tons 16.09 0.00 1.84 0.00 19.40 0.00 5.31 0.99 0.24 3.79 9.98 0.00Y-T-D Tons 16.09 16.09 17.93 17.93 37.33 37.33 42.64 43.63 43.87 47.66 57.64 57.64
Last Year Monthly Tons 15.44 17.19 9.54 5.47 3.30 9.04 9.96 8.07 2.60 20.28 10.41 0.79% Incr./Decr. Monthly 4% None ThisMonth -81% None ThisMonth 488% None ThisMonth -47% -88% -91% -81% -4% None ThisMonth
7/2/2015
OWRR 13-14 Final, C&D Sheet Page 38 of 57

MIXED LOAD CONSTRUCTION WASTE PROCESSING FACILITIES (MRF)Wake Reclamation (Owned by Waste Industries) 421 Raleigh View Rd. Raleigh, NC 27610
Wake Reclamation--MRF Jul-13 Aug-13 Sep-13 Oct-13 Nov-13 Dec-13 Jan-14 Feb-14 Mar-14 Apr-14 May-14 Jun-14Month Tons (29.6% recycled) 0.00 0.00 0.00 0.00 3.66 0.00 0.00 0.00 0.00 0.00 0.00 0.00
Y-T-D Tons 0.00 0.00 0.00 0.00 3.66 3.66 3.66 3.66 3.66 3.66 3.66 3.66
Last Year Monthly Tons 2.86 0.00 0.00 5.78 0.00 0.00 0.00 0.00 2.77 0.00 0.00 0.00% Incr./Decr. Monthly None ThisMonth 0% 0% None ThisMonthNone Last Year This Month0% 0% 0% None ThisMonth 0% 0% 0%
RECYCLING TOTAL Jul-13 Aug-13 Sep-13 Oct-13 Nov-13 Dec-13 Jan-14 Feb-14 Mar-14 Apr-14 May-14 Jun-14
Month Tons 0.00 0.00 0.00 0.00 1.08 0.00 0.00 0.00 0.00 0.00 0.00 0.00
Y-T-D Tons 0.00 0.00 0.00 0.00 1.08 1.08 1.08 1.08 1.08 1.08 1.08 1.08
Last Year Monthly Tons 0.85 0.00 0.00 1.71 0.00 0.00 0.00 0.00 0.82 0.00 0.00 0.00% Incr./Decr. Monthly None ThisMonth 0% 0% None ThisMonthNone Last Year This Month0% 0% 0% None ThisMonth 0% 0% 0%
LANDFILL TOTAL Jul-13 Aug-13 Sep-13 Oct-13 Nov-13 Dec-13 Jan-14 Feb-14 Mar-14 Apr-14 May-14 Jun-14
Month Tons 0.00 0.00 0.00 0.00 2.58 0.00 0.00 0.00 0.00 0.00 0.00 0.00
Y-T-D Tons 0.00 0.00 0.00 0.00 2.58 2.58 2.58 2.58 2.58 2.58 2.58 2.58
Last Year Monthly Tons 2.01 0.00 0.00 4.07 0.00 0.00 0.00 0.00 1.95 0.00 0.00 0.00% Incr./Decr. Monthly None ThisMonth 0% 0% None ThisMonthNone Last Year This Month0% 0% 0% None ThisMonth 0% 0% 0%
Red Rock 7130 New Landfill Dr., Holly Springs, NCRed Rock Jul-13 Aug-13 Sep-13 Oct-13 Nov-13 Dec-13 Jan-14 Feb-14 Mar-14 Apr-14 May-14 Jun-14
Month Tons (xxx% recycled) 0.00 0.00 15.78 0.00 0.00 0.00 0.00 0.00 0.00 0.00 0.00 0.00Y-T-D Tons 0.00 0.00 15.78 15.78 15.78 15.78 15.78 15.78 15.78 15.78 15.78 15.78
Last Year Monthly Tons 0.00 0.00 0.00 0.00 0.00 0.00 0.00 0.00 0.00 0.00 0.00 53.38% Incr./Decr. Monthly 0% 0%None Last Year This Month0% 0% 0% 0% 0% 0% 0% 0% None ThisMonth
RECYCLING TOTAL Jul-13 Aug-13 Sep-13 Oct-13 Nov-13 Dec-13 Jan-14 Feb-14 Mar-14 Apr-14 May-14 Jun-14
Month Tons 0.00 0.00 15.78 0.00 0.00 0.00 0.00 0.00 0.00 0.00 0.00 0.00
Y-T-D Tons 0.00 0.00 15.78 15.78 15.78 15.78 15.78 15.78 15.78 15.78 15.78 15.78
Last Year Monthly Tons 0.00 0.00 0.00 0.00 0.00 0.00 0.00 0.00 0.00 0.00 0.00 0.00% Incr./Decr. Monthly 0% 0%None Last Year This Month0% 0% 0% 0% 0% 0% 0% 0% 0%
LANDFILL TOTAL Jul-13 Aug-13 Sep-13 Oct-13 Nov-13 Dec-13 Jan-14 Feb-14 Mar-14 Apr-14 May-14 Jun-14
Month Tons 0.00 0.00 0.00 0.00 0.00 0.00 0.00 0.00 0.00 0.00 0.00 0.00
Y-T-D Tons 0.00 0.00 0.00 0.00 0.00 0.00 0.00 0.00 0.00 0.00 0.00 0.00
Last Year Monthly Tons 0.00 0.00 0.00 0.00 0.00 0.00 0.00 0.00 0.00 0.00 0.00 0.00% Incr./Decr. Monthly 0% 0% 0% 0% 0% 0% 0% 0% 0% 0% 0% 0%
7/2/2015
OWRR 13-14 Final, C&D Sheet Page 39 of 57
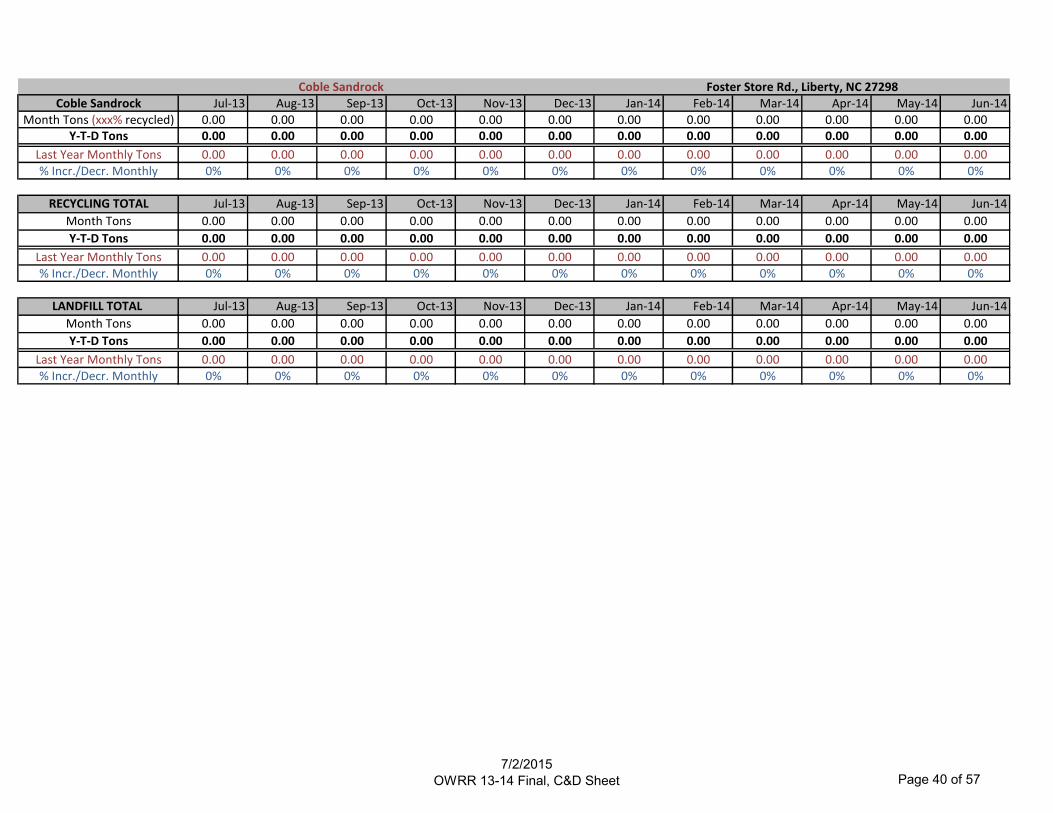
Coble Sandrock Foster Store Rd., Liberty, NC 27298Coble Sandrock Jul-13 Aug-13 Sep-13 Oct-13 Nov-13 Dec-13 Jan-14 Feb-14 Mar-14 Apr-14 May-14 Jun-14
Month Tons (xxx% recycled) 0.00 0.00 0.00 0.00 0.00 0.00 0.00 0.00 0.00 0.00 0.00 0.00Y-T-D Tons 0.00 0.00 0.00 0.00 0.00 0.00 0.00 0.00 0.00 0.00 0.00 0.00
Last Year Monthly Tons 0.00 0.00 0.00 0.00 0.00 0.00 0.00 0.00 0.00 0.00 0.00 0.00% Incr./Decr. Monthly 0% 0% 0% 0% 0% 0% 0% 0% 0% 0% 0% 0%
RECYCLING TOTAL Jul-13 Aug-13 Sep-13 Oct-13 Nov-13 Dec-13 Jan-14 Feb-14 Mar-14 Apr-14 May-14 Jun-14
Month Tons 0.00 0.00 0.00 0.00 0.00 0.00 0.00 0.00 0.00 0.00 0.00 0.00
Y-T-D Tons 0.00 0.00 0.00 0.00 0.00 0.00 0.00 0.00 0.00 0.00 0.00 0.00
Last Year Monthly Tons 0.00 0.00 0.00 0.00 0.00 0.00 0.00 0.00 0.00 0.00 0.00 0.00% Incr./Decr. Monthly 0% 0% 0% 0% 0% 0% 0% 0% 0% 0% 0% 0%
LANDFILL TOTAL Jul-13 Aug-13 Sep-13 Oct-13 Nov-13 Dec-13 Jan-14 Feb-14 Mar-14 Apr-14 May-14 Jun-14
Month Tons 0.00 0.00 0.00 0.00 0.00 0.00 0.00 0.00 0.00 0.00 0.00 0.00
Y-T-D Tons 0.00 0.00 0.00 0.00 0.00 0.00 0.00 0.00 0.00 0.00 0.00 0.00
Last Year Monthly Tons 0.00 0.00 0.00 0.00 0.00 0.00 0.00 0.00 0.00 0.00 0.00 0.00% Incr./Decr. Monthly 0% 0% 0% 0% 0% 0% 0% 0% 0% 0% 0% 0%
7/2/2015
OWRR 13-14 Final, C&D Sheet Page 40 of 57

MIXED LOAD CONSTRUCTION WASTE PROCESSINGTOTAL RECYCLED AND LANDFILLED
TOTAL Jul-13 Aug-13 Sep-13 Oct-13 Nov-13 Dec-13 Jan-14 Feb-14 Mar-14 Apr-14 May-14 Jun-14Month Tons 0.00 0.00 0.00 0.00 3.66 0.00 0.00 0.00 0.00 0.00 0.00 0.00Y-T-D Tons 0.00 0.00 0.00 0.00 3.66 3.66 3.66 3.66 3.66 3.66 3.66 3.66
% Incr./Decr. Monthly None ThisMonth 0% 0% None ThisMonthNone Last Year This Month0% 0% 0% None ThisMonth 0% 0% 0%Last Year Monthly Tons 2.86 0.00 0.00 5.78 0.00 0.00 0.00 0.00 2.77 0.00 0.00 0.00
MRF RECYCLE TOTAL Jul-13 Aug-13 Sep-13 Oct-13 Nov-13 Dec-13 Jan-14 Feb-14 Mar-14 Apr-14 May-14 Jun-14
Month Tons 0.00 0.00 0.00 0.00 1.08 0.00 0.00 0.00 0.00 0.00 0.00 0.00
Y-T-D Tons 0.00 0.00 0.00 0.00 1.08 1.08 1.08 1.08 1.08 1.08 1.08 1.08
Last Year Monthly Tons 0.85 0.00 0.00 1.71 0.00 0.00 0.00 0.00 0.82 0.00 0.00 0.00% Incr./Decr. Monthly None ThisMonth 0% 0% None ThisMonthNone Last Year This Month0% 0% 0% None ThisMonth 0% 0% 0%
MRF LANDFILL TOTAL Jul-13 Aug-13 Sep-13 Oct-13 Nov-13 Dec-13 Jan-14 Feb-14 Mar-14 Apr-14 May-14 Jun-14
Month Tons 0.00 0.00 0.00 0.00 0.00 0.00 0.00 0.00 0.00 0.00 0.00 0.00
Y-T-D Tons 0.00 0.00 0.00 0.00 0.00 0.00 0.00 0.00 0.00 0.00 0.00 0.00
Last Year Monthly Tons 0.00 0.00 0.00 0.00 0.00 0.00 0.00 0.00 0.00 0.00 0.00 0.00% Incr./Decr. Monthly 0% 0% 0% 0% 0% 0% 0% 0% 0% 0% 0% 0%
CONSTRUCTION AND DEMOLITION WASTE TOTALS--AMOUNT RECYCLED AND LANDFILLEDTOTAL C&D LANDFILLED Jul-13 Aug-13 Sep-13 Oct-13 Nov-13 Dec-13 Jan-14 Feb-14 Mar-14 Apr-14 May-14 Jun-14
Month Tons 16.09 0.00 1.84 0.00 19.40 0.00 5.31 0.99 0.24 3.79 9.98 0.00Y-T-D Tons 16.09 16.09 17.93 17.93 37.33 37.33 42.64 43.63 43.87 47.66 57.64 57.64
Last Year Monthly Tons 15.44 17.19 9.54 5.47 3.30 9.04 9.96 8.07 2.60 20.28 10.41 0.79% Incr./Decr. Monthly 4% None ThisMonth -81% None ThisMonth 488% None ThisMonth -47% -88% -91% -81% -4% None ThisMonth
TOTAL C&D RECYCLED Jul-13 Aug-13 Sep-13 Oct-13 Nov-13 Dec-13 Jan-14 Feb-14 Mar-14 Apr-14 May-14 Jun-14Month Tons 57.96 35.86 22.53 25.54 22.27 38.69 39.17 26.00 23.08 23.13 57.40 33.82Y-T-D Tons 57.96 93.82 116.35 141.89 164.16 202.85 242.02 268.02 291.10 314.23 371.63 405.45
Last Year Monthly Tons 37.98 30.29 24.28 31.19 36.88 25.29 27.23 38.15 28.03 29.01 32.93 30.18% Incr./Decr. Monthly 53% 18% -7% -18% -40% 53% 44% -32% -18% -20% 74% 12%
7/2/2015
OWRR 13-14 Final, C&D Sheet Page 41 of 57
7/2/2015
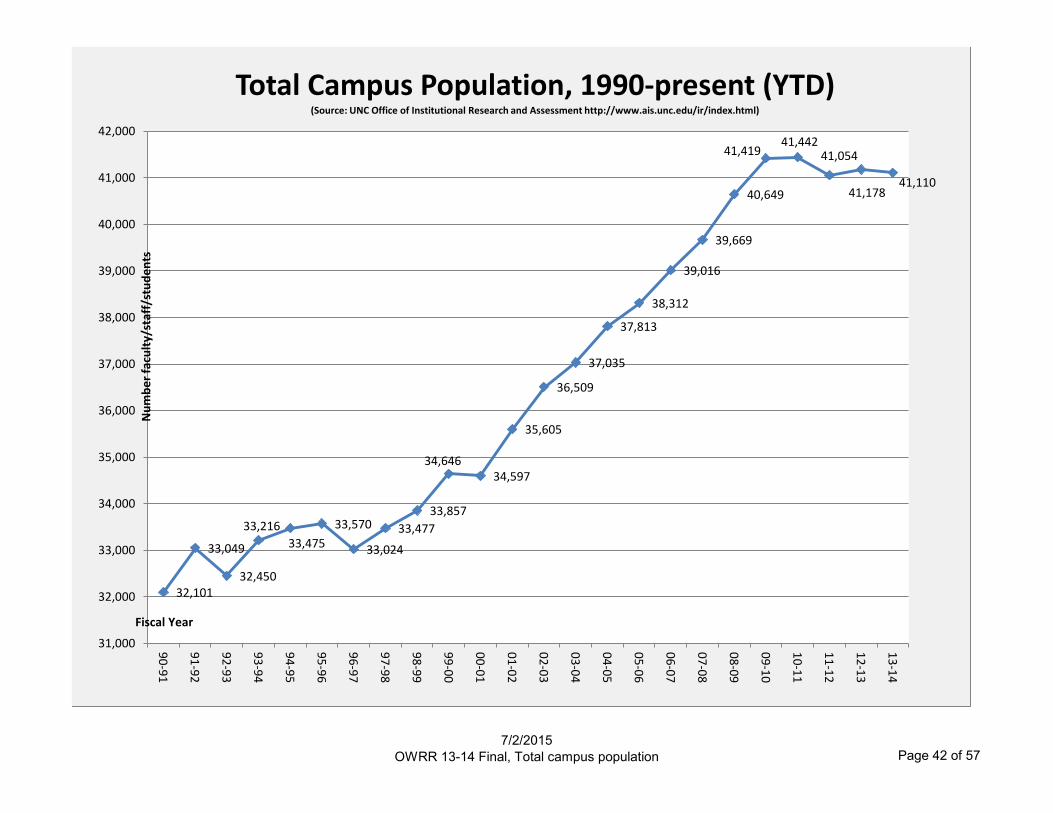
OWRR 13-14 Final, Total campus population Page 42 of 57
32,101
33,049
32,450
33,216
33,475
33,570
33,024
33,477
33,857
34,646 34,597
35,605
36,509
37,035
37,813
38,312
39,016
39,669
40,649
41,419 41,442
41,054
41,178 41,110
31,000
32,000
33,000
34,000
35,000
36,000
37,000
38,000
39,000
40,000
41,000
42,000
90
-91
91
-92
92
-93
93
-94
94
-95
95
-96
96
-97
97
-98
98
-99
99
-00
00
-01
01
-02
02
-03
03
-04
04
-05
05
-06
06
-07
07
-08
08
-09
09
-10
10
-11
11
-12
12
-13
13
-14
Nu
mb
er
facu
lty/
staf
f/st
ud
en
ts
Fiscal Year
Total Campus Population, 1990-present (YTD) (Source: UNC Office of Institutional Research and Assessment http://www.ais.unc.edu/ir/index.html)
7/2/2015
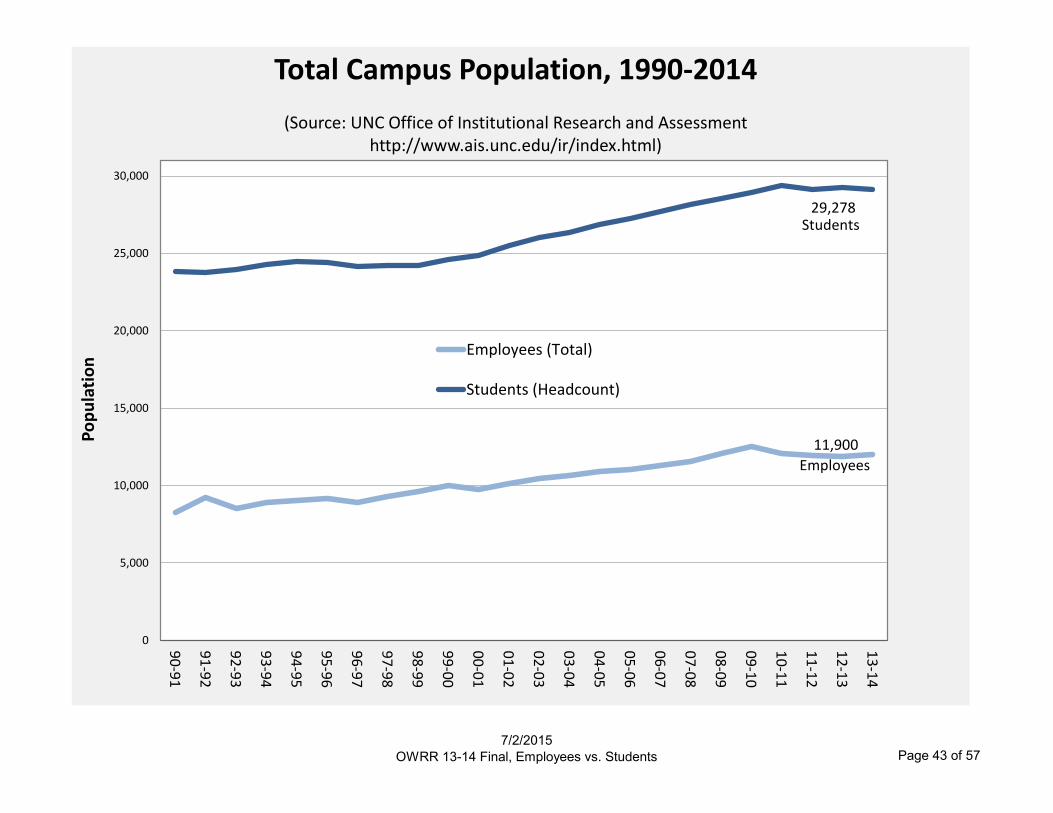
OWRR 13-14 Final, Employees vs. Students Page 43 of 57
11,900
29,278
0
5,000
10,000
15,000
20,000
25,000
30,000
90
-91
91
-92
92
-93
93
-94
94
-95
95
-96
96
-97
97
-98
98
-99
99
-00
00
-01
01
-02
02
-03
03
-04
04
-05
05
-06
06
-07
07
-08
08
-09
09
-10
10
-11
11
-12
12
-13
13
-14
Po
pu
lati
on
Total Campus Population, 1990-2014
(Source: UNC Office of Institutional Research and Assessment
http://www.ais.unc.edu/ir/index.html)
Employees (Total)
Students (Headcount)
Students
Employees

7/2/2015
OWRR 13-14 Final, per cap waste red frm base yr Page 44 of 57
70
.0
20
5.5
18
5.6
21
4.9
20
8.1
20
5.6
19
1.4
22
2.0
23
2.1
16
5.8
20
1.1
19
7.1
16
9.7
21
4.3
24
4.9
49
2.6
39
4.2
37
3.4
33
3.3
31
7.1
29
4.1
29
7.6
29
6.6
28
0.2
26
9.3
24
8.5
27
8.2
28
5.3
28
8.1
28
1.6
0.00
100.00
200.00
300.00
400.00
500.00
600.00
19
91
-19
92
(base
year)
20
00
-20
01
20
01
-20
02
20
02
-20
03
20
03
-20
04
20
04
-20
05
20
05
-20
06
20
06
-20
07
20
07
-20
08
20
08
-20
09
20
09
-20
10
20
10
-20
11
20
11
-20
12
20
12
-20
13
20
13
-20
14
Po
un
ds
Per Capita Waste & Recycling
Per capita waste landfilled (in lbs.) Per capita recycled (in lbs.)
7/2/2015
OWRR 13-14 Final, Per capita weights Page 45 of 57
0.0
50.0
100.0
150.0
200.0
250.0
300.0
350.0
400.0
450.0
500.0
550.0
600.0
650.0
700.0
90
-91
91
-92
92
-93
93
-94
94
-95
95
-96
96
-97
97
-98
98
-99
99
-00
00
-01
01
-02
02
-03
03
-04
04
-05
05
-06
06
-07
07
-08
08
-09
09
-10
10
-11
11
-12
12
-13
13
-14
lbs.
Fiscal Year
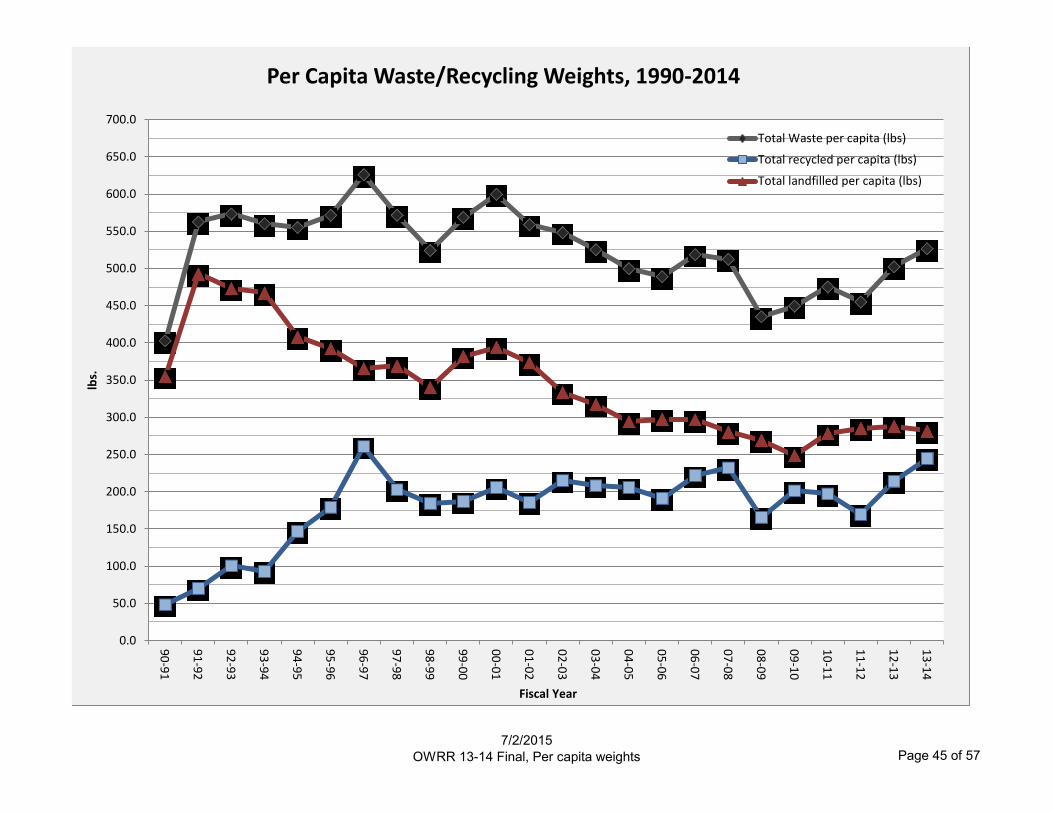
Per Capita Waste/Recycling Weights, 1990-2014
Total Waste per capita (lbs)
Total recycled per capita (lbs)
Total landfilled per capita (lbs)

7/2/2015
OWRR 13-14 Final, Per capita waste reduction Page 46 of 57
-100.0%
0.0%
100.0%
200.0%
300.0%
400.0%
500.0%
90
-91
91
-92
92
-93
93
-94
94
-95
95
-96
96
-97
97
-98
98
-99
99
-00
00
-01
01
-02
02
-03
03
-04
04
-05
05
-06
06
-07
07
-08
08
-09
09
-10
10
-11
11
-12
12
-13
13
-14
Pe
rce
nta
ge
Fiscal Year
Percentage Landfilled, Waste Reduction/Recycling Increase per Capita, 1990-2014
Per capita reduction in waste landfilled frombase year ('90)
Per capita increase in recycling from baseyear ('90)
1992: Drop in population may account for per capita waste reduction spike. 1996: Large spike is per capita waste reduction may be accounted for by a combination of factors--hurricane Fran, OWRR taking over cardboard recycling, and a drop in population. 1997-1999: Decrease in per capita waste reduction may be explained partially by the loss of the education/outreach position during those years . 2000: Increase in 2000 may be partially explained by beginning of food waste recycling program. 2001: Decrease in 2001 can be explained by Tidewater Fibre Corp. taking over outdoor contract and changing the way they report tonnage (actual as opposed to estimated weights). 2009: Decrease may have been due to a change in reporting of indoor recycling weights (from estimated to actual). 2011: Decrease may have been due to a change in reporting for yard waste (added actual and refined

7/2/2015
OWRR 13-14 Final, move-in Page 47 of 57
26
12 15 15
30
17
24 27 27 29 30
34 32 31
12 31%
26, 68%
8, 36%
7, 31%
26, 47%
15, 48%
15, 38%
23, 46%
22, 44%
28, 48% 22,
43%
23, 41% 23,
41% 18
0.6
2000 2001 2002 2003 2004 2005 2006 2007 2008 2009 2010 2011 2012 2013
Move-in Landfilled and Recycled In Tons
Tons landfilled Cardboard Polystyrene & Plastic Film
*Tonnages (Landfilled and Cardboard) = all move-in rolloff hauls and front load hauls from second haul during move-in days. **2000 and 2001 statistics compiled by Matt Todd; 2002-2006 stats compiled by Amy Preble and Jen Maxwell. 2007 & 2008 stats compiled by BJ Tipton ***More data was reported in 2004, due to changes in Waste Industries reporting and their truck making a second route specifically for move-in. ****A standardized formula was used to calculate move-in figures for 2006 - 2008.
38%

71 82
53 40
58 78
62 66 72
65 63
82
69
62
73 97 93 77
2 3
2 1
1 1 1
1
10
62 28 21
26
0.00
50.00
100.00
150.00
200.00
250.00
2006 2007 2008 2009 2010 2011 2012 2013 2014
Move Out Results
DonationStations and TarHeel Treasure
Metal or OtherRecycling
Rolloffs (MSWand C/D)
Front load(dumpsters)
TON
S
Note: In 2006, we used 100% of the second frontload run of the day. In 2007-2009, we adjusted our calculations to use a percentage of the second load and 100% of the third and fourth loads.
7/2/2015
OWRR 13-14 Final, move-out Page 48 of 57
0.00
20.00
40.00
60.00
80.00
100.00
120.00
2003 2004 2005 2006 2007 2008 2009 2010 2011 2012 2013 2014
cubic yards
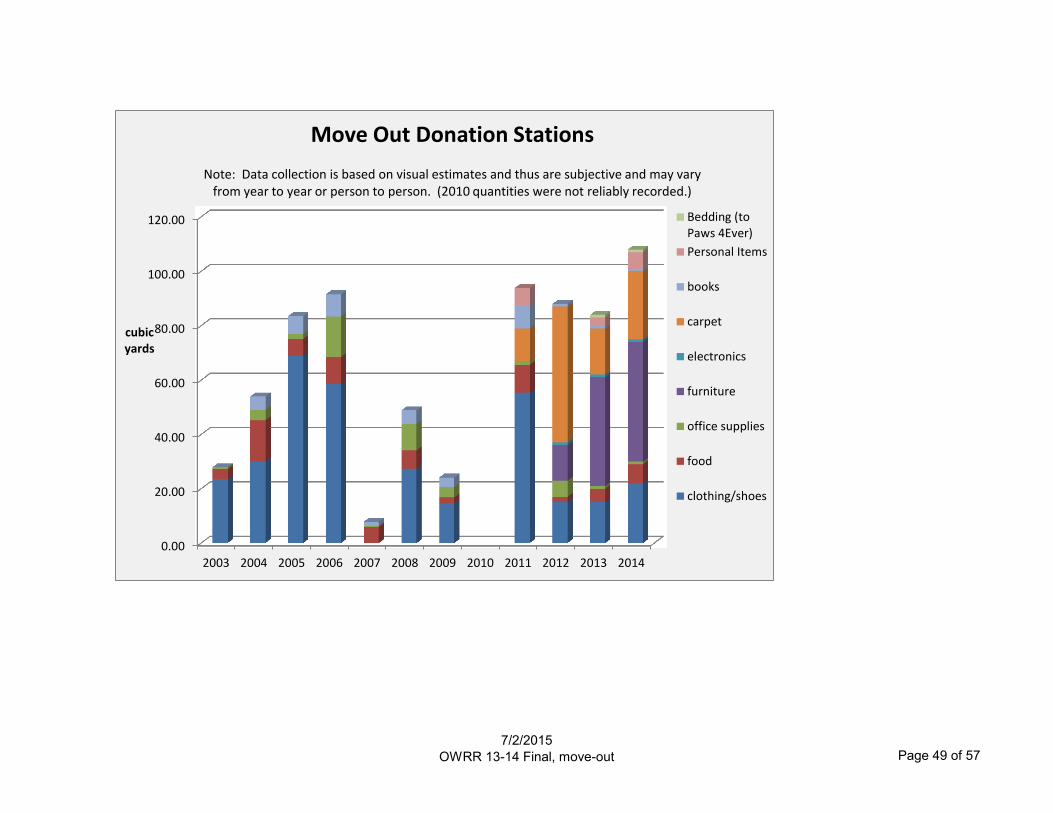
Move Out Donation Stations
Note: Data collection is based on visual estimates and thus are subjective and may vary from year to year or person to person. (2010 quantities were not reliably recorded.)
Bedding (toPaws 4Ever)
Personal Items
books
carpet
electronics
furniture
office supplies
food
clothing/shoes
7/2/2015
OWRR 13-14 Final, move-out Page 49 of 57

Kenan Football Stadium Fall 2013-- Game Day Waste & Recycling
Vs.Middle
Tennessee East Carolina Miami Boston College Virginia Old Dominion Duke
Game Time: 12:30pm 12:30pm 7:45pm 3:30pm 12:30pm 12:00pm 12:00pm
Approx. Attendance: 48,000 60,000 56,000 43,000 50,000 41,500 62,000
Game Date: 9/7/2013 9/28/2013 10/17/2013 10/26/2013 11/9/2013 11/23/2013 11/30/2013
Kenan Stadium: Weight in Tons Average Total
Trash 6.20 9.21 4.32 6.46 7.64 6.48 5.21 6.50 45.52
Bottles/Cups: 1.59 1.59 0.95 0.82 0.82 0.73 0.73 1.03 7.23
Cardboard: 0.96 0.68 0.86 1.10 0.54 0.54 0.54 0.75 5.22
Compost 0.27 0.27 0.27 1.07 0.27 0.27 0.27 0.38 2.69
540.00 540.00 540.00 2140.00 540.00 540.00 540.00 768.57 5380.00
Total Waste 9.02 11.75 6.40 9.45 9.27 8.02 6.75 8.67 60.66
Total Recycled 2.82 2.54 2.08 2.99 1.63 1.54 1.54 2.16 15.14
% Recycled by Weight 31% 22% 33% 32% 18% 19% 23% 25% 25%
Tailgate Bottles & Cans (in Tons): 0.21 0.18 0.00 0.13 0.13 0.18 0.16 0.14 0.98
S11 Lot and RV Lot (pounds) 210.00 129.00 0.00 119.00 129.00 210.00 190.00 141.00 987.00
3 Tier Lot (pounds) 70.00 97.00 0.00 70.00 56.00 70.00 56.00 59.86 419.00
Bell Tower Deck (pounds) 70.00 70.00 0.00 70.00 70.00 70.00 70.00 60.00 420.00
Stadium Drive (pounds) 70.00 70.00 0.00 0.00 0.00 0.00 0.00 20.00 140.00
Total Pounds: 420.00 366.00 0.00 259.00 255.00 350.00 316.00 280.86 1966.00
75%
12%
9%
4%
Kenan Stadium Average Trash, Recycling, and
Compost trash
bottles andcups
cardboard
compost
540 540 540
2,140
540 540 540
Pounds of Compost Per Home Game
0
500000
1000000
1500000
2000000
2500000
Tailgate Recycling Totals (in pounds)
7/2/2015
OWRR 13-14 Final, Kenan Football Stadium Page 50 of 57

Kenan Football Stadium Fall 2012-- Game Day Waste & Recycling
Vs. Elon ECU Idaho Virginia Tech NC State* Georgia Tech Maryland
Game Time: 12:30pm 3:30pm 3:30pm 12:30 12:30 12:30 3:00
Approx. Attendance: 50,500 59,500 32,000 54,000 62,000 50,000 44,000
Game Date: 9/1/2012 9/22/2012 9/29/2012 10/6/2012 10/27/2012 11/10/2012 11/24/2012
Kenan Stadium: Weight in tons average TOTAL
Trash 9.34 7.85 6.34 8.69 8.12 4.68 2.99 6.86 48.01
Bottles/Cups:1.12 0.50 0.36 0.36 0.73 0.73 0.53 0.62 4.33
Cardboard: 0.46 0.46 0.16 0.16 0.17 0.17 0.10 0.24 1.68
Compost 0.24 0.07 0.27 0.27 0.78 0.27 0.15 0.29 2.04
470.00 130.00 540.00 540.00 1560.00 540.00 300.00 582.86 4080.00
Total Waste 11.16 8.88 7.13 9.48 9.80 5.85 3.77 8.01 56.06
Total Recycled 1.82 1.03 0.79 0.79 1.68 1.17 0.78 1.15 8.05
% Recycled by weight 16% 12% 11% 8% 17% 20% 21% 15% 15%
Tailgate Bottles & Cans (in Tons): 0.27 0.20 0.08 0.20 0.27 0.23 0.16 0.20 1.40
Bowles Lot 0.13 0.10 0.06 0.18 0.17 0.13 0.13 0.13 0.90
S11 Lot and RV Lot 0.07 0.05 0.02 0.02 0.03 0.03 0.03 0.03 0.24
3-Tier lot 0.00 0.00 0.00 0.00 0.00 0.00 0.00 0.00 0.00
Bell Tower Deck 0.07 0.05 0.00 0.00 0.07 0.07 0.00 0.04 0.26
Total Pounds 540.00 400.00 157.00 403.00 536.00 453.00 313.00 400.29 2802.00
* Denotes Game Day Challenge Game
86%
8%
3%
3%
Kenan Stadium Average Trash, Recycling, and
Compost trash
bottles andcups
cardboard
compost
470
130
540 540
1,560
540 300
Pounds of Compost Per Home Game
0
100
200
300
400
500
600
S11 Lot and RV Lot 3-tier lot Bell Tower Deck
Tailgate Recycling Totals (in pounds)
7/2/2015
OWRR 13-14 Final, Kenan Football Stadium Page 51 of 57

7/2/2015
OWRR 13-14 Final, Fall FestPage 52 of 57
14.0
11.0
13.0
18.0
25.0
18.0
16.1
14.0 13.4
14.7
7.5
9.5
14.0
23.1 22.5
17.8
19.4
26.2 25.4
29.3
0
5
10
15
20
25
30
35
2003 2004 2005 2006 2007 2008 2009 2010 2011 2013
Cu
bic
Yar
ds Fall Fest
Trash & Recycling by Volume
Total Landfilled
Total RecycledAn increase in recycling for 2009 and 2010 can be seen because Pepsi distributed 12 oz. bottled beverages. In 2010, OWRR added mixed paper and plastic film to the materials collected
* 2012 Fall Fest was cancelled.*
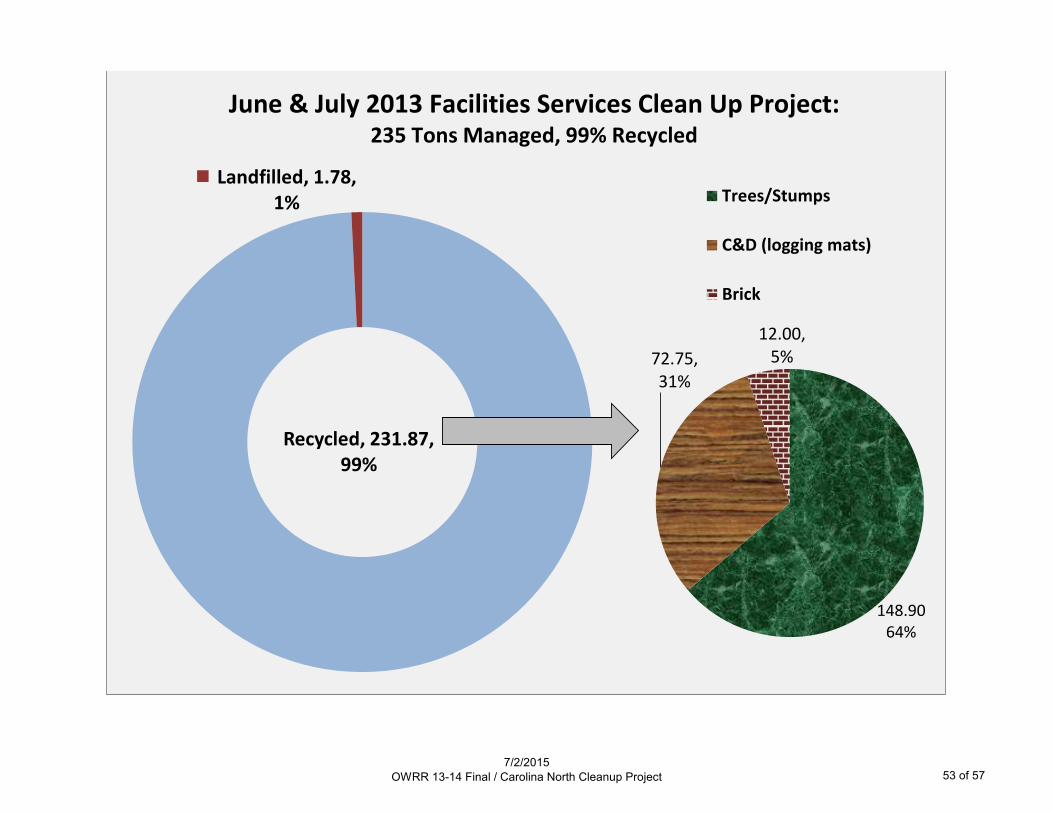
Recycled, 231.87, 99%
Landfilled, 1.78, 1%
June & July 2013 Facilities Services Clean Up Project: 235 Tons Managed, 99% Recycled
148.9064%
72.75, 31%
12.00, 5%
Trees/Stumps
C&D (logging mats)
Brick
7/2/2015
OWRR 13-14 Final / Carolina North Cleanup Project 53 of 57

7/2/2015
OWRR 13-14 Final, Surplus Property Page 54 of 57
9.7
15.1
12.6 12.2
8.7
7.9
4.6
9.8
8.9
10.1
7.4
11.4
0
2
4
6
8
10
12
14
16
July Aug Sept. Oct Nov Dec Jan Feb Mar Apr May June
FY 12-13 FY 13-14
Bulky Waste Landfilled from Surplus Property To
ns

7/2/2015
OWRR 13-14 Final, work orders Page 55 of 57
0
20
40
60
80
100
120
140
160
180
200
July Aug Sept Oct Nov Dec Jan Feb Mar April May June
42 43 56 53
35 33 27
44 37 39 42 46
29 23
28 25
24 16 23
21 23 16
34 31
1 0
2 1
3
1 0
1 1
1
2 1 7 9
14
2
6 16
10
10
5 25
53
8 12
30
15
32
14 21 21
27
15
49
51
15
Number of Work Orders Processed 2013-2014
OWRR (internal) Waste Industries (trash and cardboard)
Sonoco (outdoor recycling) Confidential Paper
Orange Recycling Services (indoor recycling)
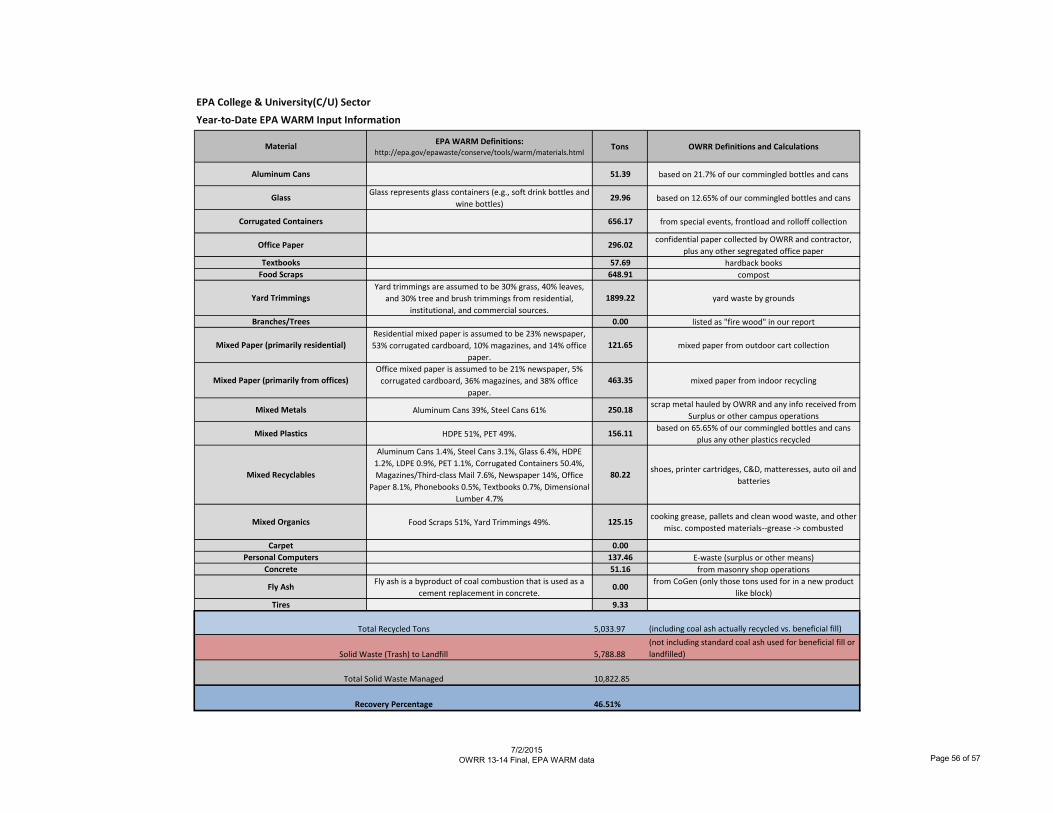
EPA College & University(C/U) Sector
Year-to-Date EPA WARM Input Information
MaterialEPA WARM Definitions:
http://epa.gov/epawaste/conserve/tools/warm/materials.htmlTons OWRR Definitions and Calculations
Aluminum Cans 51.39 based on 21.7% of our commingled bottles and cans
GlassGlass represents glass containers (e.g., soft drink bottles and
wine bottles)29.96 based on 12.65% of our commingled bottles and cans
Corrugated Containers 656.17 from special events, frontload and rolloff collection
Office Paper 296.02confidential paper collected by OWRR and contractor,
plus any other segregated office paper
Textbooks 57.69 hardback books
Food Scraps 648.91 compost
Yard Trimmings
Yard trimmings are assumed to be 30% grass, 40% leaves,
and 30% tree and brush trimmings from residential,
institutional, and commercial sources.
1899.22 yard waste by grounds
Branches/Trees 0.00 listed as "fire wood" in our report
Mixed Paper (primarily residential)
Residential mixed paper is assumed to be 23% newspaper,
53% corrugated cardboard, 10% magazines, and 14% office
paper.
121.65 mixed paper from outdoor cart collection
Mixed Paper (primarily from offices)
Office mixed paper is assumed to be 21% newspaper, 5%
corrugated cardboard, 36% magazines, and 38% office
paper.
463.35 mixed paper from indoor recycling
Mixed Metals Aluminum Cans 39%, Steel Cans 61% 250.18scrap metal hauled by OWRR and any info received from
Surplus or other campus operations
Mixed Plastics HDPE 51%, PET 49%. 156.11based on 65.65% of our commingled bottles and cans
plus any other plastics recycled
Mixed Recyclables
Aluminum Cans 1.4%, Steel Cans 3.1%, Glass 6.4%, HDPE
1.2%, LDPE 0.9%, PET 1.1%, Corrugated Containers 50.4%,
Magazines/Third-class Mail 7.6%, Newspaper 14%, Office
Paper 8.1%, Phonebooks 0.5%, Textbooks 0.7%, Dimensional
Lumber 4.7%
80.22shoes, printer cartridges, C&D, matteresses, auto oil and
batteries
Mixed Organics Food Scraps 51%, Yard Trimmings 49%. 125.15cooking grease, pallets and clean wood waste, and other
misc. composted materials--grease -> combusted
Carpet 0.00
Personal Computers 137.46 E-waste (surplus or other means)
Concrete 51.16 from masonry shop operations
Fly AshFly ash is a byproduct of coal combustion that is used as a
cement replacement in concrete.0.00
from CoGen (only those tons used for in a new product
like block)
Tires 9.33
5,033.97 (including coal ash actually recycled vs. beneficial fill)
5,788.88
(not including standard coal ash used for beneficial fill or
landfilled)
10,822.85
46.51%
Total Recycled Tons
Solid Waste (Trash) to Landfill
Total Solid Waste Managed
Recovery Percentage
7/2/2015
OWRR 13-14 Final, EPA WARM data Page 56 of 57