office of the chief government statistician zanzibar ... · pdf fileoffice of the chief...
TRANSCRIPT

OFFICE OF THE CHIEF GOVERNMENT STATISTICIAN
ZANZIBAR
PRELIMINARY STATISTICAL REPORT
Quick Figures 2014
GDP Growth Rate: 7.0 percent
GDP per Capita: 1,552,000 TZS
Inflation Rate: 5.6 percent
Population: 1.37M
Population Growth Rate: 2.8
May, 2015
ZANZIBAR SOCIO – ECONOMIC SURVEY 2014

i
Foreword
Economic Survey 2014 is prepared to inform and appraise the progress the country has
achieved on economic policies and programs that the Government of Zanzibar launched.
These have been designed to build a prosperous, modern and just Zanzibar has given higher
priority on the issue of financial inclusiveness so as to uplift the economic status of the
people and reduce poverty.
The Economic Survey 2014 reflects and narrates the evaluation of present situation, tracking
changes, assessing trends and appraising achievements with respect to socio-economic
environment.
The survey is prepared in an organized way, data tables are collated; and above all the report
is published to make it collectable and more useful to all stakeholders. It covers overall socio-
economic analysis, achievements and indicates challenges during the period of Survey. I am
confident that this survey will prove useful to serve as a handbook for policy makers,
intellectuals, professionals, researchers, teachers, students, industrialists, entrepreneurs, and
other people interested on keeping track of the country's economic development.
Finally, I would like to thank all those who were involved in the preparation of this Economic
Survey especially; the staff of the Office of the Chief Government Statistician, the concerned
officials of experts in specific areas of specialization. Likewise, I express my grateful thanks
to all the line Ministries, Departments, private sector, and other entities, which provided
necessary data, information and other details in the process of completing this task.
Mohammed H. Rajab
Chief Government Statistician,
Office of the Chief Government Statistician,
Zanzibar.
INQUIRIES
For further information contact the
Chief Government Statistician
Office of the Chief Government Statistician Zanzibar
P.O. Box 2321
Phone +255 24 22 31 869
Fax + 255 24 22 31 742
Email: [email protected]
Website: www.ocgs.go.tz

ii
Table of Contents
Foreword .................................................................................................................................... i
Table of Contents ...................................................................................................................... ii
List of Tables ........................................................................................................................... iii
List of Figures ........................................................................................................................ viii
Abbreviations: .......................................................................................................................... ix
Executive Summary .................................................................................................................. x
SECTION ONE: BACKGROUND .......................................................................................... 1
1.1 Introduction ......................................................................................................................... 1
1.2 Objectives ........................................................................................................................... 1
1.3 Methodology and Coverage ................................................................................................ 1
SECTION TWO: ECONOMIC STATISTICS ......................................................................... 3
2.1 National Accounts Estimates .............................................................................................. 3
2.2 Real Statistics .................................................................................................................... 11
2.2.1 Consumer Price Index .................................................................................................... 11
2.2.2 Tourism Statistics........................................................................................................... 14
2.2.3 Trade Statistics ............................................................................................................... 34
2.2.4 Transport Statistics......................................................................................................... 47
2.3 Production Statistics.......................................................................................................... 50
2.3.1 Agriculture Statistics ...................................................................................................... 50
2.3.2 Industry Statistics ........................................................................................................... 61
SECTION THREE: SOCIAL STATISTICS .......................................................................... 71
3.1 Education Statistics ........................................................................................................... 71
Table 3.1.24: Higher Learning Institution Enrolment, 2013-2014. ........................................ 87
Table 3.1.24: Higher Learning Institution Enrolment, 2013-2014. ........................................ 87
3.2 Health Statistics ................................................................................................................ 90
3.3 Information, Culture, and Sport Statistics....................................................................... 103
3.4 Recorded Road Accidents ............................................................................................... 110
3.5 Court Cases ..................................................................................................................... 117

iii
List of Tables Table 2.1.1: Summary Statistics, 2010 – 2014 ........................................................................................ 3
Table 2.1.2: Gross Domestic Product by Activity, 2010 – 2014, (Current Prices) ................................... 4
Table 2.1.3: Gross Domestic Product by Activity, 2010 -2014, (Percentage Shares).............................. 5
Table 2.1.4: Gross Domestic Product, 2010 – 2014, (Quantity Index) .................................................... 6
Table 2.1.5: Gross Domestic Product, 2010 – 2014, (Constant 2007 Price Growth Rates) .................... 7
Table 2.1.6: Gross Domestic Product 2010 – 2014, Implied Deflators (2007=100) ................................ 8
Table 2.1.7: Gross Domestic Product (GDP), 2010 – 2014, (Constant 2007 Prices) ............................... 9
Table 2.1.8: Capital Formation 2010 - 2014 .......................................................................................... 10
Table 2.2.1.1: Zanzibar Consumer Price Index (CPI), 2010 – 2014 ....................................................... 12
Table 2.2.1.2: Zanzibar Annual Inflation Rate, 2010 – 2014 ................................................................. 12
Table 2.2.1.3: Year-on-Year Inflation Rate for 2014 ............................................................................. 13
Table 2.2.1.4: Monthly to Month Inflation Rate for 2014 .................................................................... 13
Table 2.2.1.5: Monthly to Month Inflation Rate for 2014 .................................................................... 13
Table 2.2.2.1: Monthly Record of Tourist Arrival in Zanzibar by Nationality,2014 .............................. 16
Table 2.2.2.2: Tourists Arrival by Nationality and Sex in Zanzibar -2014 ............................................. 18
Table : Visitors' Arrival by Nationality and Sex through Airport -2014 ................................................. 19
Table : Visitors Arrival by Nationality and Sex through Seaport -2014 ................................................. 20
Table 2.2.2.3: Monthly tourists Arrival by Sex in Zanzibar -2014 ......................................................... 21
Table 2.2.2.4: Tourist Arrival by Month, 2010 – 2014 .......................................................................... 22
Table 2.2.2.5: Tourist Arrival by Age Group and Sex in Zanzibar, 2014 ................................................ 24
Table 2.2.2.6: Tourist Arrival by Nationality and Age Group in Zanzibar, 2014.................................... 25
Table 2.2.2.7: Tourist Arrival by Purpose of Visit and Sex through Airport and Seaport, .................... 27
2014 ...................................................................................................................................................... 27
Table 2.2.2.8: Tourist Arrival by Age and Purpose of Visit through Airport by International flight and
Seaport, 2014 ........................................................................................................................................ 28
Table 2.2.2.9: Monthly Tourist Arrival by Purpose of Visit through Airport by International flight and
Seaport, 2014 ........................................................................................................................................ 29
Table 2.2.2.10: Length of Stay and Sex of Tourist Arrivals in Zanzibar, 2014 ....................................... 30
Table 2.2.2.11: Approved Hotel/Guests by District and Grading in Zanzibar, 2014 ............................. 31
Table 2.2.2.12: Approved Hotel and Guest Houses by Grading, 2010 - 2014 ..................................... 32
Table 2.2.2.13: Number of Rooms and Beds in Approved Hotels and Guest Houses by District, 2010-
2014 ...................................................................................................................................................... 33
Table 2.2.3.1: Balance of Trade, 2010 – 2014 ....................................................................................... 35
Table 2.2.3.2: Value of Exports by Section, 2010 – 2014 ...................................................................... 37

iv
Table 2.2.3.3: Value of Exports by Country of Destination, 2010 – 2014 ............................................. 38
Table 2.2.3.4: Exports of Marine Product by Type of Product, 2010 – 2014 ........................................ 40
Table 2.2.3.5: Value of Direct Import by Section, 2010 – 2014 ........................................................... 42
Table 2.2.3.6: Direct Imports by Country of Origin, 2010 – 2014 ........................................................ 43
Table 2.2.3.7: Imports of Petroleum Products, 2012 – 2014 ................................................................ 44
Table 2.2.3.8: Imports of Selected Food Stuff, 2012 – 2014 ................................................................. 45
Table 2.2.3.9: Import Value from Tanzania Mainland and Transfer of Goods to Tanzania Mainland,
2010-2014 ............................................................................................................................................. 46
Table 2.2.4.1: Air Craft Movements, Passengers and Cargo Handled in Zanzibar Airports, 2014 ....... 47
Table 2.2.4 2: Traffic Handled at Zanzibar Seaport, 2013 - 2014 ......................................................... 47
Table 2.2.4.3: Traffic Handled at Zanzibar Seaport 2014 ...................................................................... 48
Table 2.2.4.4: Motor Vehicles registration, 2010- 2014 ....................................................................... 48
Table 2.2.4.5: Zanzibar Road Network (kilometres) as at December, 2013 ......................................... 49
Table 2.2.4.6: Number of Communication Providers, 2010 - 2014 ...................................................... 49
Table 2.3.1.1: Quantity and Value for Clove, 2012- 2014 ..................................................................... 50
Table 2.3.1.2: Quantity and Value of Production of Main Cash Crops, 2009- 2014 ............................. 52
Table 2.3.1.3: Area Planted (Acres) by Food Crops, 2010- 2014 .......................................................... 53
Table 2.3.1.4: Quantity and Value of Production of Food Crops, 2010- 2014 ...................................... 54
Table 2.3.1.5: Quantity and Value of Forest Products, 2010- 2014 ...................................................... 56
Table 2.3.1.6: Estimated Fish Catches and Value by District, 2010- 2014 ............................................ 57
Table 2.3.1.7: Estimated Fish Catches and Value by Species, 2010- 2014............................................ 59
Table 2.3.1.8: Estimated Quantity and Values of Seaweed by Species, 2013 - 2014 ........................... 60
Table 2.3.1.9: Number of Inspected and Slaughtered Animals, 2010 - 2014 ....................................... 61
Table 2.3.2.1: Production in Selected Private Industries (Quantity), 2010 – 2014 ............................... 64
Table 2.3.2.2: Value of Goods Produced for Selected Private Industries, 2010- 2014 ......................... 65
Table 2.3.2.3: Value of Goods Produced in Public Industries, 2010 - 2014 .......................................... 65
Table 2.3.2.4: Quantity of Electricity Distributed, 2010 – 2014 ........................................................... 66
Table 2.3.2.5: Value of Electricity Distributed, 2010 - 2014 ................................................................ 66
Table 2.3.2.6: Quantity of Electricity Distributed, 2014 ....................................................................... 67
Table 2.3.2.7: Value of Electricity Distributed, 2014 ........................................................................... 68
Table 2.3.2.8: Total Number of New Customers Connected to National ............................................. 68
Power Grid 2010 - 2014 ........................................................................................................................ 68
Table 2.3.2.9: Total Number of Boreholes Drilled from 2010 – 2014 .................................................. 68
Table 2.3.2.10: Water Supply and Revenue Collection by Region, 2014 ............................................. 69

v
Table 2.3.2.11: Approved Projects From 2010 - 2014 .......................................................................... 69
Table 2.3.2.12: Approved Capital, 2010 – 2014 .................................................................................... 70
Table 2.3.2.13: Approved Employment, 2011-2014 ............................................................................. 70
Table 3.1.1: Public and Private Education Facilities by Category, 2010- 2014 ..................................... 74
Table 3.1.2: Public Education Facilities by Category, 2010- 2014......................................................... 74
Table 3.1.3: Private Education Facilities by Category, 2010- 2014 ....................................................... 75
Table 3.1.4: STD I Enrolment in Public Schools by Sex, 2010- 2014 ..................................................... 75
Table 3.1.5: STD I Enrolment in Private School by Sex, 2010- 2014. .................................................... 75
Table 3.1.6: STD I Enrolment in Public and Private Schools by District, 2010 – 2014 .......................... 76
Table 3.1.7: Pupils in Public and Private Primary Schools, 2010- 2014. ............................................... 77
Table 3.1.8: Pupils in Public Primary Schools, 2010- 2014.................................................................... 77
Table 3.1.9: Pupils in Private Primary Schools by Grade and Gender, 2010- 2014. ............................. 78
Table 3.1.10: Distribution of Pupil in Public and Private Primary Schools by Grade and Gender, 2010-
2014. ..................................................................................................................................................... 78
Table 3.1.11: Pupils in Public and Private Secondary Schools, 2010- 2014. ........................................ 79
Table 3.1.12: Pupils in Public Secondary School, 2010- 2014. ............................................................. 79
Table 3.1.13: Pupils in Private Secondary Schools, 2010- 2014 ........................................................... 80
Table 3.1.14: Distribution of Pupils in Public and Private Secondary Schools by Sex and Form, 2010-
2014 ...................................................................................................................................................... 80
Table 3.1.15: Pupils in Public and Private Advanced Secondary Schools by Sex and Form, 2010- 2014
.............................................................................................................................................................. 81
Table 3.1.16: Distribution of Pupils in Public and Private Advanced Secondary Schools by Sex and
Form, 2010- 2014 .................................................................................................................................. 82
Table 3.1.17: Form II Examination Results, 2010- 2014........................................................................ 83
Table 3.1.18: Distribution of Form II Examination Results by Sex 2010-2014 ...................................... 83
Table 3.1.19: Form IV Examination Results by Sex and Grade, 2010- 2014. ........................................ 84
Table 3.1.20 Distribution of Form IV Examination Results by Sex and Grade, 2010- 2014 .................. 84
Table 3.1.21: Form VI Examination Results by Sex and Grade, 2009/10 – 2013/14 ............................ 85
Table 3.1.22 Distribution of Form VI Examination Results by Sex and Grade, 2009/2010 – 2013/2014
.............................................................................................................................................................. 85
Table 3.1.23: STD I - Form VI Pupil Teacher Ratio in Private and Public Schools, 2010- 2014 ............. 86
Table 3.1.25: Number of Graduates in Higher Institution Zanzibar, 2011-2014 .................................. 88
Table 3.1.26: STD I - Form VI Teachers in Public and Private Schools by Training, 2010- 2014 ......... 88
Table 3.1.27: STD I - Form VI Trained Teachers in Public Schools by Districts, 2010- 2014 ................. 89

vi
Table 3.2.1: Medical, Paramedical and Nursing Professionals, 2012-2014 (Number) ......................... 92
Table 3.2.2: Medical Facilities by Category, 2010- 2014 (Number) ................................................... 93
Table 3.2.3: Distribution of Public Health Facilities by District, 2014(Number) ................................... 93
Table 3.2.4: Number of In-Patients and Out-Patients in Public Hospital 2010-2014 ......................... 94
Table 3.2.5: In-patients and Out-patients by Public Hospital 2013 ..................................................... 94
Table 3.2.6: In-patients and Out-patients by Public Hospital 2014 (Number) .................................... 94
Table 3.2.7: Number of Live Birth in Public Hospital, 2013-2014 ......................................................... 95
Table 3.2.8: Number of Live Birth in Health Facility by District, 2013-2014 ......................................... 95
Table 3.2.9: Top Ten Reported Diagnosis, 2010-2014. ......................................................................... 96
Table 3.2.10: Reported Number of Dose Given 2010-2014.................................................................. 97
Table 3.2.11: Persons with Disability by District and Sex, 2014 ..................................................... 99
Table 3.2.12: Reported Number of Persons with Disability by Age Group and Type of Disability-
Zanzibar, 2014 ..................................................................................................................................... 100
Table 3.2.13: Children Cared by Type of Centre and Sex 2010- 2014 .......................................... 101
Table 3.2.14: Old People Cared by Type of Centre and Sex 2010- 2014 ............................................ 101
Table 3.2.15: Number of Sober Houses by Sex of Residents in Zanzibar, 2014.................................. 102
Table 3.2.16: Distribution of Clients in Each Sober House in Zanzibar 2014. ..................................... 102
Table 3.3.1: Number of Ruins and Caves Conserved by District 2014. ............................................... 104
Table 3.3.2: Number of Library Users of Kiswahili Council by Year and Sex. ..................................... 104
Table 3.3.3: Type of Sports Associations Registered by District in Unguja, 2014. ............................. 105
Table 3.3.4: Type of Sports Clubs Registered by District in Pemba, 2014 .......................................... 106
Table 3.3.5: Type of Medal won in the international Tournament, 2014 .......................................... 106
Table 3.3.6: Number of Referees by the Type of Sport and Sex, 2014 ............................................... 107
Table 3.3.7: Number of Referees by FIFA Badges and Sex, 2010- 2014. ............................................ 108
Table 3.3.8: Zanzibar Football Players’ Playing Outside Zanzibar, 2010- 2014. ................................. 109
Table 3.3.9: Number of Football Teams by Division, 2010- 2014. ...................................................... 109
Table 3.4.1: Reported Victims of Road Accidents Zanzibar, 2009- 2014 ............................................ 110
Table 3.4.2: Reported Victims of Road Accidents in Unguja, 2009- 2013 .......................................... 111
Table 3.4.3: Reported Victims of Road Accidents Pemba, 2009- 2013 .............................................. 111
Table 3.4.4: Offences Occurred by Type Case, 2013-14 ....................................................................... 112
Table 3.4.5: Number of Reported Offences against Person in Zanzibar 2013 – 2014 ........................ 112
Table 3.4.6: Reported Offences against Property in Zanzibar 2013 – 2014 ...................................... 113
Table 3.4.8: Number of Offences against Property Stolen and Recovered by Region ....................... 115
2013-2014 ........................................................................................................................................... 115

vii
Table 3.4.9: Number of Total Inmates by Age, 2013-2014 ................................................................. 115
Table 3.4.10: Number of Inmates by in Custody, 2013-2014 ............................................................ 116
Table 3.4.11: Number of Juvenile Inmates and Remands, 2013 - 2014 ............................................. 116
Table 3.4.12: Type of Correctional Programs Offered, 2013 - 2014 .................................................. 117
Table 3.4.13: Number of total Remands by Age, 2013 - 2014 .......................................................... 117
Total 3.5.1: Number of Judges and Lawyers, 2013 - 2014 .................................................................. 118
Table 3.5.2: Criminal Cases at the Juvenile, 2013 - 2014 .................................................................... 118
Table 3.5.3: Distribution of Criminal Case in the Regional Court, 2013-2014 .................................... 118

viii
List of Figures
Figure 1: The Trend of Annual Inflation Rates, 2012-2014 .................................................... 14
Figure 2: Tourist Arrival from Top ten Country, 2014 ............................................................ 22
Figure 3: Tourist Arrivals by Quarters, 2010 - 2014 ............................................................... 23
Figure 4: Monthly Tourist Arrivals, 2010 – 2014 ................................................................... 23
Figure 5: Record of Number of Rooms and Beds by grading, 2014 ....................................... 32
Figure 6: Trend of Imports and Exports Trade in Zanzibar, 2010 – 2014 ............................... 35
Figure 7: Exports to Main Countries, 2010-2014 .................................................................... 39
Figure 8: Imports from Main Countries, 2010 – 2014 ............................................................. 44
Figure 9: Imports of Petroleum Products, 2012 – 2014 ........................................................... 45
Figure 10: Imports of Selected Food Stuff, 2012 – 2014 ........................................................ 46
Figure 11: Clove Quarterly Purchase 2013 - 2014 .................................................................. 51
Figure 12: Rubber Production Trend 2013- 2014 .................................................................... 51
Figure 13: Estimated Fish Catch by Species, 2013 - 2014 ...................................................... 58
Figure 14: Quantity of Electricity Distributed, 2014 ............................................................... 67

ix
Abbreviations: ADO Assistant Dental Officer
AGO Automotive Gas Oil
AMO Assistant Medical Officer
BP British Petroleum
BOT Bank of Tanzania
BCG Bacillus Calmette Guenie
CECAFA Council of East and Central Africa Football Associations
CFS Consolidated Fund Services
CPI Consumer Price Index
DPTHD Diptteria Pertusis Tetanus Hepatitis (B)
FIFA Federation Internationale de Football Association (International Federation of
Association Football)
GAPCO Gulf Africa Petroleum Corporation
GDP Gross Domestic Products
HBS Household Budget Survey
IDO Industrial Diesel Oil
IK Illuminating Kerosene
ISIC International Standard of Industrial Classification
MD Medical Doctor
MDAs Ministries, Departments and Agencies
MDGs Millennium Development Goals
MDRI Multilateral Debt Relief Initiative
MKUZA Mkakati wa Kukuza Uchumi na Kupunguza Umasikini Zanzibar
MSP Motor Sprit Premium
N/A Not Applicable
OCGS Office of the Chief Government Statistician
OPV Oral Polio Vaccine
PHCC Primary Health Care Centre
PHCU Primary Health Care Unit
SAA South African Airline
SMEs Small Medium Enterprise
TB Treasury Bills/Bonds
TRA Tanzania Revenue Authorities
TT Tetanus Toxoid
TUKUZA Tumia Umeme Kwa Uangalifu Zanzibar (Prepaid Electricity Tariff)
URT United Republic of Tanzania
ZAWA Zanzibar Water Authority
ZECO Zanzibar Electrical Corporation
ZIPA Zanzibar Investments Promotion Authority
ZRB Zanzibar Revenue Board
ZSGRP Zanzibar Strategy for Growth and Reduction of Poverty
ZSTC Zanzibar State Trade Corporation

x
Executive Summary
The Economic Survey is an annual publication from Office of Chief Government Statistics.
The executive summary provides the statistical summary on various socio-economic
indicators for Zanzibar. Some figures in this edition may vary from those in the earlier
editions due to the updates. Some of the 2014 data presented in this edition are provisional
and could be revised in subsequent publication. The publication is divided into two sections
namely Economic and Social Statistics.
National Accounts
In 2014 GDP at constant (2007) market prices was estimated to grow by 7.0 percent. The
three broad sectors below registered growth as indicated;
Agriculture, forestry and fishing (-0.4 per cent)
Industry (6.0 per cent)
Services (9.8 per cent)
Consumer price Indices
Annual Headline inflation rate registered a single digit inflation rate of 5.6 percent in
2014 compared to inflation rate of 5.0 percent recorded in 2013
Annual Food inflation during 2014 increased to 4.4 from 1.8 percent recorded in 2013
During 2014 prices of some items such as Basmati Rice, Fish, Meat, Bananas and Diesel
contributed to increase for the inflation rate
Migration and Tourism
Total number of Tourist Arrived was 311,891 in 2014 compared to 181,301 recorded in
2013
Trade
Total value of export was Tsh. 133,591.7 million in 2014 compared to Tsh. 87,799.6
million in 2013
The leading Countries exported in 2014 were India, Comoro and Singapore,
Total value of Imports was Tsh. 279,552.8 million in 2013 compared to Tsh. 208,051.9
million in 2012

xi
The leading Countries Imported in 2014 were United Arab Emirates ,China, Australia
India, Pakistan, United Kingdom, Singapore, Turkey, Italy and Japan
Transport
Number of passengers at Seaports increased from 2,862,188 in 2013 to 2,996,782 in
2014
Number of Foreign Going Vessel increased to 194 in 2014 from 186 in 2013.
Number of trips enter/exit increased to 9,414 in 2014 from 4,083 in 2013.
Communications
In 2014, number of national radio stations increased to 19 from 16 in 2013
Agriculture
Total value of Clove was Tsh. 58,174 million in 2014 compared to Tsh. 78,781 million in
2013
Total value of Seaweed was Tsh 6,088 million compared to Tsh. 4,134 million in 2013
Total estimated value of fish Catch was Tsh 127,214 million compared to Tsh. 111,872
in 2013
Industrial Production
Production of bread increased from 127,815,000 bread in 2013 to 143,855,000 bread in
2014
Production of beverages slightly increased from 12,409,000 litres in 2013 to 12,448,000
litres in 2014
Production of window (UPVC) increased from 130 Pcs in 2013 to 270 Pcs in 2014
Electricity
Customers connected to National Power Grid slightly decreased from 10,684 in 2013 to
10,440 customers in 2014.
Distribution of electricity increased from 246,962,000 Kwh in 2013 to 273,258,000 Kwh
in 2014

xii
Section two discusses Social Statistics relating to Education, Health and Road accidents.
Below are the highlights of the Section:
Education
Pupils Enrolment Public schools standard one male was 18,170 in 2014
Pupils Enrolment Public schools standard one female was 17,365 in 2014
Total number of Enrolment in public school was 35,535 in 2014
Pupils Enrolment private schools standard one male was 2,149 in 2014
Pupils Enrolment private schools standard one female was 2,170 in 2014.
Total number of Enrolment in private school was 4319 in 2014
Total number of pupils in primary schools(Public and private) from standard I to VII
was 253,152 in 2014
Total number of candidates sit for form II examination was 21,944 in 2014
Total number of candidates who passed form II examination was 14,384 in 2014
Total number of candidates who failed form II examination was 7,560 in 2014
Total number of candidates sit for form IV examination was 12,812 in 2014
Total number of candidates who passed form IV examination was 7713 in 2014
Total number of candidates who failed form IV examination was 5,099 in 2014
Total number of candidates sit for form VI examination was 1,159 in 2014
Total number of candidates who passed form VI examination was 1,107 in 2014
Total number of candidates who failed form VI examination was 52 in 2014
Pupil teacher ratio in private and public school standard one to form IV in 2014 was
26
Total number of Teachers in Private school from standard one to from VI was 9,961
in 2014

xiii
Total number of Teacher in public school from standard one to from VI was 1,632 in
2014
Road Accident
Reported number of person died increased to 181 in 2014 from 141 persons died in
2013
Reported number of person injured decreased to 923 in 2014 from 1,041 persons in
2013
Reported number of traffic offences decreased to 10,078 in 2014 from 16,683 in 2013
Crime Statistics
Number of reported rape offences decreased to 109 in 2014 from 123 reported in
2013
Number of reported Armed Robbery was slightly increased to 5 in 2014 from 4
reported in 2013
Most of young age (18-30) are in prison (71.9 percent) compared to other age-groups
in 2014

1
SECTION ONE: BACKGROUND
1.1 Introduction
The 2014 Socio-Economic Survey Report is another series of annually survey conducted by
Office of the Chief Government Statistician containing data for socio-economic status for the
trend of five years 2010 to 2014. The report provides an insight into the country‟s economic
performance and impact of social services. These results will provide a better understanding
of the cause and impact of socio-economic initiatives in Zanzibar.
The purpose of this survey was to collect annual statistical information that will be used not
only for the budget preparation process but also as tools for the future development plans.
Furthermore, the results for the 2014 economic survey are essential for monitoring and
evaluation of the projects and programmes, specifically Zanzibar Strategy for Growth and
Reduction of Poverty (ZSGRP) in its Swahili acronym (MKUZA). The main sources of
statistical information covered in this report were Government institutions, Union institutions,
and private sectors operating in the Zanzibar territory.
1.2 Objectives
The overall objective of the economic survey was to collect and compile socio-economic data
to be used in the evaluation of socio-economic performance of the year 2014, and for the
planning process for the year 2015. Other objectives are:
To have a benchmarking data on all socio-economic sectors of the country
To provide information which will be used to monitor the broadest trend in a national
economic performance
To provide aggregate sectoral information on production of goods and services from
the economy
To provide socio-economic indicators used for monitoring and evaluation for Zanzibar
Strategy Growth and Reduction of Poverty (ZSGRP ) and Millennium Development
Goals (MDGs)
To remain as a main source of socio-economic data
1.3 Methodology and Coverage
The data collection for the 2014 socio-economic survey started earlier on December 2013 and
took about four months before its completion. The reference period of the information

2
collected is a calendar year, that is January to December, 2014. However, for some data and
other financial information, fiscal year, that is July 2013 to June 2014 was used as a reference
period.
Data were collected from both public and private sectors operating in Zanzibar through filled
questionnaires, emails and personal visit to the source by OCGS staff. Data for the year 2014
are marked with letter „p‟ means that they are still provisional and are subject for an update.

3
SECTION TWO: ECONOMIC STATISTICS
2.1 National Accounts Estimates
The Gross Domestic Products (GDP) represents the total market value of goods and services
produced in the country for the reference year after deducting the cost of goods and services
used in the process of production known as intermediate consumption. The 2014 GDP
estimates incorporate a major revision that was made through rebasing process by changing
the base year from 2001 to 2007. These revisions led to changes in GDP at current prices from
1,849.9 in 2013 to 2,133.5 billion TZS in 2014. The constant GDP growth rate is 7.0 per cent
in 2014 compared to 7.2 per cent in 2013. The growth rate of the major sectors namely
Industry and Services grew up by 6.0 and 9.8 percent respectively while Agriculture, Fishing
and Forest declined by 0.4 percent (Table 2.1.5). The per capita GDP went up from TZS
1,384,000 in the year 2013 to TZS 1,552,000 in the year 2014 equivalent to US Dollar of 866
in 2013 to 939 in 2014. The National Accounts estimates are presented in detail from table
2.1.1 to 2.1.8
Table 2.1.1: Summary Statistics, 2010 – 2014
2010 2011 2012 2013 2014p
GDP at market prices
At current prices (Billion shillings)
1,050.8
1,344.1
1,565.2
1,849.9
2,133.5
At constant 2007 prices (Billion
shillings)
848.2
927.5
972.8
1,042.9
1,115.4
Quantity index (2007=100) 115 126 132 142 152
Constant price growth rates (%) 4.3% 9.3% 4.9% 7.2% 7.0%
Implicit price deflators (2007=100) 124 145 161 177 191
GDP per capita at current prices
GDP per capita (Tshs '000) 856 1,065 1,205 1,384 1,552
GDP per capita (US $) 613 683 767 866 939
GDP per capita at constant 2007
prices
GDP per capita (Tshs '000) 691 735 749 780 811
GDP per capita (US $) 554 589 601 626 651
Memorandum items
Population ('000) 1,227 1,263 1,299 1,336 1,375
Exchange rate Tshs per US $ 1,396 1,557 1,572 1,599 1,653 Source: Office of the Chief Government Statistician
Note: p = provisional

4
Table 2.1.2: Gross Domestic Product by Activity, 2010 – 2014, (Current Prices)
(Billion Tanzanian Shillings)
2010 2011 2012 2013 2014p
GDP at market prices 1,050.8 1,344.1 1,565.2 1,849.9 2,133.5
Agriculture, forestry and fishing 306.2 438.9 466.4 562.1 595.2
Industries 182.2 229.9 288.1 332.6 359.4
Services 450.1 539.2 644.5 767.0 952.6
Adjustment to Market Prices 112.3 136.0 166.2 188.3 226.4
Agriculture, forestry and fishing
Crops 170.6 262.4 253.5 333.6 340.3
Livestock 37.3 44.7 53.5 56.8 59.9
Forestry 30.9 39.1 47.3 51.9 59.3
Fishing 67.3 92.8 112.0 119.7 135.7
Industries
Mining and quarrying 16.3 20.8 26.5 28.3 32.1
Manufacturing 76.4 85.4 110.6 128.9 136.0
Electricity and gas 3.8 4.9 5.8 6.6 6.8
Water supply and sewerage 4.1 4.9 6.0 10.7 16.4
Construction 81.5 113.9 139.2 158.0 168.1
Services
Trade and repairs 98.9 119.9 123.7 134.8 156.6
Transport and storage 48.7 57.1 67.6 86.5 84.3
Accommodation and food services 87.8 117.0 133.4 157.3 178.7
Accommodation 70.5 87.9 93.8 104.4 124.4
Food and beverage services 17.3 29.1 39.6 52.9 54.4
Information and communication 7.8 5.0 12.0 24.4 114.8
Financial and insurance activities 35.4 34.8 43.3 63.7 86.4
Real estate activities 60.8 69.7 85.3 112.8 146.3
Professional, scientific and technical 1.9 2.0 2.8 4.8 8.0
Administrative and support services 8.3 11.0 12.4 13.1 12.9
Public administration 63.9 76.5 109.1 118.2 109.0
Education 23.6 28.8 33.0 36.9 43.3
Human health and social work 11.0 13.7 18.1 19.3 20.5
Arts, entertainment and recreation 3.6 5.8 7.7 8.0 8.2
Other service activities 4.9 5.9 5.9 6.6 7.5
Domestic services 1.1 1.2 1.6 1.7 2.1
Less FISIM - 7.5 - 9.2 - 11.3 - 21.0 - 26.0
Adjustment to Market Prices
Taxes on products 112.3 136.0 166.2 188.3 226.4
Source: Office of the Chief Government Statistician

5
Table 2.1.3: Gross Domestic Product by Activity, 2010 -2014, (Percentage Shares)
2010 2011 2012 2013 2014p
GDP at market prices
Agriculture, forestry and fishing 29.3% 32.7% 29.8% 30.4% 27.9%
Industry 17.3% 17.1% 18.4% 18.0% 16.8%
Service 42.8% 40.1% 41.2% 41.5% 44.7%
Adjustment to Market Prices 10.7% 10.1% 10.6% 10.2% 10.6%
Agriculture, forestry and fishing
Crops 16.2% 19.5% 16.2% 18.0% 15.9%
Livestock 3.6% 3.3% 3.4% 3.1% 2.8%
Forestry 2.9% 2.9% 3.0% 2.8% 2.8%
Fishing 6.4% 6.9% 7.2% 6.5% 6.4%
Industry
Mining and quarrying 1.6% 1.5% 1.7% 1.5% 1.5%
Manufacturing 7.3% 6.4% 7.1% 7.0% 6.4%
Electricity and gas 0.4% 0.4% 0.4% 0.4% 0.3%
Water supply and sewerage 0.4% 0.4% 0.4% 0.6% 0.8%
Construction 7.8% 8.5% 8.9% 8.5% 7.9%
Service
Trade and repairs 9.4% 8.9% 7.9% 7.3% 7.3%
Transport and storage 4.6% 4.2% 4.3% 4.7% 4.0%
Accommodation and food services 8.4% 8.7% 8.5% 8.5% 8.4%
Accommodation 6.7% 6.5% 6.0% 5.6% 5.8%
Food and beverage services 1.6% 2.2% 2.5% 2.9% 2.5%
Information and communication 0.7% 0.4% 0.8% 1.3% 5.4%
Financial and insurance activities 3.4% 2.6% 2.8% 3.4% 4.1%
Real estate activities 5.8% 5.2% 5.5% 6.1% 6.9%
Professional, scientific and technical 0.2% 0.1% 0.2% 0.3% 0.4%
Administrative and support services 0.8% 0.8% 0.8% 0.7% 0.6%
Public administration 6.1% 5.7% 7.0% 6.4% 5.1%
Education 2.2% 2.1% 2.1% 2.0% 2.0%
Human health and social work 1.0% 1.0% 1.2% 1.0% 1.0%
Arts, entertainment and recreation 0.3% 0.4% 0.5% 0.4% 0.4%
Other service activities 0.5% 0.4% 0.4% 0.4% 0.3%
Domestic services 0.1% 0.1% 0.1% 0.1% 0.1%
Less FISIM -0.7% -0.7% -0.7% -1.1% -1.2%
Adjustment to Market Prices
Taxes on products 10.7% 10.1% 10.6% 10.2% 10.6% Source: Office of the Chief Government Statistician

6
Table 2.1.4: Gross Domestic Product, 2010 – 2014, (Quantity Index)
2010 2011 2012 2013 2014p
GDP at market prices 115.6 126.0 132.1 140.5 151.6
Agriculture, forestry and fishing 113.1 118.4 108.5 122.9 122.4
Industry 123.0 145.6 156.5 161.9 171.6
Service 116.0 125.6 131.6 137.6 151.2
Adjustment to market prices 105.6 115.8 154.5 176.3 194.2
Agriculture, forestry and fishing
Crops 116.9 118.9 97.1 119.2 110.7
Livestock 105.8 110.1 117.5 123.4 132.7
Forestry 110.6 114.8 119.2 123.4 128.1
Fishing 109.1 124.2 127.3 131.9 143.6
Industry
Mining and quarrying 143.8 170.2 191.9 184.9 193.9
Manufacturing 107.8 115.4 119.6 127.8 140.4
Electricity and gas 95.5 129.5 141.7 146.2 153.0
Water supply and sewerage 106.4 115.1 119.0 126.2 132.3
Construction 142.1 184.3 202.7 206.5 212.7
Service
Trade and repairs 87.4 94.1 84.3 86.7 98.0
Transport and storage 131.0 150.5 173.0 189.2 202.4
Accommodation and food services 96.3 113.7 115.4 126.4 135.1
Accommodation 96.3 108.5 104.8 107.5 116.9
Food and beverage services 96.1 136.3 161.5 208.6 214.6
Information and communication 157.2 178.0 199.3 172.7 215.0
Financial and insurance activities 144.5 153.1 164.7 173.1 191.5
Real estate activities 120.1 127.9 136.3 145.4 155.3
Professional, scientific and technical 136.6 131.9 160.1 236.7 339.4
Administrative and support services 112.1 122.9 129.0 137.1 138.3
Public administration 153.7 156.3 175.1 184.1 204.1
Education 109.1 115.0 120.1 121.7 125.5
Human health and social work 105.9 107.3 109.9 113.2 121.5
Arts, entertainment and recreation 108.2 118.3 117.4 126.2 133.6
Other service activities 108.3 117.0 116.9 124.6 131.3
Domestic services 109.9 113.5 117.1 120.9 124.6
Less FISIM 146.4 169.4 177.6 196.7 219.1
Adjustment to market prices
Taxes on products 105.6 115.8 154.5 176.3 194.2 Source: Office of the Chief Government Statistician

7
Table 2.1.5: Gross Domestic Product, 2010 – 2014, (Constant 2007 Price Growth Rates)
2010 2011 2012 2013 2014p
GDP at market prices 4.3% 9.3% 4.9% 7.2% 7.0%
Agriculture, forestry and fishing 3.3% 4.7% -8.3% 13.2% -0.4%
Industry 4.6% 18.4% 7.5% 3.5% 6.0%
Services 4.8% 8.3% 4.8% 4.6% 9.8%
Adjustment to market prices 3.4% 9.6% 33.4% 14.1% 10.2%
Agriculture, forestry and fishing
Crops 4.3% 1.7% -18.4% 22.9% -7.2%
Livestock 1.8% 4.0% 6.7% 5.1% 7.5%
Forestry 3.5% 3.8% 3.9% 3.5% 3.8%
Fishing 1.5% 13.9% 2.5% 3.6% 8.9%
Industry
Mining and quarrying 6.6% 18.4% 12.7% -3.6% 4.9%
Manufacturing 3.5% 7.0% 3.6% 6.9% 9.9%
Electricity and gas -4.7% 35.5% 9.5% 3.1% 4.7%
Water supply and sewerage 2.8% 8.2% 3.4% 6.0% 4.8%
Construction 5.7% 29.8% 9.9% 1.9% 3.0%
Services
Trade and repairs -1.1% 7.7% -10.4% 2.9% 13.0%
Transport and storage 16.4% 14.9% 14.9% 9.4% 7.0%
Accommodation and food services 1.8% 18.1% 1.5% 9.5% 6.9%
Accommodation 5.2% 12.6% -3.4% 2.6% 8.7%
Food and beverage services -10.5% 41.9% 18.5% 29.1% 2.9%
Information and communication 23.3% 13.3% 11.9% -13.3% 24.5%
Financial and insurance activities 14.5% 5.9% 7.6% 5.1% 10.6%
Real estate activities 6.4% 6.5% 6.6% 6.7% 6.8%
Professional, scientific and technical 9.3% -3.5% 21.4% 47.9% 43.4%
Administrative and support services -0.5% 9.7% 5.0% 6.2% 0.9%
Public administration -0.1% 1.7% 12.0% 5.2% 10.8%
Education 2.5% 5.5% 4.4% 1.4% 3.1%
Human health and social work 2.4% 1.3% 2.4% 3.0% 7.4%
Arts, entertainment and recreation 3.4% 9.3% -0.7% 7.5% 5.9%
Other service activities 3.3% 8.1% -0.1% 6.6% 5.3%
Domestic services 3.2% 3.2% 3.2% 3.2% 3.1%
Less FISIM 8.6% 15.7% 4.8% 10.8% 11.4%
Adjustment to market prices
Taxes on products 3.4% 9.6% 33.4% 14.1% 10.2% Source: Office of the Chief Government Statistician

8
Table 2.1.6: Gross Domestic Product 2010 – 2014, Implied Deflators (2007=100)
2010 2011 2012 2013 2014p
GDP at market prices 123.9 144.9 160.9 177.4 191.3
Agriculture, forestry and fishing 149.3 204.5 237.0 252.3 268.3
Industry 119.8 127.8 149.0 166.2 169.5
Services 108.8 120.3 137.3 156.3 176.7
Adjustment to market prices 145.1 160.4 146.8 145.8 159.0
Agriculture, forestry and fishing
Crops 147.0 222.3 263.1 281.8 309.7
Livestock 149.9 172.7 193.7 195.4 191.7
Forestry 132.4 161.4 188.2 199.7 219.5
Fishing 164.9 199.6 235.1 242.6 252.6
Industry
Mining and quarrying 134.7 144.8 164.1 181.7 196.6
Manufacturing 113.4 118.4 148.0 161.4 155.0
Electricity and gas 168.2 159.9 170.8 189.5 185.1
Water supply and sewerage 116.6 129.1 153.7 258.7 377.0
Construction 122.1 131.6 146.3 162.9 168.2
Services
Trade and repairs 133.1 149.7 172.5 182.6 187.9
Transport and storage 128.0 130.6 134.6 157.5 143.6
Accommodation and food services 141.2 159.4 179.0 192.6 204.8
Accommodation 139.3 154.1 170.4 184.8 202.5
Food and beverage services 149.4 177.4 203.5 210.3 210.4
Information and communication 27.9 15.7 33.7 79.3 299.4
Financial and insurance activities 94.6 87.7 101.7 142.1 174.4
Real estate activities 124.0 133.6 153.4 190.0 230.9
Professional, scientific and technical 129.3 143.5 165.1 191.5 222.9
Administrative and support services 146.8 176.9 188.8 189.1 184.4
Public administration 73.9 87.0 110.7 114.2 94.9
Education 108.5 125.8 137.9 152.3 173.2
Human health and social work 118.1 146.1 187.3 194.0 192.2
Arts, entertainment and recreation 120.3 177.0 237.9 230.3 221.8
Other service activities 93.2 102.5 103.6 108.0 116.3
Domestic services 100.0 102.8 133.0 133.3 167.0
Less FISIM 81.4 85.6 100.9 168.9 187.7
Adjustment to market prices
Taxes on products 145.1 160.4 146.8 145.8 159.0 Source: Office of the Chief Government Statistician

9
Table 2.1.7: Gross Domestic Product (GDP), 2010 – 2014, (Constant 2007 Prices)
(Billion Tanzanian Shillings)
2010 2011 2012 2013 2014p
GDP at market prices 848.3 927.5 972.8 1042.9 1115.5
Agriculture, forestry and fishing 205.1 214.6 196.8 222.8 221.8
Industry 152.0 179.9 193.4 200.1 212.0
Services 413.7 448.1 469.4 490.9 539.2
Adjustment to market prices 77.4 84.8 113.2 129.2 142.3
Agriculture, forestry and fishing
Crops 116.1 118.1 96.4 118.4 109.9
Livestock 24.9 25.9 27.6 29.0 31.2
Forestry 23.3 24.2 25.1 26.0 27.0
Fishing 40.8 46.5 47.6 49.4 53.7
Industry
Mining and quarrying 12.1 14.3 16.2 15.6 16.3
Manufacturing 67.4 72.1 74.7 79.9 87.7
Electricity and gas 2.3 3.1 3.4 3.5 3.7
Water supply and sewerage 3.5 3.8 3.9 4.1 4.3
Construction 66.7 86.6 95.2 97.0 99.9
Services
Trade and repairs 74.3 80.1 71.7 73.8 83.3
Transport and storage 38.0 43.7 50.2 54.9 58.7
Accommodation and food services 62.2 73.4 74.5 81.6 87.3
Accommodation 50.6 57.0 55.1 56.5 61.4
Food and beverage services 11.6 16.4 19.5 25.1 25.9
Information and communication 28.0 31.8 35.5 30.8 38.3
Financial and insurance activities 37.4 39.6 42.6 44.8 49.6
Real estate activities 49.0 52.2 55.6 59.3 63.4
Professional, scientific and technical 1.4 1.4 1.7 2.5 3.6
Administrative and support services 5.7 6.2 6.5 7.0 7.0
Public administration 86.5 88.0 98.5 103.6 114.8
Education 21.7 22.9 23.9 24.3 25.0
Human health and social work 9.3 9.4 9.6 9.9 10.7
Arts, entertainment and recreation 3.0 3.3 3.2 3.5 3.7
Other service activities 5.3 5.7 5.7 6.1 6.4
Domestic services 1.1 1.2 1.2 1.2 1.3
Less FISIM - 9.3 - 10.7 - 11.2 - 12.5 - 13.9
Adjustment to market prices
Taxes on products 77.4 84.8 113.2 129.2 142.3 Source: Office of the Chief Government Statistician

10
Table 2.1.8: Capital Formation 2010 - 2014
(Million Shillings)
2010 2011 2012 2013 2014p
Gross Fixed Capital Formation 303,207 380,845 491,059 510,804 469,610
Construction 190,826 258,589 324,308 353,186 288,550
Transport Equipment 48,462 62,608 81,570 68,837 79,069
Other Machinery and Equipment 63,115 57,456 83,554 86,741 99,746
Working Livestock 803 2,192 1,626 2,040 2,245
Changes in Inventories 4,047 4,908 1,311 4,746 5,551
Acquisitions less Disposals of Valuables 366 269 203 205 201
Capital Formation 307,620 386,022 492,573 515,755 475,362 Source: Office of the Chief Government Statistician

11
2.2 Real Statistics
2.2.1 Consumer Price Index
The Consumer Price Index (CPI) measures the average percentage changes over time
(between two time periods) in the prices of a ”basket” of consumer goods and services
acquired by households (the market basket). Zanzibar CPI measures price changes of
household expenditure from one period to the next while the market basket is based on
2009/10 Household Budget Survey.
Consumer Price Index is a very important indicator that guides decision-makers on national
developments and in particular it provides a yardstick for resource allocation in the society. In
addition Consumer Price index has the following uses:
To formulate fiscal and monetary policies
To adjust consumer's income payments
To make economic decisions
As a deflator in National Account estimates.
As indicators of purchasing power of money
To adjust currency values.
The headline Inflation rate measures Inflation rates when all items in the fixed basket are
included. The Annual Consumer Price Index (CPI) from 2010 to 2014 by twelve divisions and
its weights is based on Classification of Individual Consumption According by Purpose
(COICOP) (Table 2.2.1.1). In 2014 the movement of overall index increased to 109.2 from
103.4 reported in 2013. Food index increased to103.9 in 2014 from 99.5 in 2013, while non-
food index increased to 115.1 in 2014 from 107.8 in 2013. Movement of the overall inflation
rate in Zanzibar for the last two years has shown to be oscillating (Table 2.2.2.2). For
example, in 2014 inflation was 5.6 compared to 5.0 per cent in 2013.
The average annual inflation rate for 2014 is 5.6 compared to 5.0 reported in 2013, this result
implies that the average prices of goods and services during the period under review were
higher compared to prices reported in 2013 where average annual food is 1.8 percent and
average non-food inflation rate is 8.5 while in 2014 annual food inflation was 4.4 and non –
food inflation was 6.8. The 2009/10 HBS adjusted non- institutional expenditure revealed that
51.6 of households‟ budget were spent on food consumed at home and at restaurant. The main
non - food items in the market basket were household‟s utilities (17.1 per cent), clothing (9.3

12
per cent) and transport (6.3 per cent). The overall total household expenditure for non-food
items is 48.4 per cent where education and health have 1.3 per cent and 2.8 per cent
respectively.
Table 2.2.1.1: Zanzibar Consumer Price Index (CPI), 2010 – 2014
Description Weight
2004/05
(Base Dec 2005 =
100) Weight
2009/10
(Base Aug 2012 = 100)
2010 2011 2012 2013 2014
Food1 57.4 179.8 213.7 49.5 97.7 99.2 103.9
Alcohol2 0.6 199.9 223.6 0.3 96.0 107.3 108.8
Clothing3 6.2 133.3 150.5 9.3 97.5 110.1 116.0
Housing4 15.6 162.9 177.8 17.1 100.5 107.1 113.3
Furnishing,5 5.3 146.2 163.3 4.6 98.0 104.1 107.7
Health 2.1 169.8 203.8 2.8 97.3 102.8 104.2
Transport 3.4 155.9 176.3 6.3 101.3 104.5 106.5
Communication 2.4 94.0 95.4 2.6 99.8 118.3 166.7
Recreation and
culture 0.4 144.2 156.0 0.8 98.7 110.1 124.9
Education 1.1 143.8 151.7 1.3 100.3 116.0 132.5
Restaurants and
hotels 3.1 218.8 244.4 2.1 98.6 100.1 100.7
Miscellaneous6 2.4 138.2 126.2 3.2 99.3 113.0 120.7
Food 57.4 179.8 213.7 51.6 97.7 99.5 103.9
Non - Food 42.6 152.6 167.8 48.4 99.3 107.8 115.1
All Items 100.0 167.7 192.4 100.0 98.5 103.4 109.2 Source: Office of the Chief Government Statistician
Table 2.2.1.2: Zanzibar Annual Inflation Rate, 2010 – 2014
Description 2010 2011 2012 2013 2014
Food7 6.2 18.8 6.7 1.8 4.4
Non - Food 6.2 9.9 13.2 8.5 6.8
All Items 6.1 14.7 9.4 5.0 5.6
Source: Office of the Chief Government Statistician
1 Food and non-alcoholic beverages
2 Alcohol beverages, tobacco and narcotics
3 Clothing and footwear
4 Housing, water, electricity, gas, and other fuels
5 Furnishing, household equipment and routine household maintenance
6 Miscellaneous goods and services
7 Food consumed at home and restaurants

13
Table 2.2.1.3: Year-on-Year Inflation Rate for 2014
Description
Weight
2009/10 Jan Feb Mar Apr May Jun Jul Aug Sep Oct Nov Dec
Food 51.6 3.0 3.3 4.0 3.5 7.0 7.2 2.2 5.3 6.4 3.0 3.1 4.4
Non-Food 48.4 9.0 7.7 7.6 7.4 7.3 9.1 9.3 5.8 5.0 4.9 4.4 4.4
All Items 100.0 5.8 5.3 5.6 5.3 7.0 8.0 5.9 5.9 6.0 3.9 3.8 4.4
Source: Office of the Chief Government Statistician
Table 2.2.1.4: Monthly to Month Inflation Rate for 2014
Description
Weight
2009/10 Jan Feb Mar Apr May Jun Jul Aug Sep Oct Nov Dec
Food 51.6 4.5 0.2 1.1 2.0 1.2 -1.0 1.4 -0.1 -1.7 -2.0 0.2 -1.4
Non-Food 48.4 1.0 0.0 0.2 0.7 0.3 1.2 1.3 -0.1 -0.3 0.0 -0.1 0.1
All Items 100.0 2.8 0.1 0.6 1.3 0.8 0.1 1.4 -0.1 -1.0 -1.0 0.1 -0.7
Source: Office of the Chief Government Statistician
Table 2.2.1.5: Monthly to Month Inflation Rate for 2014
MAIN GROUPS
Weights
2009/10
Index, 2014
Jan Feb Mar Apr May Jun Jul Aug Sep Oct Nov Dec
Food 49.5 100.9 101.2 102.3 105.0 106.4 105.3 107.2 107.0 104.8 102.6 102.8 101.3
Alcohol 0.3 108.5 108.5 104.5 104.5 104.3 104.3 109.1 112.6 112.6 112.6 112.6 112.6
Clothing 9.3 115.8 115.6 115.2 115.2 115.5 116.3 116.6 116.7 116.4 116.6 116.0 116.3
Housing 17.1 111.7 111.6 111.7 111.7 112.2 115.1 114.8 114.5 114.1 114.1 114.1 114.4
Furnishing, 4.6 105.2 105.8 106.5 107.3 107.4 107.5 108.7 108.8 108.8 108.8 108.9 109.0
Health 2.8 104.4 104.4 104.1 104.1 104.1 104.1 104.1 104.1 104.3 104.3 104.3 104.3
Transport 6.3 105.3 105.6 105.6 105.6 105.9 107.3 107.9 108.0 106.8 106.8 106.9 106.9
Communication 2.6 151.2 151.2 151.2 151.2 151.2 151.2 183.9 183.9 183.9 183.9 183.9 183.9
Recreation and
culture 0.8 124.8 124.8 124.8 125.0 125.0 125.0 125.0 125.0 125.0 125.0 125.0 125.0
Education 1.3 128.8 128.8 133.9 133.9 133.9 133.9 133.9 133.9 132.3 132.3 132.3 132.3
Restaurants and
hotels 2.1 100.8 100.6 100.8 100.9 100.6 101.4 93.5 102.3 102.2 101.9 101.7 102.2
Miscellaneous 3.2 119.6 119.6 120.1 120.2 120.2 120.3 120.6 120.9 121.5 121.7 121.8 121.6
FOOD 51.6 101.5 101.7 102.8 104.8 106.2 105.1 106.6 106.5 104.7 102.6 102.8 101.3
NON - FOOD 48.4 112.7 112.8 112.9 113.7 114.0 115.4 117.0 116.8 116.5 116.5 116.4 116.6
ALL ITEM 100.0 106.8 106.9 107.6 109.1 109.9 110.0 111.5 111.3 110.2 109.1 109.2 108.4
Source: Office of the Chief Government Statistician

14
Figure 1: The Trend of Annual Inflation Rates, 2012-2014
2.2.2 Tourism Statistics
Zanzibar tourism has been an instrument in socio-economic development of the Country, due
to the commitment and careful planning of the Zanzibar government, the tourism sector has a
potential to greatly contribute to the strengthening of the fundamentals of the economy to
enable the country control her plentiful opportunities. It is also one of fastest growing service
sector of the economy and a major foreign exchange earner.
Tourist Arrivals Trend by Mode of Transport
Tourist arrivals refer to persons who are non-Tanzanian residents entering Zanzibar using any
of the two formal entry points namely Airport and Seaport. The international tourists
registered for the year 2014 reached 311,891 arrivals which is a very huge increase compared
to 181,301 arrivals recorded in 2013. This incline is due to the increase of the data collection
coverage whereby tourist arrivals that were coming by domestic flights from different areas of
Tanzania Mainland were previously uncovered. In 2014, The Department of Immigration in
collaboration with Zanzibar Commission for Tourism and The Office of Chief Government
Statistician have started collecting the data for the tourists who entered Zanzibar by domestic
flights from Tanzania Mainland. Even if the arrivals for domestic flights would be excluded,
the number of arrival in 2014 still remains to be the highest to be recorded.

15
About 34.7 percent of all arrivals entered Zanzibar through Airport by international flights,
31.9 percent by domestic flights and the remaining 33.4 entered through Seaport.
Europe continued to dominate the market by recording 191,641 arrivals which is equivalent to
61.4 percent for the total arrivals. Tourist arrivals from Italy continued to be a leading market
for the European and other Continents. Italians was representing 23.1 percent for the
European market. The performances in tourist arrivals noted from other European countries:
Scandinavia 11.3 percent, United Kingdom 10.7 percent, Germany 14.7 percent, France 11.8
percent, Dutch 5.8 percent, Belgium 3.7 percent, Russia 1.6 percent, Turkey 1.2 percent,
Poland 1.7 percent, Czech Republic 1.3, Spain 3.7 percent and other European countries 9.3
percent. Russia and Czech Republic recorded the least number of tourist arrivals from
European continent.
Tourist arrivals from Asia reached 25,279 which represented 8.1 percent of total tourist
arrivals. China is the leading market source in Asian Continent that accounting 23.6 percent
for Asian arrivals. The performances in arrivals from Asian countries were as follows: Japan
6.4 percent, India 16.1 percent, Israel 15.1 percent and other Asian countries 38.8 percent.
African continent is the second largest tourism market in Zanzibar. A total of 35,308 arrivals
that accounted 11.3 percent of total arrivals arrived from Africa. Arrivals from Republic of
South Africa were the major market of the region that accounted to about 41.3 percent. This
was followed by our neighbour, Kenya that represent 31.0 percent of the arrival from African
region while the arrival from the remaining other African countries accounted 27.7.
American region captured 9.4 percent share which is equal to 29,451 of the total arrivals while
Oceania is the last region which recorded 8,070 equal to 2.6 percent of the total arrival.
About 7.1 of the arrivals could not be identified which country were from since they did not
respond to the question, hence it was difficult to allocate their continents.

16
Table 2.2.2.1: Monthly Record of Tourist Arrival in Zanzibar by Nationality,2014 Nationality 2014 2014
January February March April May June July August September October November December
EUROPE
Scandinavian 3,289 4,741 1,471 905 540 1,133 2,885 1,196 787 1,745 1,405 1,633 21,730
British 1,281 2,199 873 1,066 824 1,851 2,797 3,327 2,118 1,807 1,216 1,165 20,524
German 2,326 4,705 1,861 994 1,101 2,012 2,200 3,718 3,238 2,647 1,919 1,394 28,115 Italian 6,291 7,720 4,160 570 469 676 3,237 6,882 3,306 3,124 2,653 5,153 44,241
French 2,462 3,941 2,432 912 1,012 1,163 2,022 3,254 1,370 1,736 1,247 1,142 22,693
Dutch 971 1,235 496 283 405 589 1,535 1,675 1,082 1,147 924 808 11,150 Belgium 442 745 566 375 210 323 1,417 845 676 649 319 556 7,123
Russian 708 405 250 144 231 194 216 269 184 201 130 156 3,088
Turkish 409 438 83 112 186 183 186 118 102 314 134 99 2,364 Polish 355 697 174 91 73 133 209 233 207 176 572 243 3,163
Czech Republic 443 585 444 134 70 91 171 126 99 90 230 87 2,570 Spanish 273 307 182 244 518 709 1,054 2,026 921 507 235 123 7,099
Other European Country 2,088 2,679 954 634 541 984 2,581 1,910 1,511 1,557 1,281 1,061 17,781
Subtotal 21,338 30,397 13,946 6,464 6,180 10,041 20,510 25,579 15,601 15,700 12,265 13,620 191,641
ASIA
Japanese 163 315 111 57 89 77 151 214 195 83 74 97 1,626
Chinese 510 734 281 306 390 383 1,142 1,023 268 347 264 314 5,962 Indian 335 377 247 269 422 482 409 350 299 318 205 348 4,061
Israeli 68 182 77 344 47 84 176 397 669 1,169 57 548 3,818
Other Asian 993 1,069 728 612 794 970 980 1,493 579 534 504 556 9,812
Subtotal 2,069 2,677 1,444 1,588 1,742 1,996 2,858 3,477 2,010 2,451 1,104 1,863 25,279
AFRICA
Kenyan 562 668 493 987 655 855 966 1,418 829 660 711 2,145 10,949 South African 795 902 1,168 1,477 877 1,331 1,493 1,082 1,418 1,166 1,036 1,850 14,595
Other African 749 1,109 497 689 694 685 791 1,139 747 836 684 1,144 9,764
Subtotal 2,106 2,679 2,158 3,153 2,226 2,871 3,250 3,639 2,994 2662 2,431 5,139 35,308
AMERICA
American 1,601 1,893 1,223 749 1,222 2,344 3,234 2,375 1,360 1,279 1,180 1,313 19,773
Canadian 868 1,089 435 236 346 472 742 623 486 569 462 513 6,841 Other American 486 341 170 144 162 163 351 218 267 179 171 185 2,837
Subtotal 2,955 3,323 1,828 1,129 1,730 2,979 4,327 3,216 2,113 2,027 1,813 2,011 29,451
OCEANIA Australian 944 690 208 236 273 530 740 594 730 529 345 500 6,319
New Zealand 181 132 44 48 75 137 396 244 172 169 77 76 1,751
Subtotal 1,125 822 252 284 348 667 1,136 838 902 698 422 576 8,070
Not stated 243 99 75 87 125 1,252 1,064 2,338 1,962 4,251 5,377 5,269 22,142
All Countries (2014) 29,836 39,997 19,703 12,705 12,351 19,806 33,145 39,087 25,582 27,789 23,412 28,478 311,891
All Countries (2013) 20,905 18,017 15,354 6,880 6,509 11,172 14,514 18,118 14,510 16,510 15,614 23,198 181,301
Source: Zanzibar Commission for Tourism and Department of Immigration

17
Sex of Tourist Arrivals
The table 1.2.2.2 shows that majority of arrivals were females in year 2014 than males. Females were about 2.8 percent more than males. It
further shows that there were only more males in Asia and African continents but the remaining continents were dominated by females. Within
male arrivals, Italy recorded the highest number of male which is equivalent to 13.8 percent followed by German and France (8.8 and 7.2 percent
respectively).
Within Female arrivals, Italy still had the highest number of Female which is equal to 14.6 percent followed by German and Scandinavia
countries (9.2 and 7.7 percents respectively)

18
Table 2.2.2.2: Tourists Arrival by Nationality and Sex in Zanzibar -2014
Nationality 2014
EUROPE Male Female Total
Scandinavian 9,316 12,414 21,730
British 9,953 10,571 20,524
German 13,386 14,729 28,115
Italian 20,867 23,374 44,241
French 10,978 11,715 22,693
Dutch 5,422 5,728 11,150
Belgium 3,471 3,652 7,123
Russian 1,514 1,574 3,088
Turkish 1,470 894 2,364
Polish 1,532 1,631 3,163
Czech Republic 1,248 1,322 2,570
Spanish 3,362 3,737 7,099
Other European Country 8,342 9,439 17,781
Subtotal 90,861 100,780 191,641
ASIA
Japanese 862 764 1,626
Chinese 3,526 2,436 5,962
Indian 2,852 1,209 4,061
Israeli 1,875 1,943 3,818
Other Asian 6,244 3,568 9,812
Subtotal 15,359 9,920 25,279
AFRICA
Kenyan 5,883 5,066 10,949
South African 7,046 7,549 14,595
Other African 5,598 4,166 9,764
Subtotal 18,527 16,781 35,308
AMERICA
American 8,852 10,921 19,773
Canadian 3,012 3,829 6,841
Other American 1,365 1,472 2,837
Subtotal 13,229 16,222 29,451
OCEANIA
Australian 2,714 3,605 6,319
New Zealand 871 880 1,751
Subtotal 3,585 4,485 8,070
Not stated 9,980 12,162 22,142
All Countries 151,541 160,350 311,891
Source: Zanzibar Commission for Tourism and Department of Immigration

19
Table : Visitors' Arrival by Nationality and Sex through Airport -2014
Nationality International flight Domestic flight Grand
total EUROPE Male Female Total Male Female Total
Scandinavian 1,740 2,150 3,890 4,463 5,566 10,029 13,919
British 2,389 2,342 4,731 3,737 4,061 7,798 12,529
German 3,130 3,259 6,389 5,651 6,029 11,680 18,069
Italian 13,175 14,973 28,148 1,776 1,879 3,655 31,803
French 3,460 3,755 7,215 5,039 5,632 10,671 17,886
Dutch 1,227 1,319 2,546 2,092 2,196 4,288 6,834
Belgium 1,118 1,227 2,345 1,388 1,411 2,799 5,144
Russian 306 347 653 834 863 1,697 2,350
Turkish 49 45 94 601 535 1,136 1,230
Polish 406 434 840 554 635 1,189 2,029
Czech Republic 690 761 1,451 255 291 546 1,997
Spanish 449 542 991 2,229 2,504 4,733 5,724
Other European Country 1,601 1,996 3,597 4,077 4,491 8,568 12,165
Subtotal 29,740 33,150 62890 32,696 36,093 68,789 131,679
ASIA
Japanese 81 81 162 265 292 557 719
Chinese 417 261 678 1,345 1,170 2,515 3,193
Indian 610 230 840 547 359 906 1,746
Israeli 559 570 1,129 535 522 1,057 2,186
Other Asian 2,305 1,371 3,676 763 627 1,390 5,066
Subtotal 3,972 2,513 6,485 3,455 2,970 6,425 12,910
AFRICA
Kenyan 2,225 1,930 4,155 244 191 435 4,590
South African 2,791 3,207 5,998 965 902 1,867 7,865
Other African 1,526 1,169 2,695 1,027 918 1,945 4,640
Subtotal 6,542 6,306 12,848 2,236 2,011 4,247 17,095
AMERICA
American 1,135 1,381 2,516 4,774 5,958 10,732 13,248
Canadian 363 441 804 1,542 1,999 3,541 4,345
Other American 208 249 457 738 786 1,524 1,981
Subtotal 1,706 2,071 3,777 7,054 8,743 15,797 19,574
OCEANIA
Australian 334 422 756 1,163 1,489 2,652 3,408
New Zealand 112 131 243 504 512 1,016 1,259
Subtotal 446 553 999 1,667 2,001 3,668 4,667
Not stated 9,493 11,658 21,151 232 286 518 21,669
All Countries(2014) 51,899 56,251 108,150 47,340 52,104 99,444 207,594
Source: Zanzibar Commission for Tourism/OCGS

20
Table : Visitors Arrival by Nationality and Sex through Seaport -2014
Nationality 2014
EUROPE Male Female Total
Scandinavian 3,113 4,698 7,811
British 3,827 4,168 7,995
German 4,605 5,441 10,046
Italian 5,916 6,522 12,438
French 2,479 2,328 4,807
Dutch 2,103 2,213 4,316
Belgium 965 1,014 1,979
Russian 374 364 738
Turkish 820 314 1,134
Polish 572 562 1,134
Czech Republic 303 270 573
Spanish 684 691 1,375
Other European Country 2,664 2,952 5,616
Subtotal 28425 31,537 59,962
ASIA
Japanese 516 391 907
Chinese 1,764 1,005 2,769
Indian 1,695 620 2,315
Israeli 781 851 1,632
Other Asian 3,176 1,570 4,746
Subtotal 7,932 4,437 12,369
AFRICA
Kenyan 3,414 2,945 6,359
South African 3,290 3,440 6,730
Other African 3,045 2,079 5,124
Subtotal 9,749 8,464 18,213
AMERICA
American 2,943 3,582 6,525
Canadian 1,107 1,389 2,496
Other American 419 437 856
Subtotal 4,469 5,408 9,877
OCEANIA
Australian 1,217 1,694 2,911
New Zealand 255 237 492
Subtotal 1,472 1,931 3,403
Not stated 255 218 473
All Countries(2014) 52,302 51,995 104,297
Source: Zanzibar Commission for Tourism/OCGS

21
Monthly tourists Arrivals by Sex
The table 2.2.2.3 depicts that February is the peak month for 2014 tourism season. It recorded
about 39,997 arrivals which is accounting 12.8 percent of all arrival who entered Zanzibar in
2014. This is followed by August and July representing 12.5 and 10.6 percents respectively.
With the exception of May whereby males were higher than females, the remaining months
were dominated by females. This indicates that females have higher preference to visit
Zanzibar than Males.
Table 2.2.2.3: Monthly tourists Arrival by Sex in Zanzibar -2014
Male Female Total
Total 151,550 160,341 311,891
January 14,737 15,099 29,836
February 19,477 20,520 39,997
March 9,625 10,078 19,703
April 6,313 6,392 12,705
May 6,377 5,974 12,351
June 9,899 9,907 19,806
July 15,910 17,235 33,145
August 18,960 20,127 39,087
September 12,466 13,116 25,582
October 12,335 15,454 27,789
November 11,430 11,982 23,412
December 14,021 14,457 28,478 Source: Zanzibar Commission for Tourism and Department of Immigration
Tourists’ Arrival from Top ten Markets
Tourists‟ arrival from top ten markets was about 200,893 which accounted for 64.4 percent of
total tourist arrivals in 2014. Figure 2 shows most of the countries that appeared in the top ten
markets are European countries. There is a need for the Zanzibar Commission for Tourism to
widen its tourism advertisement in Far East, America and other Non-European countries so
that more tourists can be attracted to visit Zanzibar.

22
Figure 2: Tourist Arrival from Top ten Country, 2014
Source: Office of the Chief Government Statistician
Tourist Arrivals in Zanzibar from, 2010 - 2014
Fo the period of five years, tourist arrivals in Zanzibar has been fluctuating from one year to
another. The highest peak was noticed in 2014. The figure 3 below illustrate that there is a
high increase in tourist arrival in 2014. All quarters for each year illustrate the same trend
except for the year 2014, the last quarter portrays the highest arrival instead of the third
quarter. However, in the period of five years from 2010 to 2014, Zanzibar on average
received 194,064 arrivals through both entry points.
Table 2.2.2.4: Tourist Arrival by Month, 2010 – 2014
Month 2010 2011 2012 2013 2014
January 12,315 18,334 18,988 20,905 29,836
February 11,883 17,405 18,354 18,017 39,997
March 8,767 13,272 13,680 15,354 19,703
1st Quarter 32,965 49,011 51,022 54,276 89,536
April 4,787 7,188 7,612 6,880 12,705
May 4,452 5,173 5,859 6,509 12,351
June 7,272 8,118 10,483 11,172 19,806
2nd Quarter 16,511 20,479 23,954 24,561 44,862
July 13,422 18,861 14,752 14,514 33,145
August 16,357 22,470 19,380 18,118 39,087
September 12,071 16,072 13,439 14,510 25,582
3rd Quarter 41,850 57,403 47,571 47,142 97,814
October 11,365 13,592 15,590 16,510 27,789
November 11,507 13,911 12,889 15,614 23,412
December 18,638 20,671 18,197 23,198 28,478
4th Quarter 41,510 48,174 46,676 55,322 79,679
Total 132,836 175,067 169,223 181,301 311,891 Source: Zanzibar Commission for Tourism and Department of Immigration

23
Figure 3: Tourist Arrivals by Quarters, 2010 - 2014
Source: Office of the Chief Government Statistician
Figure 4: Monthly Tourist Arrivals, 2010 – 2014
Source: Office of the Chief Government Statistician

24
Tourist Arrival by Age group and Sex in Zanzibar, 2014
The majority of the tourist arrivals (28 percent) were in the age group 25-29 and 30-34 years,
while those aged 65+ tourists (senior citizens) has recorded a lower of about 6.1 percent. This
implies that there is a need to attract the senior group as they have ample time for leisure and
high disposable income. In order to attract the senior tourists, the Government should improve
infrastructure like road and airport services and other facilities to cater for this market
segments.
Generally, females have dominated the tourist arrivals in which on average females
constituted 51.4 percent while males represented 48.6 percent. Within males, those aged 30-
34 years have dominated by accounting 15.4 percent of all male arrivals followed by those
who were in the age group 25-29 years (13.9 percent). In the case of females, the trend
reversed compared to that of males, the age group 25-29 took the leading which is equal 15.5
percent followed by those who were in the age group 30-34 which are representing 13.3
percent.
Table 2.2.2.5: Tourist Arrival by Age Group and Sex in Zanzibar, 2014
Age Male Female Total
Total 151,541 160,350 311,891
0 - 4 1,331 1,225 2,556
5 - 9 2,184 2,052 4,236
10 - 14 4,686 4,613 9,299
15 - 19 6,483 8,048 14,531
20 - 24 9,769 15,928 25,697
25 - 29 18,874 24,890 43,764
30 - 34 20,906 21,372 42,278
35 - 39 15,478 14,037 29,515
40 - 44 14,286 13,493 27,779
45 - 49 14,160 14,069 28,229
50 - 54 14,749 14,808 29,557
55 - 59 10,211 9,715 19,926
60 - 64 8,016 7,420 15,436
65+ 10,408 8,680 19,088 Source: Zanzibar Commission for Tourism and Department of Immigration

25
Table 2.2.2.6: Tourist Arrival by Nationality and Age Group in Zanzibar, 2014
Nationality 0 - 4 5 - 9 10 - 14 15 - 19 20 - 24 25 - 29 30 - 34 35 - 39 40 - 44 45 - 49 50 - 54 55 - 59 60 - 64 65 + Total
EUROPE
Scandinavian 139 328 825 1,444 3,350 3,063 2,002 1,375 1,325 1,622 1,905 1508 1,308 1,536 2,1730
British 229 391 666 1,249 2,207 2,872 2,624 1,496 1,454 1,564 1,745 1,302 1,185 1,540 2,0524
German 86 192 539 1,100 2,129 3,657 3,351 1,839 1,809 2,858 3,508 2,527 1,881 2,639 2,8115
Italian 557 1,043 1,208 1,277 2,423 4,942 5,536 4,808 4,838 4,687 4,568 3,013 2,342 2,999 4,4241
French 172 335 938 1,104 983 3,249 3,033 1,929 2,189 2,286 2,321 1,673 1,210 1,271 2,2693
Dutch 67 90 412 518 1,068 1,851 1,272 772 700 975 1,167 892 683 683 1,1150
Belgium 59 101 284 405 547 915 736 485 641 827 852 542 374 355 7123
Russian 15 28 74 86 159 555 582 405 380 284 252 146 72 50 3088
Turkish 9 6 33 53 101 279 458 442 337 225 190 129 57 45 2364
Polish 21 24 104 81 144 339 450 383 425 332 290 237 196 137 3163
Czech Republic 17 47 70 50 121 282 300 312 271 247 265 232 178 178 2570
Spanish 22 38 146 211 243 984 1,671 1,021 663 627 671 413 216 173 7099
Other European Country 82 127 438 587 1,358 2,746 2,759 1,793 1,380 1,515 1,666 1,261 942 1,127 1,7781
Subtotal 1,475 2,750 5,737 8,165 14,833 25,734 24,774 17,060 16,412 18,049 19,400 13,875 10,644 12,733 19,1641
ASIA
Japanese 9 9 17 40 167 321 308 216 149 96 54 68 44 128 1626
Chinese 27 69 153 169 515 933 1,026 661 721 589 479 293 174 153 5962
Indian 49 78 104 128 240 621 690 533 508 337 276 179 139 179 4061
Israeli 40 57 152 209 375 636 462 293 323 343 322 229 168 209 3818
Other Asian 149 180 247 391 722 1,228 1,342 1,000 920 837 973 719 537 567 9812
Subtotal 274 393 673 937 2,019 3,739 3828 2,703 2,621 2,202 2,104 1,488 1,062 1,236 2,5279
AFRICA
Kenyan 285 318 357 428 812 1672 1,758 1,408 1,214 890 720 458 272 357 1,0949
South African 106 233 386 454 990 2471 2,131 1,560 1,581 1,389 1,364 869 516 545 1,4595
Other African 155 138 248 361 787 1708 1,742 1,335 1003 752 630 382 281 242 9,764

26
Nationality 0 - 4 5 - 9 10 - 14 15 - 19 20 - 24 25 - 29 30 - 34 35 - 39 40 - 44 45 - 49 50 - 54 55 - 59 60 - 64 65 + Total
Subtotal 546 689 991 1,243 2,589 5,851 5,631 4,303 3,798 3,031 2,714 1,709 1,069 1,144 35,308
AMERICA
American 126 219 532 994 1,993 2,941 2,817 1,534 1,281 1,256 1,345 1,238 1,282 2,215 19,773
Canadian 33 37 154 242 519 959 937 465 407 445 638 621 579 805 6,841
Other American 11 18 74 121 216 524 569 331 224 177 193 148 115 116 2,837
Subtotal 170 274 760 1,357 2,728 4,424 4,323 2,330 1,912 1,878 2,176 2,007 1,976 3,136 29,451
OCEANIA
Australian 16 43 102 260 821 1,092 798 405 331 352 521 552 462 564 6,319
New Zealand 10 9 79 111 155 275 203 114 90 144 174 131 102 154 1,751
Subtotal 26 52 181 371 976 1,367 1,001 519 421 496 695 683 564 718 8070
Not stated 65 78 957 2,458 2,552 2,649 2,721 2,600 2,615 2,573 2,468 164 121 121 2,2142
All Countries(2014) 2,556 4,236 9,299 14,531 25,697 43,764 42278 29,515 27,779 28,229 29,557 19,926 15,436 19,088 311,891
Source: Zanzibar Commission for Tourism and Department of Immigration

27
Tourist Arrivals by Purpose of Visit
Table 2.2.2.7 shows that the majority of tourists arrivals (83.8 percent) came in Zanzibar for
leisure/holidays followed by those who were visiting friends and relatives representing (4.7
percent). Business and conference arrivals recorded a minimal of only 1 percent. This
indicates that Zanzibar has no big and standard conference centres for conducting
international conferences. Thus, Zanzibar Revolutionary Government in collaboration with
tourism investors should establish and improve international conference centres and make
sure that the centres have all important conference facilities.
The category „others‟ includes those who came for voluntary activities and those who were
not listed in the table below. About 9.6 percent of the arrival did not respond in this question.
Table 2.2.2.7: Tourist Arrival by Purpose of Visit and Sex through Airport and Seaport,
2014
Purpose of Visit
Total Male Female
212,447 104,201 108,246
Returning resident 451 235 216
Prospective resident 126 69 57
Seeking employment 85 44 41
Temporary employment 405 248 157
Visiting friends and relatives 9,964 5,184 4,780
Holidays 178,008 86,628 91,380
Business and conference 2,091 1,422 669
In transit 333 193 140
others 629 359 270
Not defined 20,355 9,819 10,536 Source: Zanzibar Commission for Tourism and Department of Immigration
NOTE: The table above does not include the data from the domestic flight due to the absence
of this variable in the designed form that are filled by tourists who came Zanzibar by domestic
flight

28
Tourist Arrival by Age and Purpose of Visit through Airport and Seaport
Majority of the tourists came for holidays. Arrival aged 25-29 years dominated within this group which is equal to 15 percent followed by age
group 30-34 years, those two are strong labour force groups while those aged 65+ tourists (senior citizens) has recorded a lower of about 4.1
percent. The special efforts are required to attract 65+ years since they are the big spender compared to other age groups.
Table 2.2.2.8: Tourist Arrival by Age and Purpose of Visit through Airport by International flight and Seaport, 2014
Age Returning
resident
Prospective
resident
Seeking
employment
Temporary
employment
Visiting
friends and
relatives
Holidays
Business
and
conference
In
transit others
Not
defined Total
Total 451 126 85 405 9,964 178,008 2,091 333 629 20,355 212,447
0 - 4 14 0 2 0 192 1,879 6 4 4 196 2,297
5 - 9 14 8 3 2 269 3,265 10 4 2 230 3,807
10 - 14 8 9 2 3 300 4,785 12 8 7 536 5,670
15 - 19 17 7 3 15 389 7,967 15 7 27 1,164 9,611
20 - 24 28 9 10 49 621 16,112 64 20 98 1,771 18,782
25 - 29 42 17 11 79 1,148 26,695 215 30 150 2,340 30,727
30 - 34 54 15 12 72 1,111 25,136 317 50 102 2,418 29,287
35 - 39 52 8 9 54 973 18,207 306 47 70 2,022 21,748
40 - 44 52 8 6 45 959 16,573 303 39 48 1,891 19,924
45 - 49 60 13 7 30 967 15,767 280 34 40 1,923 19,121
50 - 54 38 15 5 30 963 15,943 221 27 31 1,961 19,234
55 - 59 26 5 5 13 689 9,996 145 27 22 1,005 11,933
60 - 64 21 7 6 8 629 7,296 96 17 13 912 9,005
65+ 25 5 4 5 754 8,387 101 19 15 1,986 11,301
Source: Zanzibar Commission for Tourism and Department of Immigration
NOTE: The table above does not include the data from the domestic flight due to the absence of this variable in the designed form that are filled
by tourists who came Zanzibar by domestic flight

29
Table 2.2.2.9: Monthly Tourist Arrival by Purpose of Visit through Airport by International flight and Seaport, 2014
Returning
resident
Prospective
resident
Seeking
employment
Temporary
employment
Visiting
friends
and
relatives
Holidays
Business
and
conference
In
transit others
Not
defined Total
Total 451 126 85 405 9,964 178,008 2,091 333 629 20,355 212,447
January 85 22 9 37 1,751 10,225 215 55 157 3,205 15,761
February 44 39 11 75 2,466 20,496 419 47 75 4,639 28,311
March 36 8 12 29 578 12,080 170 26 69 1,107 14,115
April 25 5 4 12 404 7,876 161 10 28 779 9,304
May 34 3 1 5 315 7,320 90 9 26 688 8,491
June 16 2 5 5 267 10,973 83 7 19 1,040 12,417
July 26 13 2 45 1,108 17,053 136 13 40 1,196 19,632
August 32 3 5 112 1,430 19,860 268 87 84 2,084 23,965
September 55 6 7 38 658 14,506 240 18 67 1,816 17,411
October 47 9 11 8 195 16,670 99 24 27 2,182 19,272
November 33 13 9 18 224 16,253 121 13 20 334 17,038
December 18 3 9 21 568 24,696 89 24 17 1,285 26,730
Source: Zanzibar Commission for Tourism and Department of Immigration
NOTE: The table above does not include the data from the domestic flight due to the absence of this variable in the designed form that are filled
by tourists who came Zanzibar by domestic flight

30
Length of Stay
Table 2.2.2.10 below shows that majority of the arrivals (33.6 percent) stayed in the country
for seven days. The overall average length of stay for tourists was 7.7 nights. Nearly the
similar result was obtained during "The 2010 Zanzibar Visitors Exit Survey" and "The 2014
International Visitors Exit Pilot Survey". Only 2.3 percent of the arrival stayed more than a
month.
Table 2.2.2.10: Length of Stay and Sex of Tourist Arrivals in Zanzibar, 2014
Length of
Stay
Male Female Total
104,201 108,246 212,447
1 3,889 2,185 6,074
2 4,522 3,189 7,711
3 5,725 5,324 11,049
4 5,951 6,530 12,481
5 6,191 6,694 12,885
6 4,645 5,115 9,760
7 34,188 37,286 71,474
8 12,482 14,333 26,815
9 2,782 3,141 5,923
10 4,562 4,902 9,464
11 1,231 1,333 2,564
12 1,649 1,819 3,468
13 794 937 1,731
14 5,084 5,169 10,253
15 3,144 3,283 6,427
16 597 662 1,259
17 265 301 566
18 257 233 490
19 113 158 271
20 565 529 1,094
21 770 779 1,549
22 153 142 295
23 94 119 213
24 58 75 133
25 85 103 188
26 54 61 115
27 28 45 73
28 116 160 276
29 34 51 85
30 1,593 1,272 2,865
More than
a month 2,580 2,316 4,896 Source: Zanzibar Commission for Tourism and Department of Immigration

31
Hotel Statistics
The hotels are among the major component of tourism industries in Zanzibar. Development of
the hotel industry depend largely the growth of tourism. Table 2.2.2.11 shows that a total of
32 new hotels and guests houses were approved in Zanzibar in 2014 with the total rooms
capacity of 262 and 447 beds. Grade A hotels/guest houses is a leading category in
registration, it accounted about 75 percent of all registered hotels/guest houses while the least
registered is four stars and two star hotels category that accounting 3.1 percent each.
Grade A is defined as the last grade hotel/ guests houses, this category means a hotel or a
guest house has the least facilities and services that offer. Grade AA is better that A but its
services have not reached that of one star. Approved hotels and guest houses by grades and
districts for 2009 to 2014 are given in tables 2.2.2.12 and 2.2.2.13 below.
Table 2.2.2.11: Approved Hotel/Guests by District and Grading in Zanzibar, 2014
District
Grades
Four
Stars Two Stars
One
Star AA A Total
Mjini
Hotel 1 0 0 0 2 3
Room 54 0 0 0 21 75
Bed 115 0 0 0 35 150
Magharibi
Hotel 0 0 0 0 3 3
Room 0 0 0 0 13 13
Bed 0 0 0 0 21 21
Kaskazini A
Hotel 0 0 0 0 7 7
Room 0 0 0 0 31 31
Bed 0 0 0 0 45 45
Kaskazini B
Hotel 0 0 0 0 3 3
Room 0 0 0 0 20 20
Bed 0 0 0 0 36 36
Kati
Hotel 0 0 1 1 0 2
Room 0 0 18 6 0 24
Bed 0 0 25 10 0 35
Kusini
Hotel 0 1 2 1 9 13
Room 0 19 13 8 47 87
Bed 0 27 24 14 75 140
Chake
Hotel 0 0 1 0 0 1
Room 0 0 12 0 0 12
Bed 0 0 20 0 0 20
Total Hotel 1 1 4 2 24 32
Room 54 19 43 14 132 262
Bed 115 27 69 24 212 447 Source: Zanzibar Commission for Tourism

32
Figure 5: Record of Number of Rooms and Beds by grading, 2014
Source: Office of the Chief Government Statistician
Table 2.2.2.12: Approved Hotel and Guest Houses by Grading, 2010 - 2014
Year Five
Stars
Four
Stars
Three
Stars
Two
Stars
One
Star AA A
TOTAL
2010 Hotel/Guest 1 0 3 2 6 2 18 32
Room 15 0 40 68 72 11 209 415
2011 Hotel/Guest 3 0 2 1 4 5 22 37
Room 133 0 94 33 60 25 186 531
2012 Hotel/Guest 0 0 2 0 3 1 14 20
Room 0 0 55 0 33 10 88 186
2013 Hotel/Guest 3 2 1 14 5 2 25 52
Room 241 15 30 165 168 23 173 815
2014 Hotel/Guest 0 1 0 1 4 2 24 32
Room 0 54 0 19 43 14 132 262
TOTAL Hotel/Guest 7 3 8 18 22 12 103 173
Room 389 69 219 285 376 83 788 2209 Source: Zanzibar Commission for Tourism

33
Table 2.2.2.13: Number of Rooms and Beds in Approved Hotels and Guest Houses by
District, 2010-2014
YEAR 2010 2011 2012 2013 2014 Total
Mjini Room 55 81 70 142 75 423
Bed 101 162 140 271 150 824
Magharibi Room 12 66 8 15 13 114
Bed 24 128 16 31 21 220
Kaskazini "A" Room 63 162 48 264 31 568
Bed 115 296 86 427 45 969
Kaskazini "B" Room 91 18 19 0 20 148
Bed 182 36 30 0 36 284
Kati Room 88 25 10 209 24 356
Bed 108 49 20 363 35 575
Kusini Room 107 170 31 157 87 552
Bed 205 280 61 320 140 1,006
Wete Room 0 0 0 0 12 12
Bed 0 0 0 0 20 20
Micheweni Room 0 0 0 0 0 0
Bed 0 0 0 0 0 0
Chake Room 0 5 0 21 0 26
Bed 0 5 0 42 0 47
Mkoani Room 4 4 0 7 0 15
Bed 12 8 0 14 0 34
Total Room 420 531 186 815 262 2,214
Bed 747 964 353 1468 447 3,979
Source: Zanzibar Commission for Tourism

34
2.2.3 Trade Statistics
Trade statistics provide brief explanation of flows and directions of imports and exports.
This exercise also provides statistics on imports and exports which form a valuable
component of a country‟s statement of economic transactions in the national accounts and
balance of payments. Trade Statistics that are accurately detailed and timely delivered have
always been a priority as they are vitally important for the planning and future development
of Zanzibar.
This chapter contains international trade statistics and interstate trade statistics which show
imports and exports trend for the years 2010 to 2014. These statistics are compiled from
declarations forms filled by importers and exporters at the Customs Office of Tanzania
Revenue Authority (TRA).
International Trade Statistics
International trade statistics measure the value and quantity of goods traded between Zanzibar
and the rest of the world. They are the official harmonized source of information about
imports, exports and trade balance between import and export. Data on international trade are
compiled as per the recommendations of the United Nations General Trade System
(UNGTS). According to this system, all goods entering and leaving the national frontier,
including trading activities of the Freeport Zone should be accounted for.
Total Value of Trade and Trade Balance
Total value of trade represents an addition value for both import and export while balance of
trade represents a difference in value for import and export for a country. A country
demonstrates a demand for an import when domestic quantity demanded exceeds domestic
quantity supplied, or when the price of the good or service on the world market is less than
the price on the domestic market. The country experiences trade deficit if import value is
always higher than export value. Total international trade for the year 2014 was valued at
Tanzanian shillings 413,140.5 million, increased by 39 percent from the previous year.
For the year 2014, total exports amounted to Tanzanian shillings 133,587.7 million which is
52 percent higher than in 2013, and imports amounted to Tanzanian shillings 279,552.8

35
million higher by 34 percent compared with 2013; thus resulting in a trade deficit of
Tanzanian shillings 145,965 million that is 21 percent higher than in 2012.
Table 2.2.3.1: Balance of Trade, 2010 – 2014 (Millions Tanzanian Shillings)
Description 2010 2011 2012 2013 2014
Imports 129,136.8 164,187.1 271,273.1 208,051.9 279,552.8
Exports 17,906.7 61,261.4 67,390.5 87,799.6 133,591.7
Volume 147,043.5 225,448.5 338,663.6 295,851.5 413,140.5
Balance -111,230.1 -102,925.7 -203,882.5 -120,252.2 -145,965.0
Source: Tanzania Revenue Authority (TRA), Dar-es-Salaam
For the five year trend 2010 to 2014, figure 3.8 shows that there is an increasing import value
from 2010 to 2012 and dropped in 2013, however import value increased from 2013 to 2014.
Rapidly increasing of import value will cause trade deficit if the value of export dropped in
every year. In case of export value, it shows that values are increasing from year to year.
Figure 6: Trend of Imports and Exports Trade in Zanzibar, 2010 – 2014
Source: Tanzania Revenue Authority (TRA) – Head Quarter, Dar-es-Salaam

36
Export
In international trade, "exports" refer to selling goods and services produced in the home
country to other markets. An export of goods occurs when there is a change of ownership
from a resident to a non-resident. Total export proceeds for the year 2014, including export of
goods locally grown or produced (unprocessed), amounted to Tanzanian shillings 133,587.7
million, showing increase of 52 percent over the previous year 2013.
Exports by section
Table 2.2.3.2 shows section of „vegetable products‟ which include cloves, seaweeds, copra,
clove stem and other products for the year 2014 amounted to Tanzanian shillings 103,979.2
million indicating an increase of 37 percent over the year 2013. Vegetable products section
contribute almost 77 percent of total export in 2014 followed by „prepared foodstuff,
beverages & tobacco‟ section contributing 10 percent.
The trend shows section of vegetable products contributed at higher percent than others in
both years. The reason is that export of cloves and seaweeds are being positioned in this
section; these are the highest cash crops in Zanzibar.

37
Table 2.2.3.2: Value of Exports by Section, 2010 – 2014 (Million Tanzanian Shillings)
Section 2010 2011 2012 2013 2014
Live animals; animal‟s products. 226.3 222.7 298.7 683.2 404.4
Vegetable products (cloves, seaweeds,
copra, clove stem etc). 15,474.7 56,509.1 63,160.0 75,392.6 103,979.2
Animal, vegetables oils 0 0 0 389.9 82.8
Prepared foodstuff, beverages &
tobacco 217.5 311.2 490.9 1,312.4 13,873.2
Mineral products 1.3 532.1 0 218.4 64.2
Products of the chemical or allied
industries 99.5 94.6 66.4 117.2 139.8
Plastic & articles thereof 465.2 503.9 1,939.3 748.5 400.7
Raw hides and skins, leather, fur skins 0.9 5.5 5.0 67.9 72.2
Wood & wood articles 46.8 1,649.1 50.0 7,198.6 1,199.7
Pulp of wood or of other fibrous 50.0 75.8 100.6 141.2 114.3
Textiles & textiles articles 126.8 133.1 394.3 367.8 178.3
Footwear, headgears etc. 13.9 25.4 9.7 26.7 14.7
Articles of stone, cement, asbestos etc. 40.4 17.0 1.0 2.3 91.7
Natural & cultured pearls, precious
stones 24.2 33.8 56.8 63.1 1.0
Base metal & articles of base metal 163.3 150.5 267.1 217.2 241.0
Machinery & mechanical appliances,
electrical etc. 770.1 732.5 119.4 660.1 5,640.4
Vehicles, aircraft, vessels etc. 112.8 131.0 70.7 75.8 3,414.2
Optical, photographic, cinematographic,
measuring, checking, precision, medical
or surgical instruments and apparatus;
clocks and watches; musical
instruments; parts and accessories
thereof
19.0 4.2 296.1 8.8 138.3
Arms and ammunition; parts and
accessories thereof. 0 0 0 0 0
Miscellaneous manufactured 53.7 116.6 56.7 105.9 3,531.1
Works of art, collectors' pieces &
antiques 0 13.2 8.0 2.0 10.5
Total 17,906.7 61,261.4 67,390.5 87,799.6 133,591.7
Source: Tanzania Revenue Authority (TRA), Dar-es- salaam

38
Exports by country of destination
Export figures by country of destination for the year 2014 show that India was the major
buyers for the year 2013, purchasing some 48 percent of our exports that amounted to
Tanzanian shillings 63,539.7 million. The trend shows India contributed higher percent than
others countries in both years except in 2011 was Indonesia, followed by Singapore (Figure
7).
Table 2.2.3.3: Value of Exports by Country of Destination, 2010 – 2014
(Million Tanzanian Shillings)
Country 2010 2011 2012 2013 2014
Australia 0 94.9 0.5 0 0
Comoro 3 199.3 217.4 247.0 17,780.7
China 0 0 719.1 934.2 4,901.1
Denmark 1,430.9 1,680.2 2,000.4 2,005.0 1,738.8
Finland 0 1.5 79.4 5.7 0
France 897.4 1,232.1 1,845.8 1,110.5 1,167.9
Germany 0.5 230.3 36.2 0.9 127.6
Hong Kong 78.3 74.8 195.4 98.9 254.7
Indonesia 0 15,292.2 3,804.3 0 16.6
India 7,665.6 1,016.9 16,785.2 35,489.9 63,539.7
Italy 20.1 0.5 0.3 6.7 0
Japan 58.9 0 10.3 14.0 0
Kenya 412.3 179.4 49.9 289.6 6,068.2
Liberia 0 1,621.0 0 0 0
Malawi 57.6 0 259.1 2.6 0
Malaysia 22.9 22.8 6.0 50.8 41.0
Netherlands 0 1.8 0 1,065.5 3,294.4
Oman 10.4 15.8 9.3 63.7 29.9
Singapore 2,566.0 2,246.2 12,159.6 13,330.2 14,119.9
Switzerland 0.6 0.1 0 123.4 0
Swaziland 0 0 0.2 91.1 0
South Africa 85.6 97.9 4.5 134.9 42.0
Thailand 0 10,317.1 0 0 1.2
Uganda 0 0 3.9 0 1.2
United Arabs Emirates 721.1 16,286.0 23,122.2 18,961.8 9,797.9
United Kingdom 442 497.3 483.8 1,211.0 838.6
United States of America 905.7 916.4 3,932.0 2,445.1 3,172.7
Zambia 0 0 112.3 106.8 5.8
Other countries 2,527.8 9,237.0 1,553.7 10,010.3 6,642.7
Total 17,906.7 61,261.4 67,390.5 87,799.6 133,591.7
Source: Tanzania Revenue Authority (TRA), Dar-es- salaam

39
Figure 7: Exports to Main Countries, 2010-2014
Source: Tanzania Revenue Authority (TRA) Headquarters Dar-es- salaam

40
Export of Marine Product
Table 2.2.3.4 shows that in 2014 total export of marine product amounted to 292.6 tonnes (equivalent to 577,171,600 Tanzania shillings) of
which export of Anchovies contribute 35 percent of total amount followed by Sea shells (33 percent) and lobsters (20 percent). Sea shells
product includes Sea snail, Tiger cowries, Helmetshels and Caurie. The trend shows seaweeds product contributed higher value of exported
marine product than others product in both four years (2010-2013).
Table 2.2.3.4: Exports of Marine Product by Type of Product, 2010 – 2014
Items 2010 2011 2012 2013 2014p
Tonnes Value in T.Shs Tonnes Value in T.Shs Tonnes Value in T.Shs Tonnes Value in T.Shs Tonnes Value in T.Shs
Seaweed 11,845.5 2,289,950,000 12,811.9 3,796,550,000 14,393.0 5,702,400,000 9,845.0 3,786,866,000 na na
Sea cucumber 32.5 41,825,000 42.5 67,065,000 21.4 84,700,000 14.4 78,440,000 33.0 92,358,000
Sea shells 95.0 47,342,200 182.4 99,876,000 185.3 139,627,000 153.0 133,732,000 95.6 96,991,300
Lobsters 55.4 186,260,000 26.7 206,641,666 31.8 187,252,934 25.2 191,995,000 57.4 56,185,100
Octopus 1.7 4,950,000 55.6 90,617,500 12.9 45,044,000 na na na na
Squid 4.1 12,725,000 1.5 48,000,000 na na na na na na
Anchovies 6.2 3,300,000 23.4 18,189,200 124.0 70,722,000 190.4 99,542,000 102.2 322,810,200
Chitons 4.4 2,640,000 3.5 2,855,000 8.2 7,440,000 2.8 2,800,000 1.4 1,500,000
Oyster 0.1 50,000 na na na na na na na na
Scars 2.5 28,875,000 0.5 5,777,000 40.0 950,000 0.5 7,287,600 0.3 5,800,000
Fish offals 0.5 5,550,000 0.3 600,000 na na na na 2.4 588,000
Fresh Fish 7.3 15,400,000 6.2 13,363,000 0.3 775,000 0.0 35,000 na na
Fin fin/shark 2.1 9,300,000 0.3 5,655,000 0.0 600,000 na na na na
Crabs 5.1 6,970,000 0.7 1,430,000 na na na na na na
Grouper Skin na na na na na na na na 0.3 939,000
other na na 0.0 350 0.0 3,000,000 na na na na
Total 216.9 365,187,200.0 343.4 560,069,716.0 423.8 540,110,934.0 386.2 513,831,600.0 292.6 577,171,600.0
Source: Ministry of livestock and fisheries development- Zanzibar
Note: na means data not available

41
Imports
An import of a good occurs when there is a change of ownership from a non-resident to a
resident. Total imports for the year 2014, reached Tanzanian shillings 279,552.8 million,
showing increase of 34 percent when compared to Tanzanian shillings 208,051.9 million for
the previous year (2013).
Table 2.2.3.5 shows the highest value of import in 2014 was from „Vehicles, Aircraft, and
Vessel‟ section amounted to Tanzanian shillings 61,499.8 million equivalents to 22 percent of
total import. This amount differs by Tanzanian shillings 11,422.4 million from imported
value of the same section of 2013. Section of machinery & mechanical appliances contributed
17 percent while section of textiles & textiles articles contributed 7 percent.
The trend shows section of „Vehicles, Aircraft, and Vessel‟ contributed at higher percent
than others in both years except in 2012 was section of 'Machinery & Mechanical
Appliances, Electrical'.

42
Table 2.2.3.5: Value of Direct Import by Section, 2010 – 2014 (Million Tanzanian Shillings)
Section 2010 2011 2012 2013 2014
Live Animals, Animal Products 681.1 1,107.4 2,200.2 2,986.3 6,100.5
Vegetable Products (onions,
potatoes etc.) 1,126.7 2,349.1 14,724.7 22,751.7 16,719.5
Animal, Vegetables Oil 2,483.9 4,968.7 9,743.4 12,693.7 13,812.7
Prepared Foodstuff, Beverages
& Tobacco 3,395.0 4,495.5 5,886.4 5,181.2 6,448.8
Mineral Products 5,958.7 17,191.7 15,596.5 23,470.8 18,303.0
Products of Chemical or allied
industries 7,153.4 6,114.6 8,851.6 6,150.6 10,021.7
Plastic & Articles thereof 4,824.1 4,013.9 2,928.1 4,825.6 4,264.5
Raw Hides & Skins 139.8 133.2 168.6 176.3 138.8
Wood & wood articles 1,201.0 949.1 2,923.6 842.2 1,716.1
Pulp of wood and Other 2,885.4 2,438.4 2,585.5 1,575.2 2,479.7
Textiles & Textiles articles 6,946.0 14,558.7 10,632.7 17,679.6 20,568.2
Footwear, Headgear etc. 382.7 536.4 755.8 1,702.0 3,402.7
Articles of Stone, Cement,
Asbestos etc. 3,993.3 4,236.8 5,393.1 5,939.1 10,024.5
Natural & Cultured pearls,
Precious stones 23.9 39.2 27.4 26.1 79.2
Base metal & articles of base
metal 5,314.8 11,341.1 51,710.8 6,873.0 40,076.8
Machinery & Mechanical
Appliances, Electrical etc 35,220.2 31,202.3 71,210.9 37,836.5 49,507.9
Vehicles, Aircraft, Vessel etc. 38,464.0 53,103.0 57,711.3 50,077.4 61,499.8
Optical, photographic,
cinematographic, measuring,
checking, precision, medical or
surgical instruments and
apparatus; clocks and watches;
musical instruments; parts and
accessories thereof
2,402.8 1,465.3 2,022.6 905.2 2,347.2
Arms and ammunition; parts
and accessories thereof
24.1 1.7 2.2 1.4 0.6
Miscellaneous Manufactured 6,513.7 3,940.2 6,113.8 5,769.5 12,032.2
Work of Art, Antiques 2.2 0.8 84.2 588.5 8.4
Total 129,136.8 164,187.1 271,273.1 208,051.9 279,552.8
Source: Tanzania Revenue Authority (TRA), Dar-es-Salaam
Imports by Country of Origin
Table 2.2.3.6 shows that during the year 2014, imports from the United Arab Emirates
amounted to Tanzanian shillings 69,892.7 million with a share of 25 percent of the total
imports, followed by China with a share of 11 percent. Other countries share below 10
percent.

43
The trend shows that United Arab Emirates was the most contributor then other countries for
both years except in 2012 was Japan. At the 2012 Japan amounted to Tanzanian shillings
86,076.8 million with a share of 31.7 percent of total imports. (Figure 8)
Table 2.2.3.6: Direct Imports by Country of Origin, 2010 – 2014 (Millions Tanzanian Shillings)
Country 2010 2011 2012 2013 2014
Australia 8,151.2 6,280.0 524.8 19,165.9 21,871.9
Belgium 8,902.5 85.3 1,187.5 377.6 617.5
Brazil 103.8 98.5 307.2 294.4 265.0
China 10,334.0 25,959.4 17,646.5 24,864.6 31,753.4
Denmark 536.8 319.7 134.6 243.6 333.0
Finland 39.6 208.2 0.0 0.0 0
France 1,755.3 9,989.6 1,880.1 2,164.0 1,641.2
Germany 1,567.1 671.1 1,161.5 496.4 2,314.0
Hong Kong 5,067.1 5,101.4 5,237.8 6,396.5 8,777.7
India 6,438.2 7,147.3 14,588.9 11,969.6 16,783.0
Indonesia 2,478.4 2,325.8 2,103.3 3,751.6 6,101.2
Iran 0.0 736.5 1,078.7 0.0 24.9
Italy 5,794.2 3,993.4 7,637.0 6,650.7 25,842.5
Japan 6,445.7 5,933.0 86,076.8 6,410.9 8,543.0
Kenya 510.5 5,350.2 3,896.7 679.3 10,411.3
Malaysia 542.7 594.5 945.8 3,804.4 6,258.0
Netherlands 4,940.7 1,328.5 624.3 1,279.2 778.7
Oman 965.4 2,044.8 3,716.7 2,405.2 2,603.9
Pakistan 4,255.8 11,305.8 9,860.2 11,947.8 12,631.0
Philippines 2.7 0.0 0.0 0.0
0.0 3.8
Singapore 6,715.3 9,999.9 15,531.0 7,526.1 4,126.0
South Africa 5,409.8 1,885.3 2,357.6 3,883.0 4,808.1
South Korea 609.0 230.9 133.1 179.8 344.8
Sweden 254.2 64.4 265.5 2,076.7 3,680.7
Switzerland 26.7 90.4 251.9 65.2 0
Thailand 1,444.1 1,278.9 2,061.6 2,626.2 2,233.8
Turkey 0.0 3,863.4 3,868.7 8,082.6 5,251.4
United Arab Emirates 28,057.5 37,385.3 46,206.6 65,375.7 69,892.7
United Kingdom 6,453.3 7,850.4 10,171.7 8,199.7 10,756.3
United States of America 3,611.5 7,441.1 6,207.0 3,060.1 8,296.5
Vietnam 0.0 71.4 2.5 0.0 17.1
Other Countries 7,723.8 4,552.7 25,607.3 4,075.0 12,590
Total 129,136.8 164,187.1 271,273.1 208,051.9 279,552.8
Source: Tanzania Revenue Authority (TRA), Dar-es-Salaam

44
Figure 8: Imports from Main Countries, 2010 – 2014
Source: Tanzania Revenue Authority (TRA), Dar-es-Salaam
Import of Petroleum Products
During the year 2014, imports of petrol amounted to 35,621,945 litres (equivalent of
Tanzania Shillings 47,003 million), decrease of one percent from previous year, 2013,
imports of diesel decreased by 0.2 percent from the year 2013, kerosene decreased by 9
percent and jet oil increased third times of 2013 jet oil imports.
Table 2.2.3.7: Imports of Petroleum Products, 2012 – 2014 (Value in Million Tanzanian Shillings)
Year
Litres Value
Petrol Diesel Kerosene Jet Oil Petrol Diesel Kerosene Jet Oil
2012 24,484,719 29,055,073 4,047,050 10,119,104 36,935 47,026 6,417 16,378
2013 36,005,053 26,448,250 5,617,332 7,362,927 49,453 40,294 8,205 11,217
2014p 35,621,945 26,392,453 5,094,908 22,317,949 47,003 39,048 7,157 33,019 Source: Tanzania Revenue Authority (TRA), Zanzibar
The trend shows that petrol product was the most imported product then other for both years
except in 2012 was diesel product. Moreover figure shows the lowest imported product in
both years was kerosene (Figure 9)

45
Figure 9: Imports of Petroleum Products, 2012 – 2014
0
5,000,000
10,000,000
15,000,000
20,000,000
25,000,000
30,000,000
35,000,000
40,000,000
2012 2013 2014
Litr
es
Year
Petrol
Diesel
Jet Oil
Kerosene
Source: Ministry of Lands, Housing, Water and Energy
Import of Selected Food Stuff
During the year 2014, imports of rice amounted to 61,134 tons decrease of 16 percent from
previous year, 2013, imports of sugar decreased by 90 percent from the year 2013, and wheat
flour decreased by 96 percent from the previous year.
Table 2.2.3.8: Imports of Selected Food Stuff, 2012 – 2014
Year Tons
Rice Sugar Wheat flour
2012 76,134 30,357 16,600
2013 73,360 316,099 271,443
2014p 61,373.4 30,789.2 12,002.5 Source: Tanzania Revenue Authority (TRA), Zanzibar
The trend shows that rice product was the most imported product then other for both years
except in 2013 was sugar product. (Figure 10)

46
Figure 10: Imports of Selected Food Stuff, 2012 – 2014
0
50,000
100,000
150,000
200,000
250,000
300,000
350,000
2012 2013 2014
Ton
s
Year
Rice
Sugar
Wheat flour
Source: Tanzania Revenue Authority (TRA), Zanzibar
Inter-State Trade Statistics
Inter-state trade statistics provides an idea about the demand of commodities produced or
consumed in a state (Zanzibar) along with flow thereof to other side of country (Tanzania
Mainland). Different goods include foods and non-foods such as building hardware, transport
hardware and other material were imported from Tanzania Mainland.
Total value of goods imported from Tanzania Mainland to Zanzibar worth Tanzanian
shillings 64,296.4 million in 2014, increase of three percent of imported value in 2013. On
the other hand, the total value of goods transferred from Zanzibar to Tanzania Mainland
amounted to Tanzanian shillings 366,354.2 million, lower by 26 percent compared with 2013
value.
Table 2.2.3.9: Import Value from Tanzania Mainland and Transfer of Goods to
Tanzania Mainland, 2010-2014 (Million Tanzanian Shillings)
Year 2010 2011 2012 2013 2014
To Zanzibar 23,268.7 74,738.3 79,666.2 61,869.3 64,296.4
To Mainland 2,203.8* 71,396.8
224,400.5
501,204.2 366,354.2
Source: Ministry of Trade, Industries and Marketing.
* Estimates based on previous trend.

47
2.2.4 Transport Statistics
This table 2.2.4.1 shows that the number of passengers has increased by 11.73 percent from
2013 to 2014. The freight loaded decreased by 48.78 percent from 2013 to 2014 while off
loaded increased by 38.78 percent. The number of movements of aircraft increased by 10.71
percent from 2013 to 2014
Table 2.2.4.1: Air Craft Movements, Passengers and Cargo Handled in Zanzibar
Airports, 2014
Description 2013 2014
Passengers Embarked (Departures) 421,698 488,421
Dissembarked (Arrivals) 416,736 450,779
Intransit 87,233 95,040
Total 925,667 1,034,240
Load (Tonnes ) Freights Loaded 27 13.83
Freight Off Loaded 1,315 1,824.99
Total 1,342 1,838.82
Mail (Tones) Loaded 0 0
Off Loaded 0 0
Total 0 0
Movements Number (000) 56 62
Source: Directorate of Aviation, Zanzibar
Table 2.2.4 2: Traffic Handled at Zanzibar Seaport, 2013 - 2014
Description Unit 2013 2014
Trip Enter/Exit Number 4,083 9,414
Passengers Number 2,862,188 2,996,782
Cargo Tons 983,678 730,686
Foreign Going Vessel Number 186 194
Source: Zanzibar Port Corporation
This table shows that the trip enter / exit increased more than double from 2013 to 2014
because of the increase of dhows. The number of passenger increased by 4.7 percent from
2013 to 2014, the cargo decreased by 25.7 from 2013 to 2014 because of the lack of
information from cargo entered through dhows while the foreign going vessels increased by
4.3 percent.

48
Table 2.2.4.3: Traffic Handled at Zanzibar Seaport 2014
Description Quarter 1 Quarter 2 Quarter 3 Quarter 4 Total
Passengers
Embarked 861,089 300,023 280,432 323,818 1,765,362
Disembarked 284,878 278,482 282,100 340,185 1,185,645
Tourist 13,425 5,812 13,169 13,369 45,775
Total 1,159,392 584,317 575,701 677,372 2,996,782
Freight (Tons)
Loaded 5,539 37,854 5,257 39,153 87,803
Unloaded 31,257 208,383 27,977 242,299 509,916
Total 36,796 246,237 33,234 281,452 597,719
Dhows
Loaded 17,286 14,249 15,280 12,874 59,689
Unloaded 17,706 16,642 20,622 18,308 73,278
Total 34,992 30,891 35,902 31,182 132,967
Number Of
Vessels
Foreign 51 44 40 59 194
Non Foreign 860 868 998 1,016 3,742
Dhows 1,465 1,543 1,434 1,230 5,672
Total 2,376 2,455 2,472 2,305 9,608
Source: Zanzibar Port Corporation
Vehicles registration
This table shows the registration of different types of motor vehicles registration from 2010
to 2014. This includes motor cars, estate cars and station wagons, passengers‟ cars, motor
cycles and three wheelers, Lorries and buses and other vehicles. The total registration
increased from 16,603 in 2013 to 20,604 in 2014 which is equivalent to 24.1 percent.
Table 2.2.4.4: Motor Vehicles registration, 2010- 2014
Description 2010 2011
2012
2013
2014
Motor Car, Estate car and Station
wagons 7,132 8,122
3,421
2,486
6,540
Passenger Cars 1,934 2,208
4,467
5,366
8,026
Motor Cycles and Three Wheelers 6,754 6,871
4,977
5,833
3,076
Lorries and Busses 89 829
1,882
2,044
1,014
Tractors and Others 1,685 1,287
1,287
874
1,948
Total 17,594 19,317 16,034 16,603 20,604
Source: Zanzibar Revenue Board

49
Roads
An important component of transport infrastructure is road transport. It is apparent from table
2.2.4.5 data shows that the length of all roads is 1,189 km. in which 668 km. are paved
roads8. Other side of road condition data shows that 54 percent out of total, the conditions of
paved roads are good.
Table 2.2.4.5: Zanzibar Road Network (kilometres) as at December, 2013
Road
Class Total
Paved Unpaved
Very
Good Good Fair
Poor
Very
Poor Total
Very
Good Good Fair Poor
Very
Poor Total
Trunk
Roads
353
135
99
26
17
21
298
0
18
0
21
16
55
Urban
Roads
68
29
14
7
3
2
55
0
0
2
4
6
12
Rural
Roads
495
179
77
15
4
12
287
0
1
64
85
58
208
Feeder
Roads
273
17
10
0
0
1
28
0
11
79
97
59
246
Total 1,189 360 200 48 24 36 668 0 30 145 207 139 521
Source: Department of Road Construction and Maintenance, Zanzibar
Table 2.2.4.6: Number of Communication Providers, 2010 - 2014
Description 2010 2011 2012 2013 2014
1. Telephone and Internet Operators
Fixed Lines Operators
Mobile Operators
Data Operators and Internet Service
Providers
2
5
8
2
5
8
2
5
8
2
5
8
2
5
3
2. Number of Television Stations 5 6 7 9 12
3. Number of Internet Subscribers 3 3 3 3 3
4. Number of Radio Stations
National Radio Stations
Community Radio Stations
14
1
15
1
15
2
16
3
19
3
Source: Zanzibar Broadcasting Cooperation, TRCA
8 Paved roads are those surfaces with crushed stone (macadam) and hydrocarbon binder or bituminized agents
with concrete or with cobblestone

50
2.3 Production Statistics
Production Statistics Section is responsible with collecting and analysing data based on
agriculture, industrial production, construction, and environment statistics the following
information analyze the data on production statistics for the year 2014.
2.3.1 Agriculture Statistics
Agriculture statistics comprises data from crops production (both food crops and cash crops),
forest products, fish catches and livestock products. The data presented in both quantity and
value and where possible trend analysis was carried out to portray a clear picture of the
performance of agriculture and forestry industry. In general the industry plays a very
significant role in the economy of the country in 2014 the total contribution of agriculture
sector to GDP accounted for 27.9 percent. However, in some area the data show there was
slow improvement growth due to various reasons such as unforeseen circumstance of
weather.
Clove Production
The quantity purchased of clove in 2014 was 4,153 tons this is slightly lower compared with
total clove purchased in 2013 which was 5,733 tons. This decrease mainly influenced by low
purchase of clove from the market which was caused by low production in many clove farms.
(Table 2.3.1.1)
Table 2.3.1.1: Quantity and Value for Clove, 2012- 2014 (Million Tanzanian Shillings)
Month
2012 2013 2014
Quantity
Purchased
(tons) Value
Quantity
Purchased
(tons) Value
Quantity
Purchased
(tons) Value
January 894 13,396.40 696 8,703.51 1,193.4 16,686.62
February 147 2,205.42 177 2,208.38 150.2 2,096.28
March 54 814.22 43 541.51 79.2 1,152.70
Q1 1,095 16,416.04 916 11,453.40 1,422.8 19,935.59
April 26 387.38 24 298.83 49.0 731.86
May 28 412.93 9 118.23 10.8 150.35
June 61 918.30 6 77.40 22.6 316.23
Q2 115 1,718.61 40 494.46 82.4 1,198.44
July 37 558.76 156 2,189.51 220.4 3,083.91
August 59 584.79 791 11,066.66 507.5 7,103.35
September 10 99.19 1,022 14,303.13 583.4 8,166.48
Q3 106 1,242.73 1,970 27,559.30 1,311.3 18,353.74
October 11 125.89 794 11,108.50 287.6 4,024.58
November 38 469.82 510 7,127.76 425.0 5,946.62
December 391 4,893.13 1,504 21,038.45 623.5 8,715.10
Q4 440 5,488.84 2,807 39,274.71 1,336.0 18,686.30
Total 1,755 24,866.22 5,733 78,781.87 4,153 58,174 Source: Zanzibar State Trade Company (ZSTC)

51
916
40
1,970
1423
82
1311 1336
2,807
0
500
1,000
1,500
2,000
2,500
3,000
Q1 Q2 Q3 Q4Q uarterly
Clo
ve P
urch
ase
d (
To
ns)
2013 2014
41
3335
2628
3740
27 26
18
10
24
24
20 1921 22 21
24
37
47
14
24
0
10
20
30
40
50
Janu
ary
Febru
ary
Mar
ch
Apr
il
May
June
July
Aug
ust
Septe
mbe
r
Octob
er
Nov
embe
r
Dec
embe
r
Month
Ru
bb
er P
roct
ion
(T
on
s)
2013 2014
The lowest purchase was
recorded in the third and fourth
quarter of 2014 where as the
purchase was 1,311 and 1,336
tons respectively, compared with
1970 and 2807 tons purchase
made in 2013 respectively.
Figure 12
Figure 11: Clove Quarterly Purchase 2013 - 2014
Cash Crops
Table 2.3.1.2 shows the Quantity of Main Cash Crops (cloves, cloves stem, seaweed and
rubber) from 2010 to 2014. The purchase of cloves for the year ending 2014 decreased from
5,733 tons recorded in 2013 to 4,153 tons in 2014. However, the quantity purchased of Clove
Stem increased from 492.9 tons in 2013 to 901.2 tons in 2014 which is an increasing of 83
percent. The quantity purchased of seaweed increased from 11,044 tons in 2013 to 13,302
tons presenting an increase of 20 percent. The production of rubber decreases from 394.1 tons
in 2013 to 204.2 tons in 2014 makes the difference of 190 tons equivalent to decrease of more
than 40 percent. The low production of rubber was experienced along all months in 2014
except for the month of December where the production increased from 18 tons recorded in
2013 to 24tons 2014.
The falling in production for
this commodity was reported
due to the crop price in the
world market, the price
dropped from USD 2000. per
ton recorded in 2013 to 1,200
for the year ending 2014.
(Figure 13).
Figure 12: Rubber Production Trend 2013- 2014

52
Table 2.3.1.2: Quantity and Value of Production of Main Cash Crops, 2009- 2014
(Value in 000‟ Tanzanian Shillings)
Crop 2010 2011 2012 2013 2014p
Tons Value Tons Value Tons Value Tons Value Tons Value
Cloves 2,129 7,447,000 3,743 55,222,678 1,755.4 24,699,357 5,733 78,781,866 4,153 58,174,076
Clove Stem 280 44,791 468 702,300 328.4 485,006 492.6 342,570 901.2 811,594
Seaweed 11,937 2,982,541 13,193 4,132,828 15,087 6,062,896 11,043.8 4,134,890 13,302 6,088,282
Rubber 564 915,643 457 760,890 385 1,210,440 394.1 1,272,943 204.2 391,968
Sources: (i) Zanzibar State Trading Corporation (ZSTC)
(ii) Ministry of Livestock and Fisheries
(iii) AGROTEX Company

53
Planted Area of Food Crops
Total area planted for common food crops such as Paddy, cassava, sweat potatoes,
Groundnuts, Pigeon Peas and Cowpeas/Green grams, banana, Pineapple, vegetables are
decreased in 2014. The total planted for different crops decreased from 94,701 acre recorded
in 2013 to 87,944 acre in 2014 gives a decrease of 7 percent. The planted area for paddy was
30,535 acres in 2014, compared to 34,721 acre in 2013. This gives a decrease of more than
10percent. Similar trend has been observed for Cassava and Banana of which the planted area
decreased from 27,995.3 acre to 25,749 acre and 8,544.7 acre to 6,679 acre from 2013 to
2014 respectively. Contrary the total planted areas for sweat potatoes was increased from
7,665.2 acre recorded in 2013 to 9,305 acres in 2014 gives an increase of 21 percent. The
total planted areas for Coco yams have also increased from 994.7acre planted in 2013 to 1423
acre in 2014. Other crops that show significant increase of the planted area include Maize
increased from 2,838 acres recorded in 2013to 3197 acre in 2014, Sorghum increased from
593.5 acre in 2013 to 609acre in 2014. Area planted with pine apple also increased from 1930
acre in 2013 to 2210acre in 2014give an increase of 14 percent. Table 2.3.1.3 illustrates more
information on cultivated area for various crops from 2010 to 2014.
Production of Food Crops
The production of food crops including, Paddy, cassava, Banana decreased in 2014 compared
with 2013. Paddy production decreased from 33,655tons recorded in 2013 to 29,564tons in
2014 presenting a decrease of 12.2 percent, Cassava decreased by 3.4 percent, Banana 16
percent, and groundnut decreased by only one percent. However other crops had shown
ignifican increased in production such as Sweat potatoes increased by 21percent, Tania by 43
percent, Pigeon peas by 71percent (table 2.3.1.3&2.3.1.4).
Table 2.3.1.3: Area Planted (Acres) by Food Crops, 2010- 2014 Crops 2010 2011 2012 2013 2014p
Maize 6,224.0 6,562.3 1,713.3 2,838.13 3,197
Sorghum 1,488.0 1,347.1 1,274.5 593.5 609
Paddy 29,597.2 29,677.0 32,153.9 34,721 30,535
Cassava 39,072.1 46,566.0 32,721.1 27,995.28 27,036
Banana 14,608.3 13,781.3 12,241.8 8,544.7 6,679
Sweet potatoes 8,421.9 13,245.0 4,538.3 7,665.23 9,305
Yams 1,497.4 842.4 712.8 470.3 423
Tania 38.8 96.8 1,071.2 994.75 1,423
Groundnuts 892.8 834.8 848.5 1,339.25 1,322
Pigeon peas 157.8 317.5 198.3 205.4 222
Cowpeas/ Green grams 2,225.5 2,417.8 793.4 2,137.9 1,326
Source: Ministry of Agriculture and Natural Resources.

54
Table 2.3.1.4: Quantity and Value of Production of Food Crops, 2010- 2014 (Values in Million Tanzanian Shillings)
Crop 2010 2011 2012 2013 2014p
Tons Value Tons Value Tons Value Tons Value Tons Value
Maize 3,112 1,862 3,281 1,963 857 510 1,419 874 1,599 985
Sorghum 572 390 512 349 484 247 226 119 231 122
Paddy 21,014 1,801 23,702 2,031 6,372 4,688 33,655 25,645 29,564 22,527
Cassava 229,284 57,882 273,342 69,004 192,073 50,767 164,332 45,027 158,704 43,485
Banana 102,258 46,502 110,250 50,136 97,935 50,500 68,358 36,503 57,437 30,672
Sweet potatoes 58,953 11,690 92,715 18,383 31,768 7,766 53,657 13,575 65,137 16,479
Yams 7,487 4,157 4,212 2,338 3,564 1,820 2,352 1,244 2,116 1,119
Tania 6443 3,947 4,940 3,026 4,092 3,333 3,800 3,203 5,437 4,583
Groundnuts 432 466 401 433 407 527 643 862 635 851
Pigeon peas 510 497 1,026 1,000 641 447 663 479 717 518
Cowpeas/ Green gram 1,103 1,122 1,177 1,197 317 230 1,129 801 663 470
Source: Ministry of Agriculture and Natural Resources

55
Forestry Products
Forest resource is managed by Department of Forestry and Non-Renewable Resources; it
managed forests plantations, mangrove forest and natural forests found in the territory
Zanzibar. The natural forest consists of a mosaic of vegetations ranging from short coral
bushes and thickets to higher, closed forests. Forest is also the home of different species of
medicinal significance, some with ornamental value, and others available for a multitude of
uses. Forest in Zanzibar is also a source of foreign exchange through ecotorism the most
common forest visited by tourism are Jozani National Park and Ngezi forest reserve.
Besides the tangible and intangible economic benefits of forest sector the data presented in
this section reflect only to information on forest products that harvested from different forest
area on public land and government plantation; whilst the Department authorised a special
transport permit to reserve royalty. These forests produce includes beams, building pole, fire
wood, charcoal etc.
Table 2.3.1.5 shows different forest products harvested in public land and forest plantations
in Zanzibar territory. The data show that there is increasing for some forest products and
decreasing for the year ending 2014 compared in 2013. The total quantity of Beams (boriti)
and Building Poles (Nguzo) has been increased from 1,618.2m3 and 3,422m
3 recorded in
2013 to 2,215.4m3 and 4360m
3 in 2014 equivalent to increase of 37percent and 27percent
respectively. Charcoal production, Firewood (Kuni) and Building Poles (Mapau) have show
negative growth compared in 2013, the products have been decreased from 2,122tons,
19,067m3 and 4,952.7m
3 presenting decrease of one percent, 2percent and 10 percent
respectively. Similar trend has been observed for Withes (Fito) of which decreased from
3,475m3 recorded in 2013 to 3,232m
3 in 2014 equivalent to decrease of 7percent.
The increased of quantity for Beams (boriti) and Building Poles (Nguzo) were due to
increasing in harvest of communal wood lots of which Casuarinas species (Mivinje) are
dominant species. Contrary, the decrease in quantity of Charcoal, Firewood and Building
Poles was due to increasing of deforestation in coral rag forest where by most of the products
are found.
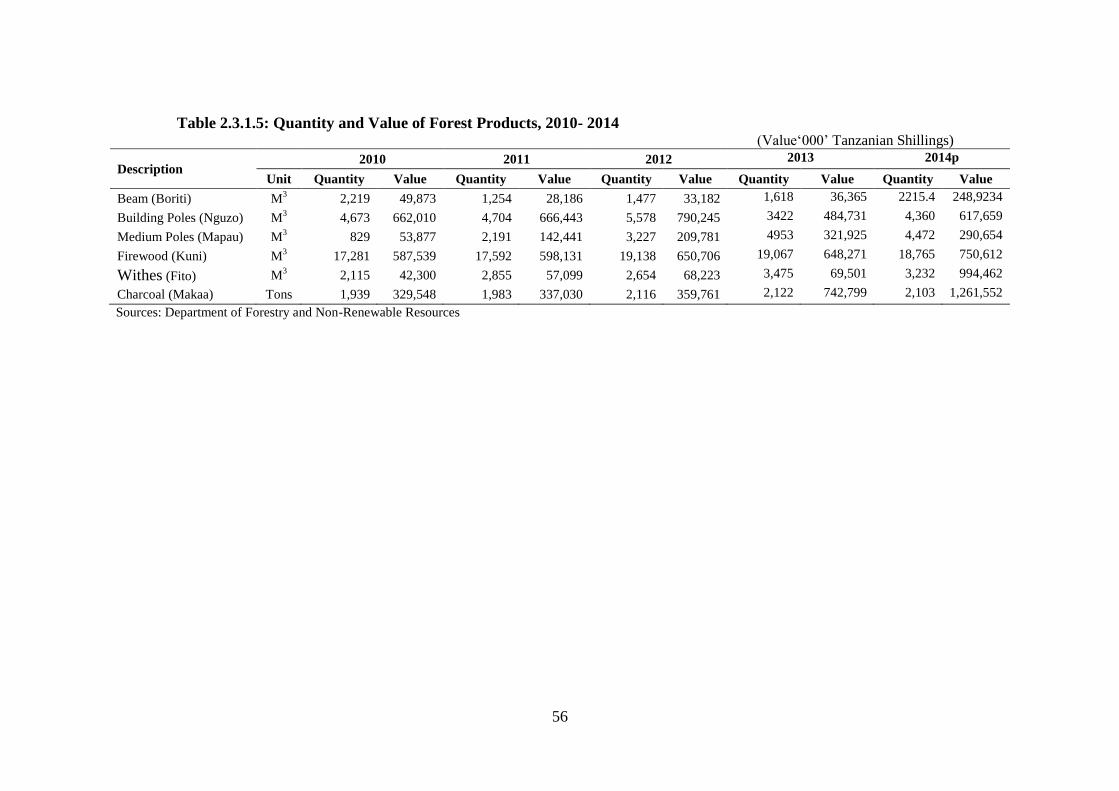
56
Table 2.3.1.5: Quantity and Value of Forest Products, 2010- 2014 (Value„000‟ Tanzanian Shillings)
Description 2010 2011 2012 2013 2014p
Unit Quantity Value Quantity Value Quantity Value Quantity Value Quantity Value
Beam (Boriti) M3
2,219 49,873 1,254 28,186 1,477 33,182 1,618 36,365 2215.4 248,9234
Building Poles (Nguzo) M3 4,673 662,010 4,704 666,443 5,578 790,245 3422 484,731 4,360 617,659
Medium Poles (Mapau) M3 829 53,877 2,191 142,441 3,227 209,781 4953 321,925 4,472 290,654
Firewood (Kuni) M3 17,281 587,539 17,592 598,131 19,138 650,706 19,067 648,271 18,765 750,612
Withes (Fito) M3 2,115 42,300 2,855 57,099 2,654 68,223 3,475 69,501 3,232 994,462
Charcoal (Makaa) Tons 1,939 329,548 1,983 337,030 2,116 359,761 2,122 742,799 2,103 1,261,552
Sources: Department of Forestry and Non-Renewable Resources

57
Fish Catches by district
Table 2.3.1.6 shows the volume of fish catches by district in Zanzibar. In 2014 the fish catches increased by 7 percent and this was attributed to
the growth of fish catches from Kaskazini „A‟ which increased by 24 percent, Kusini and Mjini by 19 percent each, Magharibi by 4 percent and
Mkoani by 7percent, also a in significant increase was observed from Wete district of which the catch was increased by only one percent. The
remaining districts fish catches have shown to decrease these districts includes Kaskazini „B‟ by 12 percent, Kati by 7percent and Micheweni by
25 percent and Chakechake by 4percent.
Table 2.3.1.6: Estimated Fish Catches and Value by District, 2010- 2014 (Value „000‟ Tanzanian Shillings)
District 2010 2011 2012 2013 2014p
Tons Value Tons Value Tons Value Tons Value Tons Value
Kaskazini 'A' 3340 7,945,353 3,388 10,623,273 3,397 12,042,629 3,573 13,221,860 4,442 17,209,726 Kaskazini 'B' 345 805,787.80 669 1,990,750 967 3,368,812 820 2,908,878 721 2,778,764 Kati 1598 3,877,625 1,887 5,783,221 1,982 72,270,422 2,016 7,475,652 1,872 7,195,421 Kusini 1799 4315569 2,537 7,723,597 2,671 10,511,726 2,278 8,640,241 2720 10,489,200 Mjini 8065 19877987 8,524 24,708,157 8,216 28,175,912 8,442 30,958,395 10032 39,334,154 Magharibi 1505 3,599,954 1,955 5,855,644 1,977 6,630,103 2,316 8,468,061 2406 9,189,501
Total Unguja 16652 40,422,277 18,960 56,684,642 19,212 67,999,604 19,445 71,673,087 22,193 86,196,766 Micheweni 1973 4,479,133 2,467 7,276,926 2,302 7,862,023 2,807 9,863,693 2,107 8,002,614 Wete 2,201 5232010 2,200 6,448,317 2,619 8,922,648 2,754 9,867,807 2,785 10,764,937 Chakechake 1,489 3,583,135 1,681 4,984,541 1,806 6,086,933 2,016 7,380,110 1,933 7,421,504 Mkoani 3,378 8,067,755 3,451 10,273,394 3,471 12,309,784 3,690 13,088,243 3,957 14,828,496
Total Pemba 9,041 21,362,033 9,799 28,983,177 10,199 35,181,387 11,267 40,199,852 10,781 41,017,551 ZANZIBAR 25,693 61,784,310 28,759 85,667,819 29,411 103,180,992 30,712 111,872,940 32,974 127,214,227
Source: Ministry of Livestock and Fisheries

58
-2.8
-16.9
-9.1-12.1
-2.9
-10.5
0
500
1,000
1,500
2,000
2,500
3,000
Empe
rors
Treva
lly
Yellow fin tu
na
Kin
g Fish
Barracu
da
Sharks
/Ray
s
Type of Fish Species
Fis
h C
atc
h (
To
n)
-18.0
-16.0
-14.0
-12.0
-10.0
-8.0
-6.0
-4.0
-2.0
0.0
Percen
tag
e
2013 2014 Percentage Decreased
Fish Catches
Table 2.3.1.7 Portray the Estimated Fish Catch by Species, Quantity and values from 2010 to
2014, The production of fish catch in 2014 increased for some of Species, the production of
Spine foot increased by 14.4 percent , , Groupers by 1.7 percent , Surgeon fish by 1.7 percent
, Mullet by 9.2 percent , Anchovies by 3.1 percent , Sardine by 15 percent , Mackerels by
37.1 percent , percent , Sword fish by 9 percent , Octopus/Squid by 79 percent, Lobsters by
29 percent and others by 43 percent.
In 2014 fish catch for some
species show to be decreased
these species includes Emperors
by 3. Percent, Travellys by 12
percent, Yellow fin tuna by 3,
King fish by 17 percent,
Barracuda by 10 percent,
Shark/Rays by 9 percent (Figure
14).
Figure 13: Estimated Fish Catch by Species, 2013 -
2014

59
Table 2.3.1.7: Estimated Fish Catches and Value by Species, 2010- 2014 (Value „000‟ Tanzanian Shillings)
S/n Species 2010 2011 2012 2013 2014p
English Swahili Tons Value Tons Value Tons Value Tons Value Tons Value
1 Spine foot Tasi 1,023 2,513,104 1,574 4,741,744 867 3,133,911 954 3,364,290 1,091 4,360,079
2 Parrot fish Pono 1,395 3,590,785 1,472 4,563,311 1,654 5,570,262 1,612 5,265,993 1,663 7,118,054
3 Emperors Changu 2,684 7,018,805 2,523 8,423,745 2,077 7,466,974 2,146 7,394,692 2,085 6,743,924 4 Groupers Chewa 714 1,848,107 730 2,068,972 1,702 6,873,342 1,771 6,278,650 1,801 6,253,873 5 Goat fish Mkundaji 881 2,330,821 1,164 3,544,174 2,486 8,499,448 2,487 8,519,002 2,626 10,873,103 6 Surgeon fishes Puju/Kangaja 664 1,367,064 733 1,691,287 2,663 8,935,194 2,732 8,349,251 2,778 10,459,461 7 Mullets Mkizi 359 811,138 803 1,921,094 1,497 5,528,220 1,571 4,992,679 1,715 7,116,990 8 Anchovies Dagaa 2,473 4,983,718 2,026 5,411,998 1,893 6,395,039 1,987 5,891,671 2,048 7,566,739 9 Sardine Sardini 1,199 2,537,648 1,369 3,568,048 799 2,813,031 936 2,884,290 1,076 4,425,036 10 Mackerels Vibua 1,259 3,266,047 1,775 5,681,028 1,097 3,721,983 1,171 4,385,090 1,605 6,494,183 11 Trevally Kole/Karambisi 1,312 3,275,045 1,246 3,657,566 1,299 4,650,819 1,374 5,161,262 1,208 4,519,034 12 Yellow fin tuna Jodari/Sehewa 1,584 4,189,752 1,802 5,872,040 2,423 8,287,407 2,494 9,397,911 2,422 8,612,513 13 Sword fish Nduaro/Mbasi 1,334 3,530,497 1,146 3,482,806 1,412 4,969,633 1,493 5,998,568 1,626 6,257,168
14 King Fish Nguru/Kanadi 1,171 3,018,879 1,625 5,118,426 766 2,707,112 856 3,139,198 711 3,087,722
15 Barracuda Mzia 1,344 3,243,514 1,254 3,582,429 1,427 4,955,066 1,515 4,896,531 1,356 5,348,180
16 Sharks/Rays Papa/Taa 1,418 3,141,659 2,285 6,649,275 1,709 5,673,688 1,776 5,607,066 1,614 6,450,185
17 Octopus/Squid Pweza/Ngisi 1,179 3,087,935 1,467 4,611,382 729 2,774,891 817 3,782,463 1,461 5,727,120
18 Lobsters Kamba 396 1,232,865 912 3,052,744 1,682 5,940,715 1,695 12,562,865 2,190 8,208,133
19 Others Wengine 3,303 6,796,927 2,853 8,025,750 1,229 4,284,257 1,326 4,001,457 1,898 7,301,676
Total 25,692 61784310 28759 85667819 29,411 103,180,992 30,713 111,872,929 32,974 127,214,227
Source: Ministry of Livestock and Fisheries

60
Table 2.3.1.8: Estimated Quantity and Values of Seaweed by Species, 2013 - 2014
Month
2013 2014 2013 2014
Espinosiam Seaweed E. Cottonii Seaweed
Ton Value Ton Value Ton Value Ton Value
January
1,390.02
556,007,600.00
1,221.10
488,439,600.00
22.60
18,082,800
19.22
18,971,000.00
February
916.05
366,419,600.00
1,924.84
769,936,800.00
32.29
25,834,800
18.61
18,606,500.00
March
844.96
337,985,600.00
1,266.20
506,121,600.00
16.27
13,016,000
13.38
13,379,000.00
April
711.86
265,590,900.00
567.68
233,973,250.00
5.61
4,333,600
8.76
8,755,500.00
May
503.19
181,588,200
574.50
257,028,300
8.87
7,098,000
5.04
5,037,000
June
797.82
275,747,850
1,068.91
511,972,250
5.58
4,264,200
7.77
7,769,500
July
767.56
282,907,150
1,506.20
753,101,000
8.07
6,452,800
14.70
16,041,500
Augost
1,224
423,128,850
901
450,882,500
6.72
5,376,800
4
3,860,500
September
1,326
436,093,200
1,049
524,616,000
9.68
7,740,000
8
8,236,000
October
1,037
359,984,550
679
340,173,000
30.11
26,795,850
10
9,718,000
November
689
249,815,900
973
486,668,000
29.39
26,446,500
7
6,668,500
December
635
224,327,650
1,037
631,319,500
25.61
24,651,900
17
17,008,000
Total
10,843.01 3,959,597,050
12,768.95
5,954,231,800.00
200.79
170,093,250
532.63
134,051,000 Source: Ministry of Livestock and Fisheries, Zanzibar
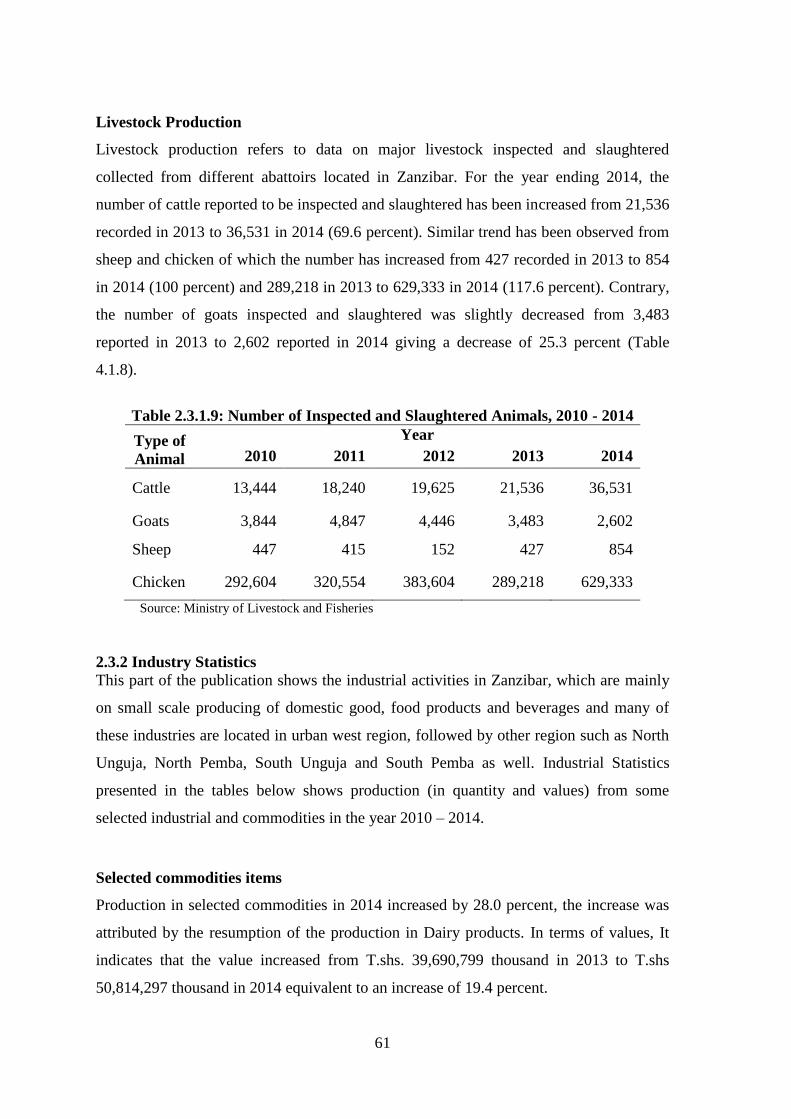
61
Livestock Production
Livestock production refers to data on major livestock inspected and slaughtered
collected from different abattoirs located in Zanzibar. For the year ending 2014, the
number of cattle reported to be inspected and slaughtered has been increased from 21,536
recorded in 2013 to 36,531 in 2014 (69.6 percent). Similar trend has been observed from
sheep and chicken of which the number has increased from 427 recorded in 2013 to 854
in 2014 (100 percent) and 289,218 in 2013 to 629,333 in 2014 (117.6 percent). Contrary,
the number of goats inspected and slaughtered was slightly decreased from 3,483
reported in 2013 to 2,602 reported in 2014 giving a decrease of 25.3 percent (Table
4.1.8).
Table 2.3.1.9: Number of Inspected and Slaughtered Animals, 2010 - 2014
Type of
Animal
Year
2010 2011 2012 2013 2014
Cattle 13,444 18,240 19,625 21,536 36,531
Goats 3,844 4,847 4,446 3,483 2,602
Sheep 447 415 152 427 854
Chicken 292,604 320,554 383,604 289,218 629,333
Source: Ministry of Livestock and Fisheries
2.3.2 Industry Statistics
This part of the publication shows the industrial activities in Zanzibar, which are mainly
on small scale producing of domestic good, food products and beverages and many of
these industries are located in urban west region, followed by other region such as North
Unguja, North Pemba, South Unguja and South Pemba as well. Industrial Statistics
presented in the tables below shows production (in quantity and values) from some
selected industrial and commodities in the year 2010 – 2014.
Selected commodities items
Production in selected commodities in 2014 increased by 28.0 percent, the increase was
attributed by the resumption of the production in Dairy products. In terms of values, It
indicates that the value increased from T.shs. 39,690,799 thousand in 2013 to T.shs
50,814,297 thousand in 2014 equivalent to an increase of 19.4 percent.

62
Production of Wheat flour increased from 23,360 tons in 2013 to 31,899 tons in 2014
equivalent to an increase of 36.6 percent. Production of Door Unplasticized Polyvinyl
Chloride (UPVC) increased from 105 Pcs in 2013 to 168 Pcs in 2014, equivalent to an
increase 60.0 percent. Window (UPVC) increased from 130 Pcs in 2013 to 270 Pcs in
2014, equivalent to an increase 107.7 percent. Production of Garments (Dash Dash)
increased from 3,622 Pcs in 2013 to 3,950 in 2014 equivalent to an increase of 9.1
percent, the increase was largely attributed by the increase demand.
Noodles increased by 2.9 percent in 2014 from 215,915 Kgs in 2013 to 222,392 Kgs in
2014. Production of Jewellery Gold/Silver increase from 6,730 Gms in 2013 to 8,199
Gms in 2014, equivalent to an increase of 21.8 percent. For the value of production in
public industries, it shows that for 2014 the values have increased from T.shs 49,302,663
thousand in 2013 to T.Shs 61,206,083 an increase of 24.1percent. Production of
beverages increased from 12,409,000 litres in 2013 to 12,448,000 litres in 2014
equivalent to an increase of 0.3 percent the increase was due to the demand in domestic
market. Production of bread increased from 127,815,000 breads in 2013 to 143,855,000
bread in 2014. The increase was attributed to increase in demand of bread in the domestic
market equivalent to an increase of 12.5 percent.
Electricity:
Electricity sold to different user in Zanzibar increased by 10.6 percent in 2014 from
246,962,000 Kwh in 2013 to 273,258,000 Kwh in 2014. The increase was attributed by
increase in demand.
The value of electricity distributed increased from T.Shs 49,069,967 in 2013 to
60,858,318 Thousand in 2014. equivalent to an increase of 24.0 percent. The increase
was attributed by the increase in electricity tariff.
The number of new customers connected to National Power Grid declined in 2014
compared to 2013, the number decreased from 10,684 customers in 2013 to 10,440 in
2014, equivalent to a decline of 2.3. The decrease was attributed by increase in the tariff
of electricity connection.

63
Water
Table 4.2.7 the number of Boreholes Drilled declined from 72 from Boreholes in 2013 to
28 Boreholes in 2014, equivalent to a decline of 61.1 percent.
Table 4.2.8 Water Supply and Revenue shows that the production of water was lower by
43.9 percent to its demand side in 2014. Receipts from water bills declined from T.shs
2,041,162 thousand in 2013 to T.shs 2,020,926 thousand in 2014, equivalent to a decline
of 0.9 percent.
Private Sector Development
The government of Zanzibar through ZIPA continue to create conducive investment for
the purpose of attracting new investment, retaining the existing investments and promote
small and medium enterprises (SME)
In 2014 a total of 26 projects worth US $526,713,342 were registered compared with
2013which registered 35 projects. Also in 2014 an employment potential of 1,084 people
were employed compared with 1,365 people in 2013. Table 4.2.9 shows Hotel and
Restaurant attracted more investors with 10 projects worth US $ 336,031,235 and
employment potential of 527 people followed by Real Estate renting and business
activities which attracted 9 projects worth US $ 166,780,000 and employment of 187
people. Wholesale and retail trade were the third with 4 projects worth US $ 21,519,758
and employment of 230 people. Other economic activities which attracted investors
include: Agriculture hunting and forestry with 1 project worth US $ 607,349 and
employment potential of 50 people followed by Health and Social work with 1 project
worth US $1,275,000 and employment potential of 82 people Tour Operation/Diving &
Game Fishing had a 1 project worth US $ 500,000 and potential employment of 8
people.

64
Table 2.3.2.1: Production in Selected Private Industries (Quantity), 2010 – 2014
Production Units 2010 2011 2012 2013 2014p
Beverages***
Liters
(000) 15,414 17,199 14,409 12,409 12,448
Bread No.(000) 108,264 111,512 114,858 127,815 143,855
Wheat Flour Tons 0 0 17,566 23,360 31,899
Dairy Products
Liters
(000) 0 0 0 0 1,527,876
Door UPVC No 125 140 95 105 168
Window UPVC No 43 95 201 130 270
Video / Radio
Tape Cartons 30,648 14,517 4,646 0 0
Garments Dish
Dash (Nguo) Pcs 4,648 4,672 2,877 3,622 3,950
Noodles (Tambi) Kgs 80,417 189,000 199,000 215,915 222,392
Jewellery
(Gold/Silver) Gms 9,508 8,602 8,172 6,730 8,199 Source: Office of Chief Government Statistician (OCGS)
*** Include Mineral Water ,Soft drink and Juice
„0‟ No Production

65
Table 2.3.2.2: Value of Goods Produced for Selected Private Industries, 2010- 2014
(Value „000‟ Tanzanian Shillings)
Description 2010 2011 2012 2013 2014p
Beverages*** 6,766,515 7,474,718 7,461,802 5,407,886 4,081,618
Bread 8,661,142 13,939,000 14,357,250 15,976,805 17,981,926
Wheat Flour 0 0 10,956,516 17,824,268 25,519,200
Dairy
Products 0 0 0 0 2,668,571
Door UPVC 18,899 25,663 14,616 20,900 29,321
Window
UPVC 5,880 16,019 22,425 25,940 41,326
Video /Radio
tape 609,817 315,103 100,934 0 0
Garments
Dish Dash
(Nguo) 46,087 52,118 52,600 94,558 104,940
Noodles
(Tambi)) 92,480 226,800 257,150 323,873 369,918
Jewellery
(Gold/Silver) 26,894 28,583 26,721 16,569 17,477
Total 16,227,714 19,067,017 33,250,014 39,690,799 50,814,297 Source: Office of Chief Government Statistician (OCGS)
*** Include Mineral Water ,Soft drink and Juice
„0‟ No Production
Table 2.3.2.3: Value of Goods Produced in Public Industries, 2010 - 2014
(Value „000‟ Tanzanian Shillings)
Commodity 2010* 2011 2012 2013 2014p
Clove steam Oil 72,690 78,594 538,186 87,310 184,516
Essential Oil (Others) 8,254 58,571 104,899 51,377 18,928
Printing 52,250 58,781 87,450 94,009 144,321
Electricity Distribution 17,491,340 35,356,448 37,230,708 49,069,967 60,858,318
Total 17,671,853 35,607,047 37,961,243 49,302,663 61,206,083
Source: Office of Chief Government Statistician „0‟ No Production
Note: * Black out of power from Dec, 2009 up to March, 2010

66
Table 2.3.2.4: Quantity of Electricity Distributed, 2010 – 2014 (KWH “000”)
Description 2010* 2011 2012
Commercial 18,698 17,608 19,466
Domestic 45,512 60,698 60,425
large Industry 36,509 45,194 45,260
Medium Industry 30,639 28,719 33,678
Small Industry 979 2,527 2,381
Street Light 698 935 270
TUKUZA 63,929 92,255 61,818
Total 196,866 247,936 223,407
Source: Zanzibar Electricity Corporation „0‟ No Production
Note: * Black out of power from Dec, 2009 up to March, 2010.
Table 2.3.2.5: Value of Electricity Distributed, 2010 - 2014
(Value „000‟ Tanzanian Shillings)
Description 2010* 2011 2012
Commercial 1,857,699 3,443,229 3,125,347
Domestic 3,685,301 7,282,752 7,431,925
Large Industry 3,219,954 6,598,362 6,778,206
Medium Industry 3,323,285 6,166,052 6,725,902
Small Industry 113,326 506,779 467,993
Street Lights 69,011 355,841 259,517
TUKUZA 5,222,767 11,003,433 12,715,639
Total 17,491,343 35,356,448 37,504,529 Source: Zanzibar Electricity Corporation
Note: * Black out of power from Dec, 2009 up to March, 2010.

67
Table 2.3.2.6: Quantity of Electricity Distributed, 2014 (KWH “000”)
Description 2013 2014p
Domestic (ZECO 0) 7,098 6,735
Commercial & Domestic (ZECO 1) 58,202 54,393
Small Industry (ZECO 2) 3,668 3,432
Large & Medium Industry (ZECO 3) 88,396 95,882
Street Lights (ZECO 4) 155 475
TUKUZA 89,443 112,341
Total 246,962 273,258 Source: Zanzibar Electricity Corporation (ZECO)
Figure 14: Quantity of Electricity Distributed, 2014

68
Table 2.3.2.7: Value of Electricity Distributed, 2014 (Value „000‟ Tanzanian Shillings)
Description 2013 2014p
Domestic (ZECO 0) 853,798 1,265,216
Commercial & Domestic (ZECO 1) 10,972,544 12,114,581
Small Industry (ZECO 2) 739,911 659,542
Large & Medium Industry (ZECO 3) 15,242,248 15,833,277
Street Lights (ZECO 4) 43,815 66,964
TUKUZA 21,217,651 30,918,735
Total 49,069,967 60,858,318 Source: Zanzibar Electricity Corporation (ZECO)
Note: ZECO 0 Domestic
ZECO 1 Commercial &Domestic
ZECO 2 Small Industry
ZECO 3 Large &Medium Industry
ZECO 4 Street Lights
Table 2.3.2.8: Total Number of New Customers Connected to National
Power Grid 2010 - 2014
Area 2010* 2011 2012 2013 2014p
Unguja 1,954 4,148 7,190 7,919 7,824 Pemba 1,121 897 1,531 2,765 2,616
Zanzibar 3,075 5,045 8,721 10,684 10,440 Source: Zanzibar Electricity Corporation (ZECO) Note: * ZECO (No. of new Customers Connected to the grid due to the power
black out of power from Dec 2009 Up to March, 2010
Table 2.3.2.9: Total Number of Boreholes Drilled from 2010 – 2014
Region 2010 2011 2012 2013 2014p
Kaskazini Unguja 2 1 1 8 11
Kusini Unguja 1 4 3 19 8
Mjini Magharibi 1 4 6 20 2
Kaskazini Pemba 1 0 1 11 6
Kusini Pemba 1 0 2 14 1
Total 6 9 13 72 28 Source: Zanzibar Water Authority (ZAWA)

69
Table 2.3.2.10: Water Supply and Revenue Collection by Region, 2014
Region
Total Water
Production (Cubic
meter)
Estimated Water
Demand (Cubic
meter)
Deficit in
Demand
Revenue
Collection T.shs
Kaskazini Unguja 4,656,245 8,098,056 42.50 91,568,257
Kusini Unguja 4,171,587 4,993,401 16.46 80,947,172
Mjini Magharibi 13,151,078 25,646,889 48.72 1,792,864,373
Kaskazini Pemba 4,932,000 8,429,011 41.49 24,330,950
Kusini Pemba 4,684,000 9,146,822 48.79 31,215,800
Total 31,594,910 56,314,179 43.90 2,020,926,552 Source: Zanzibar Water Authority (ZAWA)
Table 2.3.2.11: Approved Projects From 2010 - 2014
Approved Projects 2010 2011 2012 2013 2014p Total
A - Agriculture hunting and forestry 1 3 2 2 1 9
B – Fishing 0 0 0 1 0 1
D - Manufacturing 1 9 3 3 0 16
G - Wholesale and retail trade 1 0 0 0 4 5
H - Hotels and Restaurant 25 22 13 16 10 84
I - Transport storage and
communications 1 4 1 2 0 8
K - Real Estate Renting and Business
Activities 0 3 3 7 9 22
M - Education 1 1 1 2 0 5
N - Health and Social Work 0 0 0 0 1 1
Tour Operation/Diving & Game Fishing 3 1 1 2 1 8
Total 33 47 25 35 26 165
Source: Zanzibar Investment Promotion Authority (ZIPA)

70
Table 2.3.2.12: Approved Capital, 2010 – 2014 Capital in US Dollar
Industry 2010 2011 2012 2013 2014p
A - Agriculture hunting and forestry 1,402,335 2,302,325 700,000 1,845,250
607,349
B – Fishing 0 0 0 610,000 0
D - Manufacturing 674,840 7,483,700 21,630,516 123,137,000 0
G - Wholesale and retail trade 1,139,250 4,707,200 0 0 21,519,758
H - Hotels and Restaurant 109,903,200 48,598,000 32,086,906 196,272,350 336,031,235
I - Transport storage and communications 0 56,500,000 500,000 610,000,000 0
K - Real Estate Renting and Business
Activities 0 41,100,000 1,900,000 128,140,318 166,780,000
M - Education 200,000 168,300 750,000 2,000,000 0
N - Health and Social Work 0 0 0 0 1,275,000
Tour Operation/Diving & Game Fishing 1,891,992 705,000 502,000 2,361,740 500,000
Total 115,211,617 161,564,525 59,069,422 1,061,911,408 526,713,342
Source: Zanzibar Investment Promotion Authority (ZIPA)
Table 2.3.2.13: Approved Employment, 2011-2014
Industry 2011 2012 2013 2014p
A - Agriculture hunting and forestry 662 80 82 50
B - Fishing 0 0 22 0
D - Manufacturing 377 345 170 0
G - Wholesale and retail trade 137 0 0 230
H - Hotels and Restaurant 970 554 642 527
I - Transport storage and communications 35 13 101 0
K - Real Estate Renting and Business
Activities 50 56 262 187
M - Education 30 35 35 0
N - Health and Social Work 0 0 0 82
Tour Operation/Diving & Game Fishing 46 30 51 8
Total 2,307 1,123 1,365 1,084
Source: Zanzibar Investment Promotion Authority (ZIPA)

71
SECTION THREE: SOCIAL STATISTICS
3.1 Education Statistics
The statistics presented in this section covers primary, secondary and tertiary education.
It includes enrolment, number of schools, number of teachers, and other key education
indicators. The indicators discussed build a trend from 2010 to 2014. Education services
in Zanzibar are provided through different levels. These include pre-primary education,
primary education, secondary education and tertiary education. The primary education is
a six years education cycle after pre-primary. It is compulsory to all children from the age
of six years. The formal secondary education consists of two sequential cycles. The first
phase is a four year ordinary level (Form I to Form IV).The second phase is a two year
program of advanced level (Form V to Form VI).Currently the Government of Zanzibar
provides free education for all citizens from standard 1 to form 2. In accordance with the
2006 Education Policy, the government is transitioning to system of compulsory
education from pre-primary until Form 4. Currently Zanzibar is partway through the
transition to the new education system. Access at the pre-primary level is being increased
and initiatives are being taken to increase the transition rate from Form 2 to Form 3 to
enable the introduction of four years of compulsory secondary education. Education data
are collected by the Ministry of Education and Vocational Training Zanzibar.
Zanzibar has made significant progress in increasing the number of students attending
basic education. There has been a 10.4% increase in Primary education in the past 5
years, from 226,812 students in 2010 to 253,152 students in 2014. At Ordinary
Secondary level (Form 1 - Form 4) enrolment has been roughly stagnant, falling by 0.4%
from 80,008 students in 2010 to 79,662 students in 2014. Moving beyond basic education
progress has been less positives with a 54% decrease in enrolment at this level between
2010 and 2014. At all levels of education, excepting the pre-primary level, the
government is the dominant education provider. Increase in enrolment has been
complimented by investments in school infrastructure and the capacity of teachers
training institutions. The number of government schools offering either primary or
secondary education increased from 392 in 2013 to 407 in 2014. For private schools there
was an increase from 94 in 2013 to 99 in 2014.

72
Tertiary Education
In 2014, Zanzibar had total of 3 universities, 3 training colleges and 7 institutions. This
reflects that the number of institutions and universities has remained the same since 2010
in both Public and Private Colleges and universities
Pupil Teacher ratio is the number of pupils (students) per teacher at a specific level of
education in a given school year. This is a very important ratio as it shows the strength of
student-teacher-contact hours. The higher the ratio the less student-teacher-contact hours
and hence there is less student-teacher consultations. It also means that there is higher
teaching load to teachers and they lose the required time to effectively supervise
students‟ work. The teacher student ratio is therefore among the important indicators of
quality of education. The data shows that Students teacher ratio for both public and
private from 2013 to 2014 was 26 students per teacher for each year.
The result for education statistics are mainly presented from table 2.1.1 to table 2.1.27 the
data shows that the number of primary public schools which offers basic education
increased from 234 schools in 2013 to 359 schools in 2014, the number of secondary
schools was increased from 144 in 2013 to 147 schools in 2014 .
On other hand the number of private schools registered, revealed that the total number of
primary rose by 7 schools from 2013 to 2014 which indicate the increased of 13 percent
(from 47 schools in 2013 to 54 schools in 2014) meanwhile the number of private
secondary schools decreases from 15 schools in 2013 to 10 schools in 2014 as compared
to the number of technical colleges, business biased schools and universities which
remain constant.
The total students enrolment in public schools (STDI) decrease from 35,703 pupils in
2013 to 35,535 pupils in 2014, so this represents an decrease by 0.5 percent or 168
pupils.
The total number of students in public schools (provide basic education) increase from
230,377 students in 2013 to 233,883 students in 2014 which indicates an increase of 1.5
percent or 3,506 students for primary public schools, however the number of students in

73
secondary schools was slightly decrease from 70,677 in 2013 to73, 285 in 2014 which
indicates an increase of 2,608 students.
The examination results for F.II students in 2014 shows that the total number of
candidate who sat for F.II examination in 2014 was 21,944 students. A total of 14,384
students passed and the remaining 7,560 students fail the exam.
The examination results for F.IV students in 2014 show that, the number of students in
public schools passed for IV examination results decreased from 68.48 percent in 2013 to
60.2 percent in 2014 also the number of student passed for grade I (Distinction) decrease
from 130 in 2013 to 109 in 2014 (1.1 percent in 2013 to 0.9 percent in 2014) while those
who passed with grade II, III and IV increased from 534, 1,289 and 6,157 students in
2013 to 627, 1295 and 5682 students in 2014 respectively.
Advance level (Form VI) examination results show that there an increased from 74.0
percent in 2013 to 95.5 percent in 2014.The number of student who passed grade I and II
increased from 51 to 1 student (passed grade I) and from 194 to 40 students (passed
grade II) from 2014 to 2013 respectively.
(a) Education Facilities
Table 3.1.1 shows that the number of primary schools which offers basic education
increased from 234 schools in 2013 to 250 schools in 2014, the number of secondary
schools was increased from 144 in 2013 to 147 schools in 2014 for both public and
private school

74
Table 3.1.1: Public and Private Education Facilities by Category, 2010- 2014
(Number)
Category 2010 2011 2012 2013 2014p
Nursery Schools 238 242 253 278 279
Primary Schools 185 200 194 234 250
Primary & Middle Schools 114 121 137 108 109
Secondary Schools 113 117 107 144 147
Technical Biased Schools 3 3 3 3 3
Islamic Biased Schools 2 2 2 2 2
Technical College 1 1 1 1 1
Teachers Training College 1 1 3 3 3
Science Biased Schools 0 1 1 4 8
Social science biased school 3 2 3 3 5
Business Biased Schools 2 2 2 2 2
French Language Biased School 1 1 1 1 1
Vocational Training Schools 3 3 3 3 3
Institutes 7 7 7 7 7
Universities 3 3 3 3 3 Source: Ministry of Education and Vocational Training Zanzibar
Table 3.1.2: Public Education Facilities by Category, 2010- 2014
(Number)
Category 2010 2011 2012 2013 2014p
Nursery Schools 27 29 30 34 35
Primary Schools 148 156 155 187 196
Primary & Middle Schools 92 93 110 76 74
Secondary Schools 105 108 99 129 137
Technical Biased Schools 2 2 2 2 2
Islamic Biased Schools 2 2 2 2 2
Technical College 1 1 1 1 1
Teachers Training College 1 1 3 3 3
Science Biased Schools 3 3 3 3 3
Social science biased school 2 1 2 2 4
Business Biased Schools 2 2 2 2 2
French Language Biased 1 1 1 1 1
Vocational Training Schools 3 3 3 3 3
Institutes 7 7 7 7 7
Universities 1 1 1 1 1 Source: Ministry of Education and Vocational Training. Zanzibar

75
Table 2.1.3 reveals that the total number of primary school rose by 7 schools from 2013
to 2014 which indicate the increase of 13 percent (from 47 schools in 2013 to 54 schools
in 2014).
Table 3.1.3: Private Education Facilities by Category, 2010- 2014
(Number)
Category 2010 2011 2012 2013 2014p
Nursery Schools 211 213 223 244 244
Primary Schools 37 44 39 47 54
Primary & Middle Schools 22 28 27 32 35
Secondary Schools 8 9 8 15 10
Technical Biased Schools 1 1 1 1 1
Science Biased Schools 0 0 0 0 0
Social science biased school 1 1 1 1 1
Vocational Training Schools 0 0 0 0 0
University 2 2 2 2 2 Source: Ministry of Education and Vocational Training Zanzibar
Table 3.1.4: STD I Enrolment in Public Schools by Sex, 2010- 2014
Sex 2010 2011 2012 2013 2014p
Male 16,615 15,565 17,204 17,843 18,170
Female 16,368 15,581 16,941 17,860 17,365
Total 32,983 31,146 34,145 35,703 35,535
Percentage Change 4.6 -5.9 9.6 4.6 -0.5
Source: Ministry of Education and Vocational Training, Zanzibar
Table 3.1.5: STD I Enrolment in Private School by Sex, 2010- 2014.
Sex 2010 2011 2012 2013 2014p
Male 1,185 1,441 1,602 1,750 2,149
Female 1,253 1,593 1,711 1,890 2,170
Total 2,438 3,034 3,313 3,640 4,319
Percentage Change 6.5 24.4 9.2 9.0 15.7
Source: Ministry of Education and Vocational Training, Zanzibar

76
Table 3.1.6: STD I Enrolment in Public and Private Schools by District, 2010 – 2014
District
2010 2011 2012 2013 2014p
Public Private Public Private Public Private Public Private Public Private
Kaskazini „A‟ 3,037 - 3,638 - 2,715 - 3,241 - 3,493 -
Kaskazini'B' 1,703 - 1,807 - 1,712 - 1,892 - 1,538 43
Kati 2,370 95 2,360 108 2,306 99 2,345 88 2,351 85
Kusini 1,372 33 1,153 29 1,034 76 1,031 42 967 98
Magharibi 4,529 1,210 4,298 1,736 4,255 2,029 9037 2,325 8,879 2,535
Mjini 7,122 806 5,621 924 8,541 842 4,114 947 4,029 1,190
Micheweni 3,298 - 3,330 - 3,853 - 3,772 - 3,305 55
Wete 2,974 41 2,906 24 2,938 33 3,584 35 3,861 33
Chake Chake 3,540 253 2,821 213 3,265 219 3,207 203 3,604 240
Mkoani 3,038 - 3,212 - 3,535 15 3,480 - 3,508 40
Total 32,983 2,438 31,146 3,034 34,154 3,313 35,703 3,640 35,535 4,319
Source: Ministry of Education and Vocational Training, Zanzibar

77
Table 3.1.7: Pupils in Public and Private Primary Schools, 2010- 2014. (Number)
STD 2010 2011 2012 2013 2014p
Male Female Total Male Female Total Male Female Total Male Female Total Male Female Total
I 19,580 19,163 38,743 21,166 20,097 41,263 21,126 20,395 41,521 21,758 21,104 42,862 21,933 21,129 43,062
II 18,071 17,525 35,596 18,495 18,180 36,675 19,399 18,883 38,282 20,183 19,804 39,987 20,653 20,343 40,996
III 17,358 17,098 34,456 17,662 17,268 34,930 17,605 17,560 35,165 18,591 18,529 37,120 19383 19,484 38,867
IV 16,543 16,810 33,353 17,433 17,106 34,539 16,831 16,774 33,605 16,737 17,383 34,120 18,124 18,121 36,245
V 14,571 14,743 29,314 15,857 16,650 32,507 16,451 16,624 33,075 16,414 16,378 32,792 15,789 16,581 32,370
VI 14,621 14,756 29,377 14,834 14,774 29,608 15,822 16,340 32,162 15,870 16,164 32,034 16,225 16,236 32,461
VII 12,117 13,856 25,973 13,621 14,547 28,168 12,660 13,652 26,312 13,507 14,930 28,437 14,057 15,094 29,151
Total 112,861 113,951 226,812 119,068 118,622 237,690 119,894 120,228 240,122 123,060 124,292 247,352 126,164 126,988 253,152
Source: Ministry of Education and Vocational Training, Zanzibar
Table 3.1.8: Pupils in Public Primary Schools, 2010- 2014.
(Number)
STD 2010 2011 2012 2013 2014p
Male Female Total Male Female Total Male Female Total Male Female Total Male Female Total
I 18,395 17,910 36,305 19,725 18,504 38,229 19,524 18,684 38,208 20,008 19,214 39,222 19,570 18,959 38,529
II 17,017 16,512 33,529 17,275 16,890 34,165 18,207 17,510 35,717 18,596 18,174 36,770 19,008 18,597 37,605
III 16,389 16,140 32,529 16,495 16,156 32,651 16,406 16,321 32,727 17,309 17,110 34,419 17,859 17,942 35,801
IV 15,699 15,895 31,594 16,378 16,124 32,502 15,840 15,748 31,588 15,605 16183 31,788 16,859 16,753 33,612
V 13,820 14,001 27,821 15,008 15,702 30,710 15,510 15,679 31,189 15,427 15,331 30,758 14,687 15,482 30,169
VI 13,965 14,146 28,111 14,026 14,024 28,050 15,062 15,528 30,590 15,043 15,337 30,380 15,325 15,275 30,600
VII 11,598 13,297 24,895 12,999 13,929 26,928 12,010 13,000 25,010 12,861 14,179 27,040 13,282 14,285 27,567
Total 106,883 107,901 214,784 111,906 111,329 223,235 112,559 112,470 225,029 114,849 115,528 230,377 116,590 117,293 233,883
Source: Ministry of Education and Vocational Training , Zanzibar
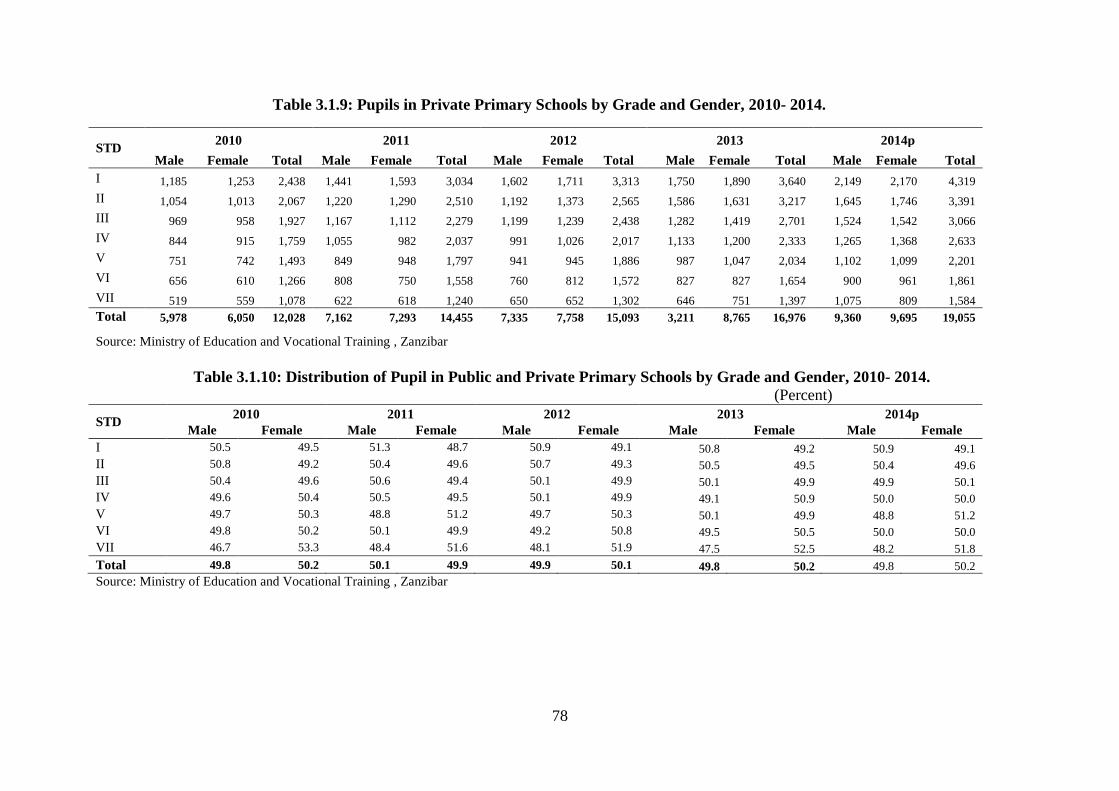
78
Table 3.1.9: Pupils in Private Primary Schools by Grade and Gender, 2010- 2014.
Source: Ministry of Education and Vocational Training , Zanzibar
Table 3.1.10: Distribution of Pupil in Public and Private Primary Schools by Grade and Gender, 2010- 2014.
(Percent)
STD 2010 2011 2012 2013 2014p
Male Female Male Female Male Female Male Female Male Female
I 50.5 49.5 51.3 48.7 50.9 49.1 50.8 49.2 50.9 49.1
II 50.8 49.2 50.4 49.6 50.7 49.3 50.5 49.5 50.4 49.6
III 50.4 49.6 50.6 49.4 50.1 49.9 50.1 49.9 49.9 50.1
IV 49.6 50.4 50.5 49.5 50.1 49.9 49.1 50.9 50.0 50.0
V 49.7 50.3 48.8 51.2 49.7 50.3 50.1 49.9 48.8 51.2
VI 49.8 50.2 50.1 49.9 49.2 50.8 49.5 50.5 50.0 50.0
VII 46.7 53.3 48.4 51.6 48.1 51.9 47.5 52.5 48.2 51.8
Total 49.8 50.2 50.1 49.9 49.9 50.1 49.8 50.2 49.8 50.2
Source: Ministry of Education and Vocational Training , Zanzibar
STD 2010 2011 2012 2013 2014p
Male Female Total Male Female Total Male Female Total Male Female Total Male Female Total
I 1,185 1,253 2,438 1,441 1,593 3,034 1,602 1,711 3,313 1,750 1,890 3,640 2,149 2,170 4,319
II 1,054 1,013 2,067 1,220 1,290 2,510 1,192 1,373 2,565 1,586 1,631 3,217 1,645 1,746 3,391
III 969 958 1,927 1,167 1,112 2,279 1,199 1,239 2,438 1,282 1,419 2,701 1,524 1,542 3,066
IV 844 915 1,759 1,055 982 2,037 991 1,026 2,017 1,133 1,200 2,333 1,265 1,368 2,633
V 751 742 1,493 849 948 1,797 941 945 1,886 987 1,047 2,034 1,102 1,099 2,201
VI 656 610 1,266 808 750 1,558 760 812 1,572 827 827 1,654 900 961 1,861
VII 519 559 1,078 622 618 1,240 650 652 1,302 646 751 1,397 1,075 809 1,584
Total 5,978 6,050 12,028 7,162 7,293 14,455 7,335 7,758 15,093 3,211 8,765 16,976 9,360 9,695 19,055

79
Table 3.1.11: Pupils in Public and Private Secondary Schools, 2010- 2014.
(Number)
Form 2010 2011 2012 2013 2014p
Male Female Total Male Female Total Male Female Total Male Female Total Male Female Total
I 12,403 12,952 25,355 12,699 14,216 26,915 13,258 14,063 27,321 12,819 13,654 26,473 7,189 21,308 28,497
II 10,908 12,620 23,528 10,842 12,177 23,019 10,856 12,931 23,787 10,642 12,864 23,506 11,013 12,399 23,412
III 6,431 7,383 13,814 6,280 7,932 14,212 6,191 7,153 13,344 5,851 8,157 14,008 6,193 8,175 14,368
IV 7,981 9,330 17,311 6,210 7,315 13,525 6,056 7,657 13,713 5,761 6,960 12,721 5,511 7,874 13,385
Total 37,723 42,285 80,008 36,031 41,640 77,671 36,361 41,804 78,165 35,073 41,635 76,708 29,906 49,756 79,662
Source: Ministry of Education and Vocational Training, Zanzibar
Table 3.1.12: Pupils in Public Secondary School, 2010- 2014. (Number)
Form 2010 2011 2012 2013 2014p
Male Female Total Male Female Total Male Female Total Male Female Total Male Female Total
I 11,923 12,408 24,331 12,090 13,528 25,618 12,528 13,288 25,816 12,131 12,798 24,929 12,733 14,113 26,846
II 10,354 11,962 22,316 10,187 11,442 21,629 10,146 12,171 22,317 9,964 12,021 21,985 10,187 11,583 21,770
III 5,968 6,786 12,754 5,532 7,062 12,594 5,494 6,417 11,911 5,148 7,293 12,441 5,450 7,227 12,677
IV 7,451 8,795 16,246 5,641 6,543 12,184 5,322 6,836 12,158 5,137 6,185 11,322 4,936 7,056 11,992
Total 35,696 39,951 75,647 33,450 38,575 72,025 33,490 38,712 72,202 32,380 38,297 70,677 33,306 39,979 73,285
Source: Ministry of Education and Vocational Training, Zanzibar

80
Table 3.1.13: Pupils in Private Secondary Schools, 2010- 2014
(Number)
Form 2010 2011 2012 2013 2014p
Male Female Total Male Female Total Male Female Total Male Female Total Male Female Total
I 480 544 1,024 609 688 1,297 730 775 1,505 688 856 1,544 756 895 1,651
II 554 658 1,212 655 735 1,390 710 760 1,470 678 841 1,519 738 904 1,642
III 463 597 1,060 748 870 1,618 697 736 1,433 703 864 1,567 743 948 1,691
IV 530 535 1,065 569 772 1,341 734 821 1,555 624 775 1,399 575 818 1,393
Total 2,027 2,334 4,361 2,581 3,065 5,646 2,871 3,092 5,963 2,693 3,336 6,029 2,812 3,565 6,377
Source: Ministry of Education and Vocational Training, Zanzibar
Table 3.1.14: Distribution of Pupils in Public and Private Secondary Schools by Sex and Form, 2010- 2014 (Percent)
Form 2010 2011 2012 2013 2014p
Male Female Male Female Male Female Male Female Male Female
I 48.9 51.1 47.2 52.8 48.5 51.5 48.4 51.6 25.2 74.8
II 46.4 53.6 47.1 52.9 45.6 54.4 45.3 54.7 47.0 53.0
III 46.6 53.4 44.2 55.8 46.4 53.6 41.8 58.2 43.1 56.9
IV 46.1 53.9 45.9 54.1 44.2 55.8 45.3 54.7 41.2 58.8
Total 47.1 52.9 46.4 53.6 46.5 53.5 45.7 54.3 37.5 62.5
No. of Students 37,723 42,285 36,031 41,640 36,361 41,804 35,073 41,635 29,906 49,756 Source: Ministry of Education and Vocational Training, Zanzibar

81
Table 3.1.15: Pupils in Public and Private Advanced Secondary Schools by Sex and Form, 2010- 2014 (Number)
2010 2011 2012 2013 2014p
Male Female Total Male Female Total Male Female Total Male Female Total Male Female Total
Form V: Public 930 789 1,719 983 1,030 2,013 671 643 1,314 478 544 1,022 450 257 707
Private 108 134 242 120 138 258 59 57 116 50 88 138 46 79 125
Total 1038 923 1961 1103 1168 2271 730 700 1430 528 632 1160 496 336 832
Form VI: Public 1015 893 1908 880 807 1,687 936 941 1,877 516 491 1,007 502 474 976
Private 114 108 222 61 163 224 114 111 225 45 38 83 62 89 151
Total 1,129 1,001 2,130 941 970 1,911 1,050 1,052 2,102 561 529 1,090 564 563 1,127
Total Students 2,167 1,924 4,091 2,044 2,138 4,182 1,780 1,752 3,532 1,089 1,161 2,250 1,060 899 1,959 Source: Ministry of Education and Vocational Training, Zanzibar

82
Table 3.1.16: Distribution of Pupils in Public and Private Advanced Secondary Schools by Sex and Form, 2010- 2014
(Percent)
2010 2011 2012 2013 2014p
Male Female Male Female Male Female Male Female Male Female
Form V: Public 54.1 45.9 48.8 51.2 51.1 48.9 46.8 53.2 63.6 36.4
Private 44.6 55.4 46.5 53.5 50.9 49.1 36.2 63.8 36.8 63.2
Total 52.9 47.1 48.6 51.4 51.0 49.0 45.5 54.5 59.6 40.4
Form VI: Public 53.2 46.8 52.2 47.8 49.9 50.1 51.2 48.8 51.4 48.6
Private 51.4 48.6 27.2 72.8 50.7 49.3 54.2 45.8 41.1 58.9
Total 53.0 47.0 49.2 50.8 50.0 50.0 51.5 48.5 50.0 50.0
Total Students 2,167 1,924 2,044 2,138 1,780 1,752 1,089 1,161 1,060 899 Source: Ministry of Education and Vocational Training, Zanzibar

83
The examination results for F.II students in 2014 shows that the total number of candidate
who sat for F.II examination in 2014 was 21,944 students. A total of 14,384 students passed
and the remaining 7,560 students fail the exam as shown from the table 5.1.17 below.
Table 3.1.17: Form II Examination Results, 2010- 2014
Category Sex Year
2010 2011 2012 2013 2014
Candidates
Male 8,800 9,119 8,644 8,662 10,119
Female 11,055 10,547 11,035 10,660 11,825
Total 19,855 19,666 19,679 19,322 21,944
Passed
Male 4,889 4,975 4,427 4,805 6,373
Female 6,673 6,066 6,768 6,678 8,011
Total 11,562 11,041 11,195 11,483 14,384
Failed
Male 3,911 4,144 4,217 3,857 3,746
Female 4,382 4,481 4,267 3,982 3,814
Total 8,293 8,625 8,484 7,839 7,560
Source: Ministry of Education and Vocational Training, Zanzibar
Table 3.1.18: Distribution of Form II Examination Results by Sex 2010-2014
Category Sex Year
2010 2011 2012 2013 2014
Candidates
Male 44.3 46.4 43.9 44.8 46.1
Female 55.7 53.6 56.1 55.2 53.9
Total 100 100 100 100 100
Passed
Male 55.6 54.6 22.5 55.5 63.0
Female 60.4 57.5 34.4 62.6 67.8
Total 58.2 56.1 56.9 59.4 65.6
Failed
Male 44.4 45.4 21.4 44.5 17.1
Female 39.6 42.5 21.7 37.4 59.8
Total 41.8 43.9 43.1 40.6 34.5 Source: Ministry of Education and Vocational Training, Zanzibar

84
Table 3.1.19: Form IV Examination Results by Sex and Grade, 2010- 2014.
(Number)
Source: Ministry of Education and Vocational Training, Zanzibar
Table 3.1.20 Distribution of Form IV Examination Results by Sex and Grade, 2010- 2014
(Percent)
Grade
2010 2011 2012 2013 2014
Male Female Total Male Female Total Male Female Total Male Female Total Male Femal
e Total
I 0.5 0.8 0.3 0.6 0.4 0.5 0.3 0.4 0.3 1.4 0.8 1.1 1.1 0.7 0.9
II 1.9 1.4 0.8 1.1 0.7 0.9 1.4 0.9 1.1 5.5 3.8 0.05 6.2 4.0 4.9
III 13.8 9.8 6.5 7.0 6.1 6.5 5.1 3.7 4.3 12.3 9.8 0.11 11.7 9.0 10.1
IV 64.8 60.1 64.1 64.5 71.1 68.0 46.5 48.0 47.3 49.9 53.6 52.0 41.2 46.5 44.3
Passed 81.0 72.1 71.7 73.2 75.9 75.9 73.2 53.0 53.1 69.13 67.97 68.48 60.1 60.3 60.2
Failed 19.0 27.9 28.3 26.8 24.1 24.1 26.8 47.0 46.9 30.87 32.03 31.52 39.9 39.7 39.8
Source: Ministry of Education and Vocational Training, Zanzibar
Grade
2010 2011 2012 2013 2014
Male Female Total Male Female Total Male Female Total Male Female Total Male Female Total
I 60 29 89 33 27 60 17 28 45 74 56 130 57 52 109
II 102 72 174 62 45 107 80 70 150 283 251 534 326 301 627
III 736 592 1,328 384 388 772 287 275 562 637 652 1,289 614 681 1,295
IV 4,515 5,839 10,354 3,539 4,542 8,081 2,627 3,551 6178 2,587 3,570 6,157 2,170 3,512 5,682
Passed 5,413 6,532 11,945 4,018 5,002 9,020 3,011 3,924 6,935 3,581 4,529 8,110 3,167 4,546 7,713
Failed 2,097 2,583 4,680 1,473 1,384 2,857 2,640 3,476 6,116 961 2,133 3,094 2,100 2,999 5,099
Candidates 7,510 9,115 16,625 5,491 6,386 11,877 5,651 7,400 13,051 4,542 6,662 11,204 5,267 7,545 12,812

85
Table 3.1.21: Form VI Examination Results by Sex and Grade, 2009/10 – 2013/14
(Number)
Grade 2009/2010 2010/2011 2011/2012 2012/2013 2013/2014
Male Female Total Male Female Total Male Female Total Male Female Total Male Female Total
I 23 16 39 34 9 43 9 8 17 1 0 1 26 25 51
II 89 42 131 100 89 189 32 55 87 20 20 40 98 96 194
III 563 463 1,026 630 599 1,229 409 400 809 529 595 1124 295 334 629
IV 241 222 463 245 234 479 211 217 428 222 249 471 129 104 233
Passed 916 743 1,659 1,009 931 1,940 661 680 1,341 772 864 1,636 548 559 1,107
Failed 169 131 300 181 187 368 237 235 472 238 193 431 38 14 52
Candidate 1,085 874 1,959 1,190 1,118 2,308 898 915 1,813 1,010 1,057 2,067 586 573 1,159 Source: Ministry of Education and Vocational Training, Zanzibar
Table 3.1.22 Distribution of Form VI Examination Results by Sex and Grade, 2009/2010 – 2013/2014
(Percent)
Grade 2009/2010 2010/2011 2011/2012 2012/2013 2013/2014
Male Female Total Male Female Total Male Female Total Male Female Total Male Female Total
I 2.9 0.8 1.9 1.3 1.1 1.2 1.0 0.9 0.9 0.1 0.0 0.05 4.4 4.4 4.4
II 8.4 8.0 8.1 6.5 5.4 6.0 3.6 6.0 4.8 2.1 1.9 1.9 16.7 16.8 16.7
III 52.9 53.6 53.2 43.7 47.4 45.4 45.5 43.7 44.6 52.4 56.3 54.4 50.3 58.3 54.3
IV 20.6 20.9 20.7 23.5 25.2 24.8 23.5 23.7 23.6 22.0 23.6 22.8 22.0 18.2 20.1
Passed 84.8 83.3 84.0 76.0 79.1 77.4 73.6 74.3 74.0 76.4 81.7 79.1 93.5 97.6 95.5
Failed 15.2 16.7 16.0 24.0 20.9 22.6 26.4 25.7 26.0 23.6 18.3 20.9 6.5 2.4 4.5 Source: Ministry of Education and Vocational Training, Zanzibar

86
Table 3.1.23: STD I - Form VI Pupil Teacher Ratio in Private and Public Schools, 2010- 2014
Year
Public Schools Private Schools Total
Number
of
Pupils
Number of
Teachers
Pupil
Teacher
Ratio
Number
of
Pupils
Number
of
Teachers
Pupil
Teacher
Ratio
Number
of
Pupils
Number
of
Teachers
Pupil
Teacher
Ratio
2010 294,058 9,938 30 16853 1,059 16 310,911 10,997 28
2011 29,8927 10,513 28 20,616 1,209 17 319,543 11,722 27
2012 273,162 9,141 30 18068 1,195 15 291,230 10,336 28
2013 277,291 9,894 28 20,039 1,524 13 297,330 11,418 26
2014p 282,773 9,961 28 22,348 1,632 14 305,121 11,592 26 Source: Ministry of Education and Vocational Training, Zanzibar

87
Table 3.1.24: Higher Learning Institution Enrolment, 2013-2014.
Institutions
2013/2014 2014/2015
Male Female Total Male Female Total
Public
State University of Zanzibar 750 915 1,665 834 1,244 2,078
Zanzibar Journalism and Mass media College 58 123 181 63 115 178
Benjamin mkapa Teacher Training colleges 51 125 176 58 136 194
Pemba Islamic College (Teacher Training) 132 177 309 163 200 363
Mazizini Islamic College (Teacher Training) 74 357 431 69 368 437
Institute of Public Administration (IPA) 379 1159 1538 994 1384 2378
Kizimbani Agriculture Institute (KAT) 47 96 143 40 91 131
Institute of Kurume and technology 219 53 273 202 80 282
Private
Zanzibar University 659 638 1,297 970 1,110 2,080
University College of Education, Chukwani 605 915 1,523 707 1,173 1,880
Total 2,376 3,346 5,725 4,100 5,901 10,001 Source: Ministry of Education and Vocational Training , Zanzibar

88
Table 3.1.25: Number of Graduates in Higher Institution Zanzibar, 2011-2014
Field
2010/2011 2011/2012 2012/2013 2013/2014 2014/2015
Male Female Male Female Male Female Male Female Male Female
Diploma 390 1,127 282 669 616 1,208 1729 1,724 525 925
Undergraduate 461 364 505 391 530 411 439 457 524 557
Master
graduate - - - - 3 1 1 1 14 6
Total 747 1,428 715 1,001 960 1,479 1,129 2,049 832 1,456
Source: Ministry of Education and Vocational Training, Zanzibar
Table 3.1.26: STD I - Form VI Teachers in Public and Private Schools by Training,
2010- 2014
Source: Ministry of Education and Vocational Training, Zanzibar
Type of School 2010 2011 2012 2013 2014p
Public School
Trained 9,301 9,939 8,645 9,503 9,832
Untrained 637 574 496 391 129
Total 9,938 10,513 9,141 9,894 9,961
% of Untrained 6.4 5.5 5 4.0 1.3
Private School
Trained 844 827 831 1,178 1,225
Untrained 215 382 364 346 407
Total 1,059 1,209 1,195 1,524 1,632
% of Untrained 20.3 31.6 30 22.7 24.9
Total
Trained 10,145 10,766 9,476 10,681 11,057
Untrained 852 956 860 737 536
Total 10,997 11,722 10,336 11,418 11,593
% of Untrained 7.7 8.2 8 6.5 4.6

89
Table 3.1.27: STD I - Form VI Trained Teachers in Public Schools by Districts, 2010- 2014
District
2010 2011 2012 2013 2014
Male Female Total Male Female Total Male Female Total Male Female Total Male Female Total
Kaskazini „A‟ 421 478 899 427 539 966 401 496 897 421 474 895 435 499 934
Kaskazini „B‟ 211 360 571 228 434 662 236 400 636 231 407 638 232 429 661
Kati 390 434 824 406 447 853 9 400 409 428 435 863 423 471 894
Kusini 186 176 362 182 178 360 191 161 352 205 163 368 200 180 380
Mjini 390 1,481 1,871 368 1,588 1,956 364 1,523 1,887 360 1,395 1,755 392 1,484 1,876
Magharibi 440 1,680 2,120 463 1,921 2,384 1,401 431 1,832 552 1,804 2,356 490 1,829 2,319
Wete 384 384 768 405 391 796 385 394 779 380 398 778 396 413 809
Micheweni 304 188 492 315 217 532 297 192 489 286 162 448 303 180 483
Chake Chake 248 413 661 245 414 659 238 404 642 259 450 709 263 489 752
Mkoani 398 335 733 419 352 771 385 337 722 369 324 693 392 332 724
Total 3,372 5,929 9,301 3,458 6,481 9,939 3,907 4,738 8,645 3,491 6,012 9,503 3,526 6,306 9,832
Source: Ministry of Education and Vocational Training, Zanzibar

90
3.2 Health Statistics
Public Health
This section presents statistics on some of the key aspects of public health. The aspects
covered in this section include status of health facilities, staffing levels (Cadre), reported
number of dose given, facility delivery, and selected top ten leading diagnosis (diseases).
Furthermore the health facilities have been classified as primary level (PHCU, PHCU+
and PHCC), Secondary level (District Hospital) and Tertiary level (Referral and Special
hospital). The Government set out these health facilities with the intention of building
and strengthening the capacity of health facilities to improve health service provision,
from the Table 5.2.2 information for 2013 and 2014 shows a primary health care unit
(PHCU) increased from 105 in 2013 to 109 in 2014 and there is no change for the rest
heath facilities. The hospitals in Zanzibar are categorized as Referral, Special and District
Hospitals. According to the Ministry of Health, there is one referral hospital, 2 Special
hospitals and 3 district hospitals owned by the government in 2014.Table 3.2.1, shows
that number of Clinical Officers and Medical Doctor and health officer are raising. The
result shows that Nurse Midwife is the leading cadre having 476 staffs followed by
Public Health Nurse „B‟ having 311.
Reported number of dose given.
Immunization of children against diseases is essential for reducing infant and child
mortality. The World Health Organization (WHO) recommends that the newly borne
should be vaccinated against all the vaccine-preventable diseases before the age of 12
months. The antigens given include or covered: BCG (against tuberculosis), DPT3
(PENTA) against Diphtheria, Pertusis, Tetanus, Hepatitis B, Heamophilus influenza),
Oral Polio Vaccine (OPV) against poliomyelitis and a measles vaccine (MCV1) and
TT2+.Table 2.2.10: presents the reported number of dose given. during the last five
years (2010 - 2014) among children less than one year of age. Table 5.2.10 below reveals
the reported number of dose given during the last five years (2010-2014) among children
less than one year of age. The figures indicate that BCG dose given has consistently been
leading in coverage from 2010 to 2014 followed by measles (MCV1) ,DPT3 (PENTA).

91
Morbidity
Table 3.2.9: shows that reported Upper Respiratory Tract Infections has been the highest
ranked cause of morbidity in Zanzibar over the past five years. Other Diarrhoea disease
has been the second leading cause of diagnosis. The selected diseases listed below in a
table 2.2.9 appeared among the leading Top ten causes of morbidity in Zanzibar for 2014.
Reported number of live birth.
Reported live births have continued to improve. Table 3.2.8, shows the number of live
birth in health facilities increased from 33,277 in 2013 to 42,226 in 2014 and indicating
about 27 percentage increment from 2013 to 2014.
Out Patient and In-patient.
The information of Out Patient visit used to measure utilisation of health facilities i. The
number of out-patients in public hospitals recorded 361,732 in 2014, out of which
69,211 were from Mnazi Mmoja hospital compared to 76,718 in 2013and Kivunge
hospital lead for the number of visiting outpatient which is 71, 803 in 2014. The number
of in-patients recorded 78,469, where 42,232 were admitted at Mnazi Mmoja Hospital
compared to 72,961 in 2013; Mnazi Mmoja hospital took the lead followed by
Chakechake Hospital in 2014.
Table 3.2.1, shows the number of Clinical Officers and Medical Doctor and health officer
were raising from 2012 to 2014 where by nurse midwife remain constant from 2013 to
2014. The result shows that Nurse Midwife is the leading cadre having 476 staffs
followed by Public Health Nurse „B‟ having 311.

92
Table 3.2.1: Medical, Paramedical and Nursing Professionals, 2012-2014 (Number)
Cadre 2012 2013 2014p
Assistant Medical Officer (AMO) 54 56 54
Clinical Officer 130 185 194
Community Health Nurse 36 39 31
Dental Assistant 12 14 11
Dental Officer 7 11 8
Dental Therapist 11 24 24
Dentist 7 7 7
Gynaecologist 3 4 4
Health Assistant 73 78 63
Health Officer 197 213 252
Lab. Assistant 33 37 31
Lab. Chemical Technician 2 2 2
Lab. Scientist 3 4 4
Lab. Technician 193 212 235
Lab. Technologist 46 46 46
Medical Doctor (MD) 31 34 41
Medical Entomologist 1 1 1
Medical Lab. Scientist 1 1 1
Microbiologist 1 1 1
Microscopist 6 6 6
Nurse Anaesthetic 16 22 18
Nurse General 46 79 99
Nurse Midwife 423 476 476
Nurse Occupational Health 3 3 2
Nurse Ophthalmic 10 10 10
Nurse Orthopaedic 1 1 1
Nurse Paediatric 8 8 8
Nurse Psychiatrist 164 173 173
Occupational Therapist 1 1 1
Ophthalmic Clinician 3 3 4
Ophthalmic Surgeon 1 1 1
Optometrist 2 2 2
Orthopaedic Assistant 1 1 1
Paediatrician 5 5 5
Pathologist 1 1 1
Pharm. Assistant 34 34 34
Pharm. Auxiliary 3 6 3
Pharm. Dispenser 40 40 40
Pharm. Technician 55 97 105
Pharmacist 18 21 21
Public Health Nurse „A‟ 7 7 7
Public Health Nurse „B‟ 284 294 311
Physiotherapist 6 6 6
Radiographer 17 17 17
Radiographic Asst. 7 7 7
Radiologist 1 1 1
Grand Total 2,004 2,291 2,370 Source: Ministry of Health, Zanzibar

93
Table 3.2.2: Medical Facilities by Category, 2010- 2014 (Number)
2010 2011 2012 2013 2014p
Public Facilities
Primary level
PHCU 98 100 100 105 109
PHCU+ 35 34 34 34 34
PHCC 4 4 4 4 4
Secondary level
District
Hospital 3 3 3 3 3
Tertiary level
Special 2 2 2 2 2
Referral 1 1 1 1 1
Private Facilities
Private Hospital 3 3 3 3 3 2
Dispensary 62 72 72 72 70 53 Source: Ministry of Health, Zanzibar
Table 3.2.3: Distribution of Public Health Facilities by District, 2014(Number)
District
Public Medical Facility
Private Medical
Facility Primary Level
Secondary
level Tertiary level
PHCU PHCU+ PHCC
District
Hospital Special Referral
Private
Hospital Dispensary
Kaskazini „A‟ 9 4 1 0 0 0 0 3
Kaskazini „B‟ 8 4 0 0 0 0 0 2
Kati 20 4 0 0 0 0 0 5
Kusini 8 2 1 0 0 0 0 0
Mjini 6 4 0 0 2 1 2 20
Magharibi 9 5 0 0 0 0 0 12
Wete 16 3 0 1 0 0 0 1
Micheweni 12 3 1 0 0 0 0 2
ChakeChake 7 3 1 1 0 0 0 6
Mkoani 14 2 0 1 0 0 0 2
Total 109 34 4 3 2 1 2 53 Source: Ministry of Health, Zanzibar

94
Table 3.2.4: Number of In-Patients and Out-Patients in Public Hospital 2010-2014
Type of patients 2010 2011 2012 2013 2014p
Out-patients 366,942 395,964 379,224 383,789 361,732
In-patients 66,556 70,857 72,373 72,961 78,469 Source: Ministry of Health, Zanzibar
Table 3.2.5: In-patients and Out-patients by Public Hospital 2013
(Number)
Hospital
2013
In-patients Out-patients
Male Female Total Male Female Total
Unguja
Kivunge 679 2,845 3,524 26,787 26,865 53,652
Makunduchi 662 1,947 2,609 15,979 16,981 32,960
Mnazi Mmoja 10,057 29,436 39,493 38,066 38,652 76,718
Sub Total 11,398 34,228 45,626 80,832 82,498 163,330
Pemba
Chake Chake 2,475 7,294 9,769 30,428 41,209 71,637
Micheweni 1,066 2,947 4,013 10,410 13,782 24,192
Vitongoji 440 893 1,333 8,646 10,088 18,734
Abdallah Mzee 1,408 3,890 5,298 20,696 26,013 46,709
Wete 1,882 5,040 6,922 24,950 34,237 59,187
Sub Total 7,271 20,064 27,335 95,130 125,329 220,459
Grand Total 18,669 54,292 72,961 175,962 207,827 383,789 Source: Ministry of Health, Zanzibar
Table 3.2.6: In-patients and Out-patients by Public Hospital 2014 (Number)
Hospital
2014
In-patients Out-patients
Male Female Total Male Female Total
Unguja
Kivunge 758 3,430 4,188 36,645 35,158 71,803
Makunduchi 814 2,582 3,396 9,622 13,351 22,973
Mnazi Mmoja 9,681 32,551 42,232 30,885 38,326 69,211
Sub Total 11,253 38,563 49,816 77,152 86,835 163,987
Pemba
Chake Chake 2,988 8,283 11,271 24,182 33,015 57,197
Micheweni 830 2,556 3,386 9,955 13,004 22,959
Vitongoji 404 973 1,377 8,504 9,468 17,972
Mkoani 1,070 3,946 5,016 16,372 22,230 38,602
Wete 1,864 5,739 7,603 26,492 34,523 61,015
Sub Total 7,156 21,497 28,653 85,505 112,240 197,745
Grand Total 18,409 60,060 78,469 162,657 199,075 361,732 Source: Ministry of Health, Zanzibar.

95
Table 3.2.7: Number of Live Birth in Public Hospital, 2013-2014
Hospital
2013 2014p
Male Female Total Male Female Total
Kivunge Cottage 780 899 1,679 1,266 1,217 2,483
Makunduchi Cottage 422 405 827 680 662 1,342
Mnazi Mmoja 8,631 8,357 16,988 10,619 10,582 21,201
Chake Maternity ward 1,771 1,732 3,503 2,097 2,131 4,228
Vitongoji Cottage 137 126 263 154 138 292
Micheweni Cottage 548 523 1,071 556 532 1,088
Mkoani District 980 1,000 1,980 1,197 1,055 2,252
Wete District 1,146 1,094 2,240 1,399 1,669 3,068
Total 14,415 14,136 28,551 17,968 17,986 35,954
Source: Ministry of Health, Zanzibar
Table 3.2.8, shows the number of live birth in health facilities increased from 33,277 in
2013 to 42,226 in 2014 and indicating about 27 percentage increment from 2013 to
2014.
Table 3.2.8: Number of Live Birth in Health Facility by District, 2013-2014
District
2013 2014
Male Male Total Male Male Total
Kaskazini „A‟ 1,005 1,096 2,101 1,547 1,516 3,063
Kaskazini „B‟ 256 246 502 363 342 705
Kati 22 20 42 39 44 83
Kusini 448 436 884 753 735 1,488
Magharibi 442 452 894 698 626 1,324
Mjini 9,123 8,860 17,983 11,488 11,157 22,645
Unguja Zone 11,296 11,110 22,406 14,888 14,420 29,308
Chake Chake 2,007 1,975 3,982 2,441 2,470 4,911
Micheweni 830 837 1,667 816 784 1,600
Mkoani 1,193 1,230 2,423 1,373 1,212 2,585
Wete 1,421 1,378 2,799 2,034 1,788 3,822
Pemba Zone 5,451 5,420 10,871 6,664 6,254 12,918
Zanzibar 16,747 16,530 33,277 21,552 20,674 42,226
Source: Ministry of Health, Zanzibar

96
Table 3.2.9: ranks the most common diagnosis ,where Upper Respiratory Tract Infections has been the highest ranked cause of morbidity in
Zanzibar over the past five years. Other Diarrhea disease has been the second leading cause of diagnosis except for 2013 where other skin
disease has been the second one. The selected diseases listed below in a table 2.2.9 appeared among the leading Top ten causes of morbidity in
Zanzibar for 2014
Table 3.2.9: Top Ten Reported Diagnosis, 2010-2014. 2010 2011 2012 2013 2014
Diagnosis Cases Diagnosis Cases Diagnosis Cases Diagnosis Cases Diagnosis Cases
1
Upper
Respiratory Tract
Infections 314,681
Upper Respiratory Tract
Infections 368,958
Upper Respiratory
Tract Infections 365,871
Upper Respiratory Tract Infections (URTI) 384,457
Upper
Respiratory Tract
Infections 368,883
2
Other Diarrhoea
Diseases 95,337 Other Diarrhoea Diseases 97,365
Other Diarrhoea
Diseases 111,345
Other skin diseases 97,772
Other Diarrhoea
diseases 107,512
3
Other Skin
diseases 77,853 Other Skin diseases 81,722 Other Skin diseases 89,864
Other diarrhoea diseases 93,041
Other skin
disease 104,496
4
ENT head and
neck 75,802 ENT head and neck 81,668 ENT head and neck 83,252
ENT head and neck 84,444
ENT head and
neck 90,713
5 Pneumonia 72,950 Pneumonia 72,674 Pneumonia 67,753 Pneumonia 67,339
Urinary Tract
Infection (UTI) 84,109
6 Intestinal Worms 52,353 Intestinal Worms 45,892 Intestinal Worms 47,541
Urinary Tract Infections (UTI) 49,509 Pneumonia 73,439
7 Trauma / Injuries 44,832 Trauma / Injuries 39,753 Trauma / Injuries 39,902 Trauma /Injuries 46,527 Trauma / Injuries 48,562
8
Urinary Tract
Infection(UTI) 41,221
Urinary Tract
Infection(UTI) 38,123
Urinary Tract
Infection(UTI) 37,560 Intestinal Worms 36,063 Dental Diseases 34,992
9 Eye diseases 36,008 Eye diseases 36,873 Eye diseases 37,004 Eye diseases 32,955 Eye diseases 31,875
1
0 Dental diseases 33,967 Dental diseases 33,156 Dental diseases 36,657 Dental Diseases 31,854 Intestinal Worms 29,249
Source: Ministry of Health, Zanzibar

97
Table 3.2.10 below reveals the reported number of dose given during the last five years
(2010-2014) among children less than one year of age. The figures indicate that BCG
dose given has consistently been leading in coverage from 2010 to 2014 followed by
measles (MCV1) ,DPT3 (PENTA).
Table 3.2.10: Reported Number of Dose Given 2010-2014.
Vaccination 2010 2011 2012 2013 2014
BCG 56,940 56,780 64,002 69,101 80,818
DPT3 (PENTA) 44629 42,726 43,021 45,152 50,123
OPV3 43900 42,222 37,290 44,402 41,978
MEASLES (MCV1) 38,846 45,387 49,266 49,340 50,544
PCV3 dose given n/a n/a n/a n/a 505,52
TT2 + 38,464 17,048 34,997 42,506 48,240 Source: Ministry of Health, Zanzibar

98
Social welfare
This section presents statistics on reported number of people with disability, children
cared, old people cared and number of sober houses. The number of person with
disability reported in Zanzibar Association of People with Disability is 6026 for 2014
out of the total reported persons with disability only 2595 and the rest are males, where
by the people reported with physical disability took lead they are 2837 followed by
multiple disability having 1,073. Magharibi is the leading district having large number of
people reported people with disability (1,594) and most of these people are in age 10 –
19 years as shown in the (Table 3.2.11 to 3.2.12) show that the number of Old people and
orphanage cared 192 and 148 respectively for 2014. According to The Commission for
National Coordination and Drug Control there were 14 Sober houses for 2014 .Gender
disparity shows that most of clients living in sober houses are male (786) compared to
female (80) out of the 866 of total clients in the Sober

99
Table 3.2.11, shows the number of person with disability reported in Zanzibar Association of People with Disability is 6026 for 2014 out of the
total reported persons with disability only 2595 and the rest are males
Table 3.2.11: Persons with Disability by District and Sex, 2014
(Number)
Disability type Sex Physical Multiple Deaf of speech Hypocepholus Albino Mental Epylepsy Visual Others Total
Kaskazini ' A '
Male 198 67 51 2 11 23 15 39 12 472
Female 151 46 46 1 5 24 8 28 8 348
Kaskazini ' B '
Male 71 25 12 0 4 7 3 13 5 146
Female 47 24 15 0 0 7 0 7 4 108
Kati
Male 122 58 34 2 6 27 19 22 7 344
Female 88 64 22 0 6 19 13 17 3 260
Kusini
Male 85 18 15 0 0 18 1 11 2 158
Female 88 13 32 0 0 15 2 23 8 184
Mjini
Male 167 35 27 2 4 16 1 39 2 300
Female 91 21 29 1 5 19 1 25 2 198
Magharibi
Male 346 175 57 6 12 49 10 48 26 883
Female 252 135 46 1 11 43 9 31 29 711
Wete
Male 199 58 46 2 5 33 12 31 10 452
Female 122 34 34 0 6 32 10 33 3 323
Micheweni
Male 190 68 43 5 3 16 6 35 9 423
Female 115 51 42 0 3 23 11 18 10 331
Chake Chake
Male 179 86 41 3 4 25 13 22 15 490
Female 106 49 39 1 6 19 16 21 6 336
Mkoani
Male 108 18 32 0 4 15 1 20 7 208
Female 76 14 35 0 4 13 2 24 4 173
Not Stated
Male 21 7 4 0 0 1 3 0 0 36
Female 15 7 4 0 0 2 4 0 0 32
Zanzibar 2,837 1,073 706 26 99 446 160 507 172 6,026
Source: Zanzibar Association of People with Disable.

100
Table 3.2.12: Reported Number of Persons with Disability by Age Group and Type of Disability- Zanzibar, 2014
(Number)
Age group
Physical Multiple Deaf Speech Hypocepholus Albino Mental Visual Epylepsy Others
Male Female Male Female Male Female Male Female Male Female Male Female Male Female Male Female Male Female Total
01-09 94 61 45 29 11 8 5 2 8 6 20 10 15 8 1 1 11 8 353
10-19 446 289 278 200 124 105 15 0 19 13 81 81 59 46 40 32 35 26 2,197
20-29 339 275 208 174 116 115 3 1 15 13 91 67 57 43 38 34 26 24 2,077
30-39 254 177 43 28 51 41 0 0 4 8 25 37 38 32 4 6 10 6 829
40-49 194 130 16 9 21 27 0 0 4 3 9 13 20 32 0 2 3 2 504
50-59 187 112 8 4 19 35 0 0 1 2 4 5 39 31 1 0 1 3 488
60-69 110 56 8 6 10 5 0 0 1 0 0 2 31 11 0 1 5 3 257
70-79 47 31 3 3 7 7 0 0 1 0 0 1 20 17 0 0 3 2 144
80+ 13 13 2 0 1 1 0 0 1 0 0 0 1 5 0 0 0 2 39
Not stated 5 4 4 5 1 1 0 0 0 0 0 0 0 2 0 0 1 1 28
Grand Total 1,689 1,148 615 458 361 345 23 3 54 45 230 216 280 227 84 76 95 77 6,026 Source: Zanzibar Association of People with Disable.
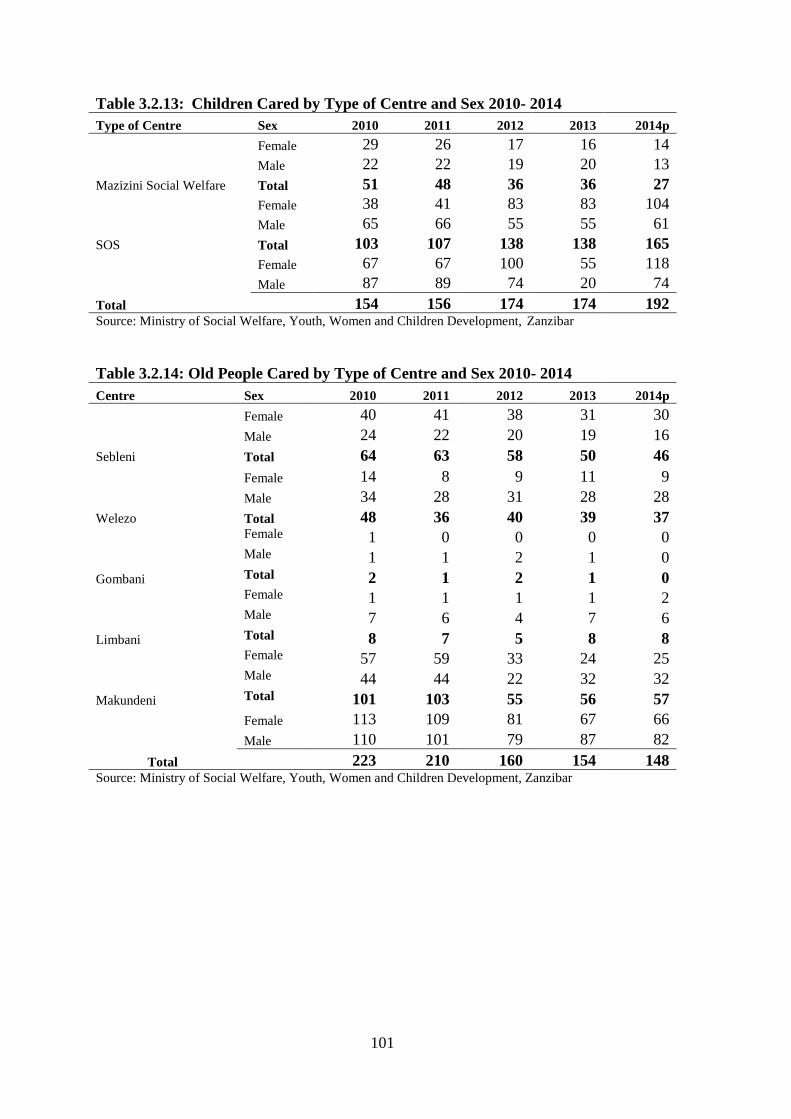
101
Table 3.2.13: Children Cared by Type of Centre and Sex 2010- 2014
Type of Centre Sex 2010 2011 2012 2013 2014p
Mazizini Social Welfare
Female 29 26 17 16 14
Male 22 22 19 20 13
Total 51 48 36 36 27
SOS
Female 38 41 83 83 104
Male 65 66 55 55 61
Total 103 107 138 138 165
Total
Female 67 67 100 55 118
Male 87 89 74 20 74
154 156 174 174 192 Source: Ministry of Social Welfare, Youth, Women and Children Development, Zanzibar
Table 3.2.14: Old People Cared by Type of Centre and Sex 2010- 2014
Centre Sex 2010 2011 2012 2013 2014p
Sebleni
Female 40 41 38 31 30
Male 24 22 20 19 16
Total 64 63 58 50 46
Welezo
Female 14 8 9 11 9
Male 34 28 31 28 28
Total 48 36 40 39 37
Gombani
Female 1 0 0 0 0 Male 1 1 2 1 0 Total 2 1 2 1 0
Limbani
Female 1 1 1 1 2 Male 7 6 4 7 6 Total 8 7 5 8 8
Makundeni
Female 57 59 33 24 25 Male 44 44 22 32 32 Total 101 103 55 56 57
Total
Female 113 109 81 67 66
Male 110 101 79 87 82
223 210 160 154 148 Source: Ministry of Social Welfare, Youth, Women and Children Development, Zanzibar

102
Table 3.2.15 show the number of sober house by sex of residents in Zanzibar is 14 in
which there 13 male sober house and only one female sober.
Table 3.2.15: Number of Sober Houses by Sex of Residents in Zanzibar, 2014.
Male Sober House Female Sober House Total
Unguja 7 1 8
Pemba 6 0 6
Zanzibar 13 1 14 Source: Commission for National Coordination and Drug Control.
Table 3.2.16: Distribution of Clients in Each Sober House in Zanzibar 2014.
Sober House Male Female Total
Detroit 77 0 77
Free at Last 68 0 68
Mombasa 0 80 80
Twawabina 70 0 70
Trent 110 0 110
Zanzibar Youth Forum 59 0 59
Nyarugusu 57 0 57
Mtofaani 78 0 78
Unguja 519 80 599
Mkoroshoni 51 0 51
Limbani 79 0 79
Kifumbikae 91 0 91
Jadida 5 0 5
Kifoi 16 0 16
Mbuyuni 25 0 25
Pemba 267 0 267
Zanzibar 786 80 866 Source: Commission for National Coordination and Drug Control.

103
3.3 Information, Culture, and Sport Statistics
This section presents statistics on information, Culture as well as Sport. Table 3.3.1
shows the number of ruins and caves conserved and sustained by all districts in Zanzibar,
where by Mjini District took lead 11 ruins conserved out of 62 ruins, followed by
Micheweni, Mkoani and Wete. According to the Ministry for Information, Culture,
Tourism and Sports there only 3 caves in Kaskazini „A‟ and Kusini were conserved, also
the number of people use Kiswahili Council library increased from 3,632 in 2013 to
2014 where by the female took lead compare to male as shown from the Table 3.3.2.
Up to this moment the OCGS has managed to collect data on type of sport clubs
registered by district, number of gold, medal and bronze won in the international
tournament, number of referee by the type of sports and number of football teams by
division.
Table 2.3.3 shows type of sports club registered by district and type of sports whereby
Mjini has 143 registered clubs of football which is the leading district followed by other
districts have slight change between them. A total of 38 netball clubs, out of which 8
clubs are in Kaskazini „A‟ and other 9 are in Mjini and the remaining are distributed in
other districts. Gender discrepancy is revealed in table 3.3.6, where by a number of male
referees regardless having FIFA badge is more higher (70 person) compared to female
(15 person).
The Table 3.3.1 shows the number of ruins and caves conserved and sustained by all
districts in Zanzibar, where by Mjini District took lead 11 ruins conserved out of 62
ruins, followed by Micheweni, Mkoani and Wete.

104
Table 3.3.1: Number of Ruins and Caves Conserved by District 2014.
District
Number
Ruin Cave
Kaskazini ' A ' 3 n/a
Kaskazini ' B ' 2 3
Kati 4 n/a
Kusini 1 3
Mjini 11 n/a
Magharibi 7 n/a
Wete 8 n/a
Micheweni 10 n/a
Chake Chake 7 n/a
Mkoani 9 n/a
Zanzibar 62 6 Source: Ministry for Information, Culture, Tourism and Sports, Zanzibar
Table 3.3.2: Number of Library Users of Kiswahili Council by Year and Sex.
Year Male Female Total
2013/14 259 3,197 3,456
2014/15 61 115 176
Total 320 3,312 3,632 Source: Ministry for Information, Culture, Tourism and Sports
Table 3.3.3 below shows type of sports club registered by district and type of sports
whereby Mjini has 143 registered clubs of football which is the leading district followed
by other districts have slight change between them.

105
Table 3.3.3: Type of Sports Associations Registered by District in Unguja, 2014.
Type of Sports
Kaskazini
"A"
Kaskazini
"B" Kati Kusini Mjini Magharibi Total
Football 50 45 55 52 143 54 399
Netball 8 6 4 6 9 5 38
Athletics 10 8 9 5 20 9 61
Basketball 4 6 5 9 10 5 39
Handball 3 8 6 8 12 10 47
Hockey 0 0 0 0 7 0 7
Swimming 0 0 0 2 5 4 11
Judo 0 0 0 0 3 1 4
Cycling 0 0 0 0 2 0 0
Volleyball 2 3 2 4 5 2 18
Badminton 1 0 1 0 2 1 5
Weightlifting 0 0 0 0 5 0 5
Squash 0 0 0 0 2 0 2
Wrestling 0 0 0 0 5 0 5
Karate 12 5 3 2 10 10 42
Playing Cards 7 9 5 6 18 14 59
Table Tennis 2 0 0 0 5 0 7
Lawn Tennis 0 0 0 0 4 2 6
Shooting 0 0 0 0 3 0 3
Chess 0 0 0 0 2 0 2
Criket 0 0 0 0 2 0 2
Bao 10 14 11 13 16 11 75
Motor cross 0 0 0 0 4 0 4
ZABESA 4 3 6 4 18 6 41
Zanzibar Deaf Association 1 0 0 1 4 1 7
Pool Table 0 0 0 0 2 1 3
Special Olympics 0 0 0 0 8 4 12
Golf 0 0 1 0 4 2 7
Zanzibar Disable Association 0 0 1 1 5 3 10
Zanzibar Health for Sportsmen 0 0 1 1 3 1 6
TOTAL 114 107 110 114 338 146 927 Source: Ministry for Information, Culture, Tourism and Sports, Zanzibar

106
Table 3.3.4: Type of Sports Clubs Registered by District in Pemba, 2014
(Number).
Type of Sports Wete Micheweni Chake Mkoani Total
Football 26 18 29 24 97
Netball 8 6 7 11 32
Athletics 2 1 3 1 7
Basketball 2 - 3 3 8
Swimming 2 0 0 1 3
Judo 2 1 1 2 6
Cycling 0 0 0 1 1
Volleyball 3 1 2 4 10
Karate 16 12 8 7 43
Table Tennis 0 0 2 1 2
Karata 7 4 8 5 24
Bao 15 16 20 10 49
Motor cross 0 0 0 0 0
ZABESA 3 2 4 2 11
TOTAL 86 61 87 72 293 Source: Ministry of Information, Culture, Tourism and Sports, Zanzibar
Table 3.3.5: Type of Medal won in the international Tournament, 2014
Type of Sport
Medal
Host Country Gold Silver Bronze
Judo 1 3 5 Kenya
Basketball 0 1 3 Zambia
Volley ball 0 2 1 Zanzibar
Athletics 4 2 6 Arusha - Tanzania Source: Ministry of Information, Culture, Tourism and Sports, Zanzibar
Table 2.3.6 below shows the number of referees by the type of sport where the number of
football referee is more higher (92 percent) compare to other type of sport, also the
number of male referee by all type of sport is about twice the number of female referees.

107
Table 3.3.6: Number of Referees by the Type of Sport and Sex, 2014
Type of Sport
Referee
Male Female Total
Weightlifting 7 0 7
Judo 7 0 7
Karate 3 0 3
Football 75 17 92
Basketball 2 11 13
Handball 3 6 9
Volley Ball 5 13 18
Netball 4 12 16
Total 106 59 165 Source: Ministry of Information, Culture, Tourism and Sports, Zanzibar

108
Gender discrepancy is revealed in table 3.3.7 below, where by a number of male referees regardless having FIFA badge is more higher ( 70
person) compared to female (15 person).
Table 3.3.7: Number of Referees by FIFA Badges and Sex, 2010- 2014.
Referees
2010 2011 2012 2013 2014p
Male Female Total Male Female Total Male Female Total Male Female Total Male Female Total
With FIFA Badge 5 1 6 5 1 6 5 1 6 4 1 5 5 2 7 Without FIFA
Badge 11 1 12 93 4 97 93 5 98 50 10 60 70 15 85
Total 16 2 18 98 5 103 98 6 104 54 11 65 59 10 92 Source: Ministry of Information, Culture, Tourism and Sports.

109
Table 3.3.8: Zanzibar Football Players’ Playing Outside Zanzibar, 2010- 2014.
Country Club Players
2010 2011 2012 2013 2014p
Vietnam 1 1 1 1 1
Egypt Alcanal-cairo 1 1 1 1 1
United Kingdom Chesea (Youth
Team) 1 1 1 1 1
Qatar Al mudheib 2 1 1 1 1
Tanzania Mainland
Azam S.club 3 8 12 12 10
Yanga 2 1 3 3 4
Simba 1 1 1 1 3
J.K.Oljoro 0 7 7 7 5
Coastal Union 0 4 4 4 6
Villa Squard 0 2 2 2 2
African Lyon 0 2 2 2 2
Mtibwa 1 0 0 0 1
Moro United 1 0 0 0 1
Pan Africa 1 0 0 0 0
Total 14 29 35 35 38 Source: Ministry of Information, Culture, Tourism and Sports.
Table 3.3.9 shows the number of football teams by division, regarding to the premier
league the number of teams remain constant from 2010 to 2014,and their slight difference
in first division and second division-district form 2013 to 2014.
Table 3.3.9: Number of Football Teams by Division, 2010- 2014.
Division 2010 2011 2012 2013 2014p
Premier League 12 12 12 12 12
First Division 24 26 26 26 28
Second Division -Taifa 40 46 53 53 53
Second Division -District 200 350 390 392 395
Third Division 100 200 257 260 280
Fourth Division 50 100 123 123 120
Total 426 734 861 866 888 Source: Ministry of Information, Culture, Tourism and Sports Source.

110
3.4 Recorded Road Accidents
Table 3.4.1 shows total number of recorded road accident and victims in Zanzibar
whereby in 2014 out of 621 accidents 181 persons were exterminated, that shows an
increase of 22 percent from 2013 to 2014, of which around 90 percent of them from
Unguja and ten percent for Pemba, also table shows the decline of injury person by 12.8
from 2013 to 2014.
The number of traffic offences increased by 65.5 percent in 2014, from 16,683 in 2013 to
10,078 in 2014, whereby number of traffic offenses for Pemba increased by 9.8 percent
while for Unguja decrease more than 90 percent in 2014. Table explains more about
other traffic offence (driving without helmet, driving without license, insurance and road
license, dangerous driving, dangerous loads) that shows decreasing number by 64.9
percent from 15,311 in 2013 to 9,284 in 2014 for Zanzibar.
Table 3.4.1: Reported Victims of Road Accidents Zanzibar, 2009- 2014
Description Victims 2009 2010 2011 2012 2013 2014
Total accident
621
Persons Killed
Drivers 6 6 8 12 7 2
Passengers 21 33 23 31 31 20
Cyclists 34 26 33 45 47 90
Pedestrians 38 46 46 52 56 69
Total 99 93 110 139 141 181
Persons
Injured
Drivers 62 79 68 71 83 64
Passengers 393 642 445 499 425 346
Cyclists 302 343 376 314 298 299
Pedestrians 219 271 234 218 235 214
Total 967 1,335 1,123 1,102 1041 923
Traffic
Offences
Drinks/Drugs 0 41 0 0 1 3
Mechanical defect 492 337 361 384 546 114
Dangerous/carelessness 1,156 996 584 580 825 165
Other offences 9,670 14,355 14,719 16,530 15,311 9,284*
Total 11,318 15,729 15,664 17,494 16,683 10,078
Source: Police Headquarter, Zanzibar

111
Table 3.4.2: Reported Victims of Road Accidents in Unguja, 2009- 2013
Description Victims 2009 2010 2011 2012 2013 2014
Total accident
592
Persons
Killed
Drivers 3 5 7 10 3 1
Passengers 20 23 21 26 27 16
Cyclists 29 24 29 34 35 89
Pedestrians 33 39 35 44 38 56
Total 85 91 92 113 103 162
Persons
Injured
Drivers 52 75 54 60 70 60
Passengers 349 534 385 459 353 304
Cyclists 292 332 353 303 259 297
Pedestrians 211 262 220 203 214 205
Total 904 1,203 1,012 1,025 896 866
Traffic
Offences
Drinks/Drugs 0 41 0 0 1 3
Mechanical defect 481 328 347 366 539 112
Dangerous/carelessness 1,044 820 514 434 708 90
Other offences 8,315 12,690 12735 13,962 13,117 6,806*
Total 9,840 13,879 13,596 14,762 14,365 7,523
Source: Police Headquarter, Zanzibar
Table 3.4.3: Reported Victims of Road Accidents Pemba, 2009- 2013
Description Victims 2009 2010 2011 2012 2013 2014
Total accident
29
Persons Killed
Drivers 3 1 1 2 4 1
Passengers 1 10 2 5 4 4
Cyclists 5 2 4 11 12 1
Pedestrians 5 7 11 8 18 13
Total 14 20 18 26 38 19
Persons
Injured Drivers 10 4 14 11 13 4
Passengers 44 108 60 40 72 42
Cyclists 10 11 23 11 39 2
Pedestrians 8 9 14 15 21 9
Total 63 132 111 77 145 57
Traffic
Offences
Drinks/Drugs 0 0 0 0 0 0
Mechanical defect 11 9 14 18 7 2
Dangerous/carelessness 112 176 70 146 117 75
Other offences 1,355 1665 1984 2,568 2,194 2,478*
Total 1,478 1,850 2,068 2,732 2,318 2,555
Source: Police Headquarter, Zanzibar
* include the following Driving without helmet Driving without license, insurance and road license
Dangerous driving
Dangerous loads
Table 3.4.4 represent number of recorded offences by districts in 2013 and 2014, the
incidence of crime statistical information collected, data shows increases both in minor
and serious cases from 2013 to 2014 by 1.5 percent and 21.5 percent respectively, in
general Magharibi district has shows higher tendency of cases followed by Mjini district,
while Micheweni and Kusini District have less cases compared with other district.

112
Table 3.4.4: Offences Occurred by Type Case, 2013-14
Area
2013 2014
Serious
Cases
Minor
Cases Total Cases
Serious
Cases
Minor
Cases Total Cases
Unguja 558 10,680 11,238 581 13,297 13,878
Pemba 41 2,369 2,410 27 3,323 3,350
Total 599 13,049 13,648 608 16,620 17,228
Source: Police Headquarter, Zanzibar
Offences against Persons
Table 3.4.5 indicate the total number of Offences against Person reported from 2013 to
2014. The rape offences decrease by 12.84 percent from 2014 to 2013, although it has
higher frequency in all years compared to other offences, also data indicate that
abduction decrease by 20 percent from 12 to 10 in 2013 and 2014 respectively
Table 3.4.5: Number of Reported Offences against Person in Zanzibar 2013 – 2014
Offences 2013 2014
Murder 29 20
Rape 123 109
Child Desertion 0 0
Sodomise 24 20
Child stealing 0 1
Rape to girl 0 0
Unlawful transportation of human being 0 0
Illegal migrant 0 0
Assaults 6 4
Abduction 12 10
Total 194 164 Source: Police Headquarter, Zanzibar
Table 3.4.6 illustrates number of reported Offences against Property in Zanzibar, the
movement shows that all offences against property decrease from 2013-2014, while new
offences against government property observed in 2014.

113
Table 3.4.6: Reported Offences against Property in Zanzibar 2013 – 2014
Offence 2013 2014
Theft of weapon/Arms 0 0
Armed Robbery 4 5
Robbery with Violence 62 47
Breaking and Burglary 305 41
Theft of motor cycle 11 6
Stealing of Motor Vehicle 0 0
Theft 4 5
Theft Against Crop 29 40
Cattle stealing 50 34
Theft Against Bank 0 0
Counterfeits bank note 0 0
Offences Against Cooperation 0 0
Theft of Local Government 12 8
Crime Against Government 0 1
Theft Against Political Party 0 0
Arson 7 4
Fire Accident 24 10
Forgery 0 0
Total 508 201 Source: Police Headquarter, Zanzibar

114
Table 3.4.7: Number of Reported Offences against Tranquility in Zanzibar, 2013 - 2014
Offences 2013 2014
Cocaine 0 0
Heroine 76 50
Mandrax 0 0
Morphine 0 0
Cannabises 142 42
Khat 0 0
Smuggling 0 0
Unlawful possession of Government Trophils 0 0
Bibbery and Corruption 0 0
Unlawful possession of Local Liquor 0 0
Unlawful possession of manufacturing instrument of local
liquor 0 0
Being in possession of fire arms 6 0
Unlawful possession of ammunitions 0 0
Unlawful Obtaining of Explosive Material 0 0
Illegal migrant 0 0
Illegal Tour Guiding 0 0
Trading without License 0 0
Drugs abuses 0 0
Retaining with Plastic bag 0 0
Total 224 92 Source: Police Headquarter, Zanzibar
Table 3.4.7 shows the number of offences reported against property stolen, the values of
stolen property and the values of recovered for stolen property in Tanzanian Shillings by
region and districts, Kusini Unguja region has large amount of property stolen followed
by Mijini Magharib and Kaskazini Unguja region in 2014 while Mjini Magharibi has
higher recovered property by 23.37 percent followed 10.62 percent, 6.96 percent and
4.33 percent for Kaskazini Unguja, Kusini Unguja and Kusini Pemba respectively

115
Table 3.4.8: Number of Offences against Property Stolen and Recovered by Region
2013-2014
Region
2013 2014
Total
cases
Properties stolen
000Tsh
Properties
recovered 000
Tsh
Percentage
Recovered
Total
cases
Properties
stolen
000Tsh
Properties
recovered
000 Tsh
Percentage
Recovered
Kaskazini
Unguja 50 26,691,900 5,328,500 20% 37 53,737,900 5,706,500 10.62%
Kaskazini A 38 17,614,300 5,328,500 30.25% 24 31,894,500 2,656,500 8.33%
Kaskazini B 12 9,077,600 0 0.00% 13 21,843,400 3,050,000 13.96%
Kusini
Unguja 101 122,520,600 41000000 33.46% 69 112,175,500 7,811,500 6.96%
Kati 67 43,580,600 20,900,000 47.96% 53 38,439,500 4,811,500 12.52%
Kusini 34 78,940,000 20,100,000 25.46% 16 73,736,000 3,000,000 4.07%
Mjini
Magharib 59 119540500 2698000 2.26% 48 88,309,000 20,635,000 23.37%
Mjini 11 58,050,000 1,590,000 2.74% 11 12,797,000 2,435,000 19.03%
Magharib 48 61,490,500 1,108,000 1.80% 37 75,512,000 18,200,000 24.10%
Kaskazini
Pemba 47 70998400 50000 0.07% 5 7,740,000 40,000 0.52%
Wete 38 67,798,400 50,000 0.07% 2 1,700,000 0 0.00%
Micheweni 9 3,200,000 0 0.00% 3 6,040,000 40,000 0.66%
Kusini Pemba 48 68642200 1424500 2.08% 51 20,471,400 886,000 4.33%
Chake chake 28 66,538,000 974,000 1.46% 16 2,096,400 143,000 6.82%
Mkoani 20 2104200 450,500 21.41% 35 18,375,000 743,000 4.04%
Source: Police Headquarter, Zanzibar
Prison Statistics
Table 3.4.9 represents number of inmates by age and sex; it is observed that most of
young age (18-30) are in prison in compared to other age in all years by 69.2 percent in
2013 and 71.9 in 2014 followed by age 31- 40 by 21.4 and 18.6 in 2013 and 2014, while
female inmates increase by two third from 2013 to 2014 as shown in the table below.
Table 3.4.9: Number of Total Inmates by Age, 2013-2014
Age
2013 2014
Male Female Total Male Female Total
Under 17 years 4 0 4 8 1 9 18- 30 285 2 287 332 5 337
31- 40 89 0 89 81 6 87
41-50 29 2 31 23 0 23
51+ 4 0 4 13 0 13
Total 411 4 415 457 12 469 Source: Prison Department, Zanzibar Table 3.4.10 number of inmates by in custody, about 43.7 percent of inmates were
custody less than 3 month followed by 4 to 11 monthly by 24.5 percent while six and

116
above contribute only 4 percent. In 2014 only eight juvenile are inmates of which one
female and the rest are male while in 2013 all juvenile are male while juvenile remands
decrease by more than one third (36.4 percent) from 2013 to 2014 as shown in the table
3.4.11 below.
Table 3.4.10: Number of Inmates by in Custody, 2013-2014
Level of
offences at
the Center
2013 2014
Male Female Total Male Female Total
Under 3
months
169 1 170 198 7 205
Month 4-11 93 1 94 112 3 115
Years 1-2 87 2 89 104 1 105
Years 3-5 45 0 45 25 0 25
Years 6-10 9 0 9 10 0 10
Years 11 6 0 6 8 1 9
Death
Penalty 2 0 2 0 0 0
Total 411 4 415 457 12 469 Source: Prison Department, Zanzibar
Table 3.4.11: Number of Juvenile Inmates and Remands, 2013 - 2014
2013 2014
Male Female Total Male Female Total
Juvenile
Inmates 4 0 4 7 1 8
Juvenile
Remands 42 3 45 30 3 33
Total 46 3 49 37 4 41 Source: Prison Department, Zanzibar
Table 3.4.12 illustrate type of correction programs offered Inmates or remands of which
more than two third got knowledge in agriculture in all years, while 20.9 percent and 21.5
percent knowledgeable in livestock keeping in 2013 and 2014 respectively, female
inmates/remands obtained knowledge in hand craft in all years compared to males
receive type of correction in different pommes.

117
Table 3.4.12: Type of Correctional Programs Offered, 2013 - 2014
2013 2014
Male Female Total Male Female Total
Agriculture 200 0 200 213 0 213
Carpenter 13 0 13 16 0 16
Tailoring 20 0 20 13 0 13
Livestock 66 0 66 71 0 71
Masons 13 0 13 15 0 15
Hand craft 0 4 4 0 3 3
Total 312 4 316 328 3 331 Source: Prison Department, Zanzibar
Table 3.4.13 shows total number of remands by age and sex, table below shows the
decrease of 17 percent remands from 2013 to 2014, also data, revealed that most of
young people are aged 18 to 30 in detained likewise Inmates, furthermore the information
shows that there is an increase of detention from 120 to 123 in 2013 and 2014
respectively.
Table 3.4.13: Number of total Remands by Age, 2013 - 2014
Age
2013 2014
Male Female Total Male Female Total
Under 17
years 42 3 45 36 2 38
18-30 1,100 35 1,135 1,011 25 1,036
31-40 470 14 484 322 5 327
41-50 116 4 120 119 4 123
51+ 40 0 40 31 0 31
Total 1,768 56 1,824 1,519 36 1,555 Source: Prison Department, Zanzibar
3.5 Court Cases
A legal case is a dispute between opposing parties resolved by a court, the table bellow
indicate that, Zanzibar have only two judges and 79 lawyers as shown in the table 3.5.1
below, table 3.5.2 shows number of criminal juvenile cases which demonstrate that about
40 percent and eight percent of case has been decided in 2013 and 2014 while otherwise
is true. In table 0014 indicates that level of cases in instituted in different regional court
of Zanzibar from 2013 to 2014 in which the number of cases is very high in Mjini
Magharibi followed by Kaskazini Unguja in 2014, while for Kaskazini and Kusini Pemba
has no offence which related to the cases indicated in the table 3.5.3 below for the year
2014.

118
Total 3.5.1: Number of Judges and Lawyers, 2013 - 2014
2013 2014
Male Female Total Male Female Total
Judges 4 2 6 4 2 6 Lawyers 65 14 79 65 14 79
Total 69 16 85 69 16 85 Source: High Court, Zanzibar
Table 3.5.2: Criminal Cases at the Juvenile, 2013 - 2014
Years Filed Cases Decided Cases
Cases Pending before
the court
2013 52 21 31
2014 21 4 17 Source: High Court, Zanzibar
Table 3.5.3: Distribution of Criminal Case in the Regional Court, 2013-2014
Offences
Kaskazini
Unguja
Kusini
Unguja
Mjini
Magharibi
Kaskazini
Pemba
Kusini
Pemba
2013 2014 2013 2014 2013 2014 2013 2014 2013 2014
Drug trafficking 11 4 5 3 5 3 8 0 7 0
Possession of narcotic
drugs narcotic drag 0 0 0 0 7 2 0 0 0 0
House breaking 0 0 0 0 2 2 0 0 0 0
Causing death 6 11 13 11 24 33 0 0 0 0
Arson 0 0 0 0 0 0 0 0 0 0
Found with stolen
property 0 0 0 0 0 1 0 0 0 0
Armed robbery 2 0 12 1 11 4 0 0 0 0
Robbery 5 0 0 0 20 5 0 0 0 0
Obtaining goods by false
pretence 0 0 0 0 9 19 0 0 0 0
Stealing of government
property 0 0 0 0 0 0 0 0 0 0
Rape 29 26 37 18 43 30 15 0 17 0
Defilement of a boy 2 3 5 2 5 4 2 0 0 0
Unnatural offence 5 1 4 2 2 1 2 0 2 0
Miscellaneous 8 11 27 7 3 0 0 0 0 0
Total 68 56 103 44 131 104 27 0 26 0 Source: High Court, Zanzibar