office of fossil energyexisting coal-fired power plant operations june 3, 2015 doe/netl-2015/1718...
TRANSCRIPT

Impact of Load Following on the Economics of Existing Coal-Fired Power Plant Operations
June 3, 2015 DOE/NETL-2015/1718
OFFICE OF FOSSIL ENERGY
National Energy Technology Laboratory

Impact of Load Following on the Economics of Existing Coal-fired Power Plant Operation
Disclaimer This report was prepared as an account of work sponsored by an agency of the United States Government. Neither the United States Government nor any agency thereof, nor any of their employees, makes any warranty, express or implied, or assumes any legal liability or responsibility for the accuracy, completeness, or usefulness of any information, apparatus, product, or process disclosed, or represents that its use would not infringe privately owned rights. Reference therein to any specific commercial product, process, or service by trade name, trademark, manufacturer, or otherwise does not necessarily constitute or imply its endorsement, recommendation, or favoring by the United States Government or any agency thereof. The views and opinions of authors expressed therein do not necessarily state or reflect those of the United States Government or any agency thereof.
Impact of Load Following on the Economics of Existing Coal-fired Power Plant Operation
Author List:
National Energy Technology Laboratory (NETL)
Eric Grol General Engineer
Thomas J. Tarka, P.E. Senior Engineer
Strategic Energy Analysis and Planning Division
Energy Sector Planning and Analysis (ESPA)
Paul Myles, Leonard M. Bartone, Jr., James C. Simpson, PhD., Gianalfredo Rossi WorleyParsons Group, Inc.
This report was prepared by Energy Sector Planning and Analysis (ESPA) for the United States Department of Energy (DOE), National Energy Technology Laboratory (NETL). This work was completed under DOE NETL Contract Number DE-FE0004001. This work was performed under ESPA Task 150.09.05.
DOE Contract Number DE-FE0004001

Impact of Load Following on the Economics of Existing Coal-fired Power Plant Operation
This page intentionally left blank.
Impact of Load Following on the Economics of Existing Coal-fired Power Plant Operation
i
Table of Contents Executive Summary .........................................................................................................................1 1 Introduction .......................................................................................................................5 2 Impacts of More Frequent Ramping and Starts/Stops on Mechanical Components .........7 3 Impacts of Cold Starts on O&M Frequency and Cost .......................................................9 3.1 Impact on Frequency of Equipment Repair/Replacement .................................................9 3.2 Impact on Periodic Replacement/Major Repair Cost ......................................................12 3.3 Impact on Routine Annual Maintenance and Inspection Cost ........................................13 4 Impacts of Starts and Stops on Annual Startup Fuel and O&M Costs ............................13 4.1 Annual Startup Fuel Costs and Susceptible Components’ O&M Costs..........................15 4.2 Total Fixed O&M Costs and Annual Startup Fuel Costs ................................................18 5 Impacts of Starts/Stops on Cost of Electricity (COE) and CO2 Emissions .....................19 5.1 Susceptible Components’ O&M Costs Impact on COE ..................................................20 5.2 Impact of Decreasing Capacity Factor by Increasing Downtime ....................................21 5.3 Impact of Decreased Load Factor on Heat Rate and Fuel Costs .....................................22 5.4 Impact of Decreased Load Factor and Capacity Factor on COE ....................................24 5.5 Impact of Reduced Capacity Factor on CO2 emissions ...................................................27 6 Key Findings ...................................................................................................................28 7 References .......................................................................................................................30
Impact of Load Following on the Economics of Existing Coal-fired Power Plant Operation
ii
List of Exhibits Exhibit 1 – PJM Dispatch Curve (May 2015) ................................................................................ 3 Exhibit 2 – PJM Dispatch Curve (May 2015) with Added Dispatch Costs due to Cycling ........... 4 Exhibit 3: Susceptible Components and Related Maintenance Issue List ...................................... 7 Exhibit 4 Impact of More Frequent Starts/Stops on Component Replacement/Major Repair
Frequency and Maintenance Costs ....................................................................................... 10 Exhibit 5: General Report Basis ................................................................................................... 14 Exhibit 6: Routine/Periodic Maintenance and Startup Fuel Costs as Functions of Cold Start
Frequency .............................................................................................................................. 16 Exhibit 7 Total Annual Maintenance and Startup Fuel Costs as Functions of Cold Start
Frequency .............................................................................................................................. 17 Exhibit 8 Annual Maintenance Cost Annual Startup Fuel Costs per MW per Start..................... 18 Exhibit 9 Total Annual Fixed O&M and Startup Fuel Costs ....................................................... 19 Exhibit 10 Routine and Periodic Maintenance Costs of Susceptible Components and Startup Fuel
Costs ...................................................................................................................................... 21 Exhibit 11 Maintenance and Startup Costs as a Function of Capacity Factor for a Range of
Annual Starts and Stops ........................................................................................................ 22 Exhibit 12 Change in Heat Rate as a Function of Load Factor .................................................... 23 Exhibit 13 Fuel Cost Changes as a Function of Load Factor ....................................................... 24 Exhibit 14 Impact of Capacity Factor Reduction Strategy on Susceptible Component O&M and
Fuel Costs for a Single Annual Cold Start ............................................................................ 25 Exhibit 15 Impact of Capacity Factor Reduction Strategy on Susceptible Component O&M and
Fuel Costs for Multiple Cold Starts ...................................................................................... 26 Exhibit 16 Impact of Starts/Stops on the Total Plant Fixed O&M Portion of the COE ............... 27 Exhibit 17 Annual CO2 Emissions Reduction by Decreasing Capacity Factor ............................ 28
Impact of Load Following on the Economics of Existing Coal-fired Power Plant Operation
1
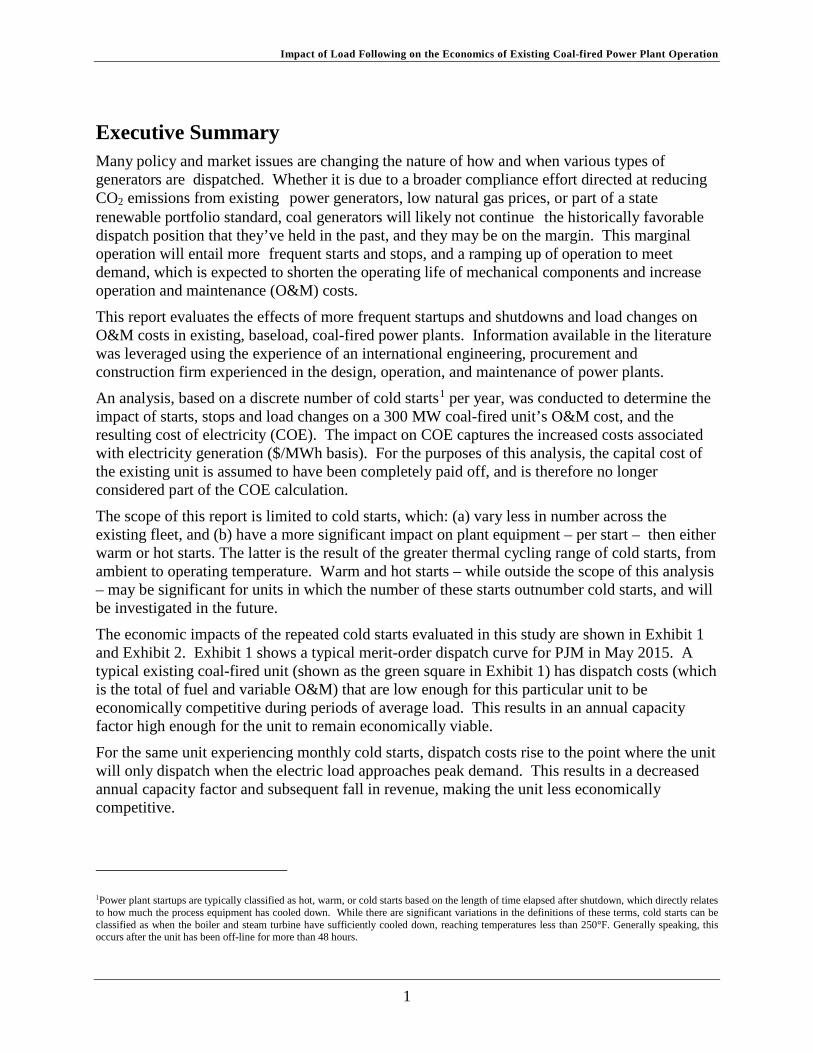
Executive Summary Many policy and market issues are changing the nature of how and when various types of generators are dispatched. Whether it is due to a broader compliance effort directed at reducing CO2 emissions from existing power generators, low natural gas prices, or part of a state renewable portfolio standard, coal generators will likely not continue the historically favorable dispatch position that they’ve held in the past, and they may be on the margin. This marginal operation will entail more frequent starts and stops, and a ramping up of operation to meet demand, which is expected to shorten the operating life of mechanical components and increase operation and maintenance (O&M) costs.
This report evaluates the effects of more frequent startups and shutdowns and load changes on O&M costs in existing, baseload, coal-fired power plants. Information available in the literature was leveraged using the experience of an international engineering, procurement and construction firm experienced in the design, operation, and maintenance of power plants. An analysis, based on a discrete number of cold starts1 per year, was conducted to determine the impact of starts, stops and load changes on a 300 MW coal-fired unit’s O&M cost, and the resulting cost of electricity (COE). The impact on COE captures the increased costs associated with electricity generation ($/MWh basis). For the purposes of this analysis, the capital cost of the existing unit is assumed to have been completely paid off, and is therefore no longer considered part of the COE calculation.
The scope of this report is limited to cold starts, which: (a) vary less in number across the existing fleet, and (b) have a more significant impact on plant equipment – per start – then either warm or hot starts. The latter is the result of the greater thermal cycling range of cold starts, from ambient to operating temperature. Warm and hot starts – while outside the scope of this analysis – may be significant for units in which the number of these starts outnumber cold starts, and will be investigated in the future.
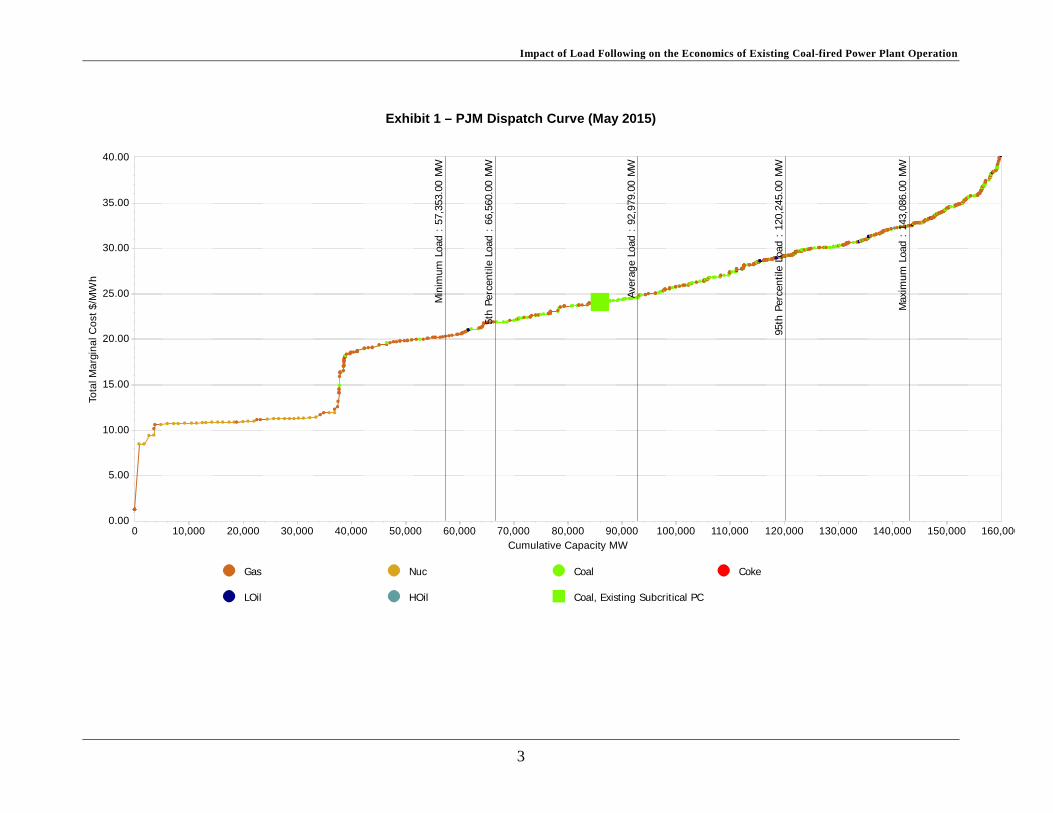
The economic impacts of the repeated cold starts evaluated in this study are shown in Exhibit 1 and Exhibit 2. Exhibit 1 shows a typical merit-order dispatch curve for PJM in May 2015. A typical existing coal-fired unit (shown as the green square in Exhibit 1) has dispatch costs (which is the total of fuel and variable O&M) that are low enough for this particular unit to be economically competitive during periods of average load. This results in an annual capacity factor high enough for the unit to remain economically viable.
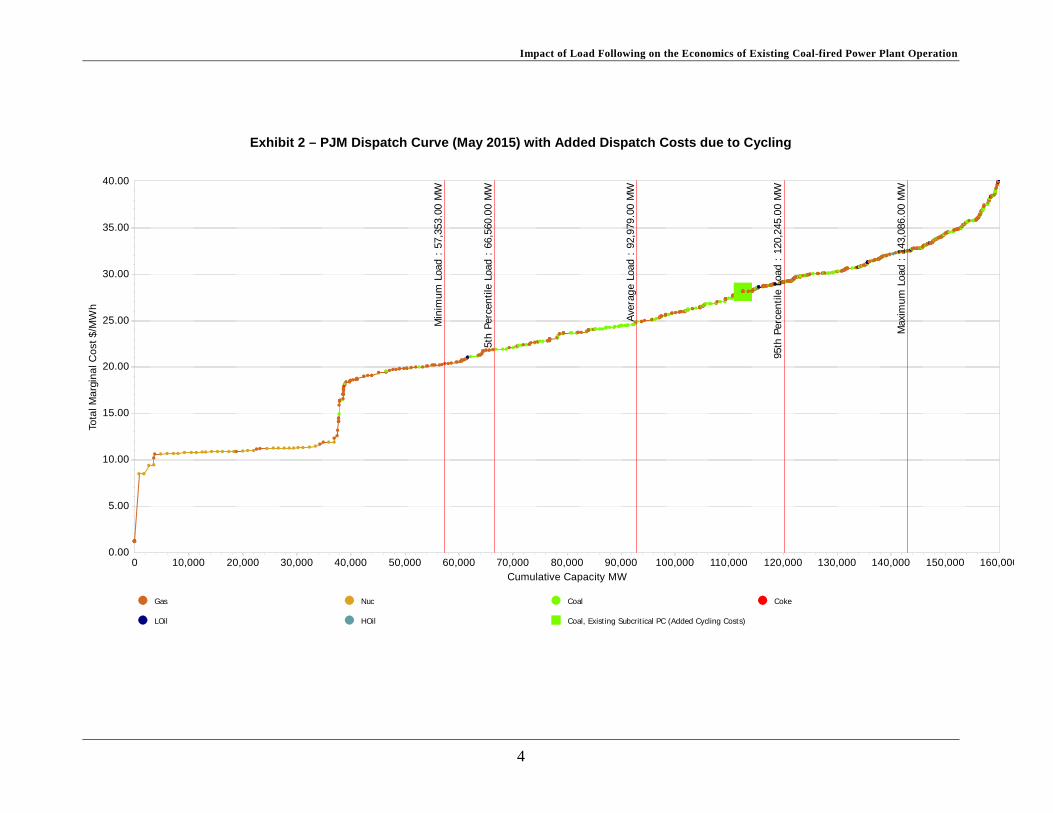
For the same unit experiencing monthly cold starts, dispatch costs rise to the point where the unit will only dispatch when the electric load approaches peak demand. This results in a decreased annual capacity factor and subsequent fall in revenue, making the unit less economically competitive.
1Power plant startups are typically classified as hot, warm, or cold starts based on the length of time elapsed after shutdown, which directly relates to how much the process equipment has cooled down. While there are significant variations in the definitions of these terms, cold starts can be classified as when the boiler and steam turbine have sufficiently cooled down, reaching temperatures less than 250°F. Generally speaking, this occurs after the unit has been off-line for more than 48 hours.

Impact of Load Following on the Economics of Existing Coal-fired Power Plant Operation
2
Key Findings Findings of this report focus on the changes to the O&M and fuel costs related to reducing generation through:
1. Decreasing the plant annual operating hours by increasing the number of plant shutdowns,
2. Operating the plant below its design capacity, at a lower load factor2.
The results are primarily represented as increases with respect to O&M and fuel components of the COE. The increases are not expressed with respect to the total costs of electricity since the capital component of the existing unit under consideration is assumed to be fully paid off. The key findings of the report are as follows:
• The combination of startup fuel cost, periodic replacement and major maintenance costs, and annual routine maintenance and inspection cost of susceptible components (shown in Exhibit 3) could range from $12,800/MW/year for 1 annual cold start to $18,340/MW/year for 12 annual cold starts.
• Additional maintenance (in excess of the major maintenance costs noted above) for susceptible components and startup fuel costs could range from $100/MW/Start to $490/MW/Start depending on the number of annual cold starts between 1 and 12.
• On an annual basis, the routine maintenance and inspection costs for susceptible components can be as significant as the periodic replacement and maintenance costs.
• When the number of annual cold starts increases from 1 to 12, the susceptible components identified in Exhibit 3 require additional maintenance due to thermal cycling, and there are additional startup fuel costs. These additional costs are presented as an increase in COE. This component of COE can vary by 42% (from $1.73/MWh to $2.46/MWh)3 depending on the number of cold starts.
• About 20% of the fixed O&M cost contribution of the COE is related to the startup susceptible component maintenance cost and startup fuel cost.
• Increasing annual cold starts and stops from 1 to 6 (or 12) increases the total fixed costs4 by about 10%.
• Reducing capacity factor by decreasing load factor5 has a greater adverse impact on COE than by increasing the number of shutdowns (decreasing operating time).
2 The capacity output level expressed as a percent of the full plant capacity. For example, 240MW plant operating at a load factor of 50% will have an output 120MW. 3 This analysis assumes 85% annual capacity factor 4 Fixed operating and maintenance are independent of the annual MWh’s generated by a power plant. 5 Load factor is defined as the ratio of actual output to maximum rated output.
Impact of Load Following on the Economics of Existing Coal-fired Power Plant Operation
3
Exhibit 1 – PJM Dispatch Curve (May 2015)
Gas Nuc Coal Coke
LOil HOil Coal, Existing Subcritical PC
0.00
5.00
10.00
15.00
20.00
25.00
30.00
35.00
40.00
Tota
l Mar
gina
l Cos
t $/M
Wh
0 10,000 20,000 30,000 40,000 50,000 60,000 70,000 80,000 90,000 100,000 110,000 120,000 130,000 140,000 150,000 160,000Cumulative Capacity MW
Min
imum
Loa
d :
57,3
53.0
0 M
W
5th
Perc
entil
e Lo
ad :
66,
560.
00 M
W
Aver
age
Load
: 9
2,97
9.00
MW
95th
Per
cent
ile L
oad
: 12
0,24
5.00
MW
Max
imum
Loa
d :
143,
086.
00 M
W
Impact of Load Following on the Economics of Existing Coal-fired Power Plant Operation
4
Exhibit 2 – PJM Dispatch Curve (May 2015) with Added Dispatch Costs due to Cycling
Gas Nuc Coal Coke
LOil HOil Coal, Existing Subcritical PC (Added Cycling Costs)
0.00
5.00
10.00
15.00
20.00
25.00
30.00
35.00
40.00
Tota
l Mar
gina
l Cos
t $/M
Wh
0 10,000 20,000 30,000 40,000 50,000 60,000 70,000 80,000 90,000 100,000 110,000 120,000 130,000 140,000 150,000 160,000Cumulative Capacity MW
Min
imum
Loa
d :
57,3
53.0
0 M
W
5th
Perc
entil
e Lo
ad :
66,
560.
00 M
W
Aver
age
Load
: 9
2,97
9.00
MW
95th
Per
cent
ile L
oad
: 12
0,24
5.00
MW
Max
imum
Loa
d :
143,
086.
00 M
W
Impact of Load Following on the Economics of Existing Coal-fired Power Plant Operation
5
1 Introduction It is anticipated that in the future, existing coal-fired electric generating units will be required to increase the number of plant shutdowns due to proposed environmental regulations, thereby increasing the cost of electricity. Coal generators have historically enjoyed early dispatch positions due to low fuel and operating and maintenance (O&M) costs, and therefore have not had to frequently ramp, or shut down, in the same way that is required of units on the margin. If coal-fired generators will be required to operate at a reduced capacity factor in the future, the impact of shutdowns versus operating at a decreased load factor needs to be evaluated by utilities to assess the most economically sound option.
This report evaluates the effects of more frequent startups and shutdowns and load changes on O&M costs in existing, baseload, coal-fired power plants and the resulting changes in the cost of electricity. O&M costs are typically divided between fixed and variable costs. The fixed O&M costs are independent of the generation from a plant and include administrative, operating and maintenance labor costs as well as property taxes and insurance. Variable operating costs are proportional to the plant generation and include items such as fuel, sorbent for sulfur removal, and other consumables. Since the COE is the O&M and fuel cost of the plant per megawatt hour of operation over the operation of the plant (30 years), the COE is dependent on the annual capacity factor, defined as the actual megawatt hours of operation divided by the maximum possible megawatt hours of operation. Load following, which involves running the plant at part load, will increase the plant heat rate which will increase the fuel cost (a variable cost) component of the COE.
A typical structure of the COE and contributing costs are:
• Capital (fixed) • Operating and Maintenance
o Fixed O&M Annual operating labor Maintenance labor including inspections Administrative and support labor Property taxes and insurance Maintenance materials and some replacement equipment
o Variable O&M Fuel Chemicals Water
The capital costs and fixed O&M are independent of the plant generation. Variable operating costs are proportional to the plant generation. For this analysis, the assumption is made that the capital portion of the existing unit is completely paid off and is no longer considered part of the COE calculation.
The analysis presented in this report identifies:

Impact of Load Following on the Economics of Existing Coal-fired Power Plant Operation
6
• Which components in a power plant are most susceptible to early failure due to more frequent starts and stops;
• The impact on O&M costs associated with these operational changes; • The increase in frequency and capital costs of major repairs and/or total replacement
of the component; • The effect of more frequent starts and stops on fuel costs; • The effects that part load operation have on heat rate and fuel cost; and • The impact of increased O&M costs and fuel costs on the cost of electricity.
Many policy and market issues are changing the nature of how and when various types of generators are dispatched. These market issues included emissions regulations such as Mercury and Air Toxics Standards (MATS) and Cross-State Air Pollution Rule (CSAPR), natural gas prices and greater contributions to the grid from renewables. Whether it is due to a broader compliance effort directed at reducing CO2 emissions from existing power generators, low natural gas prices, or part of a state renewable portfolio standard, coal generators will likely not continue the historically favorable dispatch position that they’ve held in the past. This shift in operation will entail more frequent shutdowns, and a ramping up of operation to meet demand.
Operations to accommodate frequent load changes or shut downs are expected to shorten the life of mechanical components (such as pumps, compressors, fans, etc.). This will increase O&M costs by requiring more frequent mechanical component replacement, compared to historic coal-fired electric generating unit operation.
Since existing coal units will now be closer to the margin, revenues will decrease because these units will not operate as many hours per year. This may be a result of a renewable portfolio standard or because lower-emitting fuel sources (such as gas or renewables) receive preferential dispatch.
An analysis, based on a discrete number of cold starts per year, was employed to determine the impact of more frequent starts and stops on a 300 MW coal-fired unit’s O&M cost and COE. The scope of this report is limited to cold starts, which: (a) vary less in number across the existing fleet, and (b) have a more significant impact on plant equipment – per start – then either warm or hot starts. The latter is the result of the greater thermal cycling range of cold starts, from ambient to operating temperature. [1] One, six, and twelve cold starts per year were evaluated, with one start chosen as the reference case since it is representative of the annual outage scheduled by baseload plants6. A maximum of 12 cold starts was considered based on the time required for a unit to cool down and then be restarted. Approximately 7 days is required for a cold start of a coal-fired power plant, from initial boiler heating to full load operation. Warm and hot starts – while outside the scope of this analysis – may be significant for units in which the number of these starts outnumber cold starts, and will be investigated in the future.
6 Analysis of data from the Ventyx Velocity database for the ERCOT region (an area with high renewable penetration) indicates there are an average of 3.5 cold starts per year for all coal-fired plants over the past 13 years. The highest number of reported annual cold starts for a single unit was 13 with 23 out of 32 units reporting at least 1 year with 1 cold start.

Impact of Load Following on the Economics of Existing Coal-fired Power Plant Operation
7
2 Impacts of More Frequent Ramping and Starts/Stops on Mechanical Components
Generally, an increase in frequency in ramping and/or shutdowns decreases the component life through damage caused by creep, fatigue, thermal shock, acid-induced corrosion, erosion, and other stresses. The degree to which cycling-induced damage will affect a specific plant and its operation is not understood very well because it depends on the size, age, and design characteristics, as well as the level of cycling the plant will undergo.
This report focuses on those major components that, according to literature sources, tend to exhibit more susceptibility to early failure due to frequent ramping and/or increased cycling. Exhibit 3 shows the components that are included in the analysis and the most recurrent maintenance issue(s) encountered when subjected to frequent ramping and/or starts and stops. For purposes of this report, these components are referred to as “susceptible components.”
The susceptible components referenced in this report are for a baseload, subcritical, pulverized coal power plant. Subcritical pulverized coal power plants were selected for this report based on the larger number of subcritical units and greater capacity of subcritical power plants (66% of total installed coal capacity) compared to supercritical power plants in the United States.7
Exhibit 3: Susceptible Components and Related Maintenance Issue List
Component Maintenance Issue Source
Coal Pulverizer Prone to fireside explosions especially with Western Coals. Mechanical wear when cycled at low end of minimum flow rates.
2
Boiler/Steam Drum Fatigue caused primarily by the temperature differential between sub-cooled inlet feedwater and saturation temperature of steam-water mixture.
3
Boiler Refractory Cracking and erosion from low load operations. 1
Superheater Header & Tubes
Overheating from low/no-flow of cooling steam (startup) and/or poor combustion gas temperature management causes thermal deformation. Internal ligament cracking. Oxidation and exfoliation from exposing metal to higher temperatures than design.
3
Reheater Tubes
Fatigue caused by high temperature differential and hot spots from low steam flows during startup. Load cycling causes overheating failures in the long-term. Resulting tube exfoliation may damage IP turbines.
4
Economizer Tubes
Thermal shocking damage due to relatively cold water during startup. Corrosion may occur if cold water lowers metal temperature below acid dew point of flue gas during low load.
3
7 From the Ventyx Velocity database: Supercritical - 129 units with a total of 86,416 MW operating capacity Subcritical - 912 units with a total of 167,842 MW operating capacity

Impact of Load Following on the Economics of Existing Coal-fired Power Plant Operation
8
Component Maintenance Issue Source
Lower Furnace Tubes Fatigue failures resulting in tube leaks increases with increasing number of starts. Increased erosion at low loads.
2, 3
Windbox Supports Structural damage caused by large transient temperature differences. 2
Feedwater Heaters
Early tube failures due to cool-down and rapid heating during hot/warm startup cycle. Tube grooving at the support plates can occur due to poor water chemistry.
2
Boiler Feed Pumps Accelerated wear at low load operation for units that do not have variable frequency drives or hydraulic couplings. 3
Steam Turbine/Generator
Steam seals may need to be replaced to prevent steam from bypassing rotor stages. Most units have been changed to Brandon packing; primary concern would be exhaust hood temperatures and ability to control the temperature at low steam flows.
3
Admission Valves Throttling increases wear and reduces efficiency. 2
Turbine Rotor
Reducing startup time and increasing the number of annual start cycles can substantially enhance rotor material degradation, causing rotor failure. This may result in blade loss, spindle fracture, and even fast fracture from a near-bore causing catastrophic failure.
2
LP Turbine Blades
Solid particle erosion. Impingement of droplets leads to accelerated damage of erosion shields and blade surfaces. LP last stage blade stall flutter at low flow conditions may cause blade vibration, resulting in cycle fatigue.
2
Generator Retaining ring and end-turn fatigue that can lead to failure/arcing. This will only be an issue if they require a shift from the generator to line voltage of ±20%.
2
Steam Piping Thermal stress and fatigue cracking due to temperature fluctuations. 2
FGD Absorber Thermal stress and fatigue cracking due to temperature fluctuations. 3
FGD Pumps and Motors Additional rotational loads on motors and pumps as they are accelerated to operating speed. 3
Baghouse Wet gas corrosion from operating below acid dew point at low load. 2
FD/ID Fans Frequent start/stop of fans increases failure rates, inspection intervals, and motor-fan maintenance. 3
Dampers Load following & partial load require more oscillation of dampers, increasing wear. 2
Air Heaters Wet gas corrosion from operating below acid dew point at low load. 3
Impact of Load Following on the Economics of Existing Coal-fired Power Plant Operation
9
Component Maintenance Issue Source
Pump Motors More wear on oscillation valves and motor due to oscillation of control valves. VFDs could prolong life of motor and control valves and reduce energy load.
2
Condenser Tube grooving at support plates can occur due to poor water chemistry. 2
3 Impacts of Cold Starts on O&M Frequency and Cost This section assesses the impact of cycling on the operating and maintenance frequency cost for the susceptible components identified in Exhibit 3. Cost data from various sources was normalized to the 300 MW subcritical coal-fired unit size, and were adjusted for inflation to mid-2013 U.S. dollars.
Depending on the susceptible component selected, cycling-induced damage may:
• Vary the frequency at which planned or unplanned major repairs (or equipment replacement) are required,
• Increase the total expected costs associated with a given major repair or replacement (e.g. more boiler tubes need replacement, larger area to re-line in absorber, etc.),
• Increase the annual routine maintenance and inspection costs.
3.1 Impact on Frequency of Equipment Repair/Replacement An analysis is used to evaluate the impact of cycling on the frequency at which major repair or total replacement of a susceptible component takes place. The scope of this report is limited to cold starts, which are expected to have a more significant impact on plant equipment – per start – then either warm or hot starts. [1] For this reason, the analysis on each susceptible component was centered on 1, 6, and 12 cold starts per year. One cold start per year was selected as the reference case because it represents the annual outage scheduled by baseload plants.
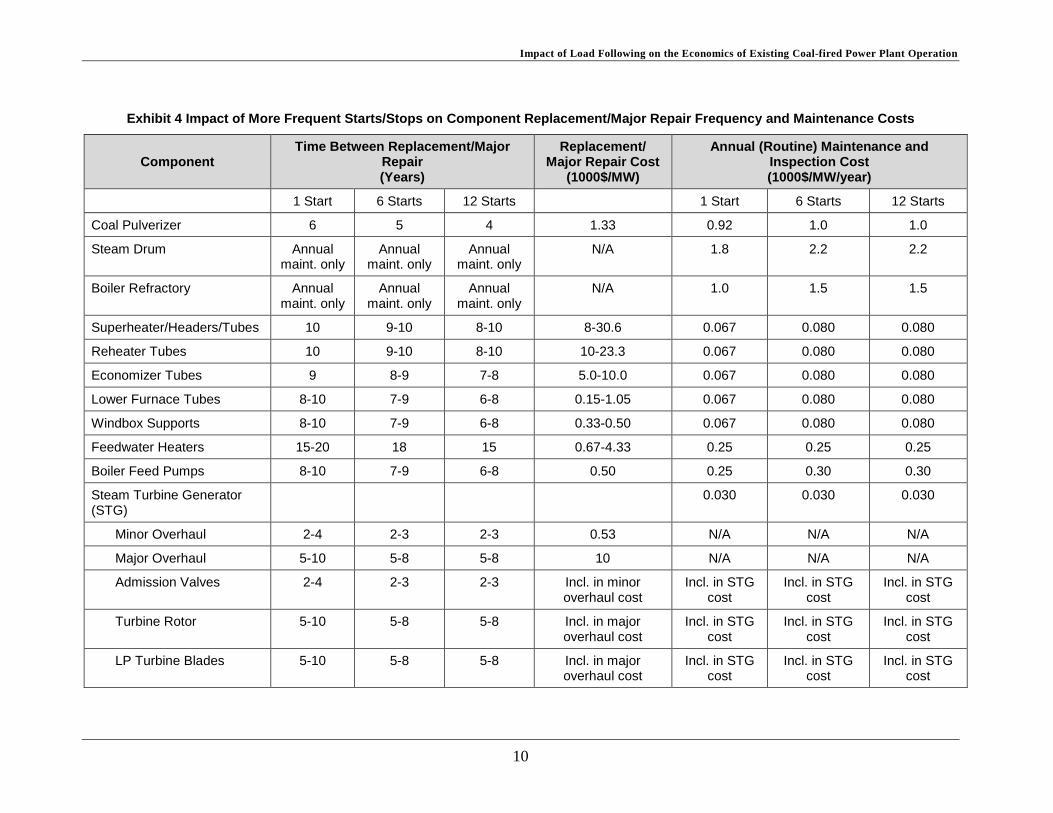
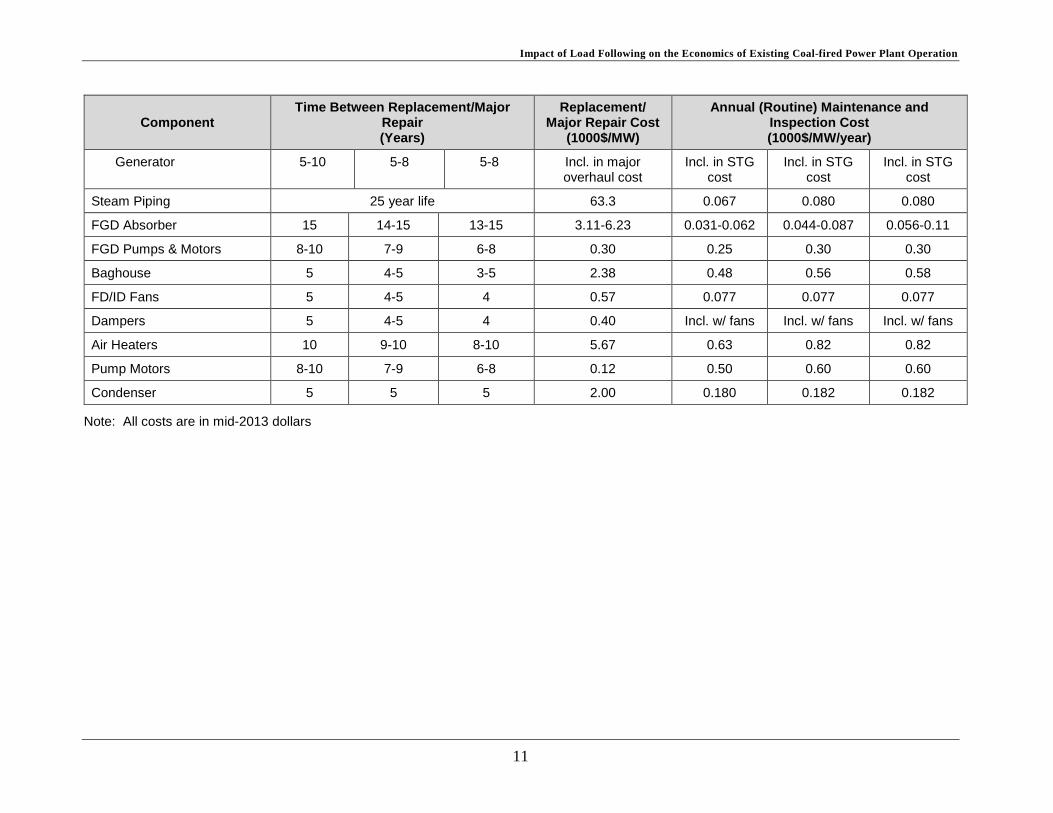
Exhibit 4 shows the expected replacement frequency of susceptible components, as well as cost implications (replacement/major repair, and annual routine inspection) as functions of the number of annual cold starts. The data are from WorleyParsons’ experience in the construction and maintenance of coal-fired power plants. Most of the susceptible components show a range in the frequency at which a replacement or major repair takes place. This range represents the variability that exists for each component due to specific plant maintenance philosophy, manufacturer’s recommendation, redundancy, and financial considerations, among others. There is a significant amount of overlap between the ranges and, in some cases, apparently small changes in the time between replacement/major repairs as the number of cold starts increase.
Impact of Load Following on the Economics of Existing Coal-fired Power Plant Operation
10
Exhibit 4 Impact of More Frequent Starts/Stops on Component Replacement/Major Repair Frequency and Maintenance Costs
Component Time Between Replacement/Major
Repair (Years)
Replacement/ Major Repair Cost
(1000$/MW)
Annual (Routine) Maintenance and Inspection Cost (1000$/MW/year)
1 Start 6 Starts 12 Starts 1 Start 6 Starts 12 Starts
Coal Pulverizer 6 5 4 1.33 0.92 1.0 1.0
Steam Drum Annual maint. only
Annual maint. only
Annual maint. only
N/A 1.8 2.2 2.2
Boiler Refractory Annual maint. only
Annual maint. only
Annual maint. only
N/A 1.0 1.5 1.5
Superheater/Headers/Tubes 10 9-10 8-10 8-30.6 0.067 0.080 0.080
Reheater Tubes 10 9-10 8-10 10-23.3 0.067 0.080 0.080
Economizer Tubes 9 8-9 7-8 5.0-10.0 0.067 0.080 0.080
Lower Furnace Tubes 8-10 7-9 6-8 0.15-1.05 0.067 0.080 0.080
Windbox Supports 8-10 7-9 6-8 0.33-0.50 0.067 0.080 0.080
Feedwater Heaters 15-20 18 15 0.67-4.33 0.25 0.25 0.25
Boiler Feed Pumps 8-10 7-9 6-8 0.50 0.25 0.30 0.30
Steam Turbine Generator (STG)
0.030 0.030 0.030
Minor Overhaul 2-4 2-3 2-3 0.53 N/A N/A N/A
Major Overhaul 5-10 5-8 5-8 10 N/A N/A N/A
Admission Valves 2-4 2-3 2-3 Incl. in minor overhaul cost
Incl. in STG cost
Incl. in STG cost
Incl. in STG cost
Turbine Rotor 5-10 5-8 5-8 Incl. in major overhaul cost
Incl. in STG cost
Incl. in STG cost
Incl. in STG cost
LP Turbine Blades 5-10 5-8 5-8 Incl. in major overhaul cost
Incl. in STG cost
Incl. in STG cost
Incl. in STG cost
Impact of Load Following on the Economics of Existing Coal-fired Power Plant Operation
11
Component Time Between Replacement/Major
Repair (Years)
Replacement/ Major Repair Cost
(1000$/MW)
Annual (Routine) Maintenance and Inspection Cost (1000$/MW/year)
Generator 5-10 5-8 5-8 Incl. in major overhaul cost
Incl. in STG cost
Incl. in STG cost
Incl. in STG cost
Steam Piping 25 year life 63.3 0.067 0.080 0.080
FGD Absorber 15 14-15 13-15 3.11-6.23 0.031-0.062 0.044-0.087 0.056-0.11
FGD Pumps & Motors 8-10 7-9 6-8 0.30 0.25 0.30 0.30
Baghouse 5 4-5 3-5 2.38 0.48 0.56 0.58
FD/ID Fans 5 4-5 4 0.57 0.077 0.077 0.077
Dampers 5 4-5 4 0.40 Incl. w/ fans Incl. w/ fans Incl. w/ fans
Air Heaters 10 9-10 8-10 5.67 0.63 0.82 0.82
Pump Motors 8-10 7-9 6-8 0.12 0.50 0.60 0.60
Condenser 5 5 5 2.00 0.180 0.182 0.182
Note: All costs are in mid-2013 dollars

Impact of Load Following on the Economics of Existing Coal-fired Power Plant Operation
12
For most susceptible components, in particular the boiler components, there is a direct correlation between the number of cold starts and the frequency of major repairs or replacement. This will have an impact on the O&M costs throughout the life of the plant. For example, over a 30 year plant life, the coal pulverizer is expected to undergo 5 major repairs if operated with 1 cold start per year, but this number increases to 6 and 7 major repairs if the unit shut downs every other month (6 cold starts) or monthly (12 cold starts) on average.
Other susceptible components, such as the steam turbine generator, exhibit a similar general trend, but the frequency of the minor and major overhauls is affected more by scheduling factors than by the cycling-induced damage that they may sustain. Steam turbine minor overhauls consist primarily of valve work, equipment calibration, and general inspection. Major overhauls include minor overhaul tasks, opening of the turbine casing, examination of blading and stator core, and dismantling the generator rotor. Major overhauls are very labor and capital intensive, and so periodic maintenance is based on the number of operating hours and the plant’s assessment of the remaining life of the rotor. As such, the frequency range for minor and major overhauls remains unaltered for 6 and 12 cold starts.
The condenser major repair frequency is expected to remain the same irrespective of the number of cold starts since condenser re-tubing requires opening the condenser casing, which is extremely labor intensive. In this case, the nature of the repair sets the scheduling frequency for maintenance.
The boiler refractory periodic maintenance is listed as “annual maint. only” (annual maintenance only), since the refractory is normally repaired annually, and thus the costs incurred are listed under the annual (routine) maintenance and inspection costs shown in Exhibit 4. Similarly, the boiler steam drum does not have a total replacement cost or period since it is not economically feasible to replace this component. Costs associated with annual repairs and inspections are included under the annual routine maintenance cost in Exhibit 4.
In the case of steam piping, no plant data were available for the frequency of periodic major repair, so the initial total installed cost for steam piping over a 25- year life was utilized in the cost analysis [5].
3.2 Impact on Periodic Replacement/Major Repair Cost The estimated total installed costs, expressed in thousands of dollars per megawatt, for the susceptible components are also listed in Exhibit 4. These costs either represent a major repair or a total component replacement cost. Typically, these costs represent periodic major maintenance, with the exception of some boiler components (superheater, reheater, and economizer) and the steam piping. All cost data presented has been scaled to a 300 MWe plant size and adjusted to mid-2013 U.S. dollars.
The replacement and major maintenance costs are sometimes given as a range due to the variations in component design, task complexity, differing scope of work, labor costs, and/or materials of construction.
The different steam turbine components have been grouped into the minor and major overhaul costs as indicated in Section 2.
Impact of Load Following on the Economics of Existing Coal-fired Power Plant Operation
13
The frequency of maintenance and replacement of susceptible components is a function of the number of annual starts and stops. In reality, a susceptible component may be scheduled for service at regular intervals but at a higher repair/replacement cost due to increased damage from a more intensive mode of operation (increased starts and stops). The latter approach, though perhaps more realistic for a given power plant, would require historical operational data to establish a working baseline in order to differentiate the impact of cycling from regular wear and tear, human error, plant modifications, market price fluctuations, and other factors.
3.3 Impact on Routine Annual Maintenance and Inspection Cost Exhibit 4 shows the estimated total routine maintenance and inspection costs for the susceptible components for a given number of cold starts. These routine costs include those maintenance items that are performed regularly every year (e.g. bearing replacement, lubrication tasks, tube leak repairs, valve replacement, etc.), including detailed component inspections, non-destructive evaluations, instrument recalibration, and others. In most cases, labor costs, including contractor labor, account for the majority of the cost listed.
Most susceptible components show an increase in the annual routine maintenance costs when the number of cold starts is increased from 1 to 6 or 12. These higher routine costs are explained by having more frequent inspections for a given component to monitor the cycling-induced damage. Often, the routine maintenance cost does not vary from 6 to 12 cold starts because the inspections are scheduled and the damage induced by the number of starts and stops is gradual.
The superheater, reheater, economizer, lower furnace tubes, windbox supports, and steam piping show the same annual routine maintenance cost because it includes the cost of inspections and non-destructive evaluations. Increasing the number of starts/stops from the reference case elevates these costs by an estimated 20%.
The susceptible components associated with the STG are serviced and examined during minor or major overhauls. The annual routine maintenance cost listed under STG corresponds to overspeed tests and visual inspections of the different components (e.g. gearbox, seals, bearings, instrumentation, etc.) for leaks, wear, filter plugging, and vibration damage.
The routine maintenance costs for FD/ID fans remain constant because they represent the annual detailed inspection, changes of oil filters, and checking of the oil condition. The routine maintenance costs also include any necessary inspection of the dampers.
4 Impacts of Starts and Stops on Annual Startup Fuel and O&M Costs
Startup Fuel Costs
With every cold start there is a cost for startup fuel to heat the unit. In addition, there is an impact on the unit’s heat rate after a hot, warm, or cold start. In Intertek APTECH’s 2012 “Power Plant Cycling Costs” report, this percent increase in effective weekly heat rate is given as 0.44 percent for large (300 – 900 MW), subcritical coal units; irrespective

Impact of Load Following on the Economics of Existing Coal-fired Power Plant Operation
14
of the type of start. [4] For the purposes of this report, “startup fuel costs” include the fuel cost to heat the unit and the additional coal burned during the first week due to a 0.44 percent increase in heat rate.
Susceptible Components’ O&M costs
For each susceptible component, the major repair or replacement costs were multiplied by the number of instances it has to be repaired or replaced over a 30-year operational period, for each given number of cold starts. These costs are then normalized on a first-year basis. Any residual repair/replacement cost left in the component at the 30th year is credited evenly over the entire operation period. The total annual O&M costs for the susceptible components considered in this report are the summation of the annualized periodic major repair/replacement, the routine maintenance, and the startup fuel costs. This total cost is then divided by 300 MW to express them in dollars per megawatts, per year.
Since the time between periodic maintenance was estimated and presented in Exhibit 4 as a range of years in most cases, the total O&M cost is presented in this report for both the minimum estimated repair/replacement frequency (less frequent component replacement/repair, as shown in Exhibit 4) and the maximum repair/replacement frequency (more frequent component replacement/repair, as shown in Exhibit 4) for a given number of cold starts.
Exhibit 5 lists the assumptions utilized in this report to develop the cost estimation analysis. These assumptions were used to develop total annual costs (on a capacity basis, in units of $/MW/year) and cost of electricity ($/MWh). These costs are typically broken down by capital (loan repayment), fixed O&M, variable O&M, and fuel costs. Capital and fixed O&M are considered to be fixed costs (independent of the number of annual megawatt hours generated). The fuel and variable O&M costs are considered to be variable costs and their total annual costs are proportional to the annual number of megawatt hours generated.
Exhibit 5: General Report Basis
No. General Report Basis 1 Plant Operation 30 years
2 Boiler Fuel Illinois No. 6 Coal
3 Fuel Cost $2.35/MBtu
4 Total Plant Fixed Costs (including susceptible components)5 $73,623/MW/yr
5 Non-fuel variable operating costs5 $8.47/MWh
6 Nominal Heat Rate for 300 MW Plant at Full Load 10,000 Btu/kWh
7 Nominal Annual Capacity Factor for Baseload Plant 85%
8 Capital Costs None (existing unit assumed to be fully depreciated)
9 Cost of Electricity $41.86/MWh

Impact of Load Following on the Economics of Existing Coal-fired Power Plant Operation
15
4.1 Annual Startup Fuel Costs and Susceptible Components’ O&M Costs
The startup fuel costs and susceptible components’ O&M costs can be considered and compared in a variety of ways as illustrated in Exhibit 6 to Exhibit 8:
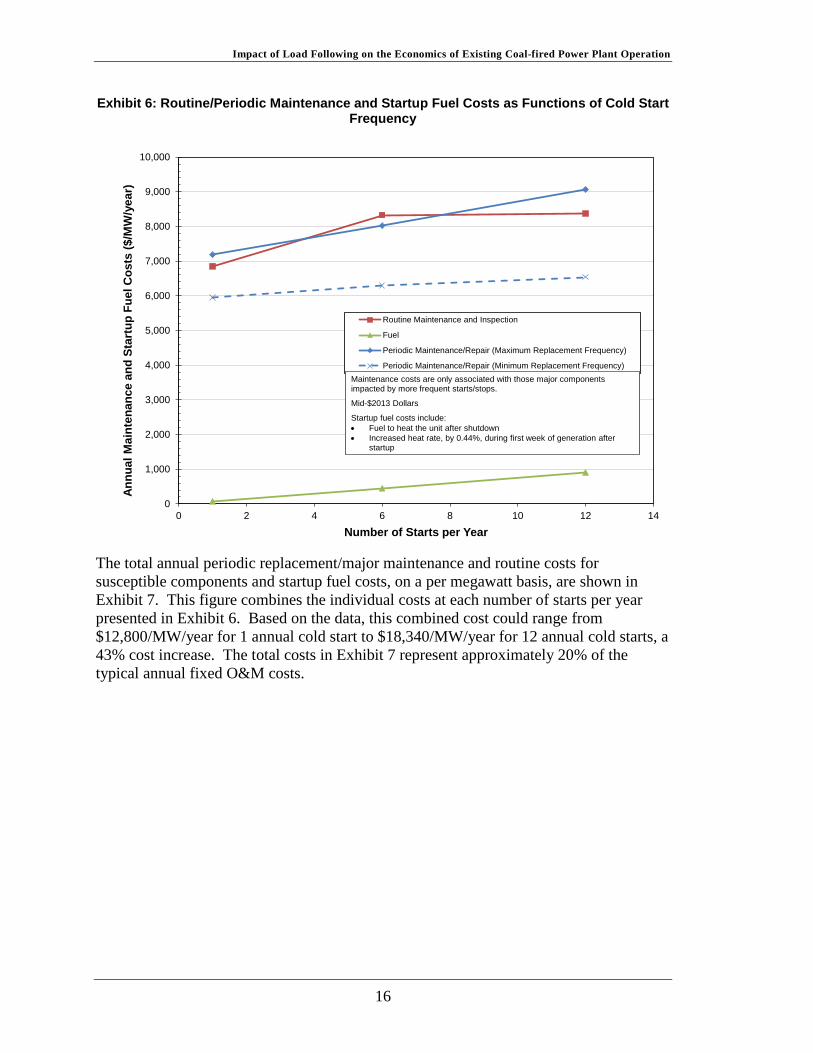
1. Exhibit 6 shows the magnitude of these cost accounts (routine maintenance, periodic maintenance and startup fuel) as a function of the number of cold starts per year for both the minimum and maximum replacement frequency shown in Exhibit 4.
2. Exhibit 7 contains the same cost accounts shown in Exhibit 6, but expresses them as total annual costs, as a function of the number of starts per year for both the minimum and maximum replacement frequency shown in Exhibit 4.
3. Exhibit 8 contains the same cost accounts shown in Exhibit 6 and Exhibit 7, but expresses them as a cost per start for both the minimum and maximum replacement frequency shown in Exhibit 4.
The exhibits in this report labeled “Min Freq” are associated with the minimum replacement/repair frequency for components in Exhibit 4 (less frequent component replacement/repair), and the data labeled “Max Freq” are associated with the maximum replacement/repair frequency (more frequent component replacement/repair). In Exhibit 7, the routine maintenance costs are similar for 6 and 12 cold starts because the increase in costs from the reference year (1 cold start) are due to additional scheduled inspections, which remain constant at the higher number of cold starts. Therefore, the inspection costs do not increase with increasing cold starts beyond 6 per year. Further, the annual routine maintenance and inspection costs for susceptible components are essentially equal to the periodic major repair/replacement cost at the higher end of the replacement frequency range.
The startup fuel costs are less than 10% of either the routine or periodic maintenance costs. Therefore, the startup fuel costs do not contribute significantly to the annual costs associated with increasing the number of unit starts and stops.
Impact of Load Following on the Economics of Existing Coal-fired Power Plant Operation
16
Exhibit 6: Routine/Periodic Maintenance and Startup Fuel Costs as Functions of Cold Start Frequency
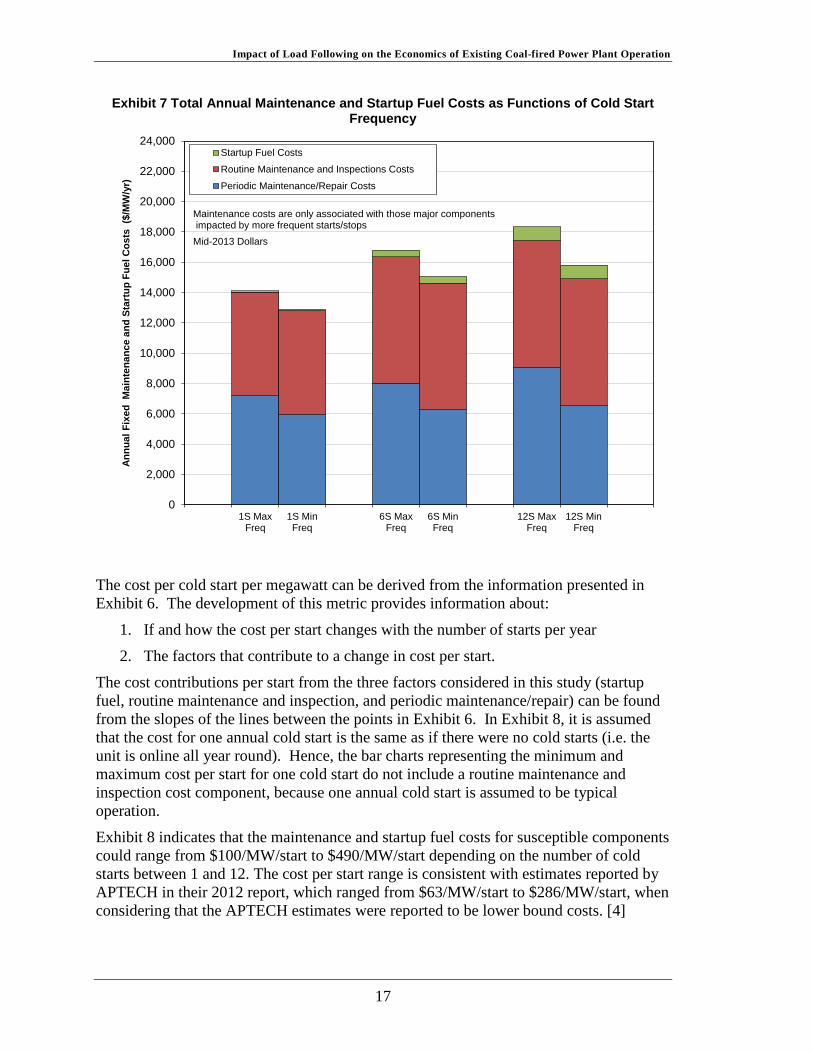
The total annual periodic replacement/major maintenance and routine costs for susceptible components and startup fuel costs, on a per megawatt basis, are shown in Exhibit 7. This figure combines the individual costs at each number of starts per year presented in Exhibit 6. Based on the data, this combined cost could range from $12,800/MW/year for 1 annual cold start to $18,340/MW/year for 12 annual cold starts, a 43% cost increase. The total costs in Exhibit 7 represent approximately 20% of the typical annual fixed O&M costs.
0
1,000
2,000
3,000
4,000
5,000
6,000
7,000
8,000
9,000
10,000
0 2 4 6 8 10 12 14
Annu
al M
aint
enan
ce a
nd S
tart
up F
uel C
osts
($/M
W/y
ear)
Number of Starts per Year
Routine Maintenance and Inspection
Fuel
Periodic Maintenance/Repair (Maximum Replacement Frequency)
Periodic Maintenance/Repair (Minimum Replacement Frequency)Maintenance costs are only associated with those major components impacted by more frequent starts/stops.
Mid-$2013 Dollars
Startup fuel costs include:• Fuel to heat the unit after shutdown• Increased heat rate, by 0.44%, during first week of generation after
startup
Impact of Load Following on the Economics of Existing Coal-fired Power Plant Operation
17
Exhibit 7 Total Annual Maintenance and Startup Fuel Costs as Functions of Cold Start Frequency
The cost per cold start per megawatt can be derived from the information presented in Exhibit 6. The development of this metric provides information about:
1. If and how the cost per start changes with the number of starts per year
2. The factors that contribute to a change in cost per start.
The cost contributions per start from the three factors considered in this study (startup fuel, routine maintenance and inspection, and periodic maintenance/repair) can be found from the slopes of the lines between the points in Exhibit 6. In Exhibit 8, it is assumed that the cost for one annual cold start is the same as if there were no cold starts (i.e. the unit is online all year round). Hence, the bar charts representing the minimum and maximum cost per start for one cold start do not include a routine maintenance and inspection cost component, because one annual cold start is assumed to be typical operation.
Exhibit 8 indicates that the maintenance and startup fuel costs for susceptible components could range from $100/MW/start to $490/MW/start depending on the number of cold starts between 1 and 12. The cost per start range is consistent with estimates reported by APTECH in their 2012 report, which ranged from $63/MW/start to $286/MW/start, when considering that the APTECH estimates were reported to be lower bound costs. [4]
0
2,000
4,000
6,000
8,000
10,000
12,000
14,000
16,000
18,000
20,000
22,000
24,000
1S MaxFreq
1S MinFreq
6S MaxFreq
6S MinFreq
12S MaxFreq
12S MinFreq
Annu
al F
ixed
Mai
nten
ance
and
Sta
rtup
Fue
l Cos
ts (
$/M
W/y
r)
Startup Fuel Costs
Routine Maintenance and Inspections Costs
Periodic Maintenance/Repair Costs
Maintenance costs are only associated with those major componentsimpacted by more frequent starts/stops
Mid-2013 Dollars

Impact of Load Following on the Economics of Existing Coal-fired Power Plant Operation
18
From 1 to 6 starts, there can be as large as a 390% increase in the cost per start, while from 1 to 12 starts, there can be as large as a 275% increase in the costs per start. This cost per start decrease from 6 cold starts to 12 cold starts per year is primarily due to the fact that the routine maintenance and inspection cost is similar for 6 and 12 cold starts.
Exhibit 8 Annual Maintenance Cost Annual Startup Fuel Costs per MW per Start
4.2 Total Fixed O&M Costs and Annual Startup Fuel Costs Exhibit 9 shows the estimated total annual fixed costs per megawatt. Besides the O&M and startup fuel costs for the susceptible components, this chart includes the plant “Other Fixed Costs”; that is, those costs associated with plant O&M that are not impacted by starts/stops.
These “Other Fixed Costs” shown in Exhibit 9 are those costs that are not impacted by unit shutdown frequency. These costs are obtained by subtracting the periodic/routine maintenance and startup fuel costs from the baseline (one annual shutdown) plant’s Total Fixed Operating Cost. [2] The annual periodic and routine maintenance costs for the susceptible components and startup fuel costs represent about 20 percent of the Total Fixed Operating cost. Further, increasing the number of cold starts/stops from 1 to 12 per year increases the Total Fixed Operating Cost by about 10%.
0
100
200
300
400
500
600
700
1S MaxFreq
1S MinFreq
6S MaxFreq
6S MinFreq
12S MaxFreq
12S MinFreq
Star
tup
Cos
ts p
er S
tart
($/S
tart
/MW
)
Startup Fuel CostsRoutine Maintenance and Inspections CostsPeriodic Maintenance/Repair Costs
Maintenance costs are only associated with those major componentsimpacted by more frequent starts/stops
Mid-2013 Dollars

Impact of Load Following on the Economics of Existing Coal-fired Power Plant Operation
19
Exhibit 9 Total Annual Fixed O&M and Startup Fuel Costs
5 Impacts of Starts/Stops on Cost of Electricity (COE) and CO2 Emissions
The following sections analyze the impact of more frequent starts and stops on the COE as a function of a plant’s capacity factor and load factors. A typical structure of the COE and contributing costs are:
• Capital (fixed) • Operating and Maintenance
o Fixed O&M Annual operating labor Maintenance labor including inspections (included in this
analysis) Administrative and support labor Property taxes and insurance Maintenance materials and some replacement equipment
(included in this analysis) Startup fuel costs (included in this analysis)
o Variable O&M Fuel Chemicals Water
0
10,000
20,000
30,000
40,000
50,000
60,000
70,000
80,000
90,000
100,000
1S MaxFreq
1S MinFreq
6S MaxFreq
6S MinFreq
12S MaxFreq
12S MinFreq
Tota
l Ann
ual F
ixed
O&
M C
osts
($/M
W/y
r)
Startup Fuel CostsRoutine Maintenance and Inspections CostsPeriodic Maintenance/Repair CostsOther Fixed Costs
Mid-2013 Dollars
Reference Total Fixed O&M Costs
Impact of Load Following on the Economics of Existing Coal-fired Power Plant Operation
20
For these analyses, the assumption is made that the capital costs are completely paid off and are no longer considered part of the COE calculation. In this case, the only remaining costs are the O&M and fuel costs. Components of particular interest to the impact of cold starts are bolded in the above list.
The annual capacity factor, the ratio of a plant’s annual generation to the plant’s generation if it runs at 100 percent capacity for one year, can be varied by either reducing the plant’s number of operating hours, operating at a reduced power output (lower load factor), or a combination of both. The load factor is defined as the ratio of the plant’s actual power output to the design full load power output. The COE is also impacted by the load factor in that the heat rate for a pulverized coal-fired power plant (and therefore the fuel cost) varies with load factor.
In addition, the reduced operation expected for existing coal-fired power generators will result in a decrease in their annual CO2 emissions.
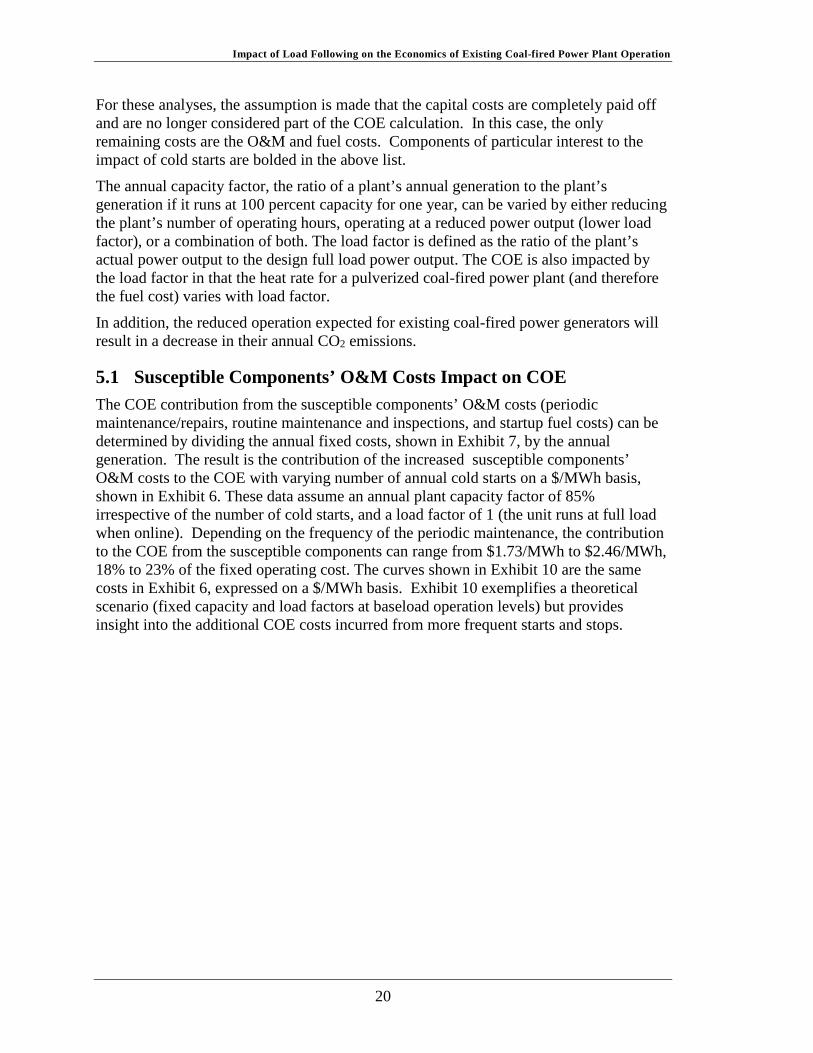
5.1 Susceptible Components’ O&M Costs Impact on COE The COE contribution from the susceptible components’ O&M costs (periodic maintenance/repairs, routine maintenance and inspections, and startup fuel costs) can be determined by dividing the annual fixed costs, shown in Exhibit 7, by the annual generation. The result is the contribution of the increased susceptible components’ O&M costs to the COE with varying number of annual cold starts on a $/MWh basis, shown in Exhibit 6. These data assume an annual plant capacity factor of 85% irrespective of the number of cold starts, and a load factor of 1 (the unit runs at full load when online). Depending on the frequency of the periodic maintenance, the contribution to the COE from the susceptible components can range from $1.73/MWh to $2.46/MWh, 18% to 23% of the fixed operating cost. The curves shown in Exhibit 10 are the same costs in Exhibit 6, expressed on a $/MWh basis. Exhibit 10 exemplifies a theoretical scenario (fixed capacity and load factors at baseload operation levels) but provides insight into the additional COE costs incurred from more frequent starts and stops.
Impact of Load Following on the Economics of Existing Coal-fired Power Plant Operation
21
Exhibit 10 Routine and Periodic Maintenance Costs of Susceptible Components and Startup Fuel Costs
5.2 Impact of Decreasing Capacity Factor by Increasing Downtime
Exhibit 11 considers only the susceptible components’ O&M and startup fuel costs, and evaluates how that portion of the COE changes as a function of cold starts and stops, thereby resulting in a change in annual operating hours. . The costs presented in Exhibit 11 also vary as functions of the number of cold starts (1, 6, or 12), and maintenance frequency.
Exhibit 11 also shows that the susceptible components’ O&M and startup fuel costs increase as the number of starts/stops per year increases for all capacity factors. This increase is observed by the curves shifting upwards with increasing cold starts. For example, the susceptible components and startup fuel costs at 85 percent capacity factor, for 1 cold start per year (maximum frequency curve), is $1.89/MWh. If the capacity factor is reduced to 45 percent (3,942 hours per year) by shutting the unit down once a year, the COE contribution becomes $3.58/MWh, almost a 90 percent increase. However, if the number of cold starts is increased to 6 per year for the same 45 percent capacity factor, the COE contribution increases to $4.26/MWh, an additional 19 percent over the 1 cold start case.
0.0
0.5
1.0
1.5
2.0
2.5
3.0
0 2 4 6 8 10 12 14
Mai
nten
ance
and
Sta
rtup
Fue
l Cos
ts ($
/MW
h)
Number of Starts per Year
Max Replacement Freq
Min Replacement Freq
Capacity Factor = 85% for all Cases
Maintenance costs are only associated with those major componentsimpacted by more frequent starts/stops. Does not include other fixed costs.
Mid-2013 Dollars

Impact of Load Following on the Economics of Existing Coal-fired Power Plant Operation
22
Exhibit 11 Maintenance and Startup Costs as a Function of Capacity Factor for a Range of Annual Starts and Stops
5.3 Impact of Decreased Load Factor on Heat Rate and Fuel Costs
As stated before, the capacity factor can also be reduced by running the unit at partial capacity; that is, at a lower load factor. A reduction in load factor increases the unit’s heat rate, which will increase the fuel costs, thus increasing the COE.
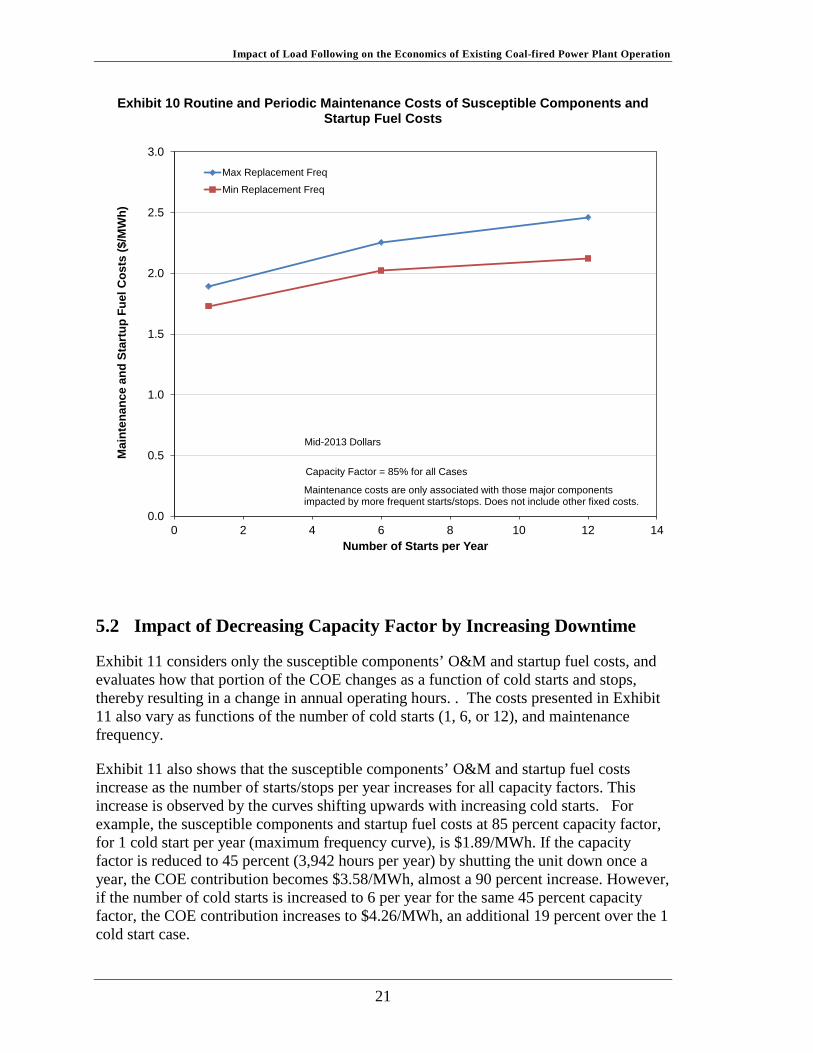
Exhibit 12 illustrates the heat rate change as the load factor is reduced. In this exhibit, the nominal heat rate at 100 percent load factor is assumed to be 10,000 Btu/kWh. The range of values at a given load factor is provided to illustrate the variation related to the plant configuration including the condenser pressure and plant condition or age.
As shown, operating at a load factors as high as 55 to 60 percent can result in a 5 percent increase in heat rate (from 10,000 to 10,500 Btu/kWh) while operating at lower load factors – 33 to 42 percent – can result in a 10 percent increase in heat rate. It is common for coal-fired generators to have minimum operating load factors of 30 or 40 percent, although some utilities are retrofitting their plants to go even lower.
0.0
1.0
2.0
3.0
4.0
5.0
6.0
7.0
8.0
0% 10% 20% 30% 40% 50% 60% 70% 80% 90% 100%
Mai
nten
ance
and
Sta
rtup
Fue
l Cos
ts ($
/MW
h)
Capacity Factor
1S Max Freq1S Min Freq6S Max Freq6S Min Freq12S Max Freq12S Min Freq
Decrease in Capacity Factor Related Reduced Operating Time
Increased COE from Reduced Capacity Factor
Increased COE from Additional Starts/Stops
Maintenance costs only associated with those major components impacted by more frequent starts/stops. Does not include other fixed costs.Plant operated at 100% load factor
Mid-2013 Dollars
Impact of Load Following on the Economics of Existing Coal-fired Power Plant Operation
23
Exhibit 12 Change in Heat Rate as a Function of Load Factor8
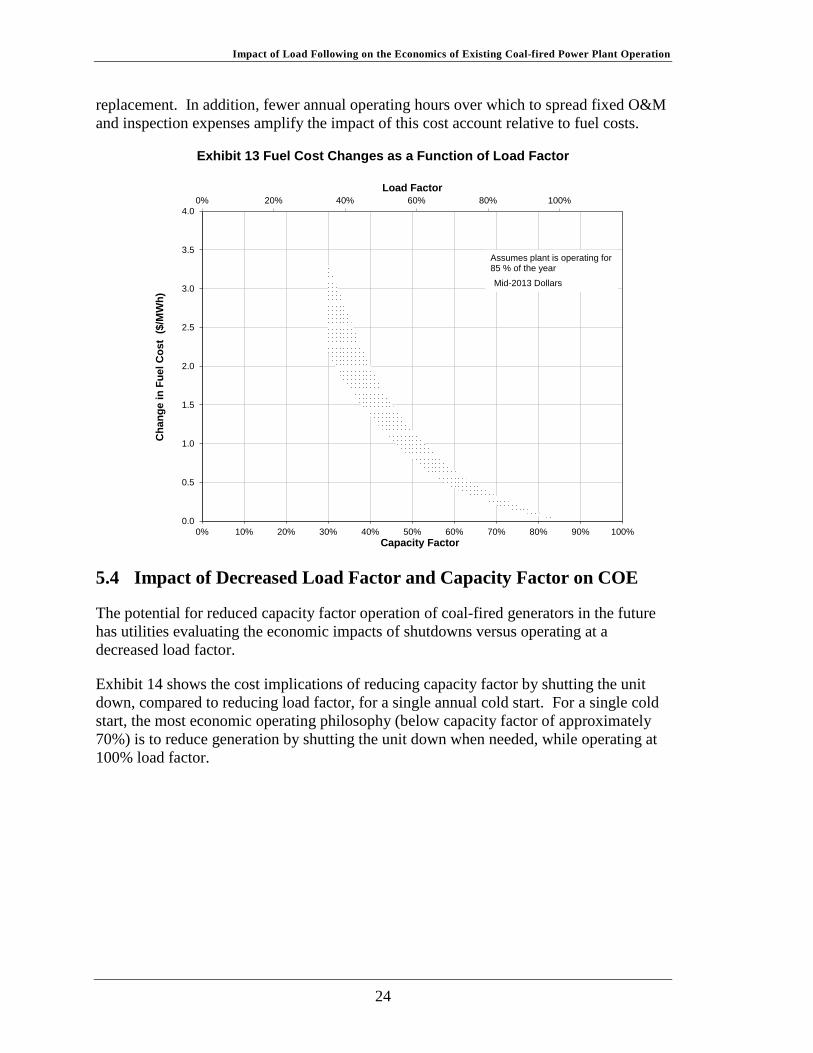
Exhibit 13 shows the impact of a reduction in load factor on the fuel cost portion of COE (due to increased heat rate, as shown in Exhibit 12) for a single cold start. Exhibit 13 shows that at lower load factors, the fuel cost portion of COE increases. For example, reducing the load factor from 100 to 70 percent (which effects a reduction in capacity factor from 85 percent to 60 percent) corresponds to a $0.55/MWh increase in the COE due to greater fuel requirements. This represents a 2.3% increase in fuel costs9. If the plant is instead required to operate at a capacity factor of 50 percent by reducing load (about 58 percent load factor), the fuel cost portion of the COE from the additional fuel cost increases to $1.00/MWh (on average), a 4.2% increase in fuel costs. Exhibit 13 reinforces that the fuel cost impact of operating at reduced load factor (due to adverse heat rate impacts) is minimal. The more significant cost implication is due to increased wear on mechanical components, which may require more frequent inspection, repair, or
8 Curve based on WorleyParsons’ engineering analysis of an 600 MW plant for a commercial client 9 Using the fuel price, heat rate, and capacity factor assumptions presented in Exhibit 5, the fuel cost portion of the base plant COE in this analysis is $23.50/MWh.
0
200
400
600
800
1,000
1,200
1,400
1,600
1,800
2,000
0% 20% 40% 60% 80% 100% 120%
Cha
nge
in H
eat R
ate
(Btu
/kW
h)
Load Factor
Nominal Heat Rate at 100% Load Factor: 10,000 Btu/kWh
Impact of Load Following on the Economics of Existing Coal-fired Power Plant Operation
24
replacement. In addition, fewer annual operating hours over which to spread fixed O&M and inspection expenses amplify the impact of this cost account relative to fuel costs.
Exhibit 13 Fuel Cost Changes as a Function of Load Factor
5.4 Impact of Decreased Load Factor and Capacity Factor on COE
The potential for reduced capacity factor operation of coal-fired generators in the future has utilities evaluating the economic impacts of shutdowns versus operating at a decreased load factor.
Exhibit 14 shows the cost implications of reducing capacity factor by shutting the unit down, compared to reducing load factor, for a single annual cold start. For a single cold start, the most economic operating philosophy (below capacity factor of approximately 70%) is to reduce generation by shutting the unit down when needed, while operating at 100% load factor.
0% 20% 40% 60% 80% 100%
0.0
0.5
1.0
1.5
2.0
2.5
3.0
3.5
4.0
0% 10% 20% 30% 40% 50% 60% 70% 80% 90% 100%
Load Factor
Cha
nge
in F
uel C
ost
($/M
Wh)
Capacity Factor
Assumes plant is operating for 85 % of the yearMid-2013 Dollars
Impact of Load Following on the Economics of Existing Coal-fired Power Plant Operation
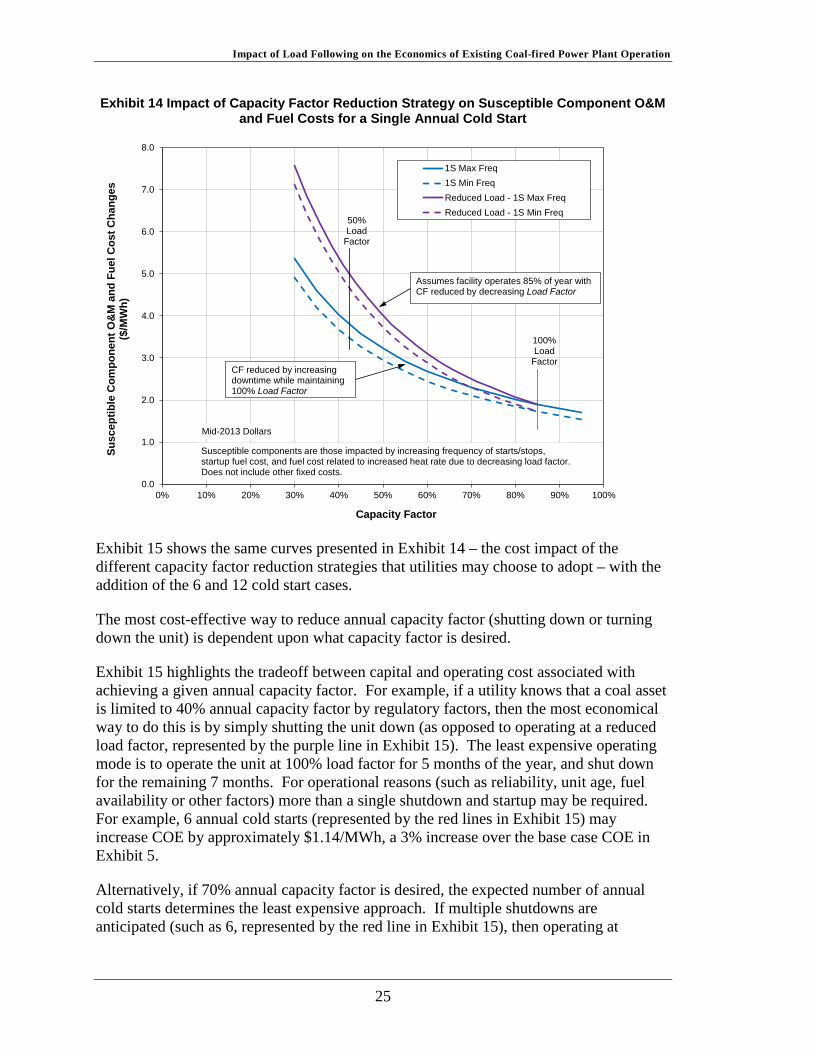
25
Exhibit 14 Impact of Capacity Factor Reduction Strategy on Susceptible Component O&M and Fuel Costs for a Single Annual Cold Start
Exhibit 15 shows the same curves presented in Exhibit 14 – the cost impact of the different capacity factor reduction strategies that utilities may choose to adopt – with the addition of the 6 and 12 cold start cases.
The most cost-effective way to reduce annual capacity factor (shutting down or turning down the unit) is dependent upon what capacity factor is desired.
Exhibit 15 highlights the tradeoff between capital and operating cost associated with achieving a given annual capacity factor. For example, if a utility knows that a coal asset is limited to 40% annual capacity factor by regulatory factors, then the most economical way to do this is by simply shutting the unit down (as opposed to operating at a reduced load factor, represented by the purple line in Exhibit 15). The least expensive operating mode is to operate the unit at 100% load factor for 5 months of the year, and shut down for the remaining 7 months. For operational reasons (such as reliability, unit age, fuel availability or other factors) more than a single shutdown and startup may be required. For example, 6 annual cold starts (represented by the red lines in Exhibit 15) may increase COE by approximately $1.14/MWh, a 3% increase over the base case COE in Exhibit 5.
Alternatively, if 70% annual capacity factor is desired, the expected number of annual cold starts determines the least expensive approach. If multiple shutdowns are anticipated (such as 6, represented by the red line in Exhibit 15), then operating at
0.0
1.0
2.0
3.0
4.0
5.0
6.0
7.0
8.0
0% 10% 20% 30% 40% 50% 60% 70% 80% 90% 100%
Susc
eptib
le C
ompo
nent
O&
M a
nd F
uel C
ost C
hang
es
($/M
Wh)
Capacity Factor
1S Max Freq1S Min FreqReduced Load - 1S Max FreqReduced Load - 1S Min Freq
100% Load
Factor
50% Load
Factor
Assumes facility operates 85% of year with CF reduced by decreasing Load Factor
CF reduced by increasing downtime while maintaining 100% Load Factor
Susceptible components are those impacted by increasing frequency of starts/stops, startup fuel cost, and fuel cost related to increased heat rate due to decreasing load factor. Does not include other fixed costs.
Mid-2013 Dollars

Impact of Load Following on the Economics of Existing Coal-fired Power Plant Operation
26
reduced load factor (purple line in Exhibit 15) may be the most economic mode of operation.
Exhibit 15 Impact of Capacity Factor Reduction Strategy on Susceptible Component O&M and Fuel Costs for Multiple Cold Starts
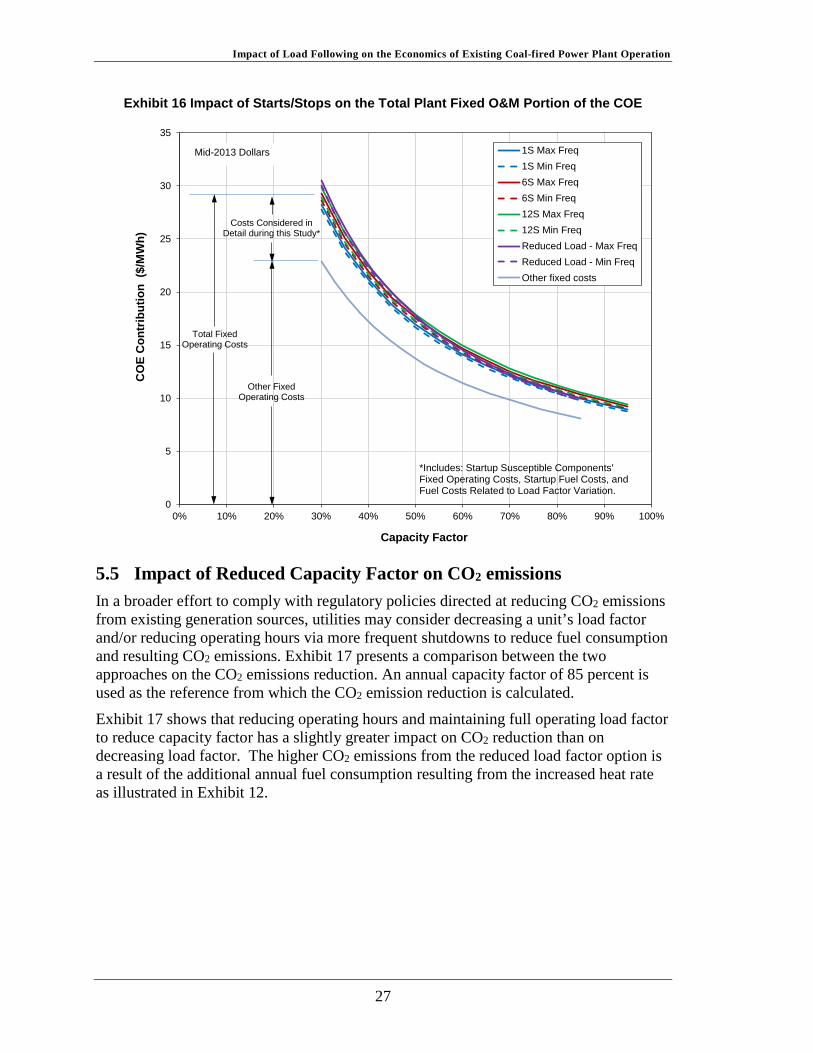
Exhibit 16 shows the total fixed O&M (O&M of susceptible components and other fixed costs), plus incremental fuel resulting from operating the unit at reduced load factor. The most significant impact on COE is by operating the unit at reduced capacity factor, regardless of whether the reduction was achieved by cold starts or a decrease in load factor. This is supported by the tight cost band due to cold starts and load factor reduction (represented by the area between the purple line and dark blue line in Exhibit 16) across the entire spectrum of capacity factors considered. Since cold starts and load factor reduction do not significantly impact operating and fuel costs (as shown in Exhibit 16), the dominant factor of the COE increase is the reduction in generation. The reduced generation amplifies the cost impact of fixed costs, as the fixed costs remain the same but are spread out over a more limited number of kilowatt-hours.
0.00
1.00
2.00
3.00
4.00
5.00
6.00
7.00
8.00
0% 10% 20% 30% 40% 50% 60% 70% 80% 90% 100%
CO
E fr
om S
tart
up
Cos
ts a
nd In
crea
sed
Hea
t Rat
e($/
MW
h)
Capacity Factor
1S Max Freq1S Min Freq6S Max Freq6S Min Freq12S Max Freq12S Min FreqReduced Load - 1S Max FreqReduced Load - 1S Min Freq
CF reduced by increasing downtime while maintaining 100% Load Factor
Operates 85% of the time with CF reduced by decreasing Load Factor
COE associated only with major components whose maintenance cost is impactedby increasing frequency of starts/stops and fuel cost related to increased heat rate due todecreasing load factor. Does not include other fixed costs.
Mid-2013 Dollars
Impact of Load Following on the Economics of Existing Coal-fired Power Plant Operation
27
Exhibit 16 Impact of Starts/Stops on the Total Plant Fixed O&M Portion of the COE
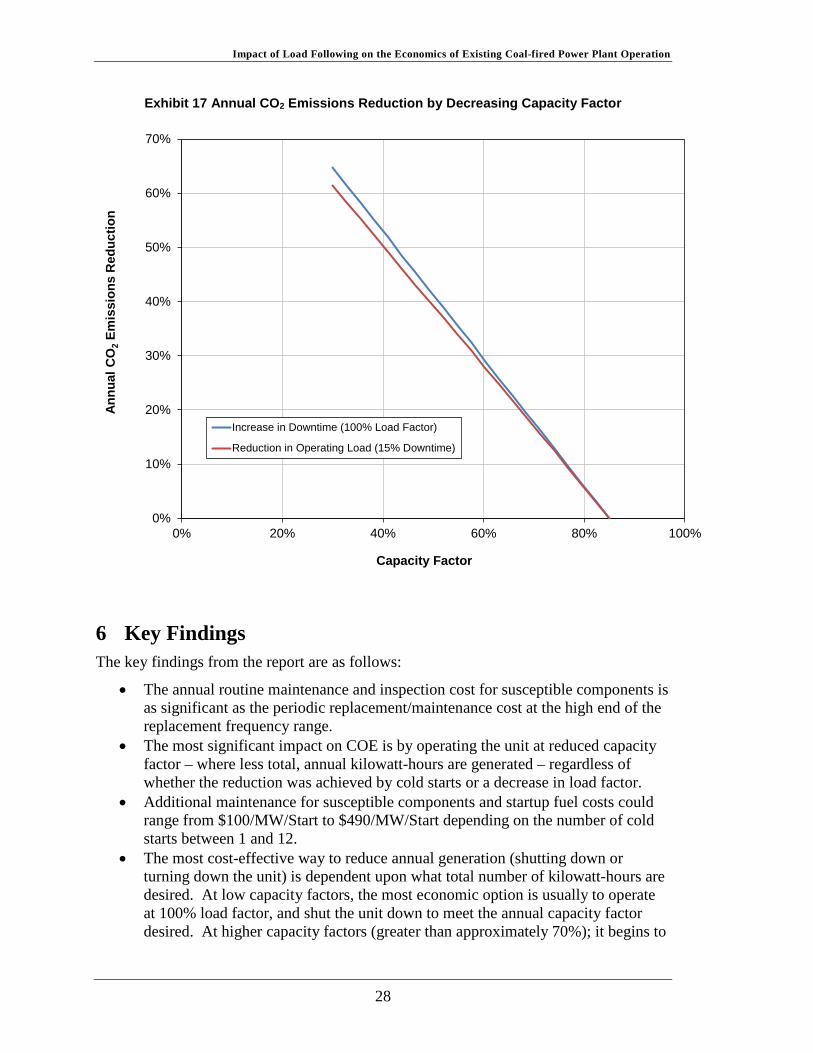
5.5 Impact of Reduced Capacity Factor on CO2 emissions In a broader effort to comply with regulatory policies directed at reducing CO2 emissions from existing generation sources, utilities may consider decreasing a unit’s load factor and/or reducing operating hours via more frequent shutdowns to reduce fuel consumption and resulting CO2 emissions. Exhibit 17 presents a comparison between the two approaches on the CO2 emissions reduction. An annual capacity factor of 85 percent is used as the reference from which the CO2 emission reduction is calculated.
Exhibit 17 shows that reducing operating hours and maintaining full operating load factor to reduce capacity factor has a slightly greater impact on CO2 reduction than on decreasing load factor. The higher CO2 emissions from the reduced load factor option is a result of the additional annual fuel consumption resulting from the increased heat rate as illustrated in Exhibit 12.
0
5
10
15
20
25
30
35
0% 10% 20% 30% 40% 50% 60% 70% 80% 90% 100%
CO
E C
ontr
ibut
ion
($/M
Wh)
Capacity Factor
1S Max Freq1S Min Freq6S Max Freq6S Min Freq12S Max Freq12S Min FreqReduced Load - Max FreqReduced Load - Min FreqOther fixed costs
Other FixedOperating Costs
Costs Considered in Detail during this Study*
*Includes: Startup Susceptible Components' Fixed Operating Costs, Startup Fuel Costs, and Fuel Costs Related to Load Factor Variation.
Total FixedOperating Costs
Mid-2013 Dollars
Impact of Load Following on the Economics of Existing Coal-fired Power Plant Operation
28
Exhibit 17 Annual CO2 Emissions Reduction by Decreasing Capacity Factor
6 Key Findings The key findings from the report are as follows:
• The annual routine maintenance and inspection cost for susceptible components is as significant as the periodic replacement/maintenance cost at the high end of the replacement frequency range.
• The most significant impact on COE is by operating the unit at reduced capacity factor – where less total, annual kilowatt-hours are generated – regardless of whether the reduction was achieved by cold starts or a decrease in load factor.
• Additional maintenance for susceptible components and startup fuel costs could range from $100/MW/Start to $490/MW/Start depending on the number of cold starts between 1 and 12.
• The most cost-effective way to reduce annual generation (shutting down or turning down the unit) is dependent upon what total number of kilowatt-hours are desired. At low capacity factors, the most economic option is usually to operate at 100% load factor, and shut the unit down to meet the annual capacity factor desired. At higher capacity factors (greater than approximately 70%); it begins to
0%
10%
20%
30%
40%
50%
60%
70%
0% 20% 40% 60% 80% 100%
Annu
al C
O2
Emis
sion
s R
educ
tion
Capacity Factor
Increase in Downtime (100% Load Factor)
Reduction in Operating Load (15% Downtime)
Impact of Load Following on the Economics of Existing Coal-fired Power Plant Operation
29
be more economical to operate at reduced load factor, and shut down less frequently if possible.
• The contribution of startup susceptible component maintenance cost and startup fuel cost to COE is about 20% of the total fixed O&M cost.
• Increasing cold starts/stops from 1 to 6 or 12 per year increases the total fixed costs by about 10%.
Impact of Load Following on the Economics of Existing Coal-fired Power Plant Operation
30
7 References
1 Lefton, S.A., Hilleman, D.D. (2011). Make Your Plant Ready for Cycling Operations, Coal Power Magazine, August 2011. 2 Lefton, S.A., Besuner, P.M. (2006). The Cost of Cycling Coal Fired Power Plants, Coal Power Magazine, 2006: 16-20. 3 Myles, P., Herron, S. (2012). Impact of Load Following on Power Plant Cost and Performance: Literature Review and Industry Interviews, October 1st, 2012. 4 Kumar, N., Besuner, P.M., Lefton, S.A., Agan, D.D., Hilleman, D.D. (2012). Power Plant Cycling Costs, NREL/SR-5500-55433. Work performed by Intertek-APTECH, Sunnyvale, California. Golden, CO: NREL. 5 National Energy Technology Laboratory (NETL). (2010). Cost and Performance Baseline for Fossil Energy Plants Volume 1: Bituminous Coal and Natural Gas to Electricity. DOE/NETL-2010/1397, Pittsburgh, Pennsylvania.