office market northern virginia - cresacresa.com/webfiles/dc/research/va market report q2...
TRANSCRIPT

1 | Northern Virginia | Offiice Market | Q2 2016
Office Market NORTHERN VIRGINIAQ2 2016
Federal Move Outs Throttle Occupancy Gains
Executive Summary
Technology tenants continued to expand their presence in Q2 2016,
signing five of the largest new leases totaling roughly 328K SF. Of note,
ScienceLogic took 62K SF in Reston, Opower finalized its new HQ lease
taking 45K SF at 2311 Wilson Blvd., and Amazon leased 52K SF in
Ballston. Rosslyn was popular among shared office concepts as Regus
took another 50K SF at 1101 Wilson Blvd., and Eastern Foundry signed a
19K SF lease at 1100 Wilson Blvd.
Although the tenant base in Northern Virginia is slowly diversifying, ongoing
contraction by the Federal government offset the occupancy gains in Q2
as five agencies vacated roughly 375K SF of space throughout the market.
Among those, the Environmental Protection Agency and the Federal
Supply Service consolidated and gave back roughly 250K SF of space
to the market. Despite sluggish fundamentals, investment sales activity is
robust, particularly outside the beltway along Metro’s Silver Line.
2007 2008 2009 2010 2011 2012 2013 2014 2015 2016
8%
10%
12%
14%
16%
18%
20%
22%
-2.5 M
-2.0 M
-1.5 M
-1.0 M
-0.5 M
0.0 M
0.5 M
1.0 M
1.5 M
2007 2008 2009 2010 2011 2012 2013 2014 2015 2016
Average Vacancy Rate
Net Absorption
Economy
Northern Virginia outperforms MSA employment growth
Year-over-year employment growth in Northern Virginia fell in April 2016,
after four months of growth. Despite the down month, NoVA’s April
annualized job growth of 32,900 represents 46% of jobs added by the
MSA as a whole. NoVA also saw continued reduction in its unemployment
rate, which fell to 2.8%, the lowest level achieved in eight years.
Nationally, the economy is stabilizing following years of slow post-
recessionary recovery growth. The annualized national employment
growth rate (1.86%) has been on a gradual decline since January 2015,
and the unemployment rate has arrested at 5%. Despite a down month,
NoVa’s employment growth rate had been trending upward for the last
$28.50
$29.00
$29.50
$30.00
$30.50
$31.00
$31.50
$32.00
$32.50
$33.00
2007 2008 2009 2010 2011 2012 2013 2014 2015 2016
Average Asking Rent
Q2 Key Market Indicators
Total Vacancy
Net Absorption
Rental Rate
New Deliveries
YoYΔ Q2
20.0%
34,241 SF
$31.54
82,500 SF
2 | Northern Virginia | Offiice Market | Q2 2016
24 months, and has surpassed the national rate for the last 12 months.
Looking under the lens of office-use employment sector growth, NoVA
has been underachieving relative to national growth rates. NoVA is
only outperforming national growth in Membership Associations and
Organizations (3.4% NoVA to 1.0% USA) and State/Local Government
(1.1% NoVA to -1.7% USA).
Demand
Weak net demand despite increased activity
Tenant demand, influenced by Millennials in the workforce, is laser-
focused on Metro-accessible, amenity-rich product particularly along
the Silver Line. Along with Technology and financial services tenants,
there has been increased leasing activity from government contractors
due to a 5% and 3% increase in the DoD budget in 2016 and 2017,
respectively. However, traditionally strong submarkets located inside the
beltway, such as those in the R-B Corridor, have not seen a meaningful
reduction in vacancy since Sequestration in 2011. Crystal City is a
bright spot, but much of that demand has been generated by landlords
offering highly favorable concession packages and term buyouts. As
both government and businesses become more efficient with their real
estate footprint, space reductions upon renewal will persist into 2018.
Increasing concessions and public sector incentive packages are helping
to offset weakness in the leasing market, but greater economic expansion
in the private sector beyond current levels is necessary to drive down
vacancy. As new construction increases supply and weak demand keeps
vacancy rates in existing inventory elevated, tenants will continue to have
considerable leverage in lease negotiations.
Vacancy and Supply
New construction poses continued oversupply risk
After declining through much of 2015, Northern Virginia’s vacancy rate
has risen for the second consecutive quarter in 2016 and now stands
at 20.3%. Contrary to market-wide trends, where best-in-class assets
outperform commodity-driven properties, Class A vacancy has increased
to 21.7% compared to Class B vacancy, which has held relatively steady
and stands at 17.6%.
The level of new construction in Northern Virginia threatens to put further
pressure on the supply side given the lackluster absorption figures
since 2010. Preleasing in multi-tenant spec buildings has been slow,
as evidenced by the delivery of 1775 Tysons Boulevard in Q2 2016 only
40% leased. Commonly used preleasing figures take into consideration
owner-occupied projects such as the 975K SF Capital One HQ and the
340K SF MITRE building, but those projects were never available for lease
from the onset. Upon completion, Capital One in particular will vacate a
considerable amount of leased space in Northern Virginia, contributing to
increased vacancy and further weakness in the market.
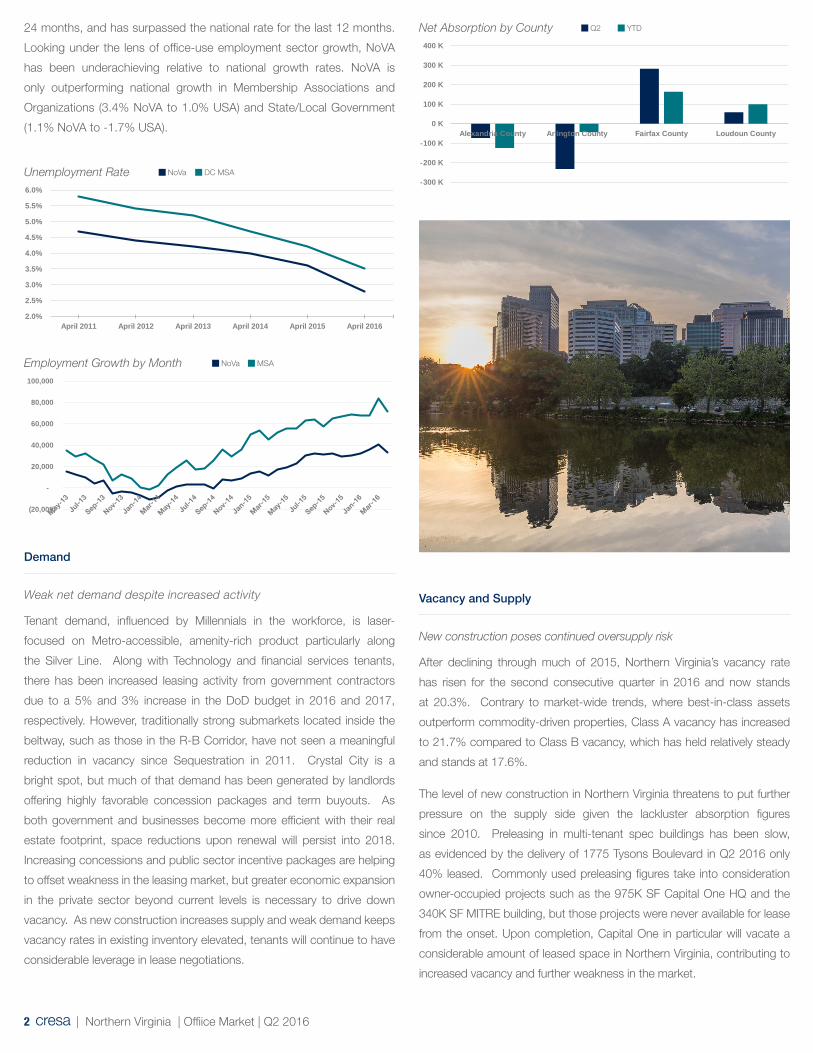
Net Absorption by County
Unemployment Rate NoVa
Employment Growth by Month NoVa
2.0%
2.5%
3.0%
3.5%
4.0%
4.5%
5.0%
5.5%
6.0%
April 2011 April 2012 April 2013 April 2014 April 2015 April 2016
DC MSA
(20,000)
-
20,000
40,000
60,000
80,000
100,000
MSA
-300 K
-200 K
-100 K
0 K
100 K
200 K
300 K
400 K
Alexandria County Arlington County Fairfax County Loudoun County
Q2 YTD

3 | Northern Virginia | Offiice Market | Q2 2016
Market Outlook
Consolidations by the Federal government and private companies
continue to throttle office market fundamentals. Overall job
creation is outpacing the national growth rate, but office-using
employment is slowing in key sectors necessary to facilitate
an improvement in occupancy rates. Demand remains muted
and hyper focused on a select number of product types and
submarkets, leaving much of Northern Virginia with a substantial
oversupply. Record concession packages are becoming the new
normal in order to win business, so tenants looking to reduce
occupancy costs have numerous options across all property
types and locations.
Building Submarket Size Sale Price Price (PSF) Buyer
1735 N Lynn Street Rosslyn 293,539 $106,500,000 $362.81 MeridianGroup
1110 N Glebe Road Ballston 233,929 $79,000,000 $337.71 NGP V
Management LLC
2000 N 14th StreetClarendon/Courthouse
114,843 $43,000,000 $374.42 Penzance
196 Van Buren Street Herndon 100,103 $22,132,157 $221.09 Goldman
Sachs
198 Van Buren Street Herndon 101,169 $22,367,843 $221.09 Goldman
Sachs
Tenant Submarket Size Type
GSA: TSA Pentagon City (2 locations) 551,916 Renewal
TEGNA Inc. Tysons Corner 70,227 Prelease
ManTech Route 28 South 59,958 Renewal
ScienceLogic Reston 33,743 New
Exostar LLC Herndon 28,388 New
Q2 Top Leases
Q2 Top Sales
Rental Rates
Record concessions mask falling rents
Asking rents for direct space decreased $0.06 from Q2 2015 to $31.64/
SF. Class A rents ticked down $0.29 to average $32.93 while Class B
rents fell $0.23 to $28.33/SF. Best-in-class assets in core submarkets are
commanding rents in the $50-55/SF range. Although rent growth been flat
to slightly negative since 2011, record concession packages have made
high-quality office space much more affordable for occupiers.
Muted touring activity combined with substantial oversupply has
caused landlords to become more aggressive to win business. In select
submarkets, tenant improvement allowances of $85-125/SF with 1.5-2
months of free rent per year of term have been achieved. In addition to TI
and abatement, it is becoming increasingly common for landlords to buy
out the existing lease liability in order to entice early relocations. Landlords
are very interested in keeping pro-forma rents stable so their property’s
valuation is not impacted by the soft market. Property values are directly
related to in-place cash flows and often do not take into consideration
concession dollars spent to get leases signed. This enables tenants
with considerable term remaining to take advantage of favorable market
conditions to lower occupancy costs.
4 | Northern Virginia | Offiice Market | Q2 2016
SubmarketTotal Bldgs
InventorySublet
AvailableTotal
AvailableTotal Vacant
Vacancy Rate
Net Absorption (Q2 2016)
Net Absorption
(YTD)
Class A Rent
Class B Rent
Total Direct Rent
Under Constr.
SF Delivered
YTD
TenantFavorable
Tysons Corner 151 23,234,620 602,008 6,674,872 4,947,585 21.3% 158,111 174,380 $35.19 $27.68 $31.62 816,913 -
Merrifield 81 7,409,554 141,916 1,758,939 1,263,974 17.1% (11,966) 140,968 $31.91 $28.40 $31.32 - -
Vienna 25 1,180,742 1,633 52,823 45,007 3.8% 3,398 5,397 n/a $22.15 $22.15 - -
Oakton 16 1,447,595 3,209 304,454 259,431 17.9% 6,720 (22,776) $29.12 $25.27 $27.40 - -
Fairfax Center 61 6,872,128 84,450 1,930,587 1,565,509 22.8% (11,755) (313,841) $28.54 $24.09 $26.69 - -
Fairfax City 103 3,878,285 13,978 608,484 566,207 14.6% 18,712 19,972 $21.76 $22.46 $22.41 - -
Reston 146 15,897,960 782,038 3,523,661 2,484,136 15.6% 69,240 96,180 $29.96 $23.42 $28.46 368,413 -
Herndon 125 11,240,908 413,463 2,889,587 1,334,947 20.8% 8,822 (444,684) $29.94 $22.06 $27.74 - -
Route 28 S 138 11,522,136 234,353 2,702,462 2,335,225 20.3% (336) 422,401 $26.30 $22.07 $24.77 - -
Springfield 118 5,716,541 144,693 1,541,615 1,172,218 2.5% 40,875 85,433 $37.87 $23.98 $31.14 - -
Fairfax County 964 88,400,469 2,421,741 21,987,484 15,974,239 18.0% 281,821 163,430 $30.65 $24.67 $28.63 1,185,326 -
Route 28 N 120 8,477,539 119,884 2,003,488 1,752,882 20.7% 27,188 21,133 $24.98 $21.39 $23.77 182,000 -
Route 7 49 2,384,064 60,589 532,607 375,541 15.8% (17,605) 13,659 $25.61 $26.25 $25.74 15,000 -
Leesburg 60 2,018,816 16,739 374,364 328,852 16.3% 49,148 64,753 $31.11 $25.41 $27.97 - 82,500
Loudoun 229 12,880,419 197,212 2,910,459 2,457,275 19.1% 58,731 99,545 $26.06 $22.92 $24.79 197,000 82,500
Rosslyn 38 9,457,035 592,553 3,302,874 2,598,091 27.5% (845) 61,682 $41.79 $38.62 $39.35 552,781 -
Clarendon/Courthouse 30 4,968,257 94,116 1,295,906 954,821 19.2% (32,863) (81,174) $44.26 $39.86 $43.03 - -
Virginia Square 10 882,929 38,016 249,516 90,397 10.2% 16,862 64,524 $41.89 $34.66 $39.73 - -
Ballston 34 7,748,212 103,649 2,666,275 1,642,257 21.2% (90,944) (164,189) $43.42 $37.64 $42.20 166,767 -
RB Corridor 112 23,056,433 828,334 7,514,571 5,285,566 22.9% (107,790) (119,157) $42.87 $38.41 $41.35 719,548 -
Crystal City 36 10,521,047 109,502 2,626,964 2,422,047 23.0% (124,793) (20,763) $30.70 $37.15 $38.58 - -
Arlington 166 35,969,819 1,007,803 11,061,232 8,257,018 23.0% (232,583) (139,920) $41.10 $36.85 $39.87 719,548 -
Old Town 123 7,110,408 215,893 1,491,624 1,054,942 14.8% (65,581) (106,953) $35.68 $30.84 $34.18 - -
Eisenhower Avenue 24 4,950,815 17,131 547,101 475,425 9.6% 40,988 66,971 $42.13 $24.71 $38.88 700,000 -
I-395 70 8,220,920 59,945 3,705,483 3,493,002 42.5% (49,135) (84,723) $31.19 $27.62 $30.22 - -
Alexandria 217 20,282,143 292,969 5,744,208 5,023,369 24.8% (73,728) (124,705) $35.43 $28.04 $33.72 700,000 -
Outside Beltway 1,193 101,280,888 2,618,953 24,897,943 18,431,514 18.2% 340,552 262,975 $30.06 $24.45 $28.14 1,382,326 82,500
Inside Beltway 383 56,251,962 1,300,772 16,805,440 13,280,387 23.6% (306,311) (264,625) $39.06 $33.67 $37.65 1,419,548 -
Total 1,738 162,258,305 4,435,808 42,873,759 32,415,676 20.0% 34,241 94,972 $33.27 $27.74 $31.54 2,801,874 82,500
Submarket Statistics
Cresa ©. All rights reserved.
Permission is hereby granted for internal distribution by Cresa business partners. Other reproduction by any means
in whole or part without written permission is prohibited. For additional information, please contact Will Wheaton,
Senior Research Manager, at 301.841.6533 or [email protected], or Matt Kruczlnicki, Research Analyst, at
301.951.6500 or [email protected].
Cresa Washington DC
1800 M Street, NW, Suite 350 S
Washington, DC 20036
202.628.0300
2 Bethesda Metro Center, Suite 900
Bethesda, Maryland 20814
301.951.6500
1751 Pennacle Drive, Suite 600
McLean, VA 22102
703.594.4628