off-balance-sheet activities
DESCRIPTION
Off-Balance-Sheet Activities. 陳秀蘭 楊雅智 翁明祥. Off-Balance-Sheet Activities. Outlines Definition, types How to be valued and effect on FIs Returns and Risks of OBS Activities Loan commitments Commercial letters of credit / Standby letters of credit When issued securities - PowerPoint PPT PresentationTRANSCRIPT
Off-Balance-Sheet Activities
陳秀蘭楊雅智翁明祥
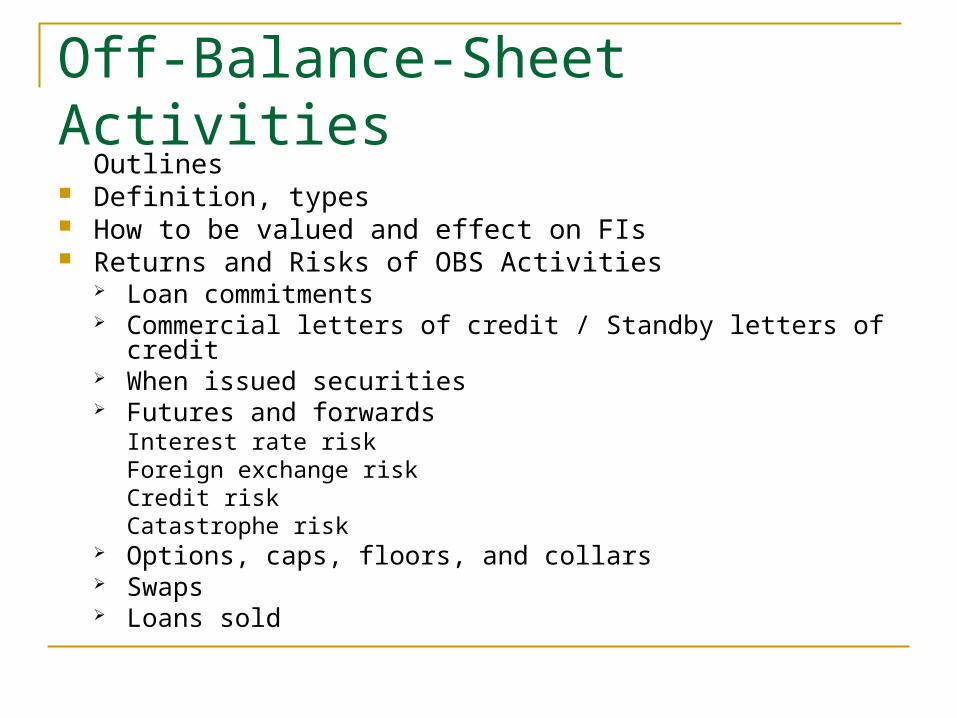
Outlines Definition, types How to be valued and effect on FIs Returns and Risks of OBS Activities
Loan commitments Commercial letters of credit / Standby letters of credit When issued securities Futures and forwards
Interest rate riskForeign exchange riskCredit riskCatastrophe risk
Options, caps, floors, and collars Swaps Loans sold
Off-Balance-Sheet Activities

Definition, types How to be valued and effect on FIs Dramatic growth and related regulations Returns and Risks of OBS Activities The Role of OBS Activities in Reducing Risk
Off-Balance-Sheet Activities

In accounting terms – appear below the bottom line, frequently just as footnotes to financial statements
In economic terms – contingent assets and liabilities that affect the future, rather than the current shape of as FI’s balance sheet
Off-Balance-Sheet Activities

Off-Balance-Sheet Activities
Off-Balance-Sheet Asset - Contingent Gain
- When an event occurs, this item moves onto the
asset side of the balance sheet. Off-Balance-Sheet Liability
- Contingent Loss
- When an event occurs, this item moves onto the
liability side of the balance sheet.
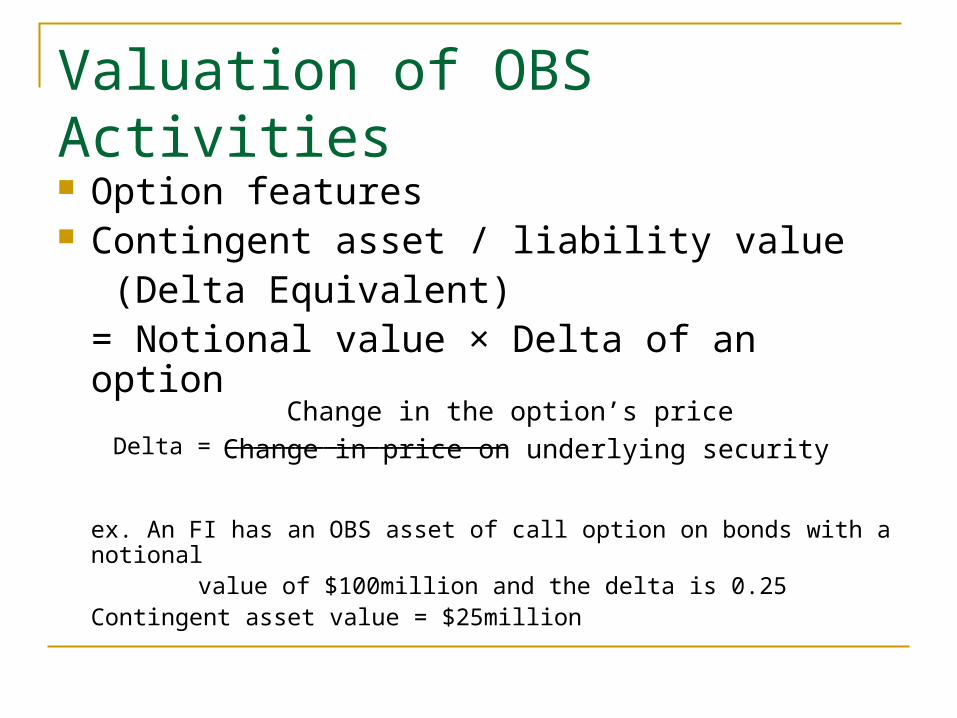
Valuation of OBS Activities
Option features Contingent asset / liability value
(Delta Equivalent)= Notional value × Delta of an option
Delta = ————————————————————
ex. An FI has an OBS asset of call option on bonds with a notional
value of $100million and the delta is 0.25Contingent asset value = $25million
Change in the option’s price
Change in price on underlying security
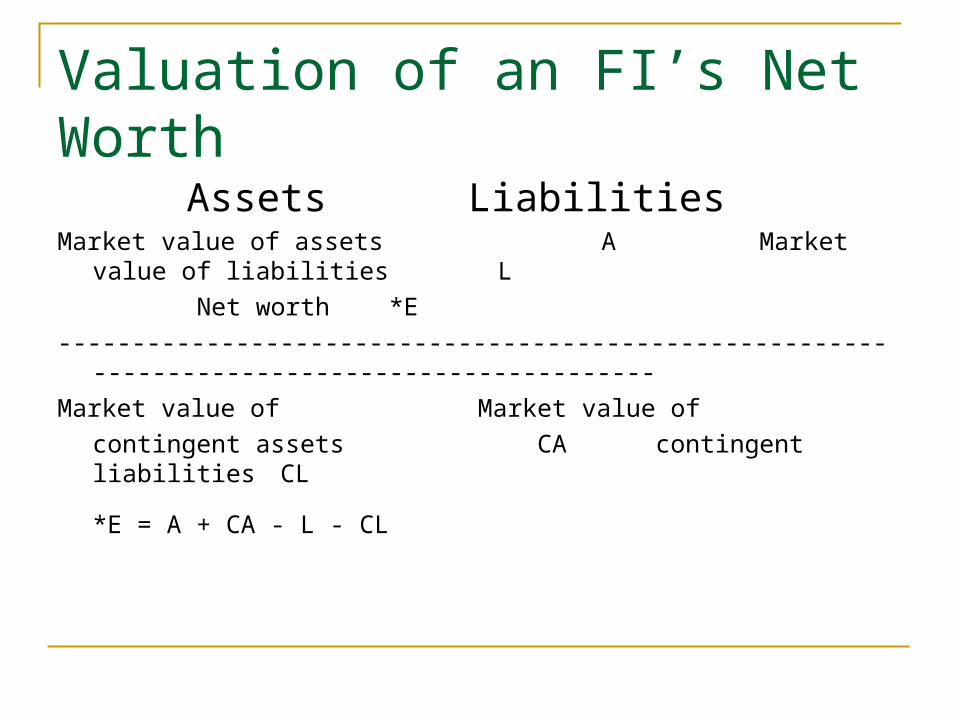
Valuation of an FI’s Net Worth
Assets LiabilitiesMarket value of assets A Market value of liabilities L
Net worth *E
----------------------------------------------------------------------------------------------
Market value of Market value of
contingent assets CA contingent liabilities CL
*E = A + CA - L - CL
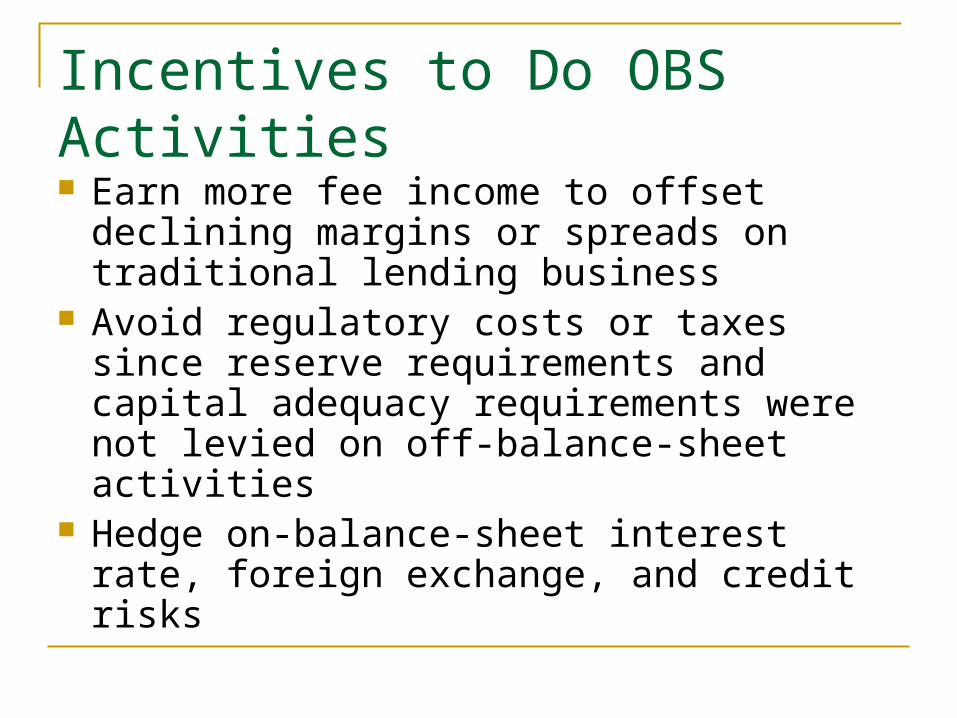
Incentives to Do OBS Activities Earn more fee income to offset declining
margins or spreads on traditional lending business
Avoid regulatory costs or taxes since reserve requirements and capital adequacy requirements were not levied on off-balance-sheet activities
Hedge on-balance-sheet interest rate, foreign exchange, and credit risks
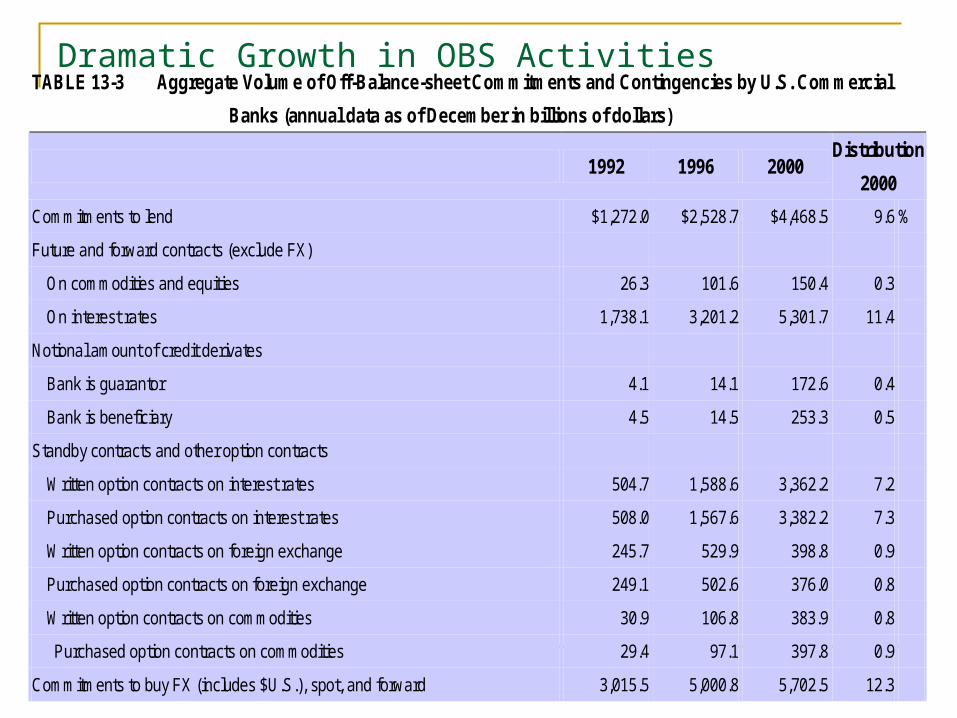
Dramatic Growth in OBS ActivitiesTABLE 13-3 Aggregate Volume of Off-Balance-sheet Commitments and Contingencies by U.S. Commercial
Banks (annual data as of December in billions of dollars)
1992 1996 2000 Distribution
2000
Commitments to lend $1,272.0 $2,528.7 $4,468.5 9.6 %
Future and forward contracts (exclude FX)
On commodities and equities 26.3 101.6 150.4 0.3
On interest rates 1,738.1 3,201.2 5,301.7 11.4
Notional amount of credit derivates
Bank is guarantor 4.1 14.1 172.6 0.4
Bank is beneficiary 4.5 14.5 253.3 0.5
Standby contracts and other option contracts
Written option contracts on interest rates 504.7 1,588.6 3,362.2 7.2
Purchased option contracts on interest rates 508.0 1,567.6 3,382.2 7.3
Written option contracts on foreign exchange 245.7 529.9 398.8 0.9
Purchased option contracts on foreign exchange 249.1 502.6 376.0 0.8
Written option contracts on commodities 30.9 106.8 383.9 0.8
Purchased option contracts on commodities 29.4 97.1 397.8 0.9
Commitments to buy FX (includes $U.S.), spot, and forward 3,015.5 5,000.8 5,702.5 12.3

Standby LCs and foreign office guarantees
To U.S. address 128.0 166.5 224.7 0.5
To non-U.S. address 34.5 44.5 51.6 0.1
(Amount of these items sold to other via participations) (14.9) (21.8) (26.9)
Commercial LCs 28.1 30.9 26.1 0.1
Participations in acceptances sold to others 0.8 1.2 0.4 0.0
Participations in acceptances bought from others 0.2 0.2 0.2 0.0
Securities borrowed 10.8 25.5 22.8 0.0
Securities lent 96.4 208.0 484.7 1.0
Other significant commitments and contingencies 8.7 14.0 12.1 0.0
Memoranda
Notional value of all outstanding interest rate swaps 2,122.0 7,069.4 20,918.5 45.0
Mortgages sold, with recourse
Outstanding principal balance of mortgages sold or swapped 10.7 11.4 402.0 0.9
Amount of recourse exposure on these mortgages 6.3 8.2 36.6 0.1
Total, including memoranda items $10,200.3 $22,833.3 $46,529.6 100.0 %
Total assets (on-balance-sheet items) $3,476.4 $4,578.3 $6,238.7
FX = Foreign exchange, LC = Letter of credit
Source: FDIC Statistics on Banking, various issues. www.fdic.gov
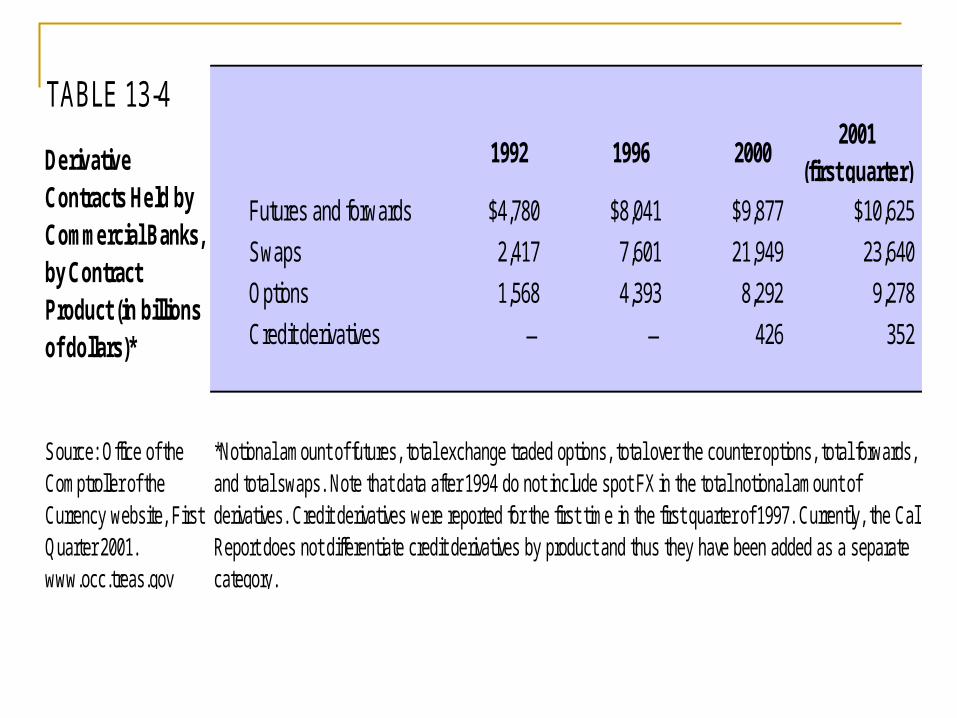
TABLE 13-4
1992 1996 20002001
(first quarter)
Futures and forwards $4,780 $8,041 $9,877 $10,625
Swaps 2,417 7,601 21,949 23,640
Options 1,568 4,393 8,292 9,278
Credit derivatives ─ ─ 426 352
Source: Office of theComptroller of theCurrency website, FirstQuarter 2001.www.occ.treas.gov
DerivativeContracts Held byCommercial Banks,by ContractProduct (in billionsof dollars)*
*Notional amount of futures, total exchange traded options, total over the counter options, total forwards,and total swaps. Note that data after 1994 do not include spot FX in the total notional amount ofderivatives. Credit derivatives were reported for the first time in the first quarter of 1997. Currently, the CallReport does not differentiate credit derivatives by product and thus they have been added as a separatecategory.
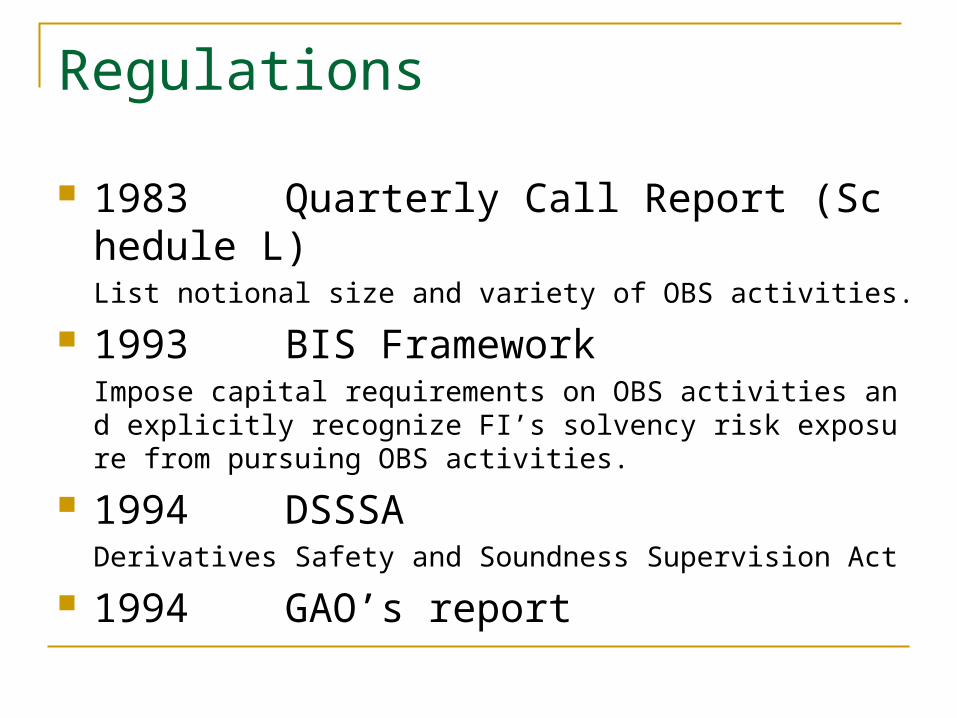
Regulations
1983 Quarterly Call Report (Schedule L)List notional size and variety of OBS activities.
1993 BIS FrameworkImpose capital requirements on OBS activities and explicitly recognize FI’s solvency risk exposure from pursuing OBS activities.
1994 DSSSADerivatives Safety and Soundness Supervision Act
1994 GAO’s report
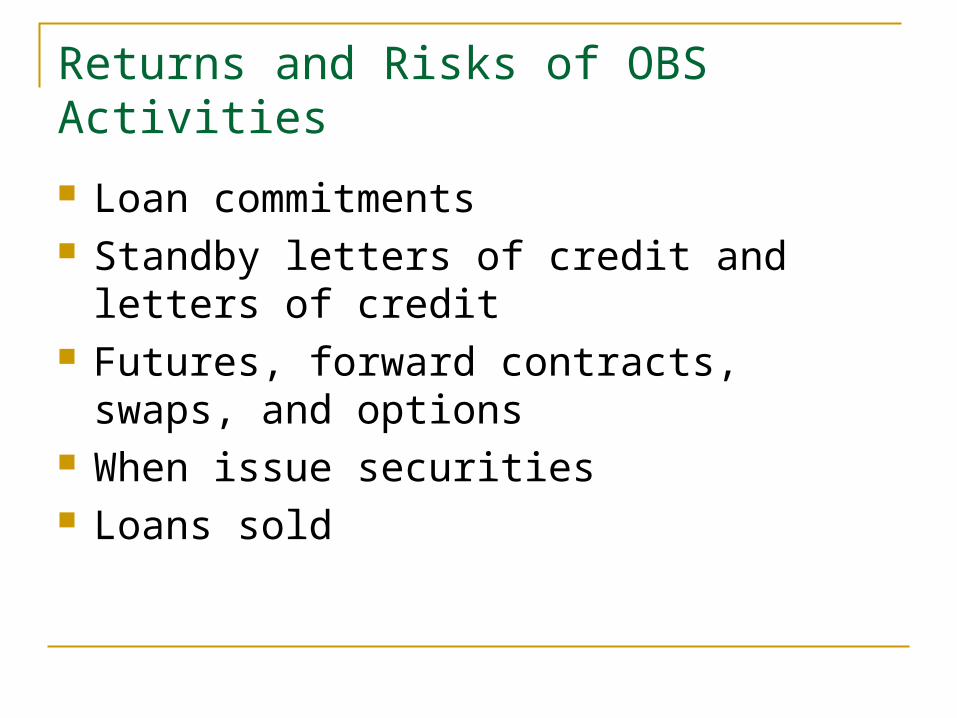
Returns and Risks of OBS Activities
Loan commitments Standby letters of credit and letters of credit Futures, forward contracts, swaps, and
options When issue securities Loans sold

Loan Commitments
A certain maximum amount, at given interest rate terms, in a period of time
Up-front Fee Back-end Fee Example Maximum amount = $10million
BR = Interest on the loan = 12%m = Risk premium = 2% t = Expected takedown rate = 75%f1 = Up-front fee = 0.125% ( of $10million )f2 = Back-end fee = 0.25% ( of $2.5million )b = Compensating balance = 10%R = Reserve requirements = 10%
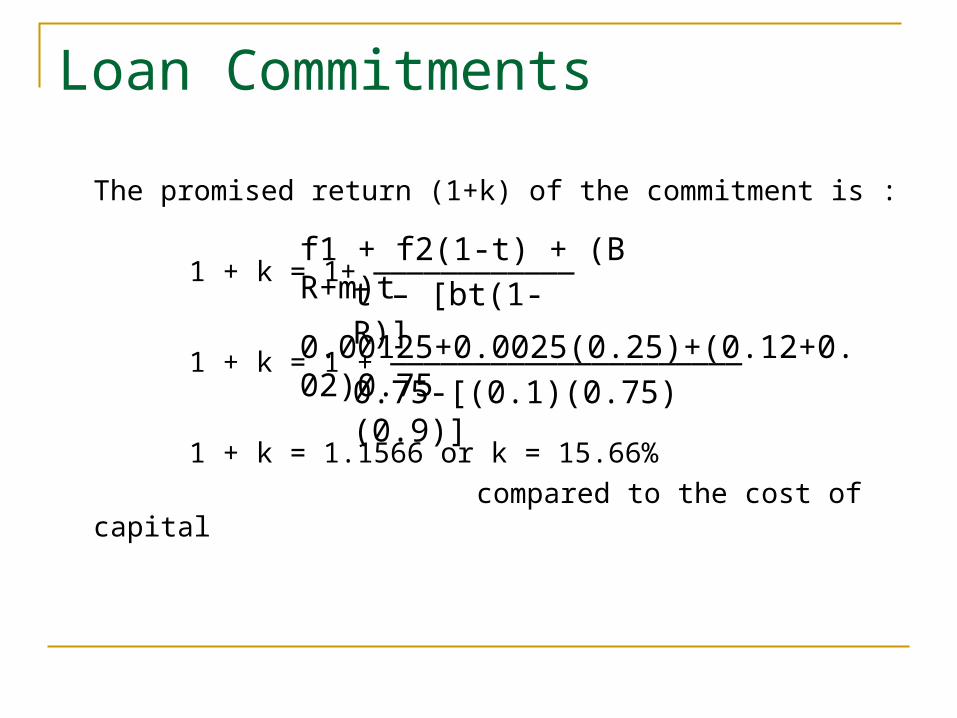
Loan Commitments
The promised return (1+k) of the commitment is :
1 + k = 1+ ————————————
1 + k = 1 + —————————————————————
1 + k = 1.1566 or k = 15.66%
compared to the cost of capital
f1 + f2(1-t) + (BR+m)t
t – [bt(1-R)]
0.00125+0.0025(0.25)+(0.12+0.02)0.75
0.75-[(0.1)(0.75)(0.9)]
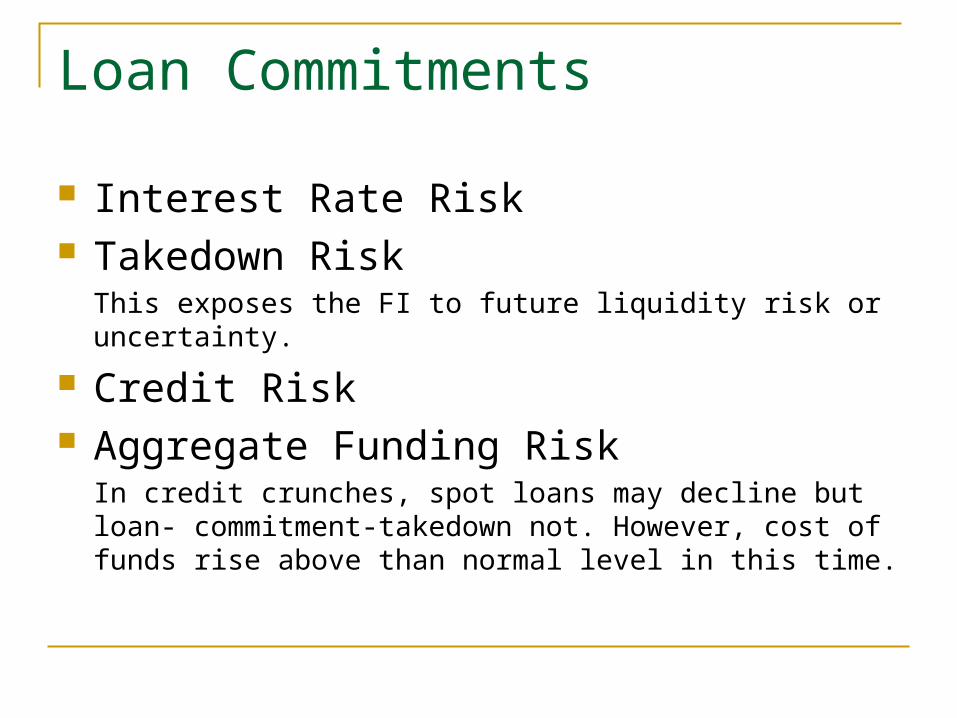
Loan Commitments
Interest Rate Risk Takedown Risk
This exposes the FI to future liquidity risk or uncertainty.
Credit Risk Aggregate Funding Risk
In credit crunches, spot loans may decline but loan- commitment-takedown not. However, cost of funds rise above than normal level in this time.

Commercial Letters of Credit
A contingent payment guaranty for domestic and international trade
Letter of credit fee Default risk on letter of credit
U.S. FI
1(Orders $10 million of machinery)
3( machinery shipped)
($10 million letter of credit issued) 2
U.S. importer German exporter

Standby Letters of Credit
A contingent payment guaranty for CP issuing firm onto maturity
Standby Letter of credit fee Default risk on standby letter of credit The LC or SLC fees should exceed the
expected loss from default risk, after adjusting for reclaiming and any monitoring costs.
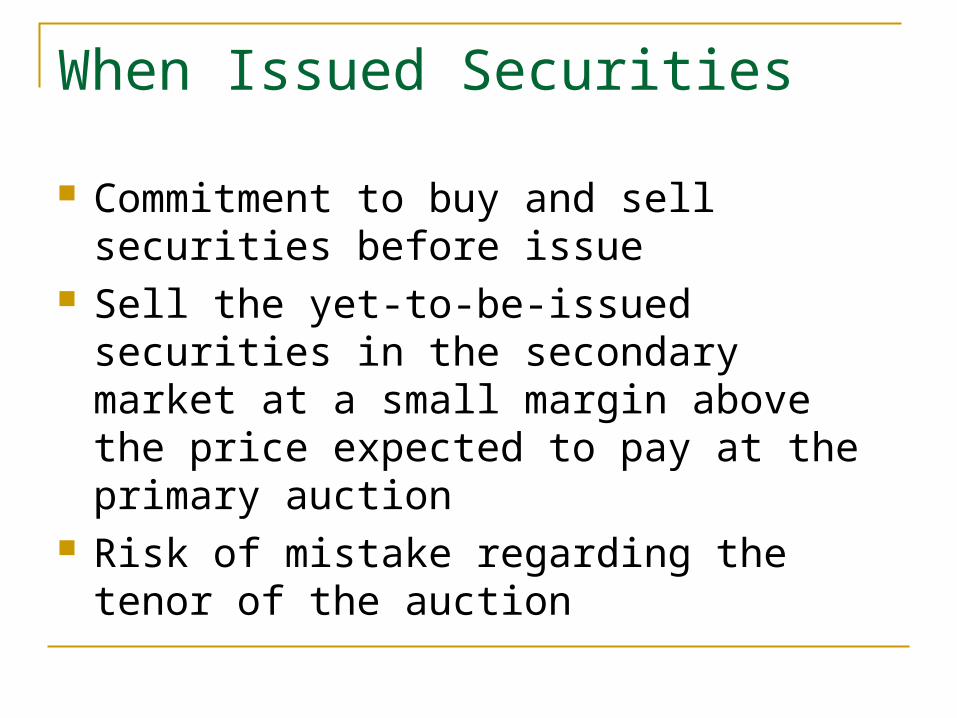
When Issued Securities
Commitment to buy and sell securities before issue
Sell the yet-to-be-issued securities in the secondary market at a small margin above the price expected to pay at the primary auction
Risk of mistake regarding the tenor of the auction
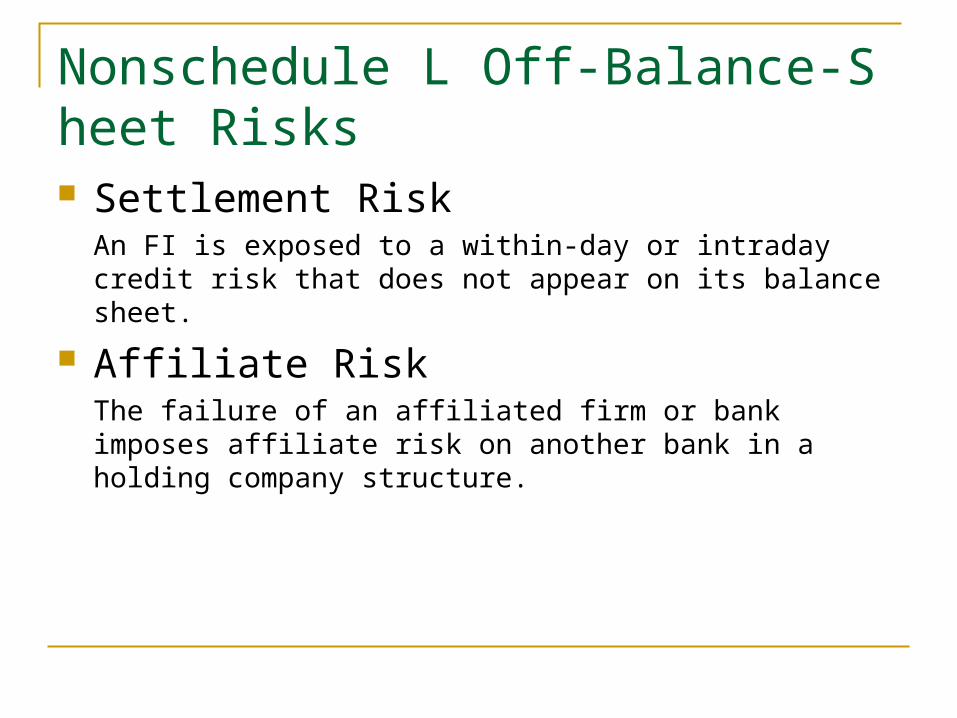
Nonschedule L Off-Balance-Sheet Risks Settlement Risk
An FI is exposed to a within-day or intraday credit risk that does not appear on its balance sheet.
Affiliate RiskThe failure of an affiliated firm or bank imposes affiliate risk on another bank in a holding company structure.
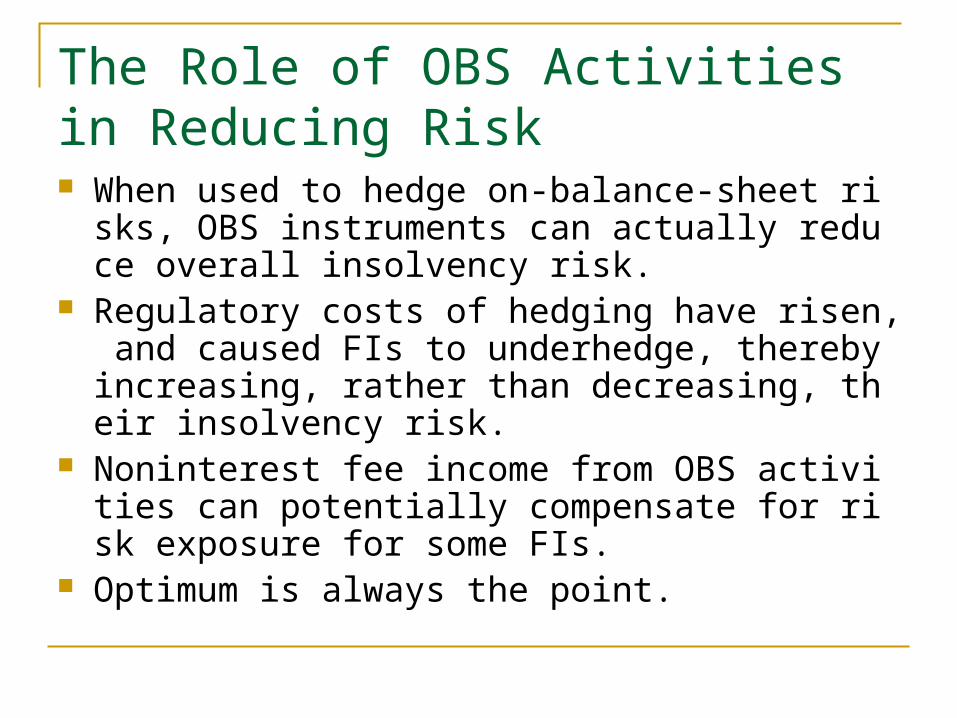
The Role of OBS Activities in Reducing Risk When used to hedge on-balance-sheet risks, OBS i
nstruments can actually reduce overall insolvency risk.
Regulatory costs of hedging have risen, and caused FIs to underhedge, thereby increasing, rather than decreasing, their insolvency risk.
Noninterest fee income from OBS activities can potentially compensate for risk exposure for some FIs.
Optimum is always the point.
Futures and Forwards
Interest rate risk Foreign exchange risk Credit risk Catastrophe risk

Interest Rate Risk Hedging with Forward
Change in bond values
= Capital loss on bonds
= Initial value of bond position
= Change in forecast yield
D = Duration of the bonds
1+R= 1plus the current yield
R
RPDP
1
PPR
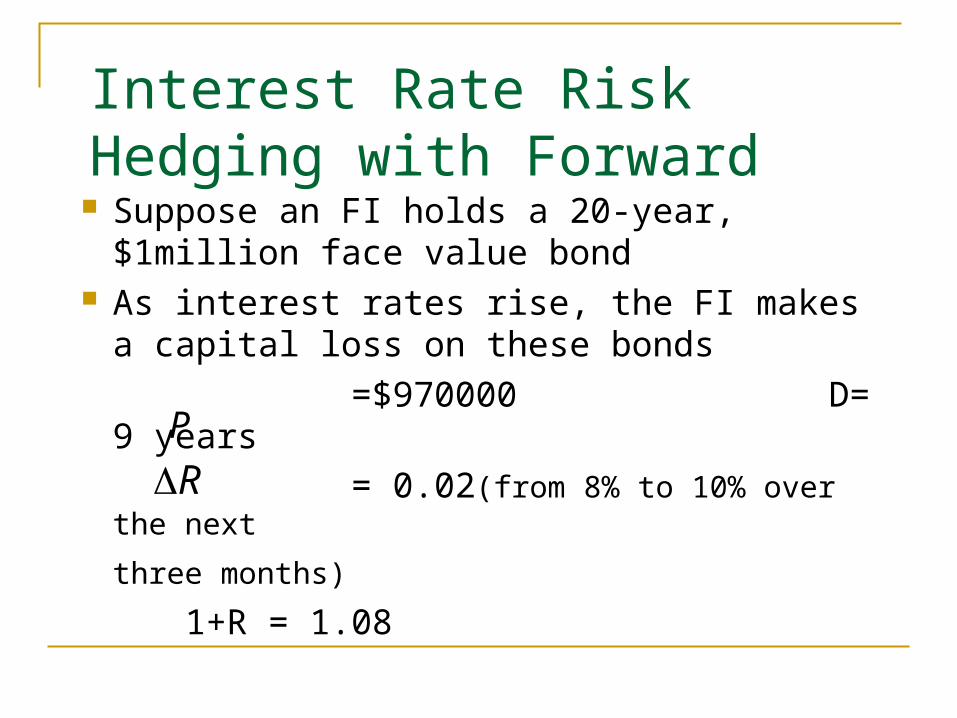
Interest Rate Risk Hedging with Forward Suppose an FI holds a 20-year, $1million
face value bond As interest rates rise, the FI makes a
capital loss on these bonds
=$970000 D= 9 years
= 0.02(from 8% to 10% over the next
three months)
1+R = 1.08
P
R
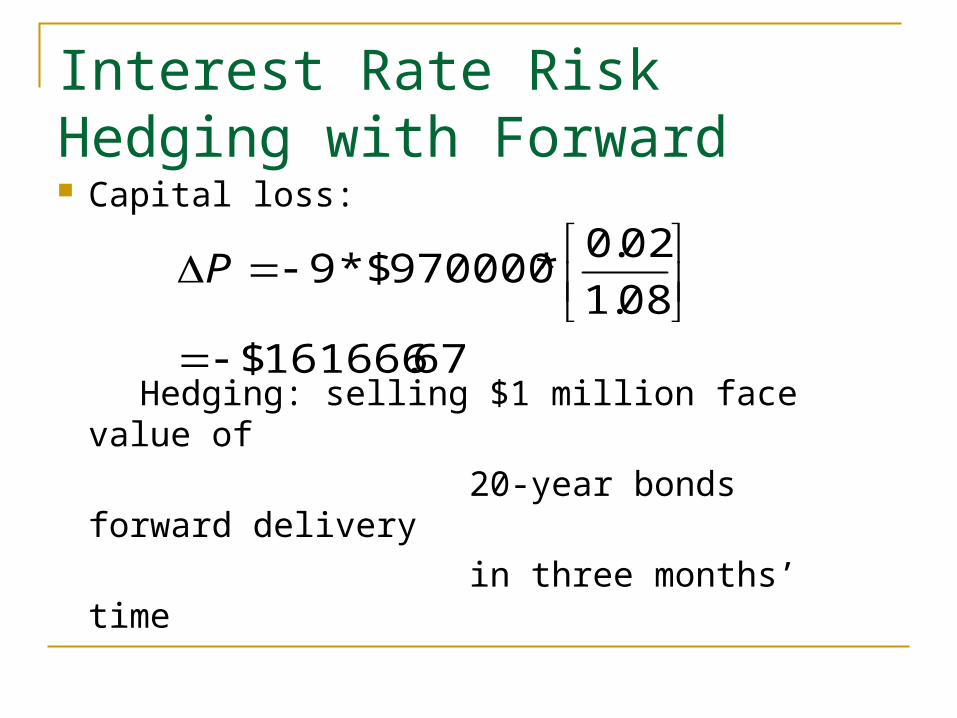
Interest Rate Risk Hedging with Forward Capital loss:
Hedging: selling $1 million face value of
20-year bonds forward delivery
in three months’ time
67.161666$
08.1
02.0*970000$*9
P

Interest Rate Risk Hedging with Futures
Microhedging versus Macrohedging Microhedging : Using a futures
(forward)contract to hedge a specific asset or liability
Macrohedging : Hedging the entire duration gap of an FI
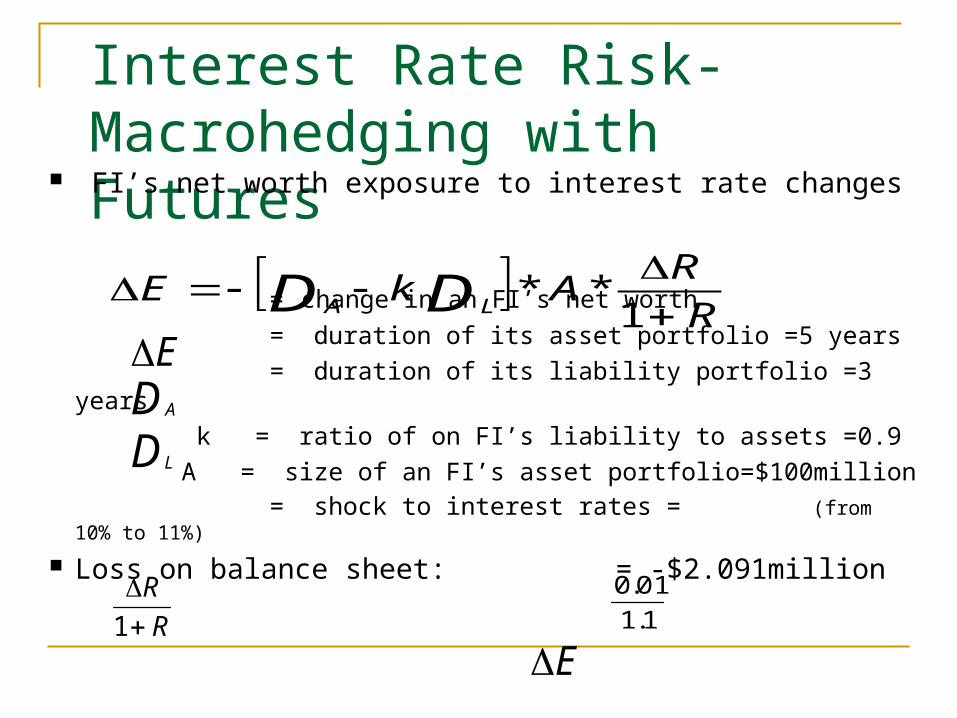
Interest Rate Risk- Macrohedging with Futures
FI’s net worth exposure to interest rate changes
= change in an FI’s net worth
= duration of its asset portfolio =5 years
= duration of its liability portfolio =3 years
k = ratio of on FI’s liability to assets =0.9
A = size of an FI’s asset portfolio=$100million
= shock to interest rates = (from 10% to 11%)
Loss on balance sheet: = -$2.091million
R
RAkE DD LA
1**
EDA
DL
R
R
1 1.1
01.0
E
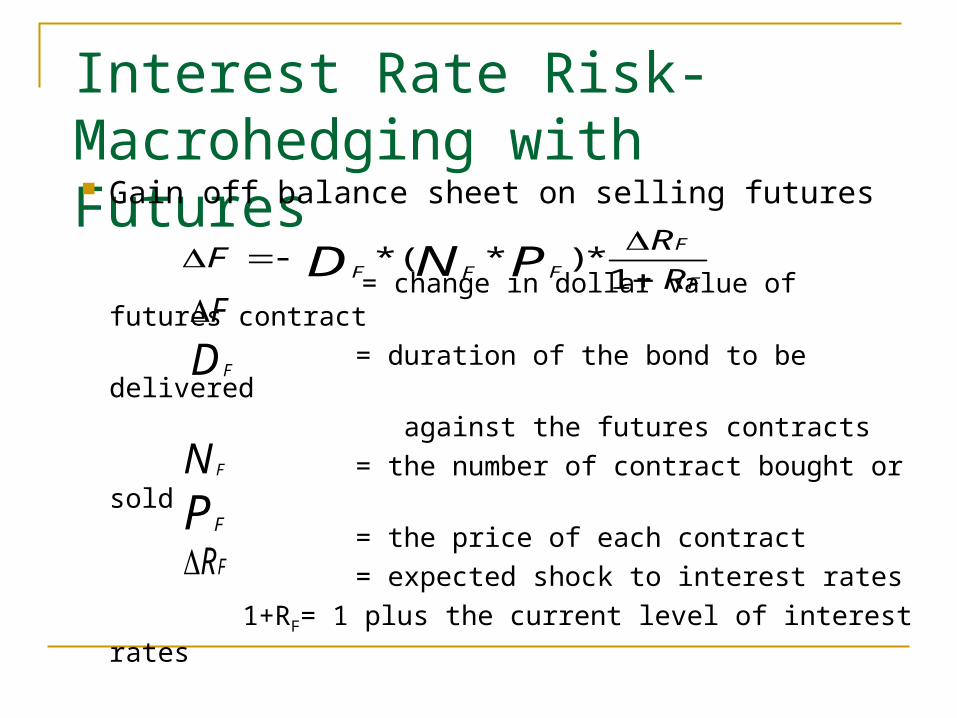
Interest Rate Risk- Macrohedging with Futures Gain off balance sheet on selling futures
= change in dollar value of futures contract
= duration of the bond to be delivered
against the futures contracts
= the number of contract bought or sold
= the price of each contract
= expected shock to interest rates
1+RF= 1 plus the current level of interest rates
F
F
FFF R
RF PND
1*)*(*
F
N F
PF
DF
FR
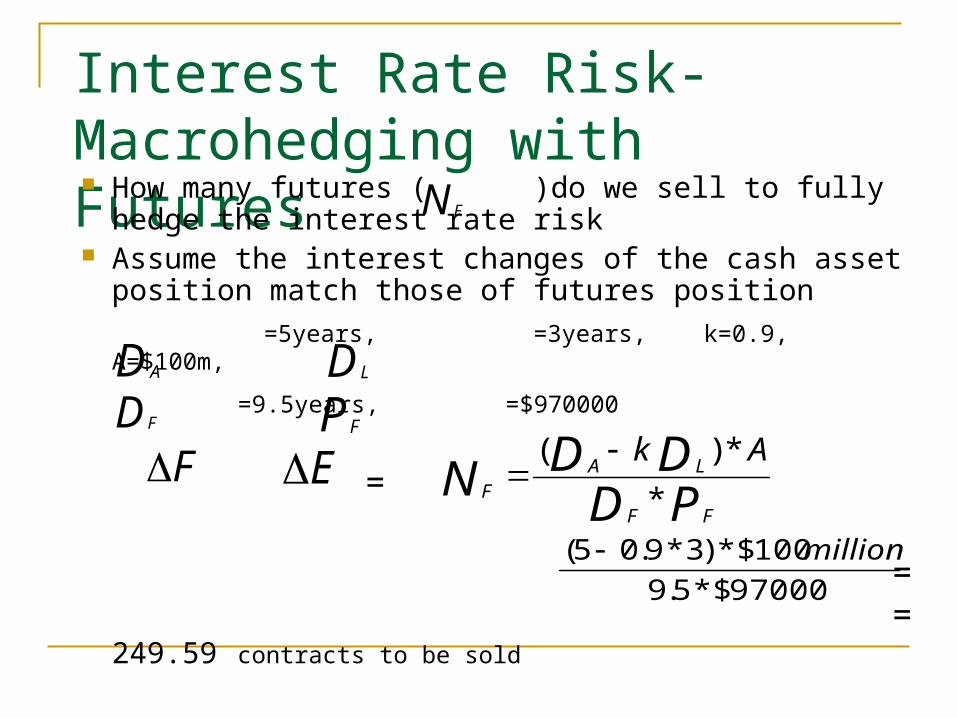
Interest Rate Risk- Macrohedging with Futures How many futures ( )do we sell to fully hedge the
interest rate risk Assume the interest changes of the cash asset
position match those of futures position
=5years, =3years, k=0.9, A=$100m,
=9.5years, =$970000 = = = 249.59 contracts to be sold
N F
F EPDDDN
FF
LAF
Ak
*
*)(
97000$*5.9
100$*)3*9.05( million
DA DL
DF PF
Foreign Exchange Risk Hedging with Forward
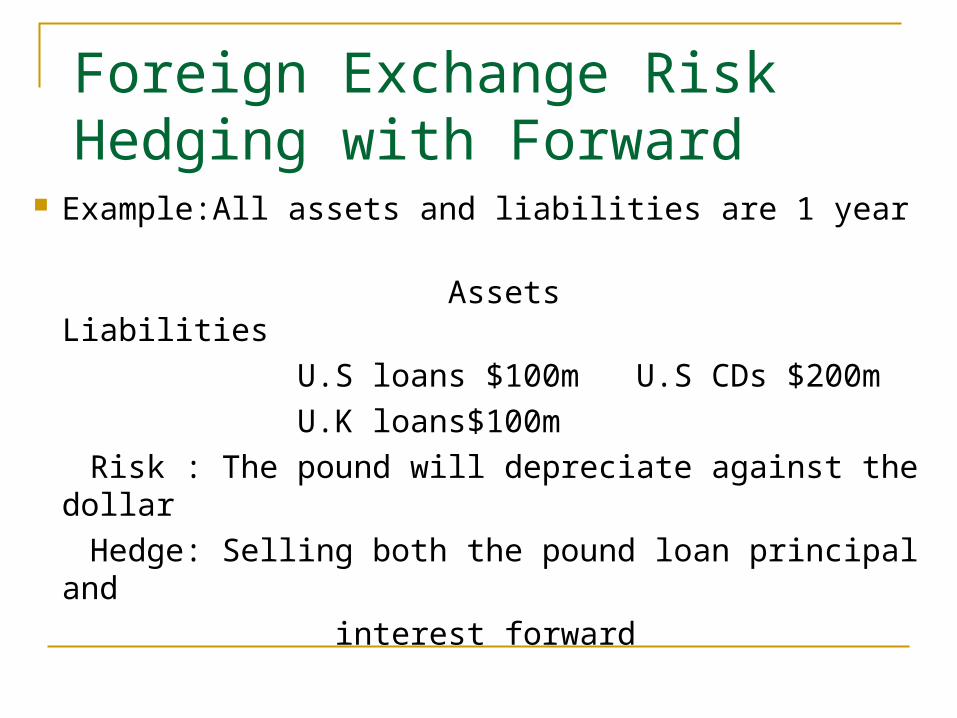
Example:All assets and liabilities are 1 year
Assets Liabilities
U.S loans $100m U.S CDs $200m
U.K loans$100m
Risk : The pound will depreciate against the dollar
Hedge: Selling both the pound loan principal and
interest forward
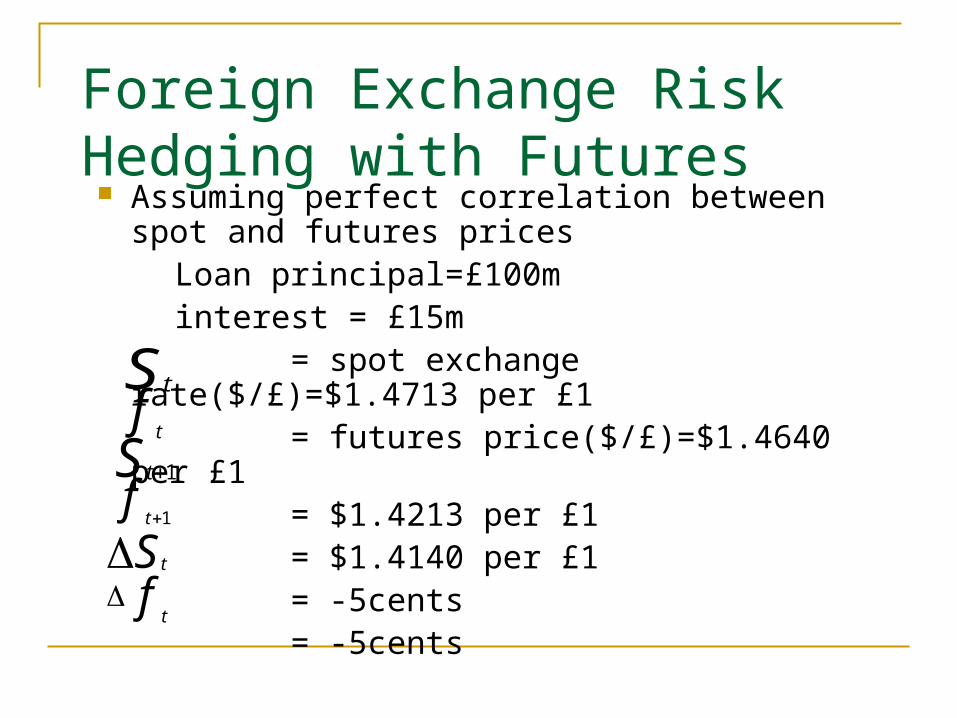
Foreign Exchange Risk Hedging with Futures Assuming perfect correlation between spot and
futures prices Loan principal=£100m interest = £15m = spot exchange rate($/£)=$1.4713 per £1 = futures price($/£)=$1.4640 per £1 = $1.4213 per £1 = $1.4140 per £1 = -5cents = -5cents
S tft
S t 1
ft 1
S tft
Foreign Exchange Risk Hedging with Futures
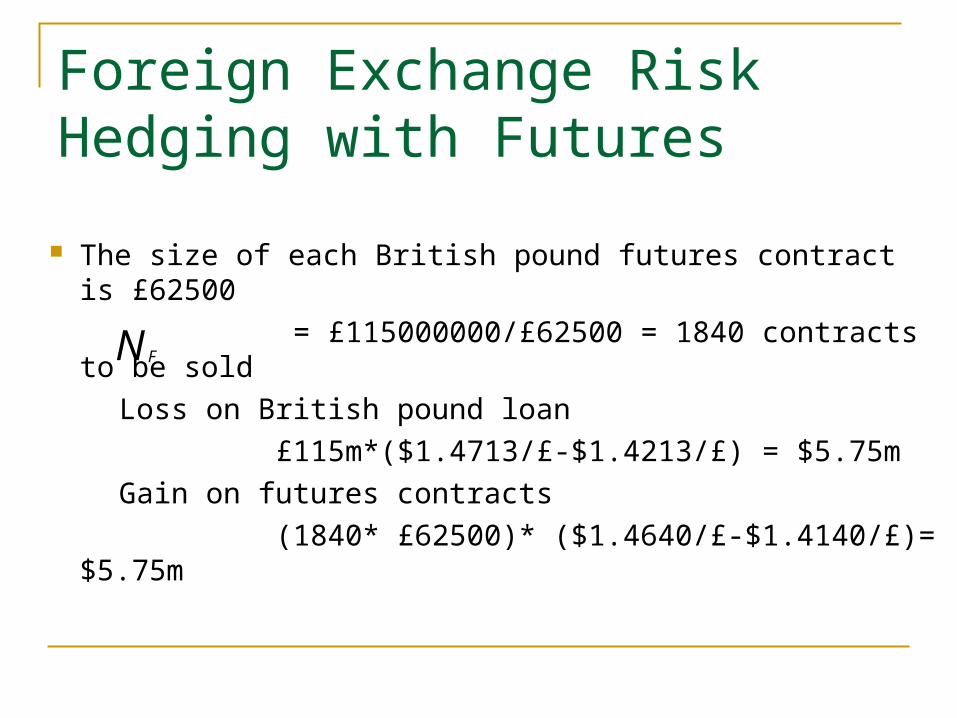
The size of each British pound futures contract is £62500
= £115000000/£62500 = 1840 contracts to be sold
Loss on British pound loan
£115m*($1.4713/£-$1.4213/£) = $5.75m
Gain on futures contracts
(1840* £62500)* ($1.4640/£-$1.4140/£)= $5.75m
N F
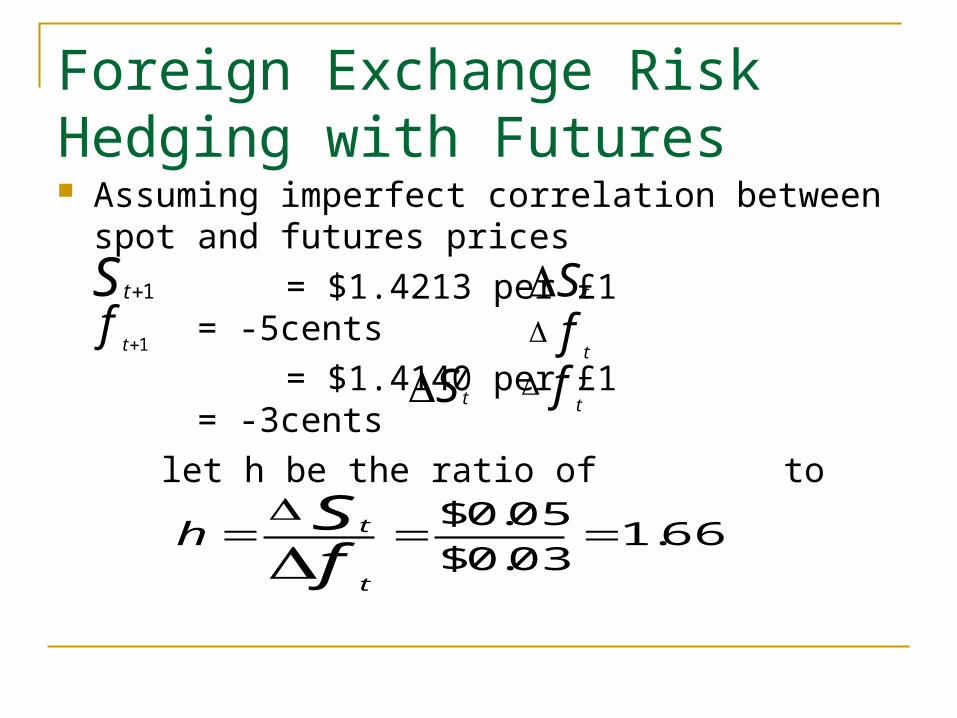
Foreign Exchange Risk Hedging with Futures Assuming imperfect correlation between spot and
futures prices
= $1.4213 per £1 = -5cents
= $1.4140 per £1 = -3cents
let h be the ratio of to
S t 1
ft 1
S tft
66.103.0$
05.0$
fSt
th
S t ft
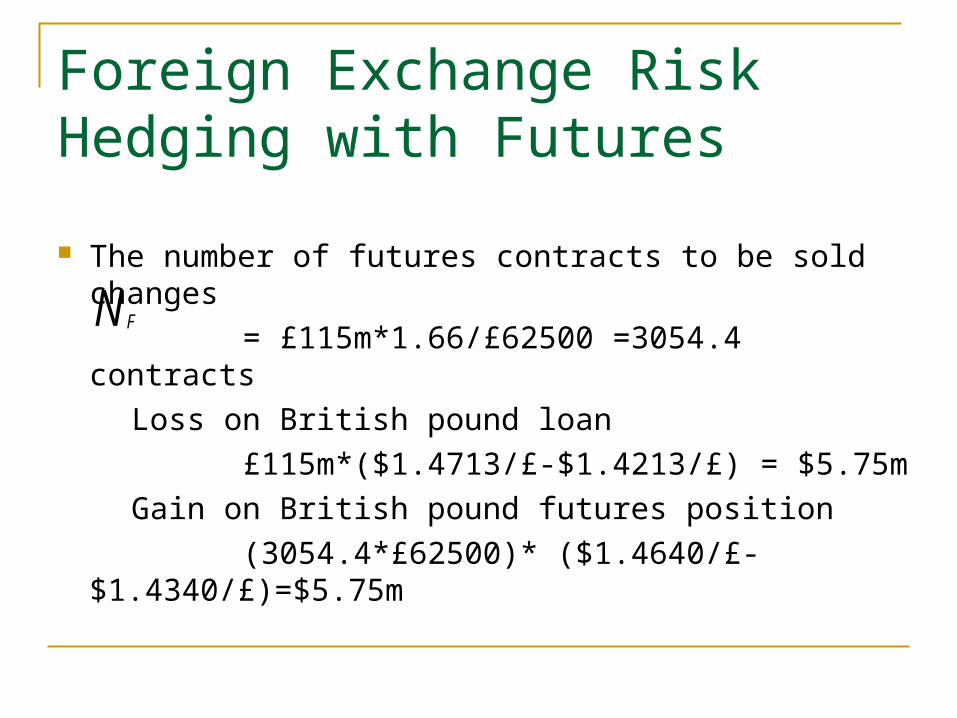
Foreign Exchange Risk Hedging with Futures
The number of futures contracts to be sold changes
= £115m*1.66/£62500 =3054.4 contracts
Loss on British pound loan
£115m*($1.4713/£-$1.4213/£) = $5.75m
Gain on British pound futures position
(3054.4*£62500)* ($1.4640/£-$1.4340/£)=$5.75m
N F
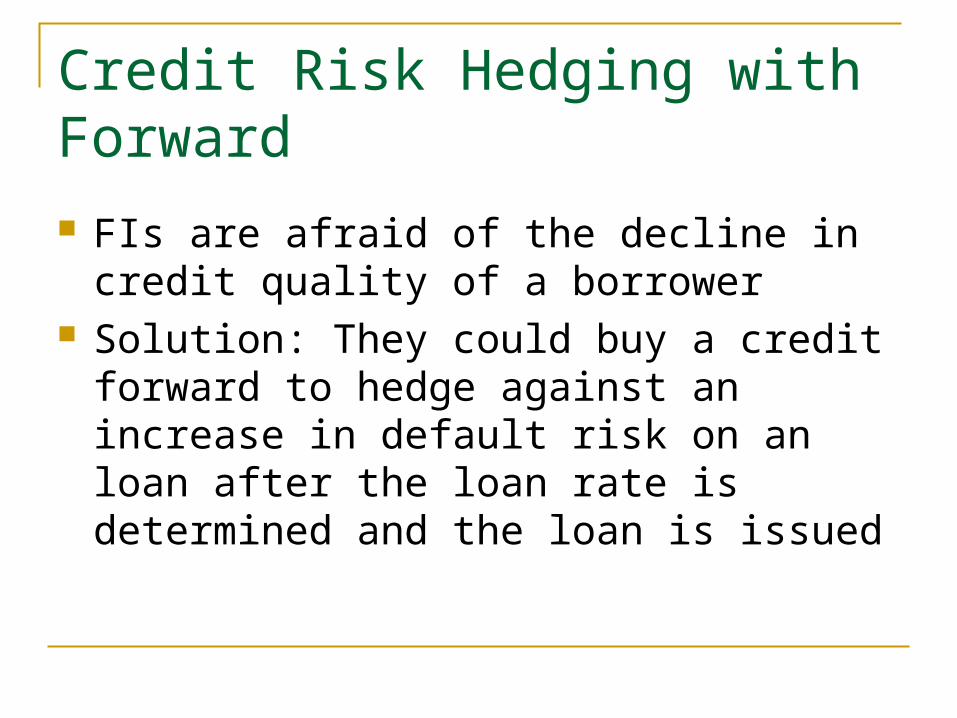
Credit Risk Hedging with Forward FIs are afraid of the decline in credit quality of
a borrower Solution: They could buy a credit forward to
hedge against an increase in default risk on an loan after the loan rate is determined and the loan is issued
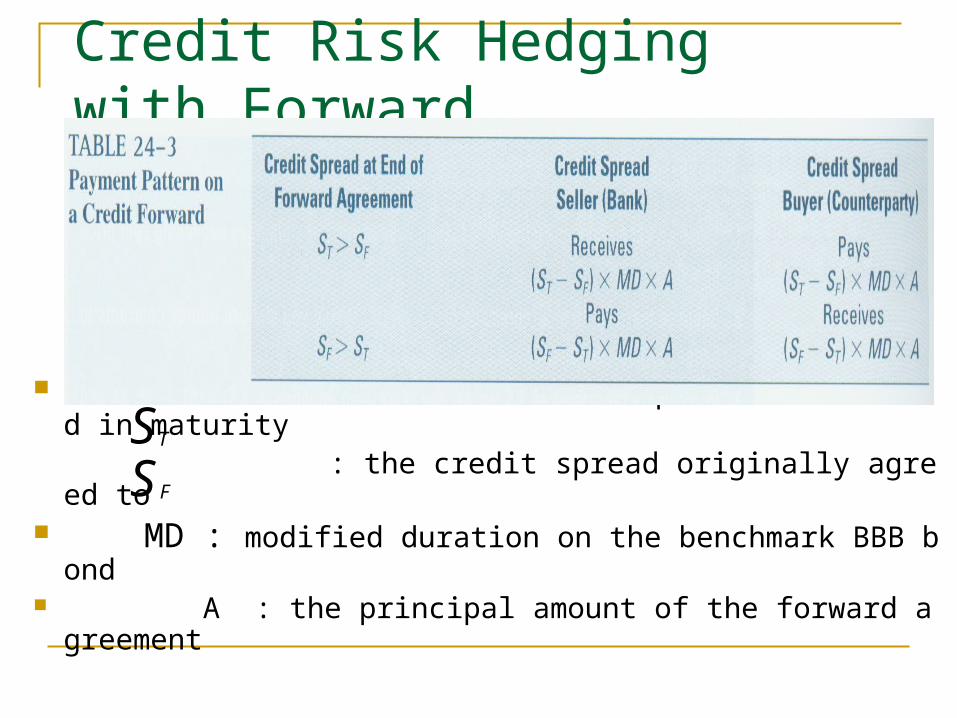
Credit Risk Hedging with Forward
:the actual credit spread on the bond in maturity : the credit spread originally agreed to MD : modified duration on the benchmark BBB bond A : the principal amount of the forward agreement
S F
ST
Credit Risk Hedging with Forward
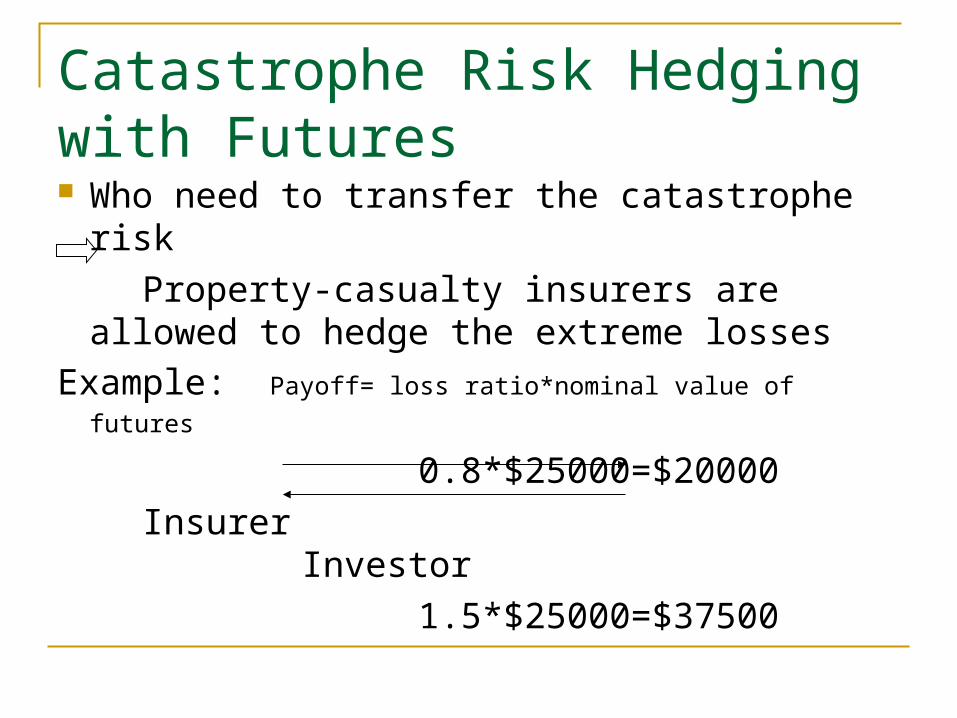
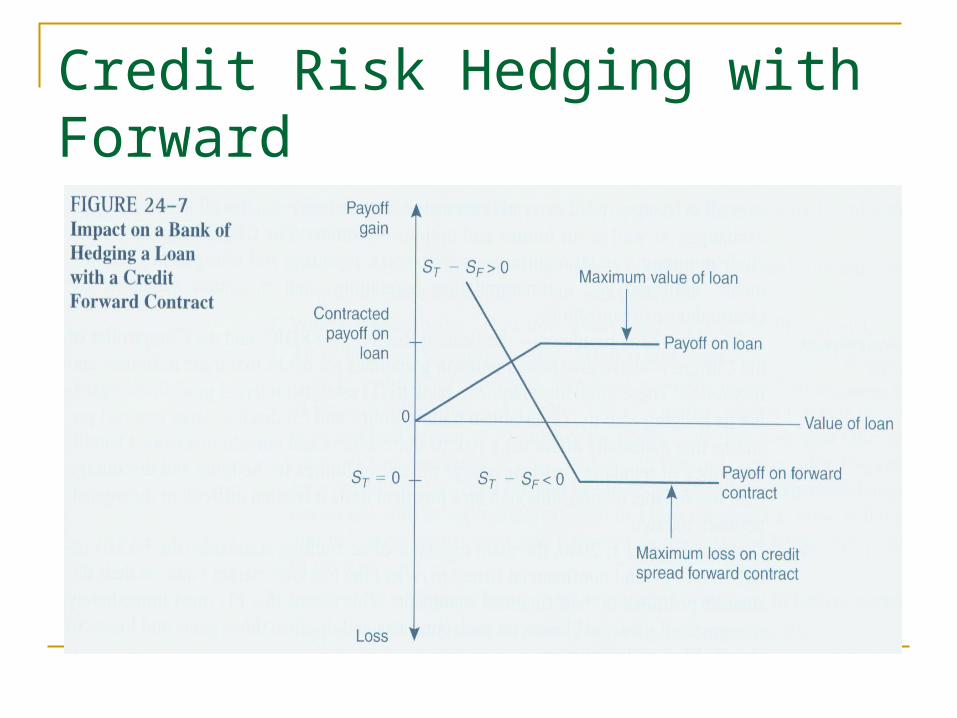
Catastrophe Risk Hedging with Futures Who need to transfer the catastrophe risk
Property-casualty insurers are allowed to hedge the extreme losses
Example: Payoff= loss ratio*nominal value of futures
0.8*$25000=$20000
Insurer Investor
1.5*$25000=$37500

Options , Caps ,Floors ,and Collars
• Writing versus buying options
• Calculating the fair value of the option by using the binomial model
• Using options to hedge risks
• Caps, floors, and collars
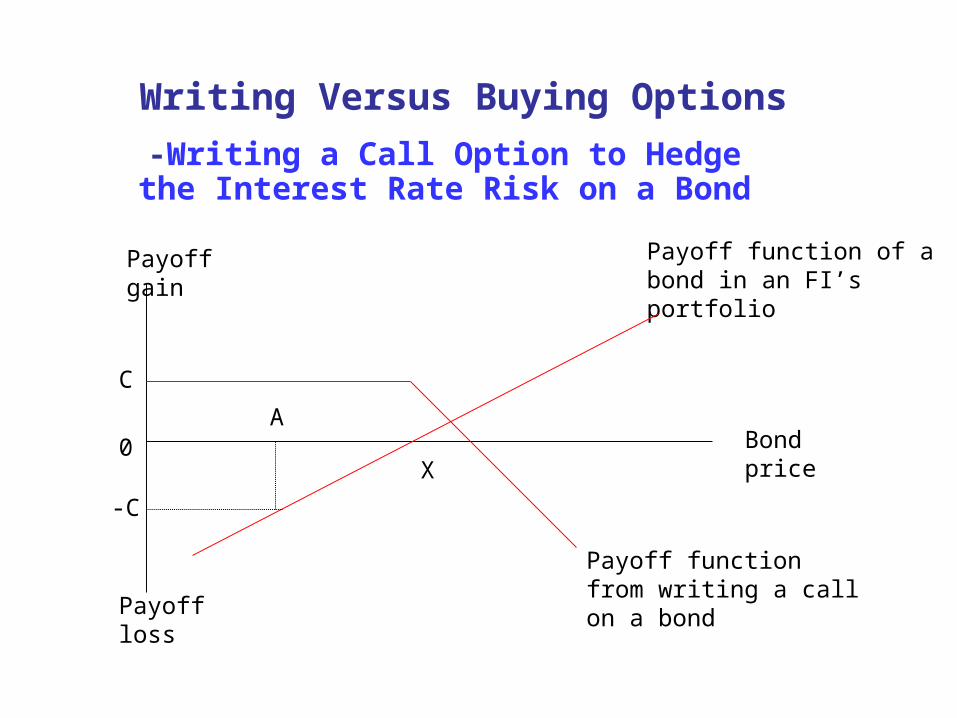
Writing Versus Buying Options
-Writing a Call Option to Hedge the Interest Rate Risk on a Bond
Payoff function of a bond in an FI’s portfolio
Payoff gain
Bond price0X
Payoff function from writing a call on a bond
C
-C
A
Payoff loss
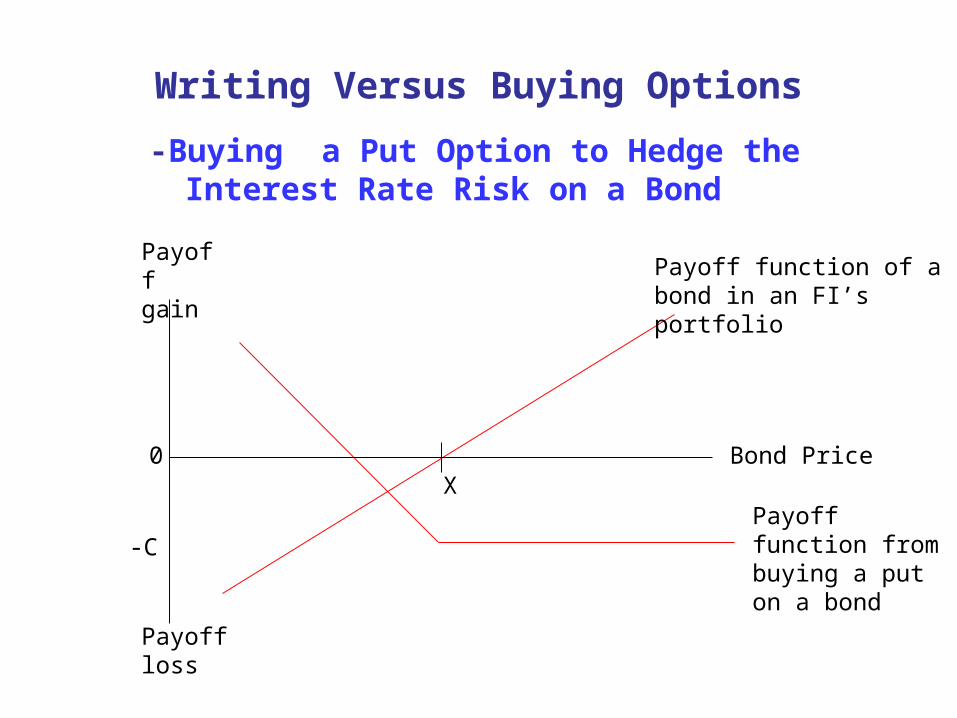
Writing Versus Buying Options
-Buying a Put Option to Hedge the Interest Rate Risk on a Bond
Payoff gain
Bond Price
Payoff function from buying a put on a bond
Payoff function of a bond in an FI’s portfolio
X0
-C
Payoff loss
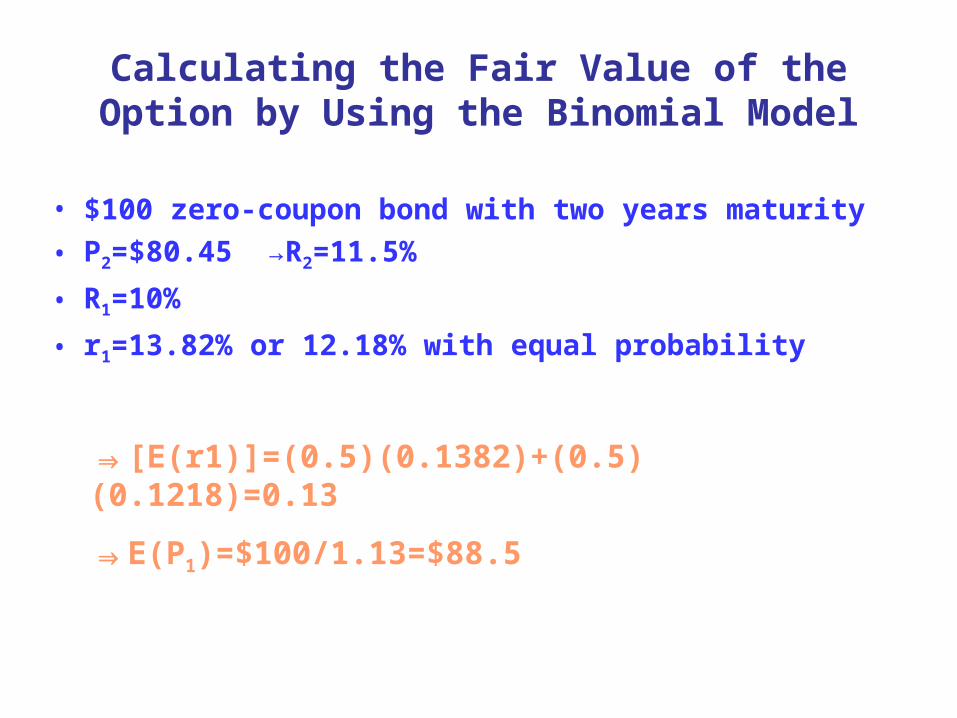
Calculating the Fair Value of the Option by Using the Binomial Model
• $100 zero-coupon bond with two years maturity
• P2=$80.45 →R2=11.5%
• R1=10%
• r1=13.82% or 12.18% with equal probability
⇒[E(r1)]=(0.5)(0.1382)+(0.5)(0.1218)=0.13
⇒E(P1)=$100/1.13=$88.5
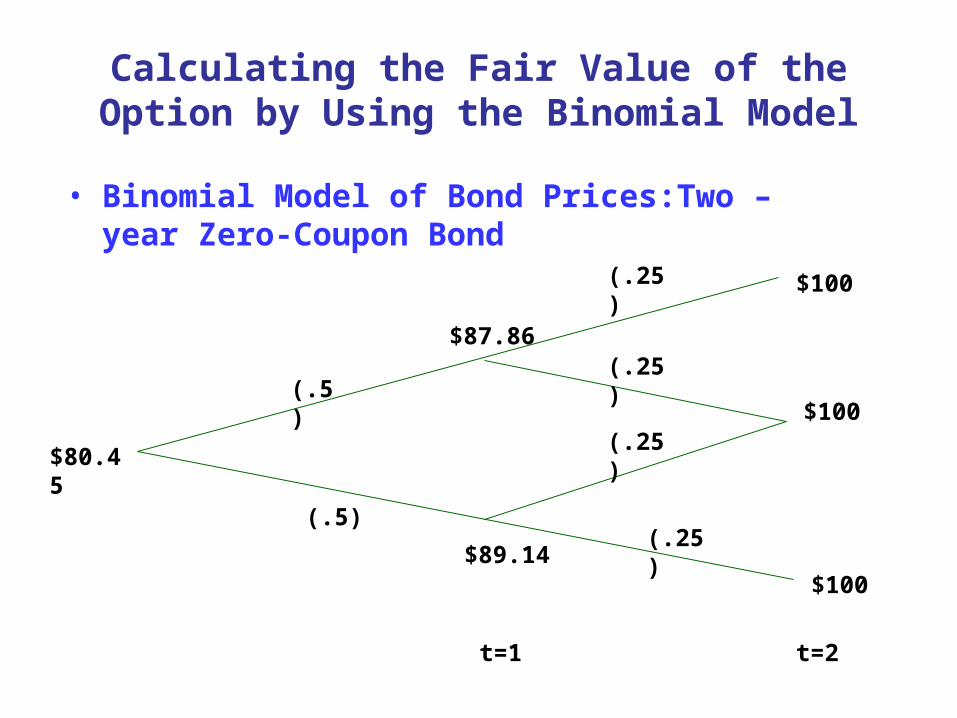
Calculating the Fair Value of the Option by Using the Binomial Model
• Binomial Model of Bond Prices:Two –year Zero-Coupon Bond
(.25)
$100
$100
$100
(.25)
(.25)
(.25)$80.45
(.5)
(.5)
$87.86
$89.14
t=1 t=2

Calculating the Fair Value of the Option by Using the Binomial Model
• The Value of a Put Option on the Two-Year Zero-Coupon Bond
⇒(0.5)($0.64)+(0.5)($0)=$0.32
⇒P=$0.32/1.1=$0.29
(.25)
$0=Max(0,0)
$0=Max(0,0)
$0=Max(0,0)
(.25)
(.25)
(.25)?
(.5)
(.5)
Max[88.5-87.86,0]=0.64
Max[88.5-89.14,0]=0
t=1 t=2
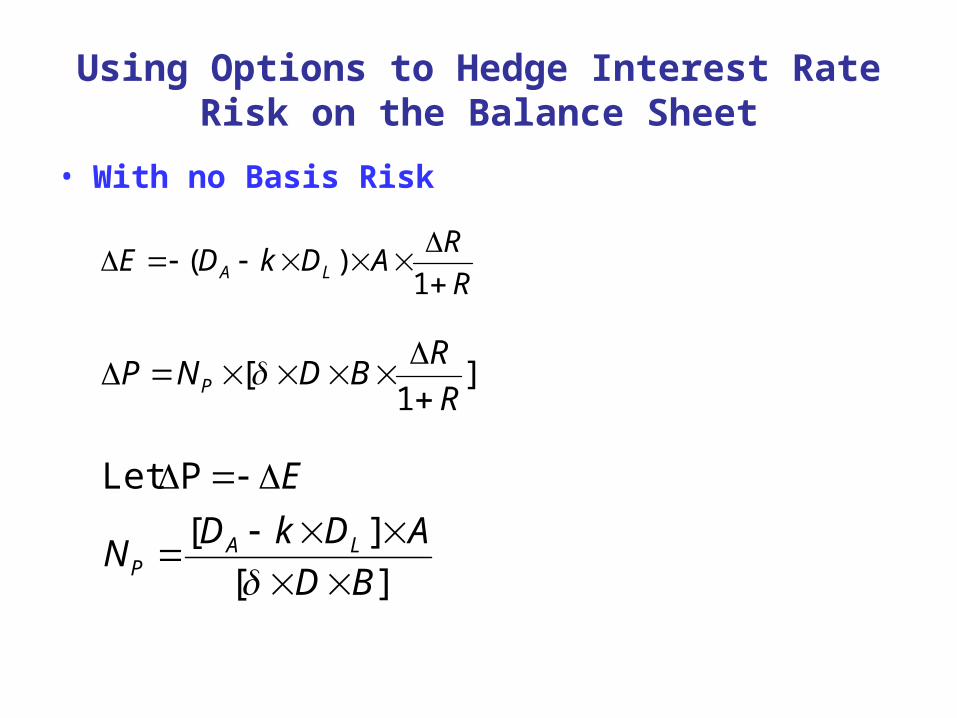
Using Options to Hedge Interest Rate Risk on the Balance Sheet
• With no Basis Risk
R
RADkDE LA
1)(
]1
[R
RBDNP P
][
][
PLet
BD
ADkDN
E
LAP
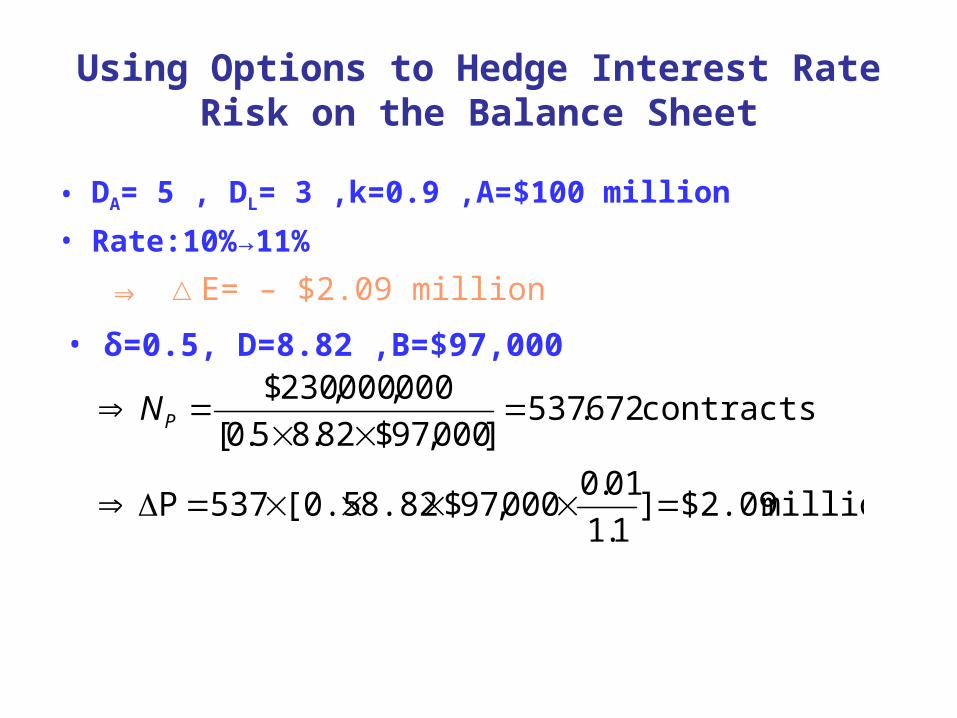
Using Options to Hedge Interest Rate Risk on the Balance Sheet
• DA= 5 , DL= 3 ,k=0.9 ,A=$100 million
• Rate:10%→11%
⇒ △E= – $2.09 million
• δ=0.5, D=8.82 ,B=$97,000
million $2.09]1.1
01.0000,97$8.82[0.5537P
contracts 672.537]000,97$82.85.0[
000,000,230$
PN
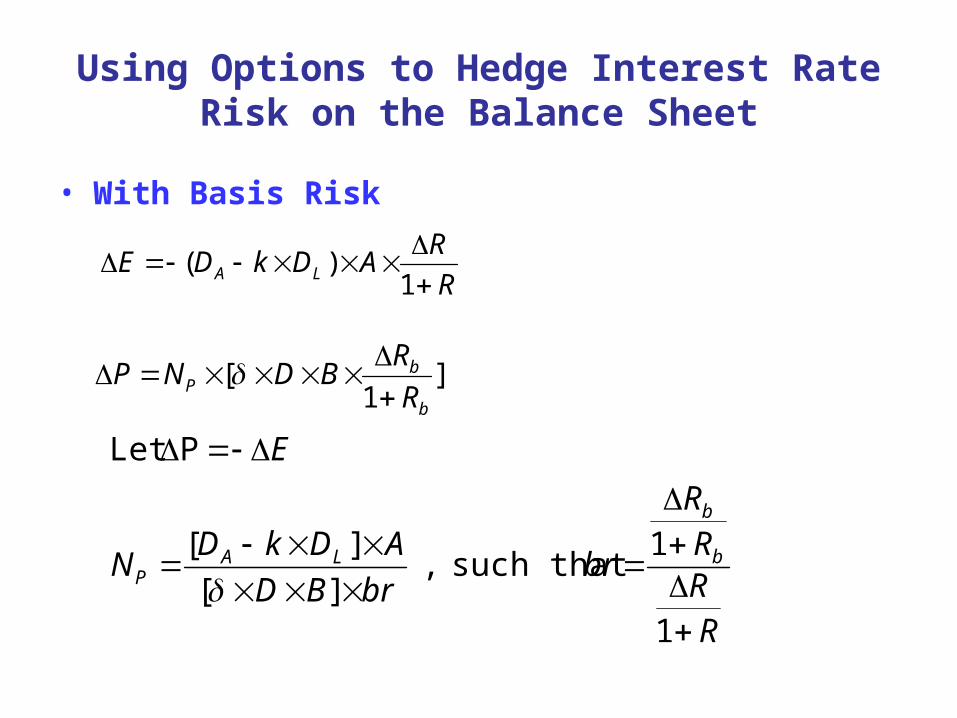
Using Options to Hedge Interest Rate Risk on the Balance Sheet
• With Basis Risk
R
RADkDE LA
1)(
]1
[b
bP R
RBDNP
RRRR
brbrBD
ADkDN
E
b
b
LAP
1
1 such that ,
][
][
PLet
Using Options to Hedge Interest Rate Risk on the Balance Sheet
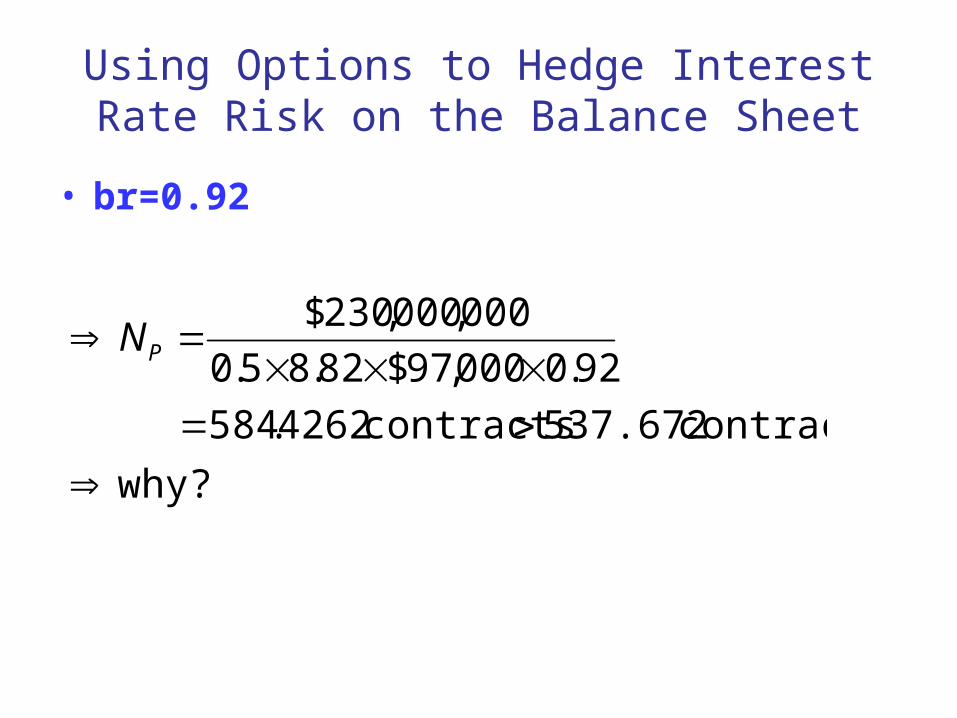
• br=0.92
why?
contracts 537.672 contracts 4262.584
92.0000,97$82.85.0
000,000,230$
PN
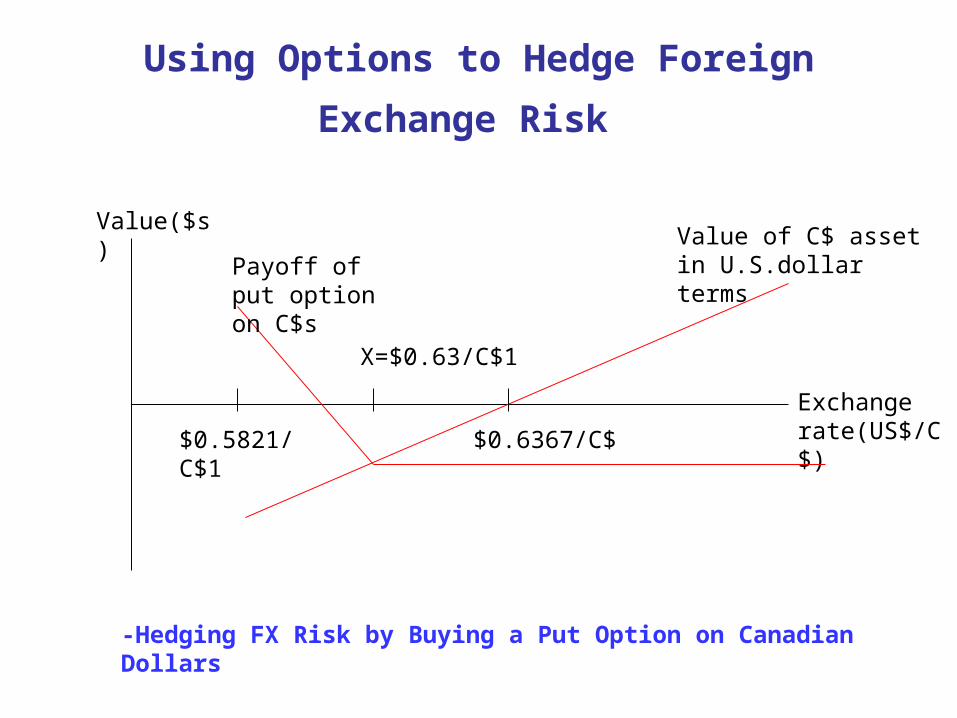
Using Options to Hedge Foreign Exchange
Risk
Value($s)
Exchange rate(US$/C$)
Value of C$ asset in U.S.dollar termsPayoff of put
option on C$s
$0.6367/C$
X=$0.63/C$1
$0.5821/C$1
-Hedging FX Risk by Buying a Put Option on Canadian Dollars
Using Options to Hedge Credit Risk
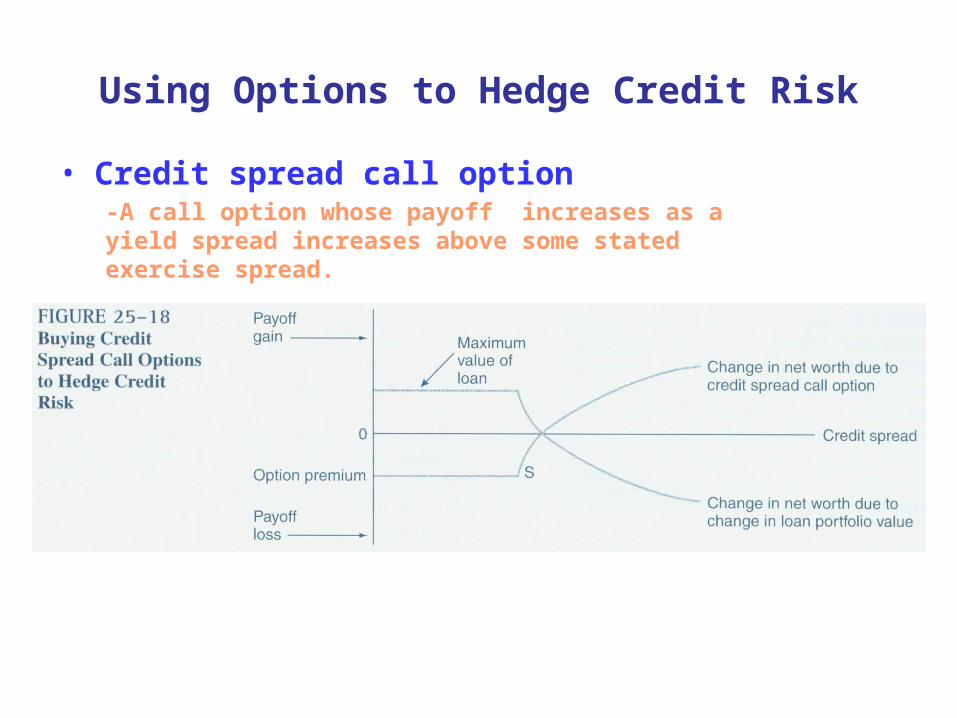
• Credit spread call option-A call option whose payoff increases as a yield spread increases above some stated exercise spread.
Using Options to Hedge Credit Risk
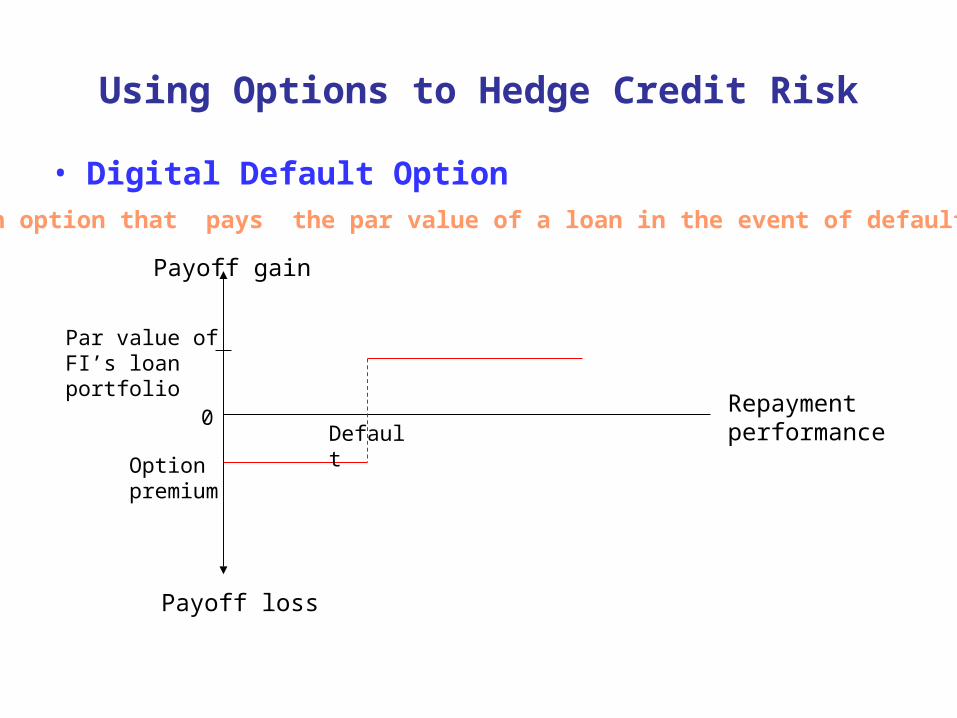
• Digital Default Option-An option that pays the par value of a loan in the event of default.
Repayment performance
Payoff gain
0
Option premium
Default
Par value of FI’s loan portfolio
Payoff loss
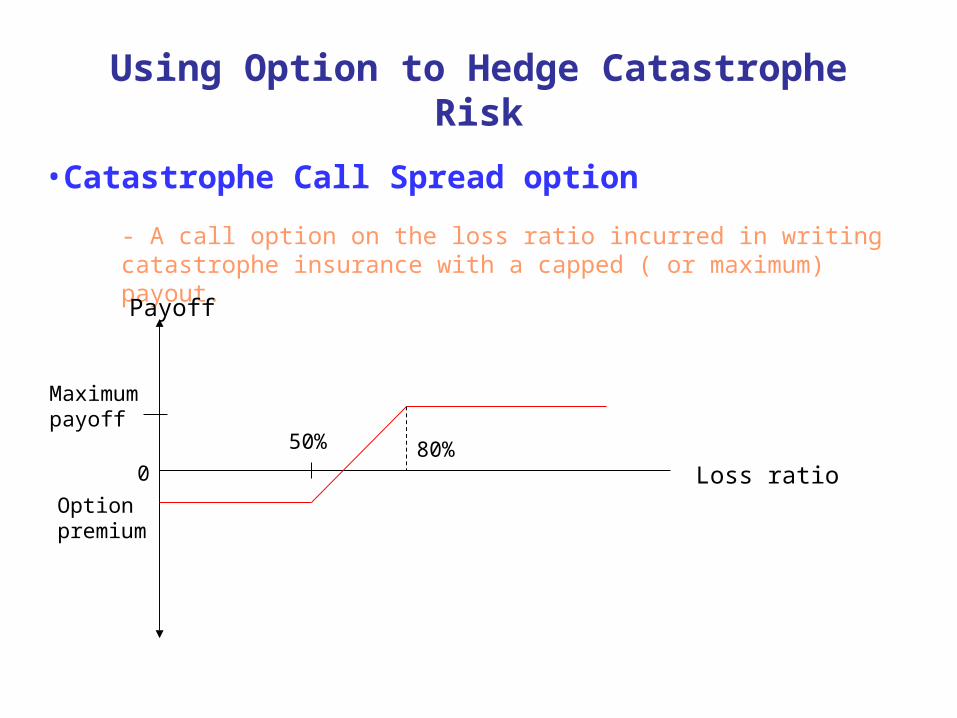
Using Option to Hedge Catastrophe Risk
•Catastrophe Call Spread option
- A call option on the loss ratio incurred in writing catastrophe insurance with a capped ( or maximum) payout.
Loss ratio
Payoff
0
50% 80%
Option premium
Maximum payoff
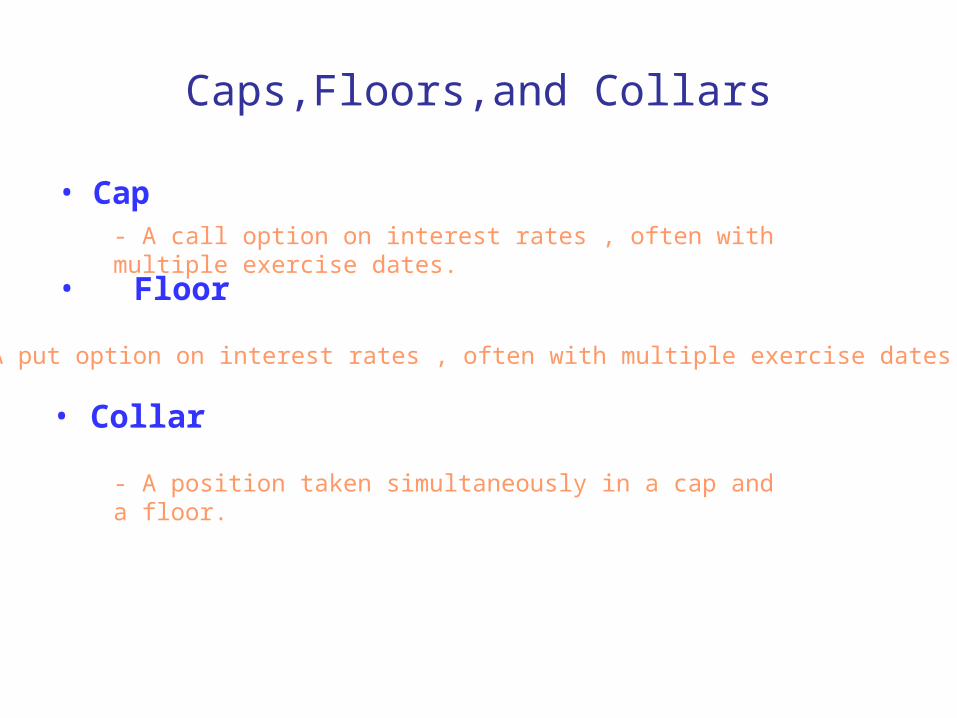
Caps,Floors,and Collars
• Cap- A call option on interest rates , often with multiple exercise dates.
• Floor
- A put option on interest rates , often with multiple exercise dates.
• Collar
- A position taken simultaneously in a cap and a floor.
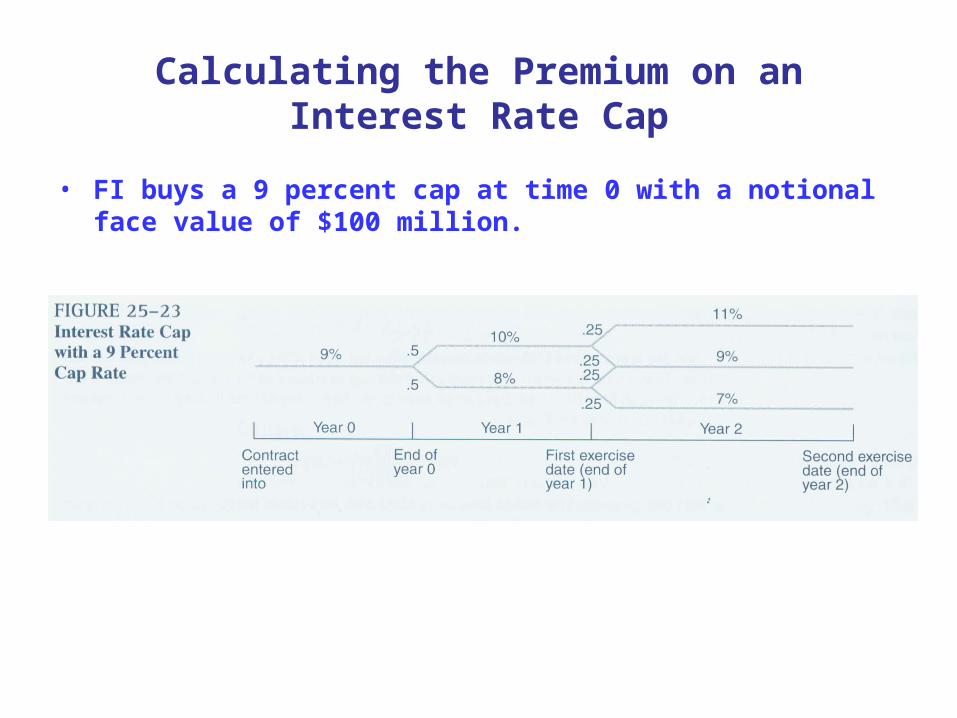
Calculating the Premium on an Interest Rate Cap
• FI buys a 9 percent cap at time 0 with a notional face value of $100 million.
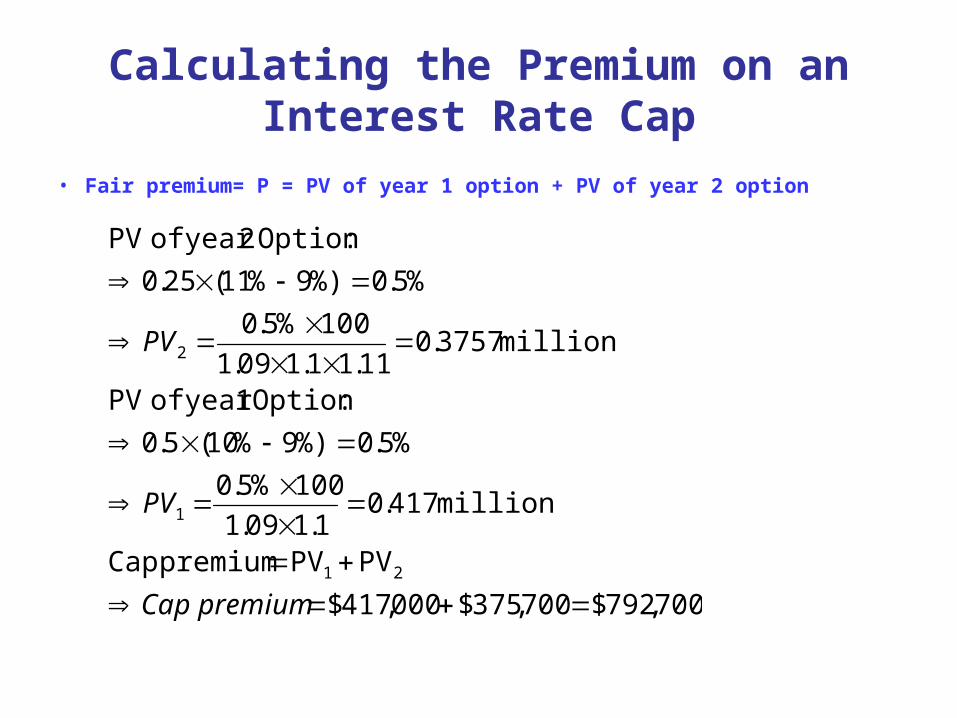
Calculating the Premium on an Interest Rate Cap
• Fair premium= P = PV of year 1 option + PV of year 2 option
700,792$700,375$000,417$
PVPVpremium Cap
million 417.01.109.1
100%5.0
%5.0%)9%10(5.0
:Option 1year of PV
million 3757.011.11.109.1
100%5.0
%5.0%)9%11(25.0
:Option 2year of PV
21
1
2
premiumCap
PV
PV

Collars
After an FI buys a cap and sells a floor, its net cost of the cap is;
floor on the rate Premium
cap on the rate Premium
floor theof principal Notional
cap theof principal Notional
where
flooron Revenue cap ofCost
)()(
pf
pc
NV
NV
C
pfNVpcNVC
f
c
fc