of the medical officer of health
TRANSCRIPT

STATES OF GUERNSEY BOARD OF HEALTH
86th
ANNUAL REPORT of the
Medical Officer of Health
REPORT FOR THE YEAR 1984


1
REPORT OF THE MEDICAL OFFICER OF HEALTH
FOR 1984
bV */V "a *a “a Vc *a -/V /W\*A /f
/\ /'wv /W»
r/V rf‘V/C/V *<w> *V'
*wf/\ /V<v<\ <V rf/> /v "/f/v /f*V' JU J>- J>- *t. y- JU J- JU J. J^ JU JU JU Jj. ju.
J- J- J- JU j* J- -U J* J„ J- J+ J, J„ J* J„ J-.
X<wV (V/f /tlwv ‘rt
/f <V*rt /X X V
XXXXXXXXX
Lukis House,
Grange, Guernsey
October 4th 1985.
Sir,
I have the honour to present to you my Annual Report on
the health of the Bailiwick of Guernsey for the year 1984.
I have the honour to be, Sir,
Your obedient servant,
E.P. Lawrence,
Medical Officer of Health.
The President, Board of Health,
Guernsey

2 3 4 9
11
12
13
14
15 17
19
22
25 26
28
29 30
31
33
33 34
35
36
37
38 39
40
45 49
2
CONTENTS
Contents
Members of the Board Introductory Letter to the Board
Public Health Department - Staff Public Health Department - Finance
STATISTICS
Vital Statistics Selected Statistics Compared
Birth and Death Rates
Population Estimates - 1961 - 1984
Average Age at Death
MATERNAL AND CHILD HEALTH
Preventive Child Health
Statistics - Births etc Infant Immunisation
Health Visiting Health Education
Family Planning
Non-Accidental Injury to Children
COMMUNITY NURSING
Community Nursing Service
The Elderly Residential Homes
Terminal Care
MEDICAL ADVICE TO STATES DEPARTMENTS
Civil Service Board - Staff Health
States Insurance Authority
States Water Board
Motor Tax Department
Control of Dangerous Drugs
INFECTIOUS DISEASES
Notification of Infectious Diseases 1965 - 1984
Food Poisoning Immunisations given by the Public Health Department
Sexually Transmitted Diseases
ENVIRONMENTAL HEALTH
General
Housing
ALDERNEY Annual Report
MORTALITY STATISTICS
Analysis of Mortality Statistics
Classified Causes of Death Non Resident Deaths

3
MEMBERS OF THE BOARD OF HEALTH
Conseiller J. R. R. Henry, President
Deputy Rev. A.W. Ingrouille
Deputy Mrs B.E. Nicolle
Deputy L.S. Ogier
Deputy P. Roffey
Jurat G.L. Le Page
Mr R.E. Dorey
Dr S. Heyworth, M.B.,B.S.,D.Obst. R.C.O.G.
Mr J. Ferguson, M.D., F.R.C.S.

4
INTRODUCTORY LETTER TO THE BOARD OF HEALTH
Mr. President, and Members,
In November 1983 the Board's policy statement was published: -
"A plan for Health Care to meet the needs of the Bailiwick of Guernsey". The Board identified.a number of objectives in this
plan, and it is useful to recall those of immediate relevance to the
Public Health Department:
- To develop preventive health services so that disease can be
avoided whenever possible.
- To develop services to meet the needs of special groups, such
as the very young, the physically handicapped (including the
blind and the hard of hearing) and the terminally ill.
- In consultation where necessary with other committees of the
States to develop support services which will allow the majority of patients to continue to live at home whilst receiving medical
care.
- To develop a service to meet the total needs of the elderly.
This plan emphasises the need to extend Community Care, and 1984
has seen the start of action to develop those ideas. However, harsh
reality has followed close on the heels of good intentions - the
States, early in 1984, expressed alarm at the ever increasing cost
of public services. The "Wheadon Requete" lead to committees being set up to look at expenditure, and in particular that of the three
big spenders - the Board of Health, the Education Council and the
States Insurance Authority with the express intention of finding
where economies could be made. For labour intensive departments, such as Health and Education, staff salaries and associated costs
account for three quarters or more of the total annual budget. The
effective control of expenditure therefore means strict control of recruitment, and there is now a much more stringent appraisal of
bids for new posts. This curb is hard to reconcile with public expectation. The increasing sophistication of medicine, new and
costly ways of curing illness and reducing disability and the desire
to move care from the hospital to the home all throw more strain on
a finite budget. In particular a high standard of community care is not a particularly cheap option. The family rather than the Health
Service may pay "hotel costs" but the Board of Health has to find more staff to meet dispersed rather than centralised provision of
medical care.
Faced with having to live within a limited budget, the public
and their elected Deputies have to come to terms with the "either/
or" principle. New developments in health care are usually seen as being in addition to existing services, not in place of them. The public do not want "either/or" - they want both. Hospital provision can be supplemented by care in the community, which must be expanded. It
may effectively postpone the need for admission to hospital, but for many there still has to be hospital provision at the end of the day. The
Medical Officer of Health has to appreciate this dilemma when
advising the Board how best to improve the health of the Island.

5
The answer has to be a judicious mixture of the old and the new, and in particular, funds for new developments may have to come from
economies elsewhere. Perversely, good management may make the
problem more difficult. The more efficiently a service is run, the harder it is to find economies, especially when ever higher
standards are being set.
It is important to appreciate this background in order to
explain why 1984 has been a difficult year for the Public Health Department. There has been a rapid succession of new appointments
of senior staff, and inevitably there have been upheavals associated
with these appointments. New staff bring new ideas and a fresh
outlook but are constrained by the limits of the budget. These problems are being sorted out, with one major exception. This is
the difficulty in selling the idea of a single preventive child health service, rather than the two services which exist at the
moment - one for the under fives and a separately managed service for school age children. It would be far simpler and much more
logical if the preventive services for all children were administered by one authority.
In January, Dr. Witherick retired after 15 years service as
Deputy Medical Officer of Health and School Medical Officer. During her career in Guernsey she established a reputation for close
involvement with the health problems of the Island's children, and is largely responsible for the high standard of services which have developed over the years. We are all grateful for her loyal service and wish her well in her retirement. Her place has been taken, on a
temporary basis, by Dr. R.D.G. Creery, who has settled in Guernsey after retiring from the post of Consultant Paediatrician in Cheltenham. As well as providing a high standard of clinical input for the service, this arrangement has been invaluable in allowing a period of assessment
of the Island's needs. These have to be seen in the context of rapidly
changing views in the Child Health field on the mainland, before making a permanent long term appointment and setting the pattern for the future.
In April, Mrs. Dorothy Jackson took up her appointment as
Director of Community Nursing. This is a new post, with a specific
brief to manage and develop all aspects of Community Nursing, Health Visiting, and School Nursing, and in particular to expand the
preventive role of the service. The aim is to set up Primary Care Teams, in which District Nurses and Health Visitors work as closely
as possible with doctors in their surgeries. One practice now has fully attached nursing staff working in this way, serving the practice population rather than a geographical area. Three new
Health Visitors have been recruited to relieve the pressure of work
with young families, as well as to make a start in extending their preventive services for the elderly and the handicapped.
There have also been major changes in the administration of the Public Health Department based at Lukis House. In July Mr. Orton took over from Mr. Sweet as Unit Administrator. There have been regular meetings of a Community Management Team, consisting of the Medical Officer of Health, the Director of Community Nursing, the
Chief Environmental Health Officer and the Unit Administrator. In practical terms this means that the department is now managed by a team, rather than by an individual medical administrator. The

6
clerical staff in particular have had to adapt to a number of
changes. All in all, it has been a year of upheaval and stress; it
is now essential to consolidate the changes that have been made.
Towards the end of the year a Health Education Advisory Group
was formed, as a response to the increasing pressure to organise an
effective service. "More Health Education" is seen as the answer to all manner of behavioural problems, from the prevention of smoking
and the abuse of alcohol, drugs and solvents, to the prevention of child abuse and to improving the quality of life of the elderly.
The advisory group have the formidable task of translating such
intentions into effective action. They see the appointment of a
Health Education Officer as the key to progress to provide drive and initiative and to co-ordinate what is at present a fragmented service.
There is little point in providing the means of preventing illness
without motivating individuals to do something about it - for
example by accepting immunisation or health screening or going to a
health counsellor for help with problems of addiction.
In last year’s annual report, a plea was made for collaboration
between social and health services when trying to help families who
damage their children, or when faced with the problems of the
elderly who cannot cope with daily living. The solution advocated,
to set up a unified Social Services Department, may not have
happened, but there is now much closer co-operation between
departments. The Guernsey Child Abuse Committee has met regularly
to co-ordinate ideas about the management and prevention of non¬
accidental injury. At the other extreme of life, the working party
looking into services for the elderly has taken a comprehensive view
in making recommendations, including the need for close
collaboration between Health, Housing and States Insurance Staff in
using resources as effectively as possible.
There have been no major alarms in the field of Infectious
Diseases, nor have there been any epidemics. Immunisation levels
remain satisfactory, with confidence returning in the value of
protection against whooping cough. Advice has been prepared, especially for blood donors, about the current American and European
epidemic of AIDS and its implications.
The Environmental Health department is hard pressed to achieve
its potential for prevention. Understaffing means that work is
complaint orientated, with insufficient time allocated to routine
inspections and the educational approach. It is hard to explain
that an increase in complaints dealt with implies a failure of
prevention, whereas a drop in their number is an index of successful
and time consuming preventive work, and does not mean staff are
under employed. Prevention will never receive the attention it
deserves if staff are fully stretched coping with complaints, which are the indicators of failures in prevention.
Mortality statistics are firmly established as indicators of the health status of the population, but comprehensive morbidity
statistics are a far more elusive measure of the quality of life. The number of episodes of illness and a measure of the use and
effectiveness of methods of treatment could be invaluable guides for planning services, but at present these figures have to be collected
in an ad hoc fashion. For example, we have no precise measure of the

7
unmet need for hearing aids for the elderly, nor do we know how effective vaccination against rubella and audiometric screening has
been to account for the declining incidence of permanent deafness in
children. This lack of information hampers logical developments in
many different fields of medicine.
The longevity of the population continues to be better than
Jersey and the mainland with the average age at death being 71.1 for
men and 77.1 for women, compared with 71.5 and 78.4 respectively in
1983.
The preventable causes of premature death in adults have not
decreased in scale, and in particular smoking continues to take its toll. The number of deaths from cancer of the lung increased from
38 to 44. However, the indices of obstetric and infant care (the
various mortality rates for these groups) remain satisfactory.
Once again, I am grateful for the continuing support of all
staff working in the Public Health Department. The year has been one of change, and adapting to new faces and new personalities has
been stressful. The service has survived thanks to the loyalty and
enthusiasm of all individuals, but confidence in the future does need nurturing with the occasional word of praise and appreciation
of what preventive medicine is all about: this report is an attempt
to inform as well as comment on the state of Guernsey's health.
Yours faithfully
yfM.
Dr. E.P. Lawrence,
Medical Officer of Health

8
HISTORICAL FOOTNOTE
The following paragraphs are included for those who may read this report without any background information about the area it concerns.
The administrative area is the Bailiwick of Guernsey, which comprises
the islands of Guernsey, Alderney, Sark, Herm and Jethou. Guernsey is the largest of these and the most westerly of all the Channel
Islands: Alderney is the most northerly and but nine miles from the coast of France. Sark, Herm and Jethou lie bewteen Guernsey and that
section of the coast of France which contains the Bay of Avranches.
Alderney and Sark each have their own Parliament, the States of Alderney and the Sark Chief Pleas. This is an over simplification
which must suffice for present purposes.
The Public Health Department functions within the Board of Health.
The Board is a standing committee of the States of Guernsey, deriving
its powers from Guernsey legislation and responsible to the States
of Guernsey. This independence from the central goverment of the United Kingdom is what the stranger to the Channel Islands finds most
difficult to understand. Nevertheless it is so and some 900 years of self government since William, Duke of Normandy, gained the English
Crown are sufficient proof of this.

9
PUBLIC HEALTH DEPARTMENT DATE OF COMMENCEMENT MEMBERS OP STAFF OF SERVICE WITH DEPT
Lawrence, Dr.E.P. MA, MB, BCh, FFCM, DPH,
DTM & H. Medical Officer of Health
1.9.83
Witherick, Dr.E.H. MB, BCh, (Wales), Deputy Medical Officer
of Health
24.4.69 to 20.1.84 (retired)
Creery, Dr.R.D.G. VRD, MD, FRCP, DCH,
Senior Clinical Medical Officer
4.1.84
Jackson, Mrs.D. SRN, QIDN, CMB (Pt.l)
HV Cert, FP Cert,
Director of Community Nursing
2.4.84
Sweet, Mr.D. Administrator 1.9.83 to 31.7.84
Orton, Mr.H. Administrator (Community) 1.8.84
Environmental Health Officers
Bairds, Mr.J.M.
Wiltshire, Mr.S.W.B.
Horton, Mr.S.
Cook, Mr.J.L.
Rowe, Mr.T.P.
Smith, Mr.S.P.
Health Visitors
Le Tocq, Mrs.I.A.R.
Simon, Mrs.J.
Renier, Miss H.M.
FRSH, MIEH Chief Environmental
Health Officer
MIEH
Environmental Health Officer
MIEH
Environmental Health
Officer
MIEH
Environmental Health Officer
MIEH Environmental Health Officer
Student Environmental Health Officer
RSCN, SRN, SCM, HV Cert.
SRN, SCM, HV Cert.
SRN, SCM, HV Cert.
14.3.66
1.2.71
1.7.79
1.8.79
1.10.79
2.7.82
18.2.63
7.2.66
1.4.70

10
Green, Mrs. M. SRN, SCM, HV Cert. 13.11.7;
Matthews, Miss A.D. SRN, HV Cert. 1.1.75
Goss, Mrs.A. SRN, HV Cert. 1.1.78
Erskine, Mrs.J. SRN, SCM, HV Cert. 14.7.80
8.8.83
Lawrie, Mrs.D.L. SRN, SCM, HV Cert.
00 •
•
1.6.84
Harris, Mrs.M. SRN, SCM, HV Cert. 2.6.84
Holmes, Mrs.J.M. SRN, HV Cert. 1.1.84
School Nurses 1.7.84
Smith, Mrs.S. SRN 14.2.72
Roland, Mrs.J. SRN, SCM 1.3.72
Community Nursing Ti earn
Aeschimann, Miss D. BA Hons, SRN, SCM 13.1.75 Nurse Co-ordinator
Domiciliary Nursing Sisters
de Jersey, Miss A.P. . RSCN, SRN, SCM 1.1.75
Le Conte, Mrs.M. SRN, SCM 18.8.75
Mew, Mrs. P. SRN 28.6.76
Le Gallez, Mrs.C. SRN, SCM 1.1.78
de Garis, Mrs.S.E. SRN, SCM 1.3.79
Jehan, Miss M.E. SRN, SCM, MTD 1.3.79
Barrett, Mrs. K. SRN, SCM 1.12.79
Herve, Mr.P.J. SEN, NDN(E) Cert 1.10.79
Hunter, Mr. J. SEN 4.10.81
Wylie, Mrs.R. SRN, NDN Cert 1.4.82
Chief Clerk Goodenough, Mrs.M.A. 1.5.77
Rodent Control
Angell, Mr. J. 3.5.70 to 6.11.84 (retired)
Attwater, Mr.R.A.
De La Mare, Mr.J.
17.12.73
6.8.84

11
PUBLIC HEALTH DEPARTMENT - FINANCE 1984
(The figures for 1983 are shown in brackets )
1984 1983
£_ £_
Analyst's Fees 931 (1667)
Cleaning, Fuel, Light, Water and Rents 8583 (7749)
Infectious Diseases :
Doctor's Fees 4627 (5898)
Drugs, Vaccines, etc. 7874 (6092)
12501 (11990)
Less Recoveries 4154 (2931) 8347 (9059)
Office Equipment and Furniture 2931 (3746)
Postage, Stationery and Teleph one 5398 (7366)
Rodent and Pest Materials 3237 (1861)
Salaries and Wages 480083 (426525)
Superannuation less Employee's Contribution 46709 (45364)
Special Treatment Clinic 16796 (15157)
Upkeep and Repair of Building 868 (3332)
Travelling Expenses 52812 (52489)
Welfare Foods 5145 (4507)
Less Recoveries 4160 (4287) 985 (220)
Other Expenses 6631 (5889)
Less Recoveries from Education Council
634,311
57,603
(580424)
(44341)
576,708 (536083)

12
VITAL STATISTICS - 1984 - GUERNSEY
Table 1:1 1984
Estimated mid-year resident population 53,300
Population density per acre (area 16,063 acres) 3.32
Population density per hectare (6,500 hectares) 8.20
Live births 596
Live birth rate per 1,000 population 11.2
Illegitimate live births 93
Illegitimate live birth rate per 1,000 live births 156.0
Stillbirths . 3
Stillbirth rate per 1,000 total births (live and
still) 5.0
Marriages 404
Marriage rate-persons marrying per 1,000 population 15.2
Divorces 170
Divorce rate-persons divorcing per 1,000 population 6.4
Deaths among resident population 581
Death rate per 1,000 population 10.7
Corrected death rate (comparability factor 0.91) 9.7
Infant deaths - in first year of life 6
Infant mortality rate per 1,000 live births 10.1
Neonatal deaths - in first four weeks of life 4
Neonatal mortality rate per 1,000 live births 6.7
Early neonatal deaths - in first week of life 4
Early neonatal mortality rate per 1,000 live births 6.7
Perinatal deaths - stillbirths and early neonatal deaths 7
Perinatal mortality rate per 1,000 total births (live and still) 11.7
Maternal deaths 0
Deaths from cancer, all forms 145
Cancer mortality rate per 1,000 population 2.7
Cancer of trachea, bronchus and lung (ICD 162) 44
Lung cancer mortality rate per million population 825
Lung cancer deaths per 100 deaths from all cancer 30.3
Deaths from tuberculosis, all forms 0
1983
53,300
3.32
8.20
660
12.4
93
140.9
4
6.1
408
15.4
127
4.8
661
12.4
11.3
5
7.6
4
6.1
2
3.0
6
9.03
0
155
2.9
38
713
24.5
0
(These f igures are for the Island of Guernsey alone)

CO
MP
AR
ISO
N
OF
SE
LE
CT
ED
VIT
AL
ST
AT
IST
ICS
13
<-3
P !Z C P O IS W
CM
tU i—I
X! (d
w p < s
“C ^—S an w o H o 00 o r*« <}■ On U0 CO 00 UO CM < o o o
00 • CM UO vX> CM t—H CM UO CO UO o • cr. r-H v£) t-H i—1 CM r—H o —• > vC t—H
o PC P
1983
T
an r—1
l w 1 • X i—H CM CO <t v£) r-H <1* IT)
3 t—H • o o P o r-H 00 o CM O vX> co 00 r- hJ O'
XT'. t-H r-H CM
t-H
1 H an t-H CO <t CO 00 co
3 w 00 p
1 CM 00 UO CM CM 00 r-H r^*
o c
c o r-H <fr r—H t-H CM r-H r-H r-H
CO M u x
t-H
cd a) :z; CO VC v£ UO vX) vX> >. c • c o
w 1 »—i vX5 CM H CM CM 00 to CM in X t—H CM t-H t-H CM i—l t-H
t-H
CM O O CM CO r-H
01 I* o o •u t-H UO x> UO o CM o o v£> X) r—H
cd t-H UO i-H t-H co c-H r-H
r-H
cc cr »—i
O VX) CO co t-H UO vX) o o c O' O' o 00
o CO 1/0 UO i—i IS •V
CO LT.
w CO. IS pi P p o
M
0) 4-1 a) a
c o
/•“N ✓-N CO 3 r-H CO t-H P r-H B X t-H o • tH 3 U 3 • tH Cl 4-J c /—V o o cd 4-J CO /T-N o C •tH MH CO o
CO • H o 4-J 01 o nj X 4-J •H cd i—< > X o C 4-1 cd 4J t-H r-H • tH 3 cd u t-H cd 3 cd CO t-H cd t-H
•H 3 t-H Cl p 01 X a 3 o *\ 4J 1 01 iH > o CL a CO Pi > 01
• H <b a o X • tH CO • H a r-H > 3- o 4-J X X t-H
• H o o cd CO 4-J 01 1 rH o o o 01 rT-N X 01 U r' 4-J
o o t—H XI CO 4-J > • rH CO cd CO o ** o X iH •tH p X M x o r-H r» Pj Pi 4-J • tH t-H | 4-J '—^
e 3 4-J c t-H 01 3 Pi X t-H iH o O M r* u Cl a • H o cd • H CO
• H • H • rH r-H 01 Pi c p 01 o 4-J p B 4-J 4-J p Cu 01 01 cd > o o Pi cd cd U a, 4-J CJ 01 • H »> 4-J t-H o
r-H r-H t-H 01 60 cd > t-H t—H cd MH 3 0 cd Or 3 01 u o • tH O 4-J O- cl 4-J • H 4-J w o i—i o U o o t-H o o o 01 cd t—H o 01 o 4-J t—H a. a 4-J 4-) 3 CO o o o- cd
cd u M—' B u o r' r-H o 4-J o o }H cd Pi 01 o t-H 01 o •X 3 o o B 3 o CL. 4-J Pi o CO 01 o o o Mh r—H u cd 01 •V • r4 x *> r* CO CO • rH 01 01 Pi o. t—H CO • r-1 t-H t-H X C 4-J t-H 4-> iJ CL V-/ O
CO 4-J o cd t-H cd 01 01 01 t-H 0) u !h u CO t-H cd in Cl 3 CO 4-) 4-1 a }H 01 01 • iH Vj 3 ''W' 4-J X cd cd OJ
a a X 01 D- •% 01 cd 4-J Pi }H iH Jh D. O *H CO 4-J u cd s_p 01 cd 01 01 01 CL 01 X cd 01 p 01 4-J 4-J > •V o 4-J iH X CO 3 >> cd cd • H 01 4-J C cd VP CO X CO 4-J
1 >H Pi t-H 4-J c cd 3 X t—H 4-J X X) S-*' cd 01 a XI CO 4-J cd cd 4-J o • t—1 01 Pi XI X cd 4-J 01 cd 4-J B co CO 4-J '—X • H B iH 4-J 01 cd X 01
x X cd CO o 01 cd X) c X 01 X 4-J 4-J B CO 01 u a 01 o t-H 3 01 JH *H • rH 01 iH MH C X) t-H 01 cd t-H X 4J • »H • H 4-J W) | cd cd c 4-> cd cd p X • H cd CO CO a 4-J 4-J cd C CO
B r-H b0 • H X p a cd fn c u X • tH 01 t-H 01 u 4-J 4-J 60 cd c t-H • rH 01 4-J 4J > • tH t-H u cd cd 3 MH o u iH 4-> cd CD •H 4-J r—H cd 01 01 2 3 01 cd 01 cd 01 w p CO 1—1 s p p X hH z w P s p
Fro
m O
.P.C
.S.
"P
op
ula
tio
n T
ren
ds"
No.
39.

Tab
le
1:3
Po
pu
lati
on
, L
ive B
irth
s
an
d
Liv
e B
irth R
ate
, D
eath
s,
Cru
de D
eath
Rate
, Infant
Death
s
and
In
fan
t D
eath R
ate
s
1961-1
984 in
clu
siv
e.
14
-p c X 4t 00 LT\ CD CD r- CD CD cn >cd O CD D- ID in LD -<d- cn CO CM CD cd -p <D
cd -P 00 00 T- cn co CD •*— CO co CD c- co CD ^d -sd CO in CM CM c~- o c- o g 0) cd CM ^- CM CM ^r- CM CM ^— *— *— ^— - ^- ^— T- ^— T— «r—
M p «
-p m g X cd -p CD LD Cn CD CD T- VO CD O ■'d CM
8
6
9
6
6
6 co CD in vo
Cm cd C\J T— CM ^— •r— G CD
M P
0) X * -p <1> CTC f- cn r- ▼— cn cd -d- o CD C- CM ■*d CD cn cd -sd- O r- CM CO n-
? cd -p g CD cd CM CM ««— •«— CM T— r— CD CD CM CM T— «r- o T— o T— CM o o P «
CQ p -P CTc (T> CM o 00 ->d- cd VO CD CD VO CO ID O ■<d- co c- r- ^- ^— ID O ^- — cd CD CD ■*d '!*■ D VO "d ID ■«d- m- ctc T— CD O ▼— CD O cn CD CD oo <1) ID LfN LPv in Lf\ in ID CD CD CD CD LTV LTV VO CD CD CD ID CD in in vo CD in
p
X * -p CD CM CO CD CD ID ->=d- -cd 00 no ^— rd- D CTc LD CD 00 c— oo C~- CO ^- CM g -P
•H cd t- c- co cn C- CD LTv in CO LPs ITS ln CM CM T— T— o o T— T~ T— CM p «
CQ <D rG c- tr- CM CD O CM O 00 o CD CTc T— CD r- CM VO CM cn cn O VO > -P in cn CTc ^— 00 CD CTC VO cn ln r- ^- CM co CO CM a) CD cn
•H G t- c- 00 OO co c- c~- 00 c- r- t- CD CD CD VO in in CD CD co in CD in p •H
m
+ G
-P O G •H CM ln LT\ in LTn LTN o o o o in in O in t— o o O O CD o O o CD -P •<- O CTc co r- VO CD CD CM CO o in cn CD n- CM r- cn ^— o O o
cd O r- cd o a> LT\ Dl OC o in o VO CM CD in CD CD CD CD CD •H i—( m G ln CD VO t oo co CD o O •*— CM CM CD CD CD CD CD CD CD <D P in in in in in in in in in in in in in in in
o p
G CM CD LT\ VO i— oo CTc o CM CD in vo c— 00 cn o CM ID cd CO VO CO CD VO VO CD VO VO t- n- t— r- r- r- n- n- r- r~ a) 00 CO CD co CD Cn CTC CTC cn cn CTc cn cn CTc cn cn CTC CTc cn cn cn cn cn cn cn cn cn cn cn
T- + E
sti
mate
d
mid y
ear
po
pu
lati
on
* R
ate
s
per
1,0
00
po
pu
lati
on
#■
In
fan
t death rate
per
1,0
00
liv
e b
irth
s

15
Table 1:4
POPULATION ESTIMATES - 1961 - 1984
GUERNSEY (including Herm and Jethou) for the past Four Census
Years and Estimated populations mid-year 1962 - 1984 inc.
The estimated population is based on the information available from the past three censuses taken together. The working has
been explained in Guernsey Annual Health Reports for 1978 and
1979, to which reference should be made for detail.
YEAR POPULATION MALE FEMALE BIRTHS DEATHS NATURAL INCREASE
1961 C 44,012 21,172 22,840 757 569 188
1962 44,705 21,505 23,200 797 569 228
1963 43,395 21,835 23,500 842 542 300
1964 46,085 22,165 22,165 891 540 351
1965 46,775 22,500 24,275 861 568 248
1966 47,465 22,830 24,635 780 564 216
1967 48,160 23,165 24,995 741 546 195
1968 48,840 23,490 25,350 752 656 96
1969 49,540 23,830 25,710 830 643 187
1970 50,230 24,160 26,070 794 616 178
1971 C 50,921 24,493 26,428 766 646 120
1972 51,465 24,755 26,710 790 576 214
1973 52,005 25,040 26,965 652 595 57
1974 52,550 25,330 27,220 679 610 69
1975 53,095 25,620 27,475 611 634 -23
1976 C 53,637 25,909 27,728 623 606 17
1977 54,270 26,210 28,060 587 617 -30
1978 54,320 26,235 28,085 582 567 15
1979 54,570 26,357 28,213 646 601 45
1980 53,390 25,740 27,650 622 571 51
1981 C 53,313 25,701 27,612 619 595 27
1982 53,300 25,720 27,580 589 630 -41
1983 53,300 ¥ 25,720 27,580 660 661 -1
1984 53,300 ¥ 25,720 27,580 596 581 15
C Census Year
¥ No recalculation has been made since 1982 because of the small difference between births and deaths in these latter years.
The effect of immigration is a much more elusive factor to quantify
and is not shown.

POPULATION
(x 1,000)
16
55
50
45
40
35
30
25
20
ON
\0 s *“H r^loc O' ! O'
55,000
50,000
45,000
40,000
35,000
30,000
25,000
20,000
Fig: i;5 CENSUS POPULATIONS 1821 to 1981 - GUERNSEY
GUERNSEY ALDERNEY SARK HERM JETHOU BAILIWICK
1821 20,302 1,154 488 28 9 21,981
1861 29,804 4,932 583 41 5 35,365
1911 41,823 2,561 579 33 2 44,998
1961 44,968 1,472 561 90 8 47,099
1971 51,351 1,686 590 96 11 53,734
1981 53,268 2,086 N/K 37 8 56,000 (est)
Table 1:6 CENSUS POPULATIONS 1821 - 1981 - BAILIWICK

17
Table 1:7
GUERNSEY ; SOME COMPARISONS OF AVERAGE AGE AT DEATH
FEMALE DEATHS 1974 1979 1983 1984
Guernsey 76.9 76.3 78.4 77.1 Jersey (mid 5 year average) 75 76 76 75 UK 74 75 75.2 75.5
MALE DEATHS
Guernsey 66.3 68.9 71.5 71.1 Jersey (mid 5 year average) 68 68 70 71 UK 67.7 68.8 69.6 69.5
Over the years, the average age at death is an indicator of the expectation of life, and of the longevity of the population. However, relatively small numbers can cause difficulty in deciding
how significant changes are, compared year by year. The slope of the graph is a more reliable indicator of a true trend.
This trend does not differ markedly from that of Jersey, nor from
that of the United Kingdom. In other words, if longevity is used as a measure of the "health" of the Islands, the figures indicate a
satisfactory state of affairs. They are, however, a measure of quantity rather than quality. What is of interest, and of importance
to planning care for the elderly, is that the 6 year difference between the averages for men and women appears to be relatively
constant. This means that on average, widows may need support and help for 6 years of their lives, when they may have to manage on their own.

18
Fig 1:8
Average age
at Death
COMPARISON OF AVERAGE AGS AT DEATH
(ALL DEATHS)

19
PREVENTIVE CHILD HEALTH
The aim of this service is to promote the health of children and
to minimise disability, in the belief that a healthy child has a better chance of growing into a healthy adult.
Four main approaches are used - Systematic screening for abnormalities,
education about healthy living, advice on how best to use the health services and protection from specific illnesses by Immunisation.
Success depends on good team work, involving family doctors, health
visitors, school nurses and the Senior Clinical Medical Officer.
During the year a schedule of procedures was agreed, and is given
in outline below to indicate how different members of the team work together. The preventive programme is carried out in the home,
in surgeries, in Child Welfare Clinics, at Lukis House and in schools.
Screening it is now generally accepted that the most important physical
abnormalities are detected in the first year of life. Thereafter, the important points to watch are the development of walking and of speech, and of the special senses of sight and hearing.
Regular reviews of sight and hearing are the two most valuable screening measures needed after infancy. If the child is competently examined
before the age of one year, little is to be gained by further full
physical checks at frequent intervals. It is nevertheless vital that the service should respond promptly to an invitation to check a child whose development or behaviour does not seem normal. This combination of careful assessment in the first year of life, some routine screening thereafter, and response to referrals at any age is the current basic pattern of preventive child health services.
Prevention Programme: Pre School
Ante natal care: Health Education and Surveillance during the
ante natal period is shared between Health Visitors, Midwives and doctors.
10th Day: Health Visitors take over their duties from
the Community nurses when a baby is 10 days
old; they visit the mother, giving support and advice and encourage attendance at well baby clinics for screening and at doctor's
surgeries for Immunisation. The family
doctor carries out a physical examination of the new born infant as part of routine
perinatal care.
Six Weeks: This should be followed with a second examination by a doctor at about six weeks of age. Health Visitors carry out periodic development checks
throughout infancy as part of their surveillance during continued contacts with the family.
3-9 months: It is recommended that routine primary immunisation against diphtheria, tetanus, whooping cough and polio should consist of three spaced doses of the vaccines at about 3,5 and 9 months of age.

20
8th month: Health Visitors carry out a developmental check
on all babies at Lukis House; hearing is tested
by the distraction method. If progress is in
doubt, the baby is referred to the Senior Clinical
Medical Officer, for an opinion.
13 months: Vaccination against measles by the family doctor is recommended.
3 Years: Health Visitors carry out a developmental check
including hearing and visual acuity and again
refer problems to the Senior Clinical Medical
Officer. The immune status is reviewed, parents are encouraged to finish incomplete programmes
and in particular to accept vaccination against measles, if this has not been done. Parents
are also encouraged to take their child to a Dentist for routine surveillance if they have not yet done
so.
At School:
4-5 Years: At school entry,every child has a routine physical
examination by the school doctor; the sight and
hearing are tested. A skin test for tuberculosis is carried out by the school nurse, who also checks
height and weight. Immunisation is reviewed, with
encouragement to accept boosters against Diphtheria,
Tetanus and Polio from the family doctor.
7 Years: The sight of all 7 year olds is checked.
10 Years: The school doctor carries out a physical examination.
Hearing and Vision, including colour vision, is tested A tuberculin skin test is carried out and negative reactors are vaccinated against TB. The school nurse
checks height and weight.
11 Years: Girls are vaccinated against German Measles.
13 Years: Vision screening is carried out.
15 Years: Each individual's state of health is reviewed and those requiring physical examination are seen by
the school doctor. Sight and hearing are checked.
The school nurse checks height and weight.
Girls who have missed Rubella vaccination are encouraged to have this done.
Health Visitors, school nurses and school doctors accept referrals
from teachers or parents of any child of any age where there is concern about health or development. The action taken includes investigation
of the problem, liaison with other professionals and in particular the
family, doctor,or referral for specialist help, as appropriate.

21
BIRTHS IN 1984 AND THE FIRST YEAR OF LIFE
There were 596 live births in 1984 and 3 still births.
There were 6 deaths of infants under a year old, 4 of which occurred in the first four weeks of life (neonatal deaths); these were all early
neonatal deaths, in the first week.
Perinatal deaths are those deaths occurring before parturition and within
one week afterwards, that is to say stillbirths and early neonatal
deaths. There were seven perinatal deaths in 1984, yielding a perinatal death rate of 11.7 per 1,000 births both live and still. These statistics compare favourably with those of England and Wales,
and are about half the figures of ten years ago.
Statistics relating to births and infant deaths since 1959 are shown in Table 2.1. It must be remembered that when the number of deaths
in a year reaches a very low figure, the death rates calculated from these figures may fluctuate widely from year to year. The neonatal death rate, for example, has fluctuated from 6.1 to 11.3 in the last 7 years, but does not indicate a dramatic deterioration or
improvement of services from one year to the next.
This table, taken as a whole, is however a remarkable indication of
the improvement in obstetric and perinatal care that has taken place over the past quarter century, and of the maintenance of a high standard of care.
It is salutory to remember that just over 50 years ago, in 1933, there were 9 maternal deaths, 30 stillbirths and 56 deaths of infants under
1 year of age, for a population three quarters of the present figure. The infant death rate was over seven times today's rate.

61
62
63
64
65
66
67
68
69
>70
71
72
73
74
75
76
77
78
79
180
81
82
83
22
7able 2 : 1
STATISTICS RELATING TO BIRTHS AND INFANT DEATHS 1959 - 1984 L
ive
Bir
ths
Bir
th
Rate
Male
Liv
e B
irth
s
Fem
ale
Liv
e B
irth
s
Sti
llb
irth
s
Infa
nt
Death
s
Infant
Death R
ate
Neonata
l D
eath
s
Neonata
l D
eath
Rate
Earl
y
Neonata
l D
eath
s
Earl
y
Neo
nata
l D
eath
Rate
Perin
ata
l D
eath
Rate
Mate
rnal
Death
s
709 16.1 385 324 14 14 19.7 10 14.1 - - - 0
769 17.56 364 405 17 12 14.30 10 13.00 - - - 0
757 17.20 388 369 19 16 21 .14 13 17.17 - - 0
797 17.83 401 396 15 15 18.82 9 11.29 - - - 0
842 18.55 455 387 13 24 28.50 21 14.94 - - - 0
891 19.33 453 438 7 19 21 .32 14 15.71 11 12.35 20.05 1
816 17.45 427 389 11 16 19.61 11 13.48 8 9.80 22.98 0
780 16.43 397 383 12 13 16.67 12 15.39 10 12.82 27.78 0
741 15.39 362 379 16 24 32.39 24 21.29 16 21 .29 42.27 0
752 15.40 388 364 10 16 21 .28 9 11 .97 9 11.97 24.93 0
830 16.75 424 406 8 14 16.87 10 12.05 10 12.05 21 .48 0
794 15.81 393 401 7 13 16.37 10 12.59 10 12.59 21.22 0
766 15.04 385 381 12 10 13-06 8 10.44 7 9.14 24.42 0
790 15.35 414 376 7 14 17.72 9 11.39 7 8.86 17.57 0
652 12.54 351 301 8 11 16.87 8 12.27 8 12.27 24.24 0
679 12.92 344 335 10 9 13.26 6 8.84 5 7.36 21.77 1
611 11.51 311 300 10 9 14.73 8 13.09 6 9.82 25.76 0
623 11 .62 326 297 7 9 14.45 8 12.84 8 12.84 23.81 0
587 10.82 315 272 3 5 8.52 1 1 .70 1 1 .70 6.78 0
582 10.71 298 284 6 9 15.46 4 6.87 4 6.87 17.01 0
646 11 .84 328 318 3 8 12.38 5 7.74 5 7.74 12.33 0
622 11 .65 339 283 5 8 12.86 6 9.65 4 6.43 14.35 0
619 11.62 335 284 5 11 17.77 7 11 .31 4 6.46 14.42 0
589 11.10 314 275 3 6 10.19 5 8.50 2 3.40 8.50 0
660 12.50 337 323 4 5 7.60 4 6.10 2 3.00 9.03 0
596 11 .18 299 297 3 6 10.1 4 6.7 4 6.7 11.7 0

23
Table 2:2
TOTAL LIVE BIRTHS 1984 (BY AGE OF MOTHER)
AGE-GROUP MALE FEMALE TOTAL %
15-19 26 22 48 8
20-24 78 78 156 26
25-29 106 105 211 36
30-34 61 65 126 21
35+ 29 26 55 9
300 296 596 100
Table 2:3
ILLEGITIMATE LIVE BIRTHS 1984 (BY AGE OF MOTHER)
15-19
MALE
20
FEMALE
11
TOTAL
31
%
33
20-24 16 18 34 37
25-29 9 4 13 14
30-34 3 3 6 7
35 + 5 4 9 9
53 40 93 100
Teenage Pregnancies:
There were 48 teenage pregnancies (8% of all births).
Almost two thirds (65%) of these teenage pregnancies resulted in illegitimate infants being born.
These 31 infants were therefore born with a number of risk factors - illegitimacy, a young and inexperienced parent,
often single, and with twice the chance of small size and
immaturity at birth (20% of illegitimate infants were under 5^1bs at birth, compared with 9% for all births).
Twins: Three pairs were born in 1984, compared with four in 1983.

Table
2:4
LIV
E
BIR
TH
S
CL
AS
SIF
IED
BY
BIR
TH
WE
IGH
T -
LE
GIT
IMA
TE
AN
D
ILL
EG
ITIM
AT
E -
19
84
24
9%
of
all in
fants
born w
eig
hed
less
than
2.5
Kgm
(5.5
1b
s)
at
bir
th
(UK ra
te
1% )
but
it
sh
ould
be
note
d th
at
20$
of
ille
git
imate
bab
ies
were
small
by th
is d
efi
nit
ion
.
25
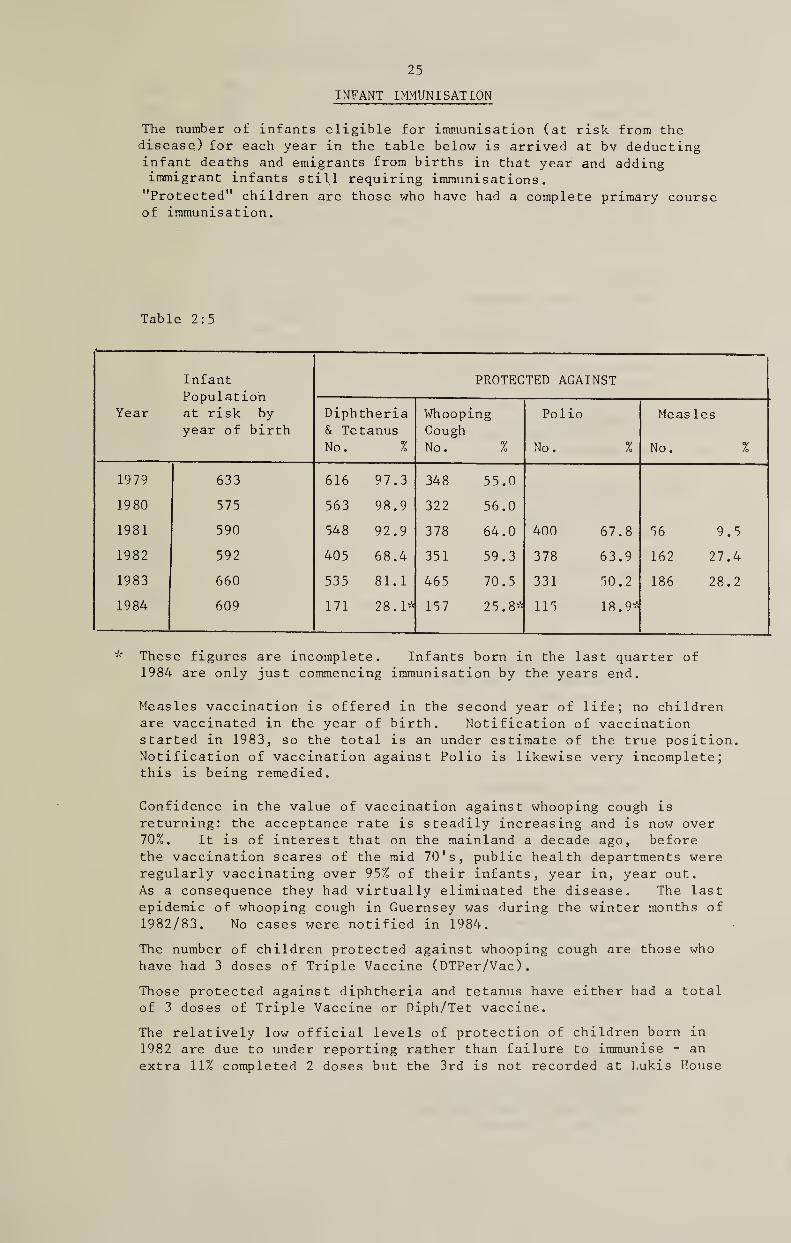
INFANT IMMUNISATION
The number of infants eligible for immunisation (at risk from the
disease) for each year in the table below is arrived at by deducting
infant deaths and emigrants from births in that year and adding
immigrant infants still requiring immunisations.
"Protected" children are those who have had a complete primary course
of immunisation.
Table 2:5
Year
Infant
Population
at risk by
year of birth
PROTECTED AGAINST
Diphtheria
& Tetanus
No. %
Whooping
Cough
No. %
Polio
No. %
Measles
No. %
1979 633 616 97.3 348 55.0
1980 575 563 98.9 322 56.0
1981 590 548 92.9 378 64.0 400 67.8 56 9.5
1982 592 405 68.4 351 59.3 378 63.9 162 27.4
1983 660 535 81.1 465 70.5 331 50.2 186 28.2
1984 609 171 28.1* 157 25.8* 115 18.9*
These figures are incomplete. Infants born in the last quarter of
1984 are only just commencing immunisation by the years end.
Measles vaccination is offered in the second year of life; no children
are vaccinated in the year of birth. Notification of vaccination
started in 1983, so the total is an under estimate of the true position.
Notification of vaccination against Polio is likewise very incomplete;
this is being remedied.
Confidence in the value of vaccination against whooping cough is
returning: the acceptance rate is steadily increasing and is now over
70%. It is of interest that on the mainland a decade ago, before
the vaccination scares of the mid 70's, public health departments were
regularly vaccinating over 95% of their infants, year in, year out.
As a consequence they had virtually eliminated the disease. The last
epidemic of whooping cough in Guernsey was during the winter months of
1982/83. No cases were notified in 1984.
The number of children protected against whooping cough are those who
have had 3 doses of Triple Vaccine (DTPer/Vac).
Those protected against diphtheria and tetanus have either had a total
of 3 doses of Triple Vaccine or Diph/Tet vaccine.
The relatively low official levels of protection of children born in
1982 are due to under reporting rather than failure to immunise - an
extra 11% completed 2 doses but the 3rd is not recorded at Lukis House

Table 2:6 26
ANNUAL STATISTICS FOR HEALTH VISITORS - 1984
1) Pre-school Visits: (4151 visits) 1984 1983
Primary 0-1 398 572 Primary 1-5 . 44 56
Re-visits 0-1 . 2321 3181 Re-visits 1-5 . 1388 1811
2) School Children: (76 visits)
Home visits . 73 92
School visits .4. 3 5
3) Visits to: (673 visits)
Families with problems . 225 265
The Elderly . 73 156
Physically handicapped . 16 19
Mentally ill . 12 6
Ante-natal .. 92 80
Hospitals . 45 20
Nursing Homes . 5 11
Playgroups . 36 4 Children's Ward Liaison . 31 43
Miscellaneous . 138 176
4) Infectious Diseases :
B.C.G. Programme: (30 visits)
M.P.T. 9 84
B.C.G. 9 46
Home visits . 12 26
5) Unsuccessful Visits: (no access) 815 816
6) Clinics: (674 sessions)
Maternity bookings . 107 219 Developmental screening. 322 342
Child welfare . 245 245
7) Health Education: (245 sessions)
Schools . 4 4
Groups . 7 3
Preparation sessions. 31 45
Parentcraft. 44 63 Relaxation . 40 77 Post-natal . 107 108
Film Evening..... 12 17
8) Meetings with: (377 sessions)
Medical Officer of Health. 68 31
School Medical Officer . 24 6 Health Visitors. 126 16
Group Practices . 102 60
Community Nurses. 6 1 Case Conferences . 7 16 Other . 44 64
9) Miscellaneous: (333 sessions)
Clerical. 208 163
Interviews at Lukis House. 82 102 Evening and Weekend visits. 12 35
Pupil Nurse Training . 31 35

27
Table 2:7
CHILD HEALTH CLINICS - 1984
Number of Clinics held and number of Children seen by Health Visitors at
these Clinics.
No. of Children seen
Clinics Held Number
0-1
Average per
Clinic
Number
1-5
Average per
Clinic
Brock Road, St. Peter Port 24 327 14 182 8
Cobo 52 1,300 25 462 9
Lukis House 51 1,240 24 314 6
L'Islet, St. Sampson's 23 627 27 223 6
St. Peter's 24 402 17 I64 6
St. Martin's 23 578 25 190 8
St. Sampson's 24 403 17 185 8
Wesley Church Hall,
St. Peter Port 24 194 8 141 6
Totals: 245 5,071 21 1,861 8
Total: 6,932 Children
5,344_1,900 1983 245 Total 7,244

28
HEALTH EDUCATION
This service involves an approach to individuals by Health Visitors,
School Nurses and Environmental Health Officers, as well as group
approach involving films and discussion, and teaching in schools.
Topics covered have included Glue sniffing, alcohol and drug addiction,
and the perils of hypothermia.
A States Committee was set up in 1983 to investigate ways of reducing
alcohol, drug and solvent abuse related offences. This Committee, on
which the Medical Officer of Health serves, has widened its mandate to
consider the broader aspects of addictive behaviour. It reported to
the States in February on solvent abuse, and recommended that the subject of Health Education should be included and given greater emphasis in the
curriculum of both Primary and Secondary Schools.
In December a Health Education Advisory Group was formed under the
Chairmanship of the Medical Officer of Health, with a membership
including the Director of Community Nursing, the Warden of the Teacher's Centre, the Senior Tutor of the Nurse Training School and the Senior
Clinical Psychologist. The remit of this group is to assist the Medical Officer of Health to recommend a policy to the Board of Health
and the Education Council on how best to develop a Health Education service. The prime need for a Health Education Officer became apparent
at an early stage, to act as coordinator and motivator, and it was hoped to develop links with the Health Education Council and with
Southampton Health Education Department.

29
FAMILY PLANNING
The Guernsey Family Planning Association continued
to provide a service which meets a very real need. Clinics are held on Wednesday evenings and on the first Saturday morning each month, at Lukis House.
The Clinic is available to the public both directly ( for those unwilling initially to consult their own doctor )
as well as to individuals referred by their doctor or Health Visitor.

30
NON - ACCIDENTAL INJURY TO CHILDREN
As a result of a case involving serious injury late in 1983,
an informal Child Abuse panel was set up in 1984. This panel
consisting of the Children Officer, a Chief Inspector of Police,
the Chief Inspector of the NSPCC, the Director of Community Nursing
and chaired by the Medical Officer of Health, met on a number of
occasions to coordinate the management of cases. The panel
considered the setting up of an 'At Risk' register, guidelines for
the management of cases, and the training requirements of staff.
In all, 17 cases were referred to the Chairman. In five of these,
the child was taken into care, and 10 had informal continuing
supervision and help from a Child Care officer, Health Visitor or
both. Two left Guernsey and came under the care of the Social Workers in England.

31
COMMUNITY NURSING SERVICES - 1984
1984 was the beginning of a change in management and structure
for the Community Health Services.
In April the Director of Community Nursing took up a new position
in the Community Services, and is responsible for District Nursing,
Health Visiting, School Nursing, Residential Homes and Alderney
Community Services.
This has been a very busy unit throughout 1984. A Child Health
booklet was designed and produced for new parents; also a leaflet
was designed, and produced informing parents of children that have
just started school on the role of the School Nurse.
A lot of time has been put into coordinating and producing the
Child Abuse Guidelines; at the time of this report it is still
being reviewed.
Negotiations have taken place with Jersey and the English National
Board regarding the feasability of Inter-Island District Nurse
training. This is still under review.
A Primary Health Care Team was established at St Sampson's Practice
of doctors and staff, and I am pleased to report this has gone very
well. We are hoping within the next few years to spread the Primary
Health Care concept to other practices.
Early in 1984 a Home Care Sister was appointed to look after patients
and families with special needs, these being patients with terminal
cancer
Also during 1984 the Community Midwife transferred to a base at
the Princess Elizabeth Hospital Midwifery Unit, so that she can be
kept up .to date with modern trends in midwifery and also work as a
team member.
Many meetings have taken place throughout 1984 to review community
aspects of the Geriatric Services - this is still under discussion
at the time of this report.
D. Jackson,
Director of Community Nursing

32
Statistics:
Comparative figures appear in the following tables:
Table 3:1
Community Nursing and Midwifery Visits
1976 1983 1984 % changes in
1984
General visits 23,184 49,872 49,468 - 0.8
Visits to 65 and over 18,680 42,507 41,996 - 1.2
% of visits to 65 and over 80.2 85.2 84.9
Twilight nursing visits none 9,020 8,300 - 2.4
Midwifery visits 1,961 3,989 3,623 - 9.1
Total visits excluding Midwifery visits 23,184 58,892 57,768 - 1.9
Overall total visits 25,245 62,881 61,391 - 2.3
.... 1
There was one home delivery in 1984.
Table 3:2
Patients
Patients Referred 1976 1982 1984
New referrals N/K 548 671
Existing patients n/k 388 448
Totals 600 936 1,119

33
THE ELDERLY
It is estimated that there are 8500 individuals over 65 years
of age living in Guernsey, of whom 3500 are over 75. This latter
group in particular are those who may require extra services from Community nurses amongst other professionals. Possibly half those
over retiring age and two thirds of the over 75's live alone. Community nurse's visits were slightly less in number than last year's peak. This is because they have concentrated their work on
those patients requiring nursing skills rather than simply a
supportive visit.
The working party on services for the elderly, consisting of
Senior members of staff from the Princess Elizabeth Hospital, King Edward VI1, the Catel Hospital and the Community Unit met
on a number of occasions to draft a report to the Board of Health. It is intended that this working party should continue in being as a planning team concerned with revision of this report and a
continuing review of collaborative services.
A start has been made in setting up a Geriatric Liaison team,
of staff from the King Edward VI1 Hospital and Community Services, to assist in the assessment and placement of the dependant elderly, and the provision of comprehensive care for them.
A Seminar on hypothermia was organised at Beau Sejour in November.
Dr Green, Consultant Geriatrician, spoke and answered queries on this topic.
Residential Homes
There are 8 licensed homes offering 179 places. Three new
applications for licence were approved in 1984
These homes are licensed by the Board of Health and inspected
at intervals by an Environmental Health Officer and by a member of the nursing staff. Draft guidelines were prepared for applicants intending to operate a Residential Home, but were not approved by
the Board of Health in their final form until April 1985.

34
TERMINAL CARE
The Board of Health established the full time post of
Home Care Sister early in 1984. Mrs Jones was appointed
in April, and undertook a period of training at Christchurch. By the end of the year she was working with 22 cases and had
43 referrals from five of the six Island practices. Her work involved a total of 481 visits.
Later in the year, two beds in the Princess Elizabeth
Hospital were reserved for Hospice type care. A further innovation was the introduction of the Syringe driver as a
means of providing continuous pain relief in the home as well as in the hospital.
During 1984, 145 patients died from cancer, compared with
155 in 1983.
There were a number of visitors from the mainland who met
staff and discussed the management of terminal illness.
The Guernsey Society for Cancer Relief, set up towards the end of 1983, played an active part in helping individuals in the Isalnd.

35
MEDICAL ADVICE TO STATES DEPARTMENTS
Civil Service Board.
The routine pre employment physical check of all States
employees was discontinued and replaced by assessment by questionaire,
with the medical examination of selected individuals when indicated.
This is in line with the present policy of occupational medicine
physicians. There has been in the past, and there still is today
in some quarters a firm belief that a regular medical check up is a
good guarantee of future health. This may be a very comforting
thought for managers, and indeed for individuals, but it may not be
true. It may also be counter productive in that it is a way of
delegating responsibilty for health onto somebody else (the doctor)
rather than facing the fact that maintaining a healthy life style
is one's own responsibilty. Routine medical screening programmes have been reviewed very critically over the years, with the conclusion
that they can easily become a mis applied preventive health measure.
There is certainly a good case for some selected procedures for some
selected groups, but repeated comprehensive whole population screening is costly, time consuming and ineffective.
Recommendations regarding early retirement on medical grounds
were submitted for 13 individual employees, and for 7 teachers.
States Insurance Authority.
Dr C.G. White was appointed as part time medical adviser , to
assist the Authority with medical advice on the clinical aspects of
cases applying for or receiving benefits.
States Water Board
In view of the steady increase over the years of the average level of nitrates in the water supply, the evidence regarding potential
harmful effects was reviewed. The conclusion reached was that the current EEC limit may be unnecessarily restrictive, and that the
local situation warranted careful monitoring but certainly did not
indicate the need for intervention or special treatment measures at
present.
Motor Tax Department.
There were 19 consultations regarding medical aspects of fitness
to drive.
In August new copies of the 1978 booklet "Medical Aspects of
Fitness to Drive" and additional advice about cardiac conditions and
epilepsy were circulated to all doctors. The UK relaxation of restrictions regarding drivers who had suffered from epilepsy (i.e.
allowing a return to driving after 2 years freedom from fits, rather than waiting for 3 years ) has been accepted as a guideline locally.
The control of drunken driving remains the single most urgent
and important medical aspect in the prevention of road accidents.

36
Control of Dangerous Drugs
The import, export, production, supply and possession of
certain powerful addictive drugs such as morphine and heroin, is controlled by law to prevent abuse and to ensure they are
used only for prescribed treatment.
The Medical Officer of Health on behalf of the Board of Health,
has a duty to inspect and sign import licences for Controlled
Drugs.
Table: 4:1
Misuse of Drugs Law 1974
Importation Licences for Controlled Drugs issued annually 1976-1984
1976 40
1977 80
1978 89 1979 82
1980 87 1981 117 1982 112 1983 117
1984 118
(from June 1st only)
The sudden increase in 1981 is explained by the development of a pharmaceutical manufacturing business which commenced production
of two preparations the formulation of which includes controlled drugs. The firm's requirements are imported in bulk periodically
as production requirements dictate, each importation requiring a licence. There are now 9 Pharmacists applying for licences.

Tab
le
5:1
NO
TIF
ICA
TIO
NS
OF
INF
EC
TIO
US
DIS
EA
SE
S
37
oo tr- 1 t- 1 •r- i 1 1 lilt cn CM ▼—
■*“
to oo CO CM 1 '4- ^ 1 1 T- 1 | 00 LO CM cn CM
CM 00 ,— CM C- T- 1 to CM 1 1 -r- 1 1 cn in¬ CM *“
to cn KN i cn CO t t 1 1 T- oo CM *— CM cn •.—
■*-
o ,_ F- 00 C\J 1 CM CO 1 1 T- 1 1 oo co T— to cn in *~
cn tr- to cn oo 1 1 LO CM 1 T— ,— | ^— cn VD CM
CD c- cn 1 1 00 LO 1 * ' ^ 1 C— *— C\J LO cn CM
t- to t- CO 1 1 to to 1 1 T- 1 1 tr- CM ir\ to cn LO y— «■*
co Ir¬ LO LT\ to 1 | T- to -r- 1 CM 1 1 en CM —
LO ir- to LTN C\J 1 1 T- LO 1 1 1 1 1 cn V- *— ^-
'M- CM t- cn C\J 1 1 1 to to 1 1 to 1 1 cn CM ▼—
T_ *"
CO tr- i *— 1 1 t <r- *— 1 1 CM 1 1 cn
CM c- i 1 1 CM 1 t 1 CM 1 1 cn
to
ir\
to
CM
00
00
CT\
Lf\
00
to
CM
tr- cn
t i to i i i t i cd i i i cn
o C- I I cn
CM I I I I I I I 00
cn CD till cn
i i i i iiic—
oo CD cn
I T- I I I I I I I I o
tr¬ ee cn
I CM I I I I I I
CD CD cn
LO CD cn
T- 1 1 «*— i 1 I 1 1 i 1 1
‘T—
D- CM 1 CM i 1 1 1 1 i 1 1 CM
0 CO p o •H 0 P CO > rP •H •H
A t»D 0 p H -P 00 a pH P p 00 cO ■rH 3 •H a> cO •rH rP 00 0 o p > CO Ph c •H o o •H a) o 0 •rH 0
CO h O 0 p O c O 00 •H U ,P > •H P Q> r—1
0 c O 0 Ph -p •H Ph P3 s c0 CO P CD •H Ph -P >> •H (0 -P CO •rH p O
i—1 Ph P -P o i—i O O 0 a) P p P CO o 0 cd A P 0 -P P ■p c0 cO 0 co o o CO P Pk cd Ph Ph P i—1 -p rO 0 Si o >> cO >> o P 0 O o cO 0 P s s P*H n Ph E-i CD M bP < <u SS Eh Eh
38
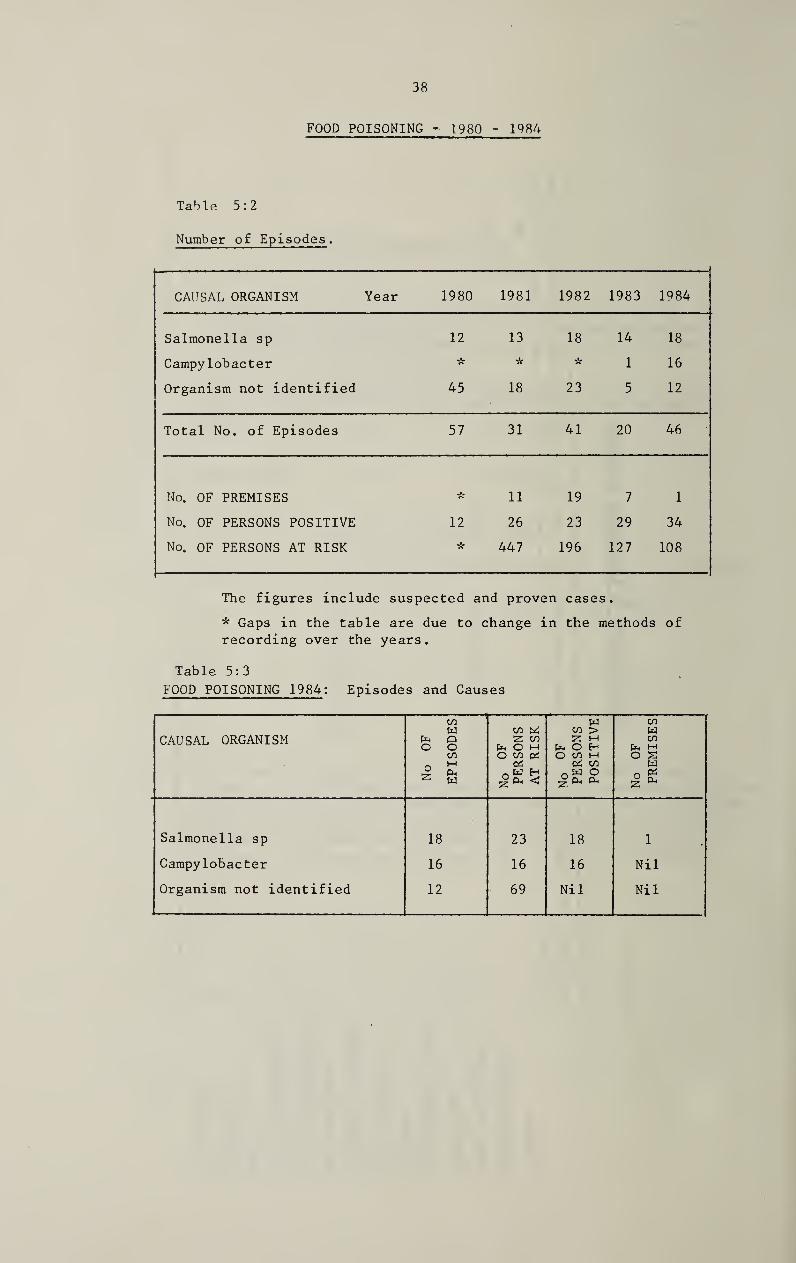
FOOD POISONING - 1980 - 1984
Table 5:2
Number of Episodes.
CAUSAL ORGANISM Year 1980 1981 1982 1983 1984
Salmonella sp 12 13 18 14 18
Campylobacter * k * 1 16
Organism not identified 45 18 23 5 12
Total No. of Episodes 57 31 41 20 46
No. OF PREMISES * 11 19 7 1
No. OF PERSONS POSITIVE 12 26 23 29 34
No. OF PERSONS AT RISK k 447 196 127 108
The figures include suspected and proven cases.
* Gaps in the table are due to change in the methods of
recording over the years.
Table 5:3
FOOD POISONING 1984: Episodes and Causes
CAUSAL ORGANISM
No
OF
EP
ISO
DE
S
No
OF
P
ER
SO
NS
A
T
RIS
K
No
OF
P
ER
SO
NS
PO
SIT
IVE
No
OF
PR
EM
ISE
S
Salmonella sp 18 23 18 1
Campylobacter 16 16 16 Nil
Organism not identified 12 69 Nil Nil

39
Table 5:4
IMMUNISATIONS GIVEN BY THE PUBLIC HEALTH DEPARTMENT
1984 1983
Rubella
B.C.G 689
310
820
378
320 Influenza
Rabies 7
45
2
Tetanus
Typhoid
6
1
1,006 1,572
In Guernsey, infant immunisation is given by the family doctors
and paid for by the Board of Health.
B.C.G. and Rubella is administered through the School Medical
Services and the detailed breakdown is given in the Annual Report
of the School Medical Officer for each academic year (not calendar).
Rabies immunisation is offered only to volunteers among Customs
officers and certain Harbour staff.
Fire service and some States personnel are kept under surveillance regarding their immunity to tetanus and boosters are given as necessary.
Travellers are encouraged to arrange their protective immunisation
with their own doctor, but advice about individual requirements is available from Lukis House.
The clinics offering vaccination against Influenza for States employees were discontinued. There is considerable doubt about
its value as a routine measure, though selected individuals may
benefit from this protection.

40
SEXUALLY TRANSMITTED DISEASES CLINIC
Dr. J. E. Strickland has submitted the following report:
Attendance figures for the year 1984
I have pleasure in presenting to you the figures for 1984*
The Male Section had slightly fewer new cases than last year, - 115 compared with 150, but the number of attendances was greater, at 265
(237 in 1983).
In the Female Section the number of new cases was much greater,
53 as against 32, as also was the number of attendances, 112 compared
with 45-
The total number of attendances, (male and female) increased
by 32% from 282 to 377. A disturbing factor was the very con¬ siderable increase in the number of cases of gonorrhea - male 33 (20) and female 20 (4). It is also noted that 9 of the female
cases were in the 16 to 19 year old group. This suggests that a more vigorous educational policy might be adopted in the schools, in particular stressing the effects of promiscuity and the symptom¬ less woman carrier.
It was also noted that there were more cases of gonorrhea con¬ tracted by residents from residents, 14 (6) in the male section, and 7 (0) in the female section. The customary lectures were
given as in the previous years.
Yours sincerely,
J. E. T. Strickland
Venereologist.

41
SEXUALLY TRANSMITTED DISEASES CLINIC. - MALE PATIENTS - 1984.
Table: 5:5
Cases: Total : 115
Specific Conditions
Infection Contracted :
between residents locally
between residents and non-residents
locally
by residents outside the island
by non-residents outside the island
between non-residents locally
Totals
All Cases
Status
Residents
Visitors
Visiting Seamen
Imported labour
Others not classified above
Totals
All Cases
Age Group
Under 16
Age 16-19
Age 20-29
Age 30-39
Age 40 and over
All ages
Total attendances: 265
Syphil
is
Go
no
rrh
oea
No
n-s
pecif
ic_
U
reth
rit
is
Oth
er
sexuall
y
transm
itte
d d
iseases
Mis
cell
an
eo
us
Condit
ions
Tota
ls
- 14 14 - . -• 28
9 14 - - 23
2 6 1 - - 9
- 1 1 - - 2
3 3 - - 6
2 33 33 - - 68
2 23 19 25 27 96
- 1 1 1 - 3
- 1 - - - 1
- 6 7 6 7 26
- 2 6 1 5 14
2 33 33 33 39 140
— - - - - -
- 5 6 3 2 16
- 22 23 17 25 87
1 5 4 11 7 28
1 1 - 2 5 9
2 33 33 33 39 140

1 42
SEXUALLY TRANSMITTED DISEASES CLINIC. - FEMALE PATIENTS- 1984.
Table: 5:6
Cases: Total : 53
Specific Conditions
Infection Contracted :
between residents locally
between residents and non-residents locally
by residents outside the island
by non-residents outside the island
between non-residents locally
Totals
All Cases
Status
Residents
Visitors
Visiting Seamen
Imported labour
Others not classified above
Totals
All Cases
Age Group
Under 16
Age 16-19
Age 20-29
Age 30-39
Age 40 and over
All ages
Total Attendances : 112
1
Syphil
is
Gonorr
hoea
No
n-s
pecif
ic _
U
reth
rit
is
Oth
er
sexuall
y
tran
sm
itte
d
dis
eases
Mis
cell
aneous
Condit
ions
Tota
ls
- 7 1 - . - 8
- 1 - - - 1
- 4 1 - - 5
- 8 1 - 9
- 20 3 - - 23
- 7 1 21 7 36
- - - - 1 1
- 5 1 7 4 17
- 8 1 3 3 15
- 20 3 31 15 69
- - 1 - - 1
- 9 - 3 1 13
- 9 - 23 10 42
- 2 2 4 3 11
- 1 1 2
- 20 3 31 15 69

43
Table 5:7
SEXUALLY TRANSMITTED DISEASES CLINIC
Cases Total New Cases of Attendances
Male Female Total Syphilis Gonorrhoea NSU Male Female Total
1972 211 40 251 1 90 95 1114 150 1264
1973 176 48 224 1 66 97 1003 183 1186
1974 194 65 259 3 90 93 974 227 1201
1975 190 83 273 18 81 89 898 321 1219
1976 172 62 234 6 70 43 899 186 1085
1977* 146 43 189 0 35 41 322 93 415
1978 132 37 169 1 32 28 330 82 412
1979 146 58 204 3 48 36 332 133 465
1980 158 56 214 2 49 40 337 97 434
1981 144 34 178 2 31 49 369 89 458
1982 132 45 177 0 36 35 243 77 320
1983 150 32 182 0 24 31 237 45 282
1984 115 53 168 2 53 36 265 112 377
* In 1977 statistics were computed in a different way, so that the
sudden drop in attendances only partly reflects the decrease in new cases
and the marked drop in repeat visits due to changed therapeutic regimens.
In addition to those cases attending the Sexually Transmitted Diseases
Clinic, 17 cases of gonococcal infection were confirmed by laboratory
diagnosis, from patients attending family doctors.
If the U.K. incidence of these diseases (1482 figures) were applied to
Guernsey, the expected number of cases would be over 500, but this would include a far greater diversity of conditions. The local incidence of Syphilis and Gonorrhoea is very similar to that on the Mainland.

44
THE WORK OF THE ENVIRONMENTAL HEALTH OFFICER
REPORT OF J.M. BAIRDS, CHIEF ENVIRONMENTAL HEALTH OFFICER,
FOR THE YEAR 1984
It is essential that standards of provision of service and the methods of working conform to statutorily defined limits.
The objective of the department is to ensure, by regular inspections, investigation of complaints and by education, that the harmful effects
of the environment are minimised
A total of 2118 complaints/requests were made to the environmental health officers during the year (an increase of 8% over 1983 and
17.4% over 1982) with an average of 8 being received each working day.
Dealing with these complaints/requests together with routine work involved a total of 8289 inspections and visits being made by health officers - over 30 a day.
Due to the ever continuing technological and scientific advances
and the ever increasing complexity of problems that arise, fewer routine inspections are being carried out each year, particularly with respect to hotels, guest houses etc which form part of the Islands major industries.
Work has been concentrated on those establishments where problems
are most likely to occur and where the results of low standards could have serious repercussions.
Table 6:1 shows some selected categories of premises together with
details of recommended numbers of visits to each type. Allowance has been made in the table for a 'risk-factor' ie the higher the
risk the more frequent the required visits. The final column indicates the actual number of visits made during the year.
It will be seen that actual inspections carried out are only 12.5% of the estimated minimum required.
This is the best that can be done with the existing number of staff when faced with competing demands on their time.

45
Table 6:1
ENVIRONMENTAL HEALTH DEPARTMENT - WORK LOAD
Type of
Premises
Number Recommended
Annual fre¬
quency- initial
visits
Total
initial
Visits
Estimated
No. of Re¬
visits Required
Total Estimated
Visits Required
Actual
Visits
in 1984
Hotels 140 6 840 600 1440 )
Guest Houses 219 2 438 200 638 J
58 )
208
Hostels 8 6 48 10
Public Houses 32 4 128 130 258 10
Restaurants 80 6 480 450 930 185
Bakeries 9 4 36 80 116 31
Hairdressers 60 2 120 40 160 2
Fish & Chip Shops 9 4 36 36 72 10
Take-Aways 8 12 96 60 156 21
Schools 32 1 32 10 42 1
Swimming Pools 84 6 504 300 804 95
Residential Homes 11 2 22 10 32 51
PIaygroups/schools 20 1 20 15 35 -
Mobile Food Vehicles 20 8 160 100 260 19
Totals: 732 2960 2041 5001 634
The work of the section is basically divided into two main areas: general
duties and food control. Details of the workload in these categories are
as follows:
FOOD CONTROL SECTION
A total of 966 complaints/requests (985 in 1983, 806 in 1982) were dealt with.
Details of the 4004 visits and inspections carried out are shown on Table 6:2
FOOD COMPLAINTS
A total of 117 complaints were received (107 in 1983, 85 in 1982); one was
resolved by formal action.
Foodstuffs voluntarily surrendered during 1984 included:-
Meat - fresh/frozen
- tinned
- products
Frozen foods 2070/
Fish 306 lbs
Liquids - 3039 Litres.
15571 lbs Fruit and vegetables - 3866 lbs
480 lbs tins - 1254 tins
166 lbs Dough 1450 lbs
pkts Cheese and fats 2748
Miscellaneous - 6399 623
lbs
items tins/packets
Food Poisoning
A total of 46 episodes of suspected food poisoning (including cases notified
by medical practitioners) were investigated by environmental health officers,
involving a total of 248 visits.
Investigations confirmed that of the 108 persons involved, 34 had contracted
food poisoning, the majority from infection locally. Details of suspected
food poisoning investigations during the year are shown in Table 5:2 on page 38.

46
Table 6:2
FOOD CONTROL: CLASSIFIED INSPECTIONS AM) VISITS
1984 1983
Hotels/Guest Houses . 208 219 Self-Catering . 9 8
Restaurants/Cafes/Etc... 186 215 Take-Away Food Premises . 21 8
Canteens . - 6 School Catering . 1 8
Hospital Catering . 11 3 Outside Catering . 7 2 Conference Catering . 6 18
Bakeries ..... 31 3? Confectioners (Bakery) . 3 16
Breweries . 4 7
Public Houses . 10 19 Grocers . 61 68
Greengrocers . - 3 Greengrocers (Wholesale) . 4 2
Confectioners (ice Cream/Sweets Etc) . 2
Butchers (Retail) . 45 41
Butchers (Wholesale) . 39 29 Fishmongers (Retail) .. 13 21 Fishmongers (Wholesale) . 1 11 Fish and Chip Shops . 10 15
Mobile Food Vehicles . 19 28 Cinemas/Clubs . 2
Packing Stations . Wholesale Storage Depots . 23 36 Kiosks (Beach Etc) . 28 18 Food Factories . 13 40 Vending Machines . States Markets .. 35 12 States Slaughterhouse . 4
States Dairy . 199 201
Milk Depots/Retailers . 31 15 Milk Hygiene Investigations . 158 245 Dairy Farms . 432 428 Registrations (Food and Drugs) . 2 5
Examination of Food . 210 189 Food Surrender. 229 285
Food Destruction (Supervision) . 244 291 Food Consumer Complaints . 117 107 Food Complaint Visits . 368 344 Suspected Food Poisoning Investigations . 30 33 Suspected Food Poisoning Visits . 248 143 Microwave Ovens (Safety Checks) .
Port Health - Docks . 213 15 Port Health - Airport . 4 2 Plans Inspected (Food Premises) . 56 66 Visits with other Departments . 23 29 Lectures (Food Hygiene) . 53 21 Alderney - Visits . 10 7 Herm - Visits . 7 7 Sark - Visits . 2
Non Classified Visits . 572 630
4004 3949 Total

GENERAL SECTION 47
1152 coraplaints/requests (962 in 1982, 998 in 1982) were dealt with.
Details of the 4285 visits and inspections carried out in this
section are shown in Table 6:3
Rodent Control.
In November Mr. Angel retired after 14 years' service. We wish him
well in his retirement after serving the department so faithfully for so long.
1579 complaints or requests for treatment were received during the year
(1925 in 1983 : 2128 in 1982) and an additional 1819 follow-up treatments were carried out by the Rodent Control Staff.
Category details were as follows:
Initial treatments:
Scheduled sector (domestic and States occupied premises)
659 complaints/requests - 41.7$ (38.0$ in 1982, 35«3$ in 1981)
Non-Scheduled Sector (commercial premises)
920 complaints/requests - 58.3$ (62.0$ in 1982, 64.7$ in 1981)
Follow-up treatments:
Scheduled Sector - 821 visits - 45.1$ (44.8$ in 1983)
Non-Scheduled Sector - 998 visits - 54.9$ (55.2$ in 1983)
A more detailed breakdown of the workload is as follws:
COMPLAINTS/ SECONDARY ADDITIONAL
PREMISES REQUESTS $ VISITS $ VISITS $ TOTALS $
GROWERS 631 40.0 403 37.8 264 35.0 1298 38.2 COMMERCIAL 58 3.7 39 3.7 20 2.7 117 3.4 FARMS 231 14.6 169 15.8 103 13.7 503 14.8
DOMESTIC 313 19.8 221 20.7 148 19.7 682 20.1
MISCELLANEOUS 346 21 .9 234 22.0 218 28.9 798 23.5 TOTALS 1579 100 1066 100 753 100 3398 100
A further 331 non-classified visits were recorded.
Disinfestations.
21 disinfestations of premises were carried out during the year (45 in
1983) either by rodent control staff or under the supervision of an
environmental health officer.
Noise Pollution.
There were 63 complaints relating to noise during the year (79 in 1983).
Alderney.
A total of 15 visits were made by environmental health officers on food
hygiene and general public health matters. These visits included an intensive operation on the rodent population following a similar exercise
in 1983- Unfortunately there will be little permanent improvement until waste disposal methods used on the Island have been improved.
Health Education.
A total of 53 lectures on food hygiene were given to students at the
College of Further Education.

48
Table 6:3
STATISTICAL SUMMARY OF GENERAL INSPECTIONS AND VISITS
1984 1983
Housing (inspections) . 700 779 Housing (Multiple Occupation) . 1 4 Housing (Overcrowding) . 2 12 Closing Orders . 5 10 Closing Orders Revoked . 3 13 Hotel Staff Accommodation . 21 1 Nursing/Residential Homes . 51 78 Hospitals . 1 3 Hairdressers . 2 9 Workplaces . 50 57 Factories . - 6 Schools . 3 9 Ships .. 2 Campsites . 6 20 Beaches . 1 5 Public Conveniences .. 18 13 Cemeteries/Crematorium . - 1 Swimming Pools . 51 95 Atmospheric Nuisances . 229 227 Atmospheric Observations . 474 202 Noise Nuisances . 63 79 Noise Observations .. 187 118 Refuse Accummulations . 270 220 Controlled Tips . 21 29 Verminous Premises . 66 119 Disinfestations . 2 14 Rodent Control . 102 153 Fumigations . 15 5 Non Public Health Pests . 30 45 Water Supplies - Mains . 61 53 Water Supplies - Private . 119 120 Water Samples . 88 117 Streams etc . 25 12 Drainage . 474 458 Cesspits . 44 23 Septic Tanks . - 2 Sewers . 12 29 Drain Tests . 6 18 Farms . 6 4 Piggeries . 14 2 Animal Boarding Establishments . Stables (Riding) ... Infectious Disease - Investigations . 4 11 Infectious Disease - Other Visits . 12 17 Home Safety . Health & Safety . 8 5 Pharmacy & Poisons . 1 3 Lectures (Health Education) .. Plans Inspected . 18 18 Visits with Other Departments . 4 12 Alderney Visits . 5 6 Herm - Visits . 4 3 Sark - Visits . - 3 Non Classified Visits . 894 695 SO Monitoring . 57 218 Asbestos . 53 39
4285 4194 Total

Table
6:
4
CE
RT
AIN
ST
AT
IST
ICS
RE
LA
TIN
G
TO
HO
US
ING
49
P •H O
•H 0 O -P
O CP E~- *— 1 i CP to CO 1 i in o e'¬ , i 1 £ 0 2 00 cn CO CM o ire CO t<n tO
•H CQ P C\J CM rH £-1 -P rH 3 CQ
<D O P £ o O
Pi O
CQ CD TO
•H 0 CP CTC O ■d" T— d- d- d- OO o en te\ CM CP rH CQ LP O O cn LPv p- LP Lf\ 00 o oo t— oo c~- 00 oo p- •H 2 T— ^— *— <1—
E O cd
TO CQ 0 tiO -P
O •H 2 Oh <7c CP to> LPv i 1 CO d- co d- 1 LCN i 1 o CP rH P C\J in P- 00 VO KN eo d~ ten r—1 -P
<D 0 £ P P O
o
O ▼— 0
-P r— LTv t<n 00 00 CM CM c— O t<n CM o N"C r- cn U VO tf\ P- o VO VO r- e- co Lf\ 00 CM CM CM e- 00 0 •rH cp CP KA CM CM CM CM CM CM CM CM t<n CM CM ,— CM
TO o £ p
0 -P
+ o •H LPv O T~ ■*— 1 CP 1 1 1 1 i t<n CM | CP *— O CM .— CP
P
p o
•H 0 0 p- to LPv o 00 00 o oo CP *— d- •d- r- O CP VO
O 0 C\J CM CM T— CM V— .— CM CM tO -d- ,— CM •H CO > O
W
0 -P 0 •H •H U rH O •H LPv E'¬ OO d- CM T— LPv CM T— CM 1 CM ,— to to\ VO LP
•H g P cO
P-. P
P OO en o CM CP IT\ VO c- CO CTi o CM CP cO VO CO p- P- P- p- e'¬ p- r- c- t- co 5 CO 00 00 0 CP Cn cp cn cp CTh CP en CP cr> cn cn OC CTc cn CP CP
▼—
indebte
d
to
the S
ecreta
ry,
Sta
tes
Ho
usin
g A
uth
ori
ty for
the
ab
ov
e
data
.

50
ALDERNEY -ANNUAL REPORT
Dr A. C. Mulvaney, Assistant Medical Officer of Health
in Alderney, has submitted the following report.
ANNUAL REPORT OF THE ASSISTANT MEDICAL OFFICER OF HEALTH
ALDERNEY FOR 1984
I have pleasure in submitting my Annual Report on the health of Alderney for 1984.
The number of births, viz 18, was average; however there was
double the number of girls than boys. There were 43 deaths similar to most years, but not 1983 which has proved to be, at
22 a very low death rate for the island. Variations in the cause of death showed a 50% rise in deaths from cancer. The average
death rate for the Channel Islands is 10 per 1000 population, the population in Alderney is just over 2000; Alderney therefore
has a death rate of 20.6 per 1000. There were 19 female deaths and 24 male deaths, this includes 3 women who died in the Princess Elizabeth Hospital, and one man who died in a road traffic accident in the United Kingdom.
Causes of death were as follows:
Table 7:1 Group Number
1 Infectious and Parasitic Diseases 1 11 Malignant Neoplasms 11 VI Diseases of the Nervous System 7 Vll Diseaes of the Circulatory System 17 IX Diseases of the Digestive System 3 X Diseases of the Genitourinary System 1 XVI1 Injury and Poisoning 3
43
Table 7:2
Age at Death
Total all ages
M F 45 - 64 M F
65 - 74 M F
75 + M F
24 19 3 3 12 4 9 12
The number of births in 1984 was eighteen, six males and twelve females; two were born in Alderney, the remainder in the Princess Elizabeth Hospital.
There were thirteen marriages on the Island
The number of births and marriages were similar to 1983
One only Infectious Disease was notified, viz Measles.

51
The Child Health Clinic had to be moved to the new nurses home
from the Senior Sisters bungalow. Developmental checks were made
at six weeks and eight months on eighteen infants, numerous other
examinations being made by the Health Visitor. Eighteen complete
courses of Diph/Tet/Whooping cough and Polio vaccines were given
to the infants, as well as 32 courses of measles vaccine.
Sixteen pre-school children were examined, given boosters against Diphtheria and Tetanus and Polio and all were Tine Tested and
found to be negative.
In all 64 school children were examined:
Infants 16
New entrants 9
Juniors 17 School leavers 22
Seventeen juniors were Tine Tested and fifteen negative reactors
were given B.C.G.
Ten girls (100%) at age 10/11 were given Rubella innoculations,
similarly four older girls who attended for their school leaving
medical. In all 22 school leavers out of 23 were examined and given boosters against Tetanus and Polio.
The States of Guernsey Environmental Health Officers continued
to visit Alderney, examining all premises providing food for sale
to the public. Energetic steps were taken to eradicate the rat
population by the laying of Zinc Phosphide in the sewers and the
Impot tip. A film advising on the eradication of rats was shown
but poorly attended. I feel sure that the public would appreciate being invited to co-operate with the Health and Welfare Committee
in the elimination of vermin but the latter prefer to deal with the problem through their officers in the hope of not giving the Island
bad publicity.
The Nunnery filter beds continued to malfunction but with the
arrival of a new States Surveyor more frequent twice weekly inspections will be made in 1985. Overflow from the sewers
adjacent to Braye Street frequently occurred. The pipe behind
the First & Last Restaurant overflowed three times before a brick
was located in the far end of the pipe. The sewage pumping station
behind the Divers Inn frequently stopped with the result that raw
sewage spilt out of the manhole covers behind the Divers Inn and
Sea View Hotel. An alarm system has now been fitted which gives immediate warning if the pump stops operating.
Four consignments of frozen food from the Guernsey cargo boat were condemned as being unfit and three parcels of food removed from shops
on the advice of the manufacturer.

52
Serious disquiet arose in the hot summer months amongst the
dockers regarding the' handling of meat, to such an extent that
a discussion group involving all those involved was formed.
Two main problems exist. Firstly, chilled goods sent from
Guernsey are in unsatisfactory containers, the problem compounded by the fact that the meat can be delivered to the Guernsey quay
well before departure of the boat and removed long after the boat has docked in Alderney. The second problem is in the transport of the chilled meat from the boat to the shops, especially in summer. At the moment meat is transported to the butchers in
open lorries. It was concluded that these problems could be solved by the purchase of a chilling compartment by the Alderney
Shipping Company which could be lifted directly onto a lorry for transport to the butchers shops.
The increasing cost of the Mignot Memorial Hospital continues
to give rise to great concern; it now represents 20% of the Islands expenditure and continues to rise out cf control of the
States of Alderney as the hospital is controlled by the Guernsey Board of Health. An ad-hoc committee has been discussing ways
and means of improving the situation but no firm answers were reached in 1984.
In 1984 the cost of the Mignot Memorial Hospital was £400,000,
out of an Island income of £2,000,000. 40% of Alderneys budget is spent on Social Services and the hospital.
Six hotels were inspected prior to them being issued with new Liquor Licences. Three public houses were examined following complaints from the public and steps taken to eliminate the
problems.
Camping behind Saye Bay has become very much more popular in the last two years and as a result the States have appointed a manager
and built two more public lavatories in addition to the existing two.
One small outhouse in the Marrette was condemned as being unfit for human habitation.
A full time District Nurse was employed and during 1984 the Health
Visitor also made frequent calls on the elderly. Home Helps were
provided by the States where appropriate and the W.R.V.S. provided meals on wheels. All these valuable services help considerably
to relieve the pressure on institutional services.

In the past I have been very remiss in not praising the
Island's entirely voluntary Ambulance Service, probably
the only one left in the British Isles. It is staffed
by members of the St John's Ambulance Brigade; for many years the lion's share of the service being given by Mr. S. Simon and Mr.D. Simon.
We were very sorry to note the departure of Miss B. Salmon
in November 1984. She has been nurse, midwife, sister, matron
and health visitor since she arrived in Alderney over 20 years
ago.
Finally I wish to thank the Guernsey Environmental Health
Officers for all their help in making visits to Alderney
in 1984.
Yours Sincerely
Adrian C. Mulvaney.

54
ANALYSIS OF MORTALITY STATISTICS 1984
The accompanying tables give details of all deaths in Guernsey
during 1984. ( Tables 8:1 and 8:2 ).
The average age at death was 71.1 for men and 77.1 for women -
a difference of 6 years.
Nearly one in every 5 deaths occurred before retirement age and could be termed prematurely early.
The major causes of death remain Heart attack and strokes - 44%
Cancer - 25% Chest disease - 15%
The major causes of cancer deaths differ between the sexes:
Men
Lung 39%
Bowel 14%
Prostate 13% All other sites 34%
Women
Lung 17% Bowel 15% Breast 14%
All other sites 54%
Nearly a fifth of the cancer deaths (27) occurred in the 45-64 age group, whereas 11% (33 deaths) of stroke and heart attack victims
were in this age group.
There was no marked change in the distribution of causes of death.
Tumours of the lung continue to be the largest single cause of cancer
deaths in Guernsey, and the largest preventable group.
The rate in women may have levelled off after climbing steadily for
the past 20 years and is now at about a third of the rate in men.
The latter has remained high but steady for the past 10 years.
The slow but steady increase over the past 20 years of deaths due to all forms of cancer is attributed to the increasing longevity of
the population.
Cremations are carried out in just under half the deaths, 240 residents (44% of the total ). There has been a steady 1% a year increase in this
proportion over the past 15 years.

55
oo cn
i CXI OO cn
x LU
OO
to ZD <
C_> X CO
Q UJ
CO to < _)
c—)
I
oo
00
G H rO cd H
(H oj P rH in co i rH O' lx o NO O' 1 i rH rH x- X* o rH O X to O' CM rH CM OO
E-< rH CM U~>
X oo O' rH O' CM i i rx CO CM o 1 i rH rH rH O rH tH LO co U-) rH rH ON
rH CM
S l NO rH i rH CM X oo N© CM 1 i 1 1 co X* co o OO CM co rH rH O'
rH CM
r—i 03 P rH LO to i NO o to o CM rH 1 i rH rH co co OO rH O LO CM O' rH CM rH rH rH X
E-i rH CM rH X
CO oo &H rH X rH i co o X rH o x- 1 i rH rH rH o NO O' o. rH to NO rH rH co rH rH co
JE i rH H- i co o rH O' CM 1 i 1 1 CM co CM X OO rH X X* rH rH CM
rH CO
rH oj P ^H CO O CO X X LO o rH o 1 i X U-) i X X o O X H OO oo CM CM rH CM CO H rH CM X
CM (Jh ■rH CM rH NO OO OO X* rH CM t i CO X* i co co co OO NO X co rH rH rH rH CM ON rH co rH
s l NO X CM 1 oo IX NO o OO 1 i rH i rH co IX co X- rH H o
rH co
73 G 73 Oj • • G 73 73 P • •
•H 3 3 X •rH 3
O O G • • *r"3 X • • s • • 73 • • > bO 3 73 G bO X <u 3 E Ch 73 3 3 3 •H E g Oj •rH Oj 3
•H X G • • 3 X O •• Ci 73 73 Oj 73 G 73 CO X o •rH G G G Oj •H G • • s 73 X 73 • • X rH • • O P 73 OJ •H 03 73 X a 73 73 a. •H XI T3 X • • G G rH 73 • • 3 3 73 P a Ci 73 73 73 •H 3 73 P o X oj •» •H X o G •H Oj X E G G •H 3 o o rH u p 73 X <U G •H o P Oj oj 3 o •• o oS Oj 73 X rH «H •H o, bfi X 73 73 rH G E •H <H • • g Oj X X
Oj Ci c 3 73 OJ X O' 73 3 E G 3 3 X 5 P <u G o •H p C O o X O 3 c G a> X 73 3 X 73 X 73 O X 3 p G •x oj c E 3 •H X Cl 3 •H oj 3
o X G X 73 Oj o P ch ch X •H 73 X •N 73 s Ci C •H •rH o rH O OJ 3 c G • • •H oj X o G •H P X Oj 3 o oj 3 73 o 3 P > Ci Oj 3 73 P 73 •H P
•H •H Oj 73 oj Oj •H 3 g o g •H a> <H 3 P Ci 3 •H rH 3 Ci P o •H o 73 3 73 G G G G G E Oj O P •H 73 p rH 03 g oJ X X G G o G P > c a. G •H 3, 3 G bC (D i •H P c X oj c Cl Oj 73 bO 3 E •H 73 3 73 rH G 3 oj s C G G 0) <U •H G o X •H o •H X G
M o w < s z X a: o o O CO « o a W <
H D, M rH W
HH M M M M > M hH
O M M W > M 1—1 M X H W W H > > > QC h-1 HI M > > > > M X X X X X X X X O

GU
ER
NS
EY -
DE
AT
HS
BY I.
C.D
. C
OD
ES
AN
D
AG
E
GR
OU
PS
1984
56
vo K\ tr- P <«- C\J t i LPv O d- oo
+ ^— ^—
LTN C- o CO cm vO cc
s 1 LTV 1 T- LT\ CM CO
P LPv LPv
| T- *— 1 1 r— MM 1 CO c-
LP CO LO o> VO g 1 C\J 1 1 tPv r-'
LPv LPv p- P I -r— t CM CM CM CP
vo
LO C\J vo g * 1 1 CM LP»
p 1 CM 1 1 1 1 1 MM
lA C\J g 1 1 1 1 1 tO 1 *—
p 1 1 1 1 , 1 1
, 1
CM
LPv g 1 1 1 1 1 1 1 1 1
Ph 1 __ 1 1 1 1 i 1
LO o g 1 1 1 1 1 1 i
« p 1 I 1 1 ,
1 i 1 1 H Pi -r-
g 1 1 1 1 1 ■ i
p CTi MM CM o
P •*- LPv CM 1 C- MM LPv vo < CO Eh P H
CM
O P O CO 00 vo co Eh < < g 1 00 T— CM CM MM VO
CM
P P s ■< T- LPV MM cr\ c~- O VO CM *< Eh LPv O'! CM MM « o O EH
CM LPv
CM
00
0 rH
Cd H
P Eh
P
P O
P co P < o
0 0) CQ cd CD GQ
•H Pi
o •H -P •H
GQ Cd P cd
P
a cd
T3 a cd
0 CD ra cd 0 03
O •H H O P cd -p 0 S
a cd
cd a o
•H -P •H
-P 2 P
3 0 1—1 0 o H & 1—1 £
M •H M 0 1—1 •H -P -P cd P •rH
P O P rH P o P P 0 P P- P o 3 O P O O o E
P C cd 0 p P w O M o P o P 1—i
P P O P o
03 P 0
u o CQ
O P o
a B 0 <u -p -p a 0 (0 0
a hs -p 0 CO CO 0
-p »>3 0 r^S Sh r?
CO
co O 0 0 -P -p >
0 cd cd •H 2 rH p -P o 3 •H 0 > O P 0 u u 0 0 •rH 0 •H
p O P P
0 0 0 0 P -P ■P -P -P
P P P P O O M O O
M M 0 M 0 M 0 X 0 0 > 0 > 0 M 0 0 0 0 0 cd PH 0 Ph 0 P-t 0 0 to 0 g> 0 B 0 0 O 0 O 0 0 0
•H « •rH « •H cd •H
P 0 P O P 0 P
cd £ o P T3 0
•H
P 0 o
NO
TE
: T
here
were
no
death
s
in
the 1-4
age
gro
up.

Table
8:2
co
ntd
. G
UE
RN
SE
Y -
DE
AT
HS
BY I.
C.D
. C
OD
ES
AN
D
AG
E
GR
OU
PS
1984
57
C*4 + in t---
cn
00
00 co r—1
VO
tr\
1
1
i 1
1
cn
CA
LPv
14
5
209
65-7
4
M
F
79
34
1
1
I
i
1
1
1
1
1
OJ 82
35
VO
lr\ S
co
VO
1
1
1
f
1
1
i
l
1
1 CM 48
38
to 1 l l 1 1 1 to
LT\ CM S 1 1 l 1 t CM CO
i i 1 1 1 CM CM
lA s i 1 i i i 1 LPv LPv
ph i 1 1 i I 1 ^_
i Lfh o s """ i l i l 1
'
K Ph i i i i ^- i CvJ W Pi t-
§ S ' i 1 1 tA 1 -
o o P Ph VO CO *— ▼— ^— T— E~- cr> -d co CM CM Eh P H O P U 00 E <1 < S VO CA i i CA ac
CM eg
P P 25 *d CM cn O T—
<d EH CA CM oo « O LPv LA O Eh
w Eh
P
T3 Pi
1* U O
pH
T3 CD
•rH Pi Sh cd o
B a)
•p m
co
a> > •H -P O a> C C o o •T3 c a]
B CD
-P 0) >.
CO
cd -p
cd -p cd C
•H P a>
Ph
0) ,3 -p
tjo cl
•H -p
pH (0 CD cd a) O 3 (—! a Pi
•H CD ta •H i P3 u X CD ttf) i—i CO 3 tn •H •H i—i P o o -P U hH <d -p o •H O o •rH ra r-H p
3 3 cd GO P •rH <D £ s 0 cd pi O p O o
CD o •rH CQ CQ <d P 3 4-> a •rH p -P P •H o -p < TJ •H Ph
G CO Ch M O i—1 O M P o M > cd O M M Pi
M ra M -p > > CQ > cd X a> X CD X •rH X PI 0 X
m m <D Pi •H T3 o pH cd P cd 3 PL, CD cd o Ph -F> PH {h p CD P CD m B t|D B -p •H B P 3 o m O w m o 3 o o a o •r-3
Pd •H Pd •H •H Pd O « Q) 0) « >* « 3 o P CD P Eh C3 o CD o Ph o CO o M
CO 0 O
•rH -P •H
O O T3 0) a
•H <H
cd -p o
Eh
NO
TE
: T
here
were
no
death
s
in
the 1-4
ag
e
gro
up

58
Li_ r- O O CO
IT) -3" CO
CO «—<
CD
«—( 21 CM cc LO <3-
r> r-H CM
.
<v CD CO
03 OO U_ CO LO CO CO
t- 1 LO -3-
0) CD r-H
> r-«-
< 2: 00 <3" CO CM
CM
T-H
Ll_ 0 CO <3-
CO *—* CO <3- LO
CO r-H
CD
r-H 2: CD LO LO *—1
CM <3-
u_ LO , CO CO
CM LO <3-
00 r-H
CD r-H 21 CM LO CO 1-
r-H CO CM co 1 I
Ll_ CO CO CO CO
r-H LO CO
OO r-H
CD
*-H 21 r—• CO 1— r-
rH OO CM LO
Ll_ OO CO CO
O LO LO -3-
OO r-H
CD
*—• 21 CO 1— OO
CO CM r-H
r-H
U_ <1- 03 r-H
CD r-H LO CO LO
r*- r-H
CD
r-H 21 CO CO CO co
CO LO r-H
03
(-
3
CO
CO
03 -—^
c_ =
Cl (O
03 •---
-O • rH r
O C_ CO
O 03 03
r—t C JC
CO O O
= c_ t_
'—• 0 4-3
_c 0 CO
4-3 03 r r
03 co >—■ • >—-
03 03
O 03 03 03
CO CO CO 1
U- • r-H 03 03
O -O 03 03
CO CO
03 4-> • rH . rH
CO £_ “O “O
3 03
03 03 4-> c_
<_> _£Z C- 03
03 r-H
03 03 3
> _c O
• pH CO
CO 0 03
c • «H >
03 e O
4-> 03
£_ 03 _Q
03 JC 03
CL O t_
>> CO 03
in O
HH
l—t
>
. Q_ CO
Q CO <3- OO ZD LxJ
• 03 0 r-H CO O Q
C_3 “O <3- cr O
• O 1 1 1 0 C_)
M CJ> 0 O O
0 r-H CO _1
-d" _1
L

59
cr oo cn
i
CD r\ cn
cn >
go
> ca o l— < cc
CL cn LLl
or
o cn LU cn < LLl cn ►—i
CD I
O or
CD
<1-
oo
<U T“—I
n a) H
u_ O CO CO CNJ
^4* CO LO
CO
cn
<—i 21 cn 1 CO 00
T_* CO
<d u_ O -4- CO 0
cn co r—L <4
cs oo
C- l
<i> cn
> r*. CNJ LO LO
*=t ~4-
u_ ON cn <4
CO CM CO
GO
cn
*—< s: iTi CO LO cn r—4 fH -4"
u_ co CNJ CNI <4
CNI CNJ CO
CO
cn
«—• s: CNJ 1 CO CO
CNJ <4
Lt> LO CNJ CO CO r—i CO
CO
cn
«-< ^4" 1 CO <4
— CO
u_ CNJ 1 r"-
0 *—1 CO
CO
cn
«-* 2: CO r—i O CO
—• <r
u_ CO r- ~4- co
cn r—i CO
r»-
cn
^ z: CNJ CO CNJ 00
CNJ
(O
E
CD
-O cn
(D >>
• r-i -C
c+— CL
• iH E
O CD
CD
_c Q- -O
4-> cn C
03 c CO
CD 0
Q cn
•* • rH
u- CT3 4->
0 • r-C • rH
c -C
CD 0 0 cn e c
0 3 0
03 CD c_
C_3 C ro -Q
CL M
O c O
-C CD • •H
O O c
c r—1 0
0 <4— £_
£_ C _C
CD h—t CO
Q_ CO
Q cn ZZ) LlJ
• CD CNJ O Q
C_J -O LO cn cn 0 1
• 0 CO 00 <4 CD c_>
•—1 C_3 -4" >4- 1 I 'H _1 t—t
cn _1 ►*—c
<c t-H
■1 — >

DE
AT
HS
DU
E
TO
SOM
E
VIO
LE
NT
OR
AC
CID
EN
TA
L
CA
US
ES
19
79
- 1
98
4
60
• CO co oc o-n UO CO
1
O'
Q <U CO vO CO UO oc
• no oc 00 00 00 O' O'-
C_> o • u 1 1 1 1 1 1
M
o o o c o o G CO UO 00 r—4 UO 00 00 oo 00 On CO o>
w [d pa w pa w pa
Pm r—4 1 , 1 1 vO
00 O' 1-1 s CO 1 i—1 1—1 CM CO 1 G
i—4
Pm r-4 1 CM 1 1 1—1 i <t CO oc O'
£ CO 1 1 CM «—i CM cc
pH CM 1 r—1 CO r-—1 <r i—1 CM
CM r—4
00 O' p ”’l s CO 1 CM 1——1
1 CO 1 O'.
p4 1 1 1 si 1 1 1 T—H 00 O' G r—1 s CO 1 i—1 «—1 1 co CM «—4
pj 1 1 1 *—1 UO t—l r-
o 00 o i—4 s 1 1 CM 1 1 co 1 UO
p-t *—I 1 r—4 CM 1 CO 1
o
o^ i“4
i-H s CO CM 1 CM 1 1
r—1 t—4
cd 4-J
c c CD o >, X5
•H u • r4 CO 3 o
44 •«”5 o
c •0) c cd CD B •H
X? p
X • H 3 x) CD 4-) a CO CO a) rC CO o 4-J 4-J 4-J
a) cd G no o (D
o <D c •H JZ -a o X) cd T—1 3 a)
44 • H • H 60 44 4-J
o 4-1 a c 60 e X) CJ 4-4 o •H1 c ♦ H a) »H
<D X cd C •H 1 C 1-4
CO p o CO c 4-1 • r4 44
2 44 4-J CO t—1 s r—1 E C cd Pi • r4 p—4 o CD P * r4
u (1) O o cd p CO CD i—4 o. a- 4-4 X3 4-J >D o CO XJ CD t-4
• H C >—i r—1 t—I c -a <u
x cd cd cd cd cd 3 cn 0) P 4-J 4-J 4-J 3 O > 4-J c c c (D O. ••
CD <D (D X3 >» u CO
p P X3 X) xd • r4 P 0 i-4
o CD • H • H • r4 o 3 a cd 44 4-1 O U o • H * ’ 1 44
o cd O O u 2 3 Jm O
:s & < C < CO M O H
• CO _! 01 i——1 CO r——1 C
• X) 00 o CM vT
H O <1* UO UO uo uo • CJ w pa fd pa pa P3 pa
PQ

61
00 o
i o
O'
CO 2 ta u 2 < o
ta 2 o co
co 2 co < H IX o ta 2
(X 2> O Ci o
v£3
oo
0) 1—I XI co H
o o O'
<1- pLl CO r-H CO r-H oc co i T—H UO uo 00
O'! CN) r-H vO t-H iH 2 t—H r—H IT) CO i i r-H r-H 00
CD CO CN] i—H
00 00 Eu CN r-H CN CO r-H r- 1 CN vO 03 r-H
U 1 CD <f r-H
> O' 2 CO vC o CN 1 i <C
CN] «-H
CO pH co r—H CO r—H i—H L/O i CN UO
oc uo o CN 1^- o t—H r-H f“H CO vO r-H IT CN 1 i r-H 1 00
CN c o c CN fa CN r-H r-H i—H r—H 1 1 CO oc <fr o o CO vD r-H r-H CO r-H O' CN CN 1 i UO r—H
CN CN oc r—H fa r-H r—H i—H 00 r—H vO 1 CN l/o v£5 00 CO O'. uo oc r-H
r—l 2 uo o <1- CN 1 1 vD 1
co r-H CO o 'Ct o fa CO r-H CO i—! r-H i—H 1 CO vO 00 O' o> CN r-H
r-H vO v£) r-H 1 '
If' o <!■ o fj-l CO r—H r-H O' r-H i r—H v£) O'
CN O' o uo t—H t-H 2 CN co CN co 1 1 CN
03 3
X o X c • H o > a Vj
03 Xl CD 3 CD O 60 c 03 <D cd X •H cd cd r. 4-J
X a 4-J CD CD 4-J 03 cd X. Cu cd 03 a X 03 3 4H
4J o 6 CD o o cd a 03 cd 03 o 4-) c cd <D <D o CD CD 4-J c cd a u -U a o o 03 •H Cl 4-J X 0 a-
<4-1 UH UH UH UH Uh UH Uh Uh
o o o o o o o o o
<D e 6 B ✓"N B B B B B 03 03 03 e 03 03 03 03 03
p cd cd cd 3 Cd cd cd cd cd r-H r-H r-H 4J r-H r-H r-H r-H r-H
o a- a a. o CL o. Cl a 3. o o o CD O o O o O (D CD CD a CD CD CD (D CD c s c c c C 3 CD 3
60 cd 4-J 4-J 4-1 e 4-J 4-J 4-J 4-J X 4-J cd c s c • r-l s c 60 3 3 <D 3 • rH
cd cd cd X cd cd 3 cd cd C cd B •
c C 3 a c 3 3 3 C 00 3 CD CO 60 60 00 r-H 60 60 r-H 60 60 cd 60 cd 2
•H • H • rH u • rH •rH • H • rH »rH X H r-H r-H r-H c t-H r-H X r-H r-H X r-H 3 < cd cd cd • rH cd cd 3 cd cd 3 cd <D ta 2 2 2 S—' 2 2 cd 2 2 cd 2 ►a O
oci ta CJ
CO 2 • 03 uo 00 o c/d C
Q 0) t—H i—H CN X O • X 1 1 1 <
V o o r-H CN) CN o uo H 2 • CJ m I/O I/O uo 00 oc o o hJ
1—1 r-H r-H r-H r—H r-H i—H r—H t—H CN H
1
No
te:
The
fig
ure
s
at
the
foo
t of
each
co
lum
n are
no
t to
tals
of
the
fig
ures
ab
ov
e
bu
t th
e
tota
l of
all
can
cer
death
s
at
all
ages
for
the
year
giv
en.

62
Table 8:7
MORTALITY - CANCER (ALL FORMS) 1961-1984
Death by year and sex, rates per thousand resident population
PERSONS MALE FEMALE
Year Deaths Rate/1, 000 Deaths Rate/1,000 Deaths Rate/1,000
1961 98 2.23 40 1 .89 58 2.54
62 117 2.62 62 2.88 55 2.37
63 100 2.20 60 2.75 40 1.70
64 100 2.17 51 2.30 49 2.05
65 104 1 .22 65 2.89 39 1.61
66 127 1 ,68 72 3.15 55 2.23
67 114 2.37 68 2.94 46 1.84
68 124 2.54 69 2.94 55 2.17
69 121 2.44 63 2.64 58 2.26
1970 91 1 .81 59 2.44 32 1 .23
71 149 2.93 88 3.59 61 2.31
72 131 2.55 74 2.99 57 2.13
73 129 2.48 65 2.60 64 2.37
74 137 2.61 69 2.72 68 2.50
75 142 2.67 77 3.01 65 2.37
76 139 2.60 70 . 2.70 69 2.49
77 158 2.91 98 3.74 60 2.14
78 131 2.41 71 2.71 60 2.14
79 129 2.36 65 2.47 64 2.37
1980 147 2.75 72 2.80 75 2.71
81 136 2.55 78 3.03 58 2.10
82 143 2.68 av 76 2.95 av 67 2.43 av
83 155 2.90 2.7 81 3.15 3.05 74 2.68 2.4
84 145 2.7 86 3.34 59 2.14

63
Table 8:8
MORTALITY - CANCER OF TRACHEA, BRONCHUS AND LUNG - 1965 - 1984
Guernsey deaths and rates per million resident population, compared with
rates per million published for England and Wales, (England and Wales
data from O.P.C.S. Quarterly publication "Population Trends").
(Rate/M = Rate per million)
PERSONS MALE FEMALE
Deaths
Rate/M Guernsey
Rate/M
E & W Deaths
Rate/M
Guernsey
Rate/M
E & W Deaths
Rate/M
Guernsey Rate/M E & W
1965 22 470 563 22 978 958 0 - 168
66 29 611 573 20 876 969 9 365 178
67 26 540 596 24 1 ,056 1 ,005 2 80 189
68 21 430 606 18 766 1,015 3 118 198
69 25 464 622 20 859 1 ,045 3 117 202
70 20 398 631 18 745 1,049 2 77 214
71 59 766 637 36 1 ,470 1 ,052 3 114 222
72 57 719 642 31 1 ,252 1,074 6 225 233
75 52 615 651 26 1 ,058 1 ,082 6 223 242
1974 50 571 668 22 869 1,099 8 294 260
75 52 603 665 25 976 1 ,084 7 255 267
76 28 522 678 22 849 1 ,105 6 216 274
77 40 737 687 34 1,297 1,109 6 214 287
78 54 626 695 28 1,067 1,112 6 214 299
79 57 678 702 30 1,158 1,115 7 248 312
80 50 562 709 19 758 1,109 11 398 330
81 53 619 700 25 975 1 ,088 8 290 331
82 39 732 702 29 1 ,128 1,075 10 363 348
85 38 713 716 27 1 ,050 1 ,096 11 399 356
84 44 825 708* 34 1 ,522 1,067* 10 362 373*
Ten year averages
1965-74 558 619 1975-84 661 696
(+18$) (+12$)
987 1 ,054
(+7$)
1 ,054 1,096
(+6$)
161
296
(+84$)
211 518
(+51$)
* Provisional figures.
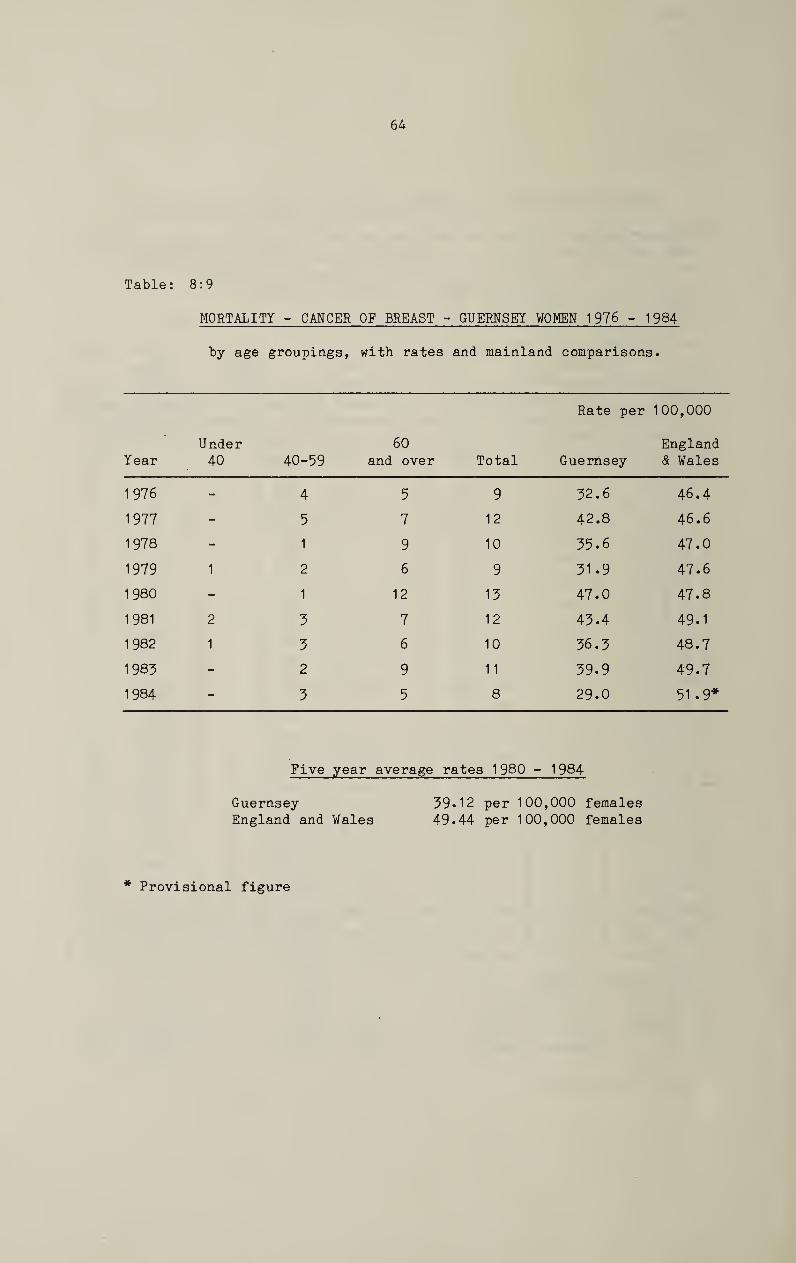
64
Table: 8:9
MORTALITY - CANCER OF BREAST - GUERNSEY WOMEN 1976 - 1984
by age groupings, with rates and mainland comparisons •
Year Under
4° 40-59
60
and over Total
Rate per
Guernsey
100,000
England
& Wales
1976 - 4 5 9 32.6 46.4
1977 - 5 7 12 42.8 46.6
1978 ' - 1 9 10 35.6 47.0
1979 1 2 6 9 31.9 47.6
1980 - 1 12 13 47.0 47.8
1981 2 3 7 12 43.4 49.1
1982 1 3 6 10 36.3 48.7
1983 - 2 9 11 39.9 49.7
1984 - 3 5 8 29.0 51 .9*
Five year average rates 1980 - 1984
Guernsey 39.12 per 100,000 females
England and Wales 49.44 per 100,000 females
* Provisional figure

65
w + O m < ^
w o i
<c m vO s
^4 w X
o 1
< in S
p4
w O i <c in
CN Vr-< <->
Pn w CN
o I
< in S
I I i-H I I I I
I CO CM H | I I vO
CO
03 00
00 On
CO X H < W O CO H 5z w Q M CO
W Od
I
o
>< w CO :z
w D o
CN
w o <
hJ < H O H
co
co O W CO O c* <3 W
P-.
<C H O H
co [xJ
o <
I I I I I I I
»-H vD in <—l '—I t—l OJ
r-4 CO | i—4 I |
r-4 m CN r-H I rH (NJ r-H
in CO
\£>
O' CN
00
CD r—I
XI cd H
co <D 4J •H
CO
X CD C
• r4 CD 44 CO
CD cd X) CD
1 CO CO r—4 • r4 CD i—4 X CO CO
42 • r4 CD 3 o 4J • H cd cd Sh CO 3 >-i u c o
e CD e CD O Cfl (D o 42 cd CO •H CD ■u o r—l
o 4-1 4-1 60 cd J-i JZ CD u c 60 cd M CO o u CD a 60 cd C (2 H O CO J-i o cd c 3 Vi M 44 M—1 • H Cd -H 42 r-4 3 r-4 CD n o o a) X 6-1 £ U cd 4-» z > C (0 u t-i CD X X o e E • H 4J •H cd o 43 CO c CD o CO CO 4—1 J-4 42 E CD 3 cd
cd cd CO cd i-H CO CD p cd Vi T—1 r-H CD <D Cd -H cd CD E o 4-1 CD a- a 60 42 • r4 sz U CO 3 43 o o •H X) o CD •H #v cd 4-J CD CD X <D J-i •H Vl X M-4 42 (U O c c > (0 3 3 •H o 3 4-J x.
0) * H o o r-H o CD cd T—1 44 4J 4-J 42 «—H CO O 3 • H c (2 3 r—4 CD r—1 o o
i—4 c c 4-1 i—4 c >3 X cd 42 O cd > X > 4-J *-4 cd cd >■ CD E o 44 o • H X X CO
e c C 4-1 cd CO o c X 4-J
Pu 60 60 •r4 Pl. u <D *4 4-» 3 • r4 PU CD Ph Vi a 23 • H • H 42 23 CD 4-» CL) u cd r—1 4-1 3> ,ra 2p 3 CD o i—4 t—1 4-» o ex 3 42 cd 4P O Vi O X O •<—) 44
cd cd • H pi X O 4-» CD 3 o O & 3 c 44 o s s > o 22 < o 22 CO o < o CO o M w
o • CJ o ON CN O O- 00 o i-H cc •-I M 2 in in o t-H r—1 CN CO CO vt O' N3 O'
rH r—1 00 O'

>1 — .
y ffi


Europrint