of prime lending rate of different exim banks under export ... · “analysis of prime lending rate...
TRANSCRIPT

Page | i
Summer Internship Report
on
“ANALYSIS OF PRIME LENDING RATE OF DIFFERENT EXIM BANKS
UNDER EXPORT CREDIT AND PREPARATION OF FINANCIAL MODEL FOR 1MW
SOLAR PV PLANT FINANCED FROM DIFFERENT COUNTRIES”
VISWA SURYA ENERGY SOLUTIONS, Andhra Pradesh
Under the Guidance of
Mr. Alladi Raghavendra
Managing Partner
Viswa Surya Energy Solutions
Submitted by : Eshan Singh
MBA (Power Management)
Roll No. : 30
(Under the Ministry of Power, Govt. of India)
Affiliated to
MAHARSHI DAYANAND UNIVERSITY, ROHTAK
September- 2013

Page | ii
DECLARATION
I, Eshan Singh, Roll No 30/ Semester III/ Class of 2012-14 student of MBA (POWER
MANAGEMENT) at National Power Training Institute, Faridabad hereby declare that the
Summer Training Report entitled – “ANALYSIS OF PRIME LENDING RATE OF
DIFFERENT EXIM BANKS UNDER EXPORT CREDIT” is an original work and the same
has not been submitted to any other Institute for the award of any other degree.
A Seminar presentation of the Training Report was made on _______________
_____________________ and the suggestions as approved by the faculty were duly
incorporated.
Presentation In charge Signature of the Candidate
(Faculty)
Countersigned
Director/Principal of the Institute

Page | iii
ACKNOWLEDGMENT
At the outset, I am highly obliged to Mr. S.K Chaudhary, Principal Director (CAMPS)
NPTI, Mrs. Manju Mam, Director NPTI, and Mrs. Indu Maheshwari, Deputy
Director NPTI, who gave me the opportunity to do summer internship in an rapidly growing
company like Viswa Surya Energy Solutions. I would again like to thank my internal Guide
Dr. Rohit Verma, for helping me and guiding me throughout my project.
I thank my Project Convener Mr. Alladi Raghavendra, Managing Partner, Viswa Surya
Energy Solutions, for giving me the opportunity to work on such an insightful project.
I would like to extend my thanks to my Project Guide, Mr. Ankit Singh, Associate Consultant
(Finance), Viswa Surya Energy Solutions for their continuous and keen guidance, which paved
the way for successful completion of this project.
I would also thank Mr. Rakesh Kumar, Associate Consultant (Business Development) for
constantly guiding and solving all my queries throughout this project.
I am grateful to my friends who gave me the moral support in my times of difficulties. Last but
not the least I would like to express my special thanks to my family for their
continuous motivation, encouragement and support.
Eshan Singh

Page | iv
CERTIFICATE

Page | v
EXECUTIVE SUMMARY
Today the major problem solar developers are facing is the high cost of generation. The
tariff bids have reached at the level of Rs 8 and below. To compete with such low tariff bids cost
of generation should be minimised. Major part of project cost is covered by the Solar panel cost,
if this cost can be minimised then total project cost can be minimised.
Since the availability of sun is uncontrollable so improving the generation is quite
difficult and expensive. If we decrease the annual expense instead of increasing the generation
then also tariff can be brought down significantly.
Major constituents of cost of generations are depreciation and interest if we can reduce
interest payable on debt amount then the cost of generation can be reduced to a significant and
competitive level.
Foreign Solar panels are cheaper than those produced in India. Also if we are importing
goods from some country then we can apply for EXPORT CREDIT FINANCING which is
cheaper than the finance available through Indian financial institutes.
Prime Lending Rates in India are near about 13%. Interest paid on debt is a cash outflow and is
included in cost of generation. Such high cost of debt elevates the Levellised Tariff of Solar PV
Plant.
Finance from Foreign institutes such as ExIm Bank’s reduces the interest rate of debt and
hence decreases the total outflow of cash resulting in low cost of generation.
This project is the study of Financial Terms and Conditions for Export Credit Loan and
comparative financial analysis of 1MW SOLAR PV PLANT model financed from China,
Finland, Germany, Japan, Singapore, Taiwan, Thailand and United States of America.
Page | vi
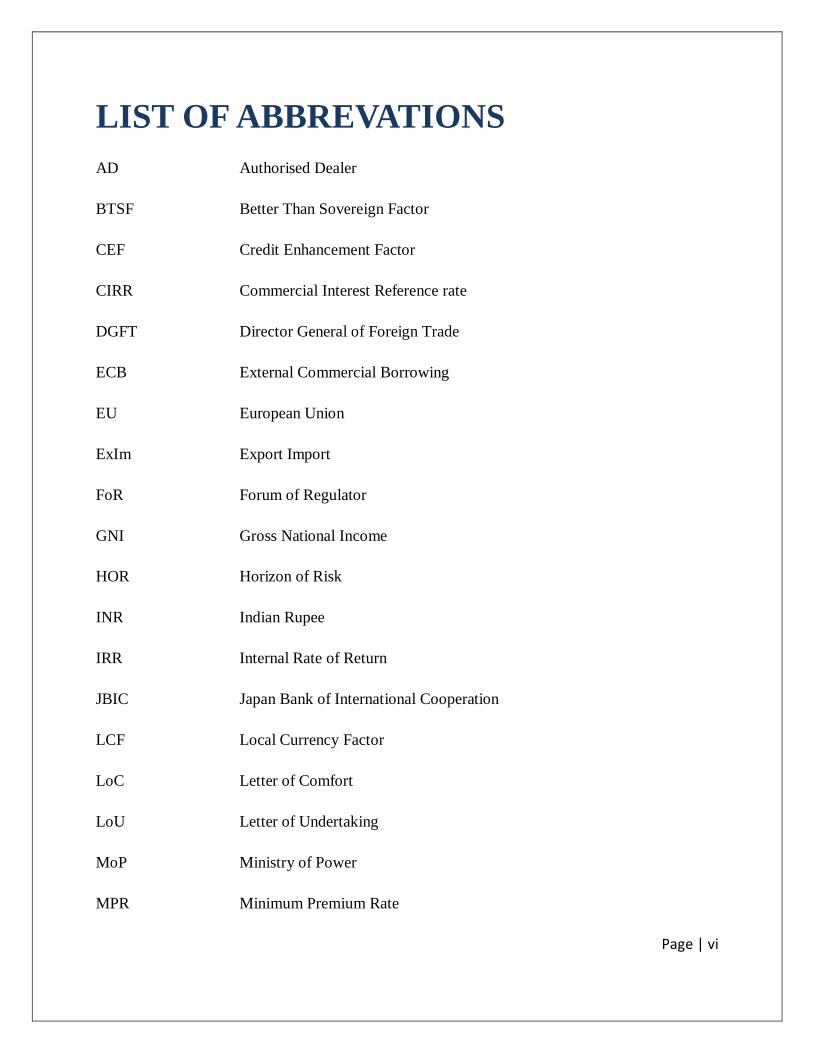
LIST OF ABBREVATIONS
AD Authorised Dealer
BTSF Better Than Sovereign Factor
CEF Credit Enhancement Factor
CIRR Commercial Interest Reference rate
DGFT Director General of Foreign Trade
ECB External Commercial Borrowing
EU European Union
ExIm Export Import
FoR Forum of Regulator
GNI Gross National Income
HOR Horizon of Risk
INR Indian Rupee
IRR Internal Rate of Return
JBIC Japan Bank of International Cooperation
LCF Local Currency Factor
LoC Letter of Comfort
LoU Letter of Undertaking
MoP Ministry of Power
MPR Minimum Premium Rate

Page | vii
OECD Organization for Economic Cooperation and Development
PCC Percentage Cover of Commercial Risk
PCF Percentage of Cover Factor
PCP Percentage Cover of Political Risk
PV Photovoltaic
USA United States of America
Page | viii
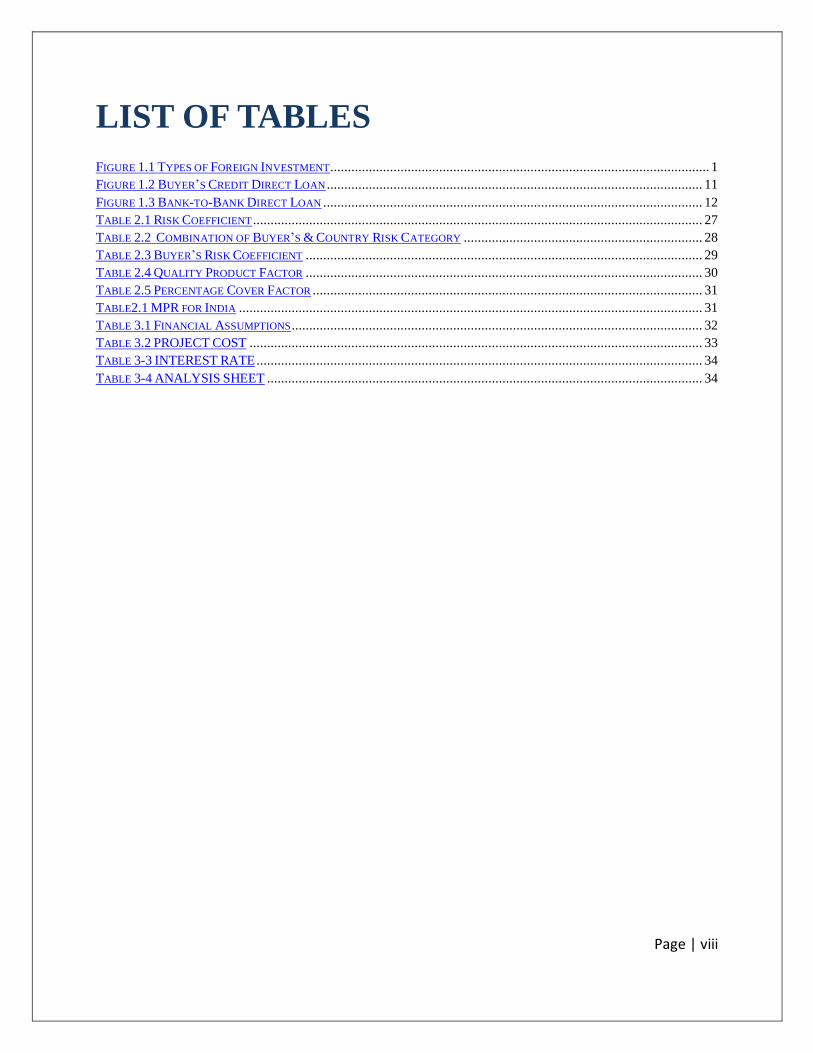
LIST OF TABLES
FIGURE 1.1 TYPES OF FOREIGN INVESTMENT ............................................................................................................ 1
FIGURE 1.2 BUYER’S CREDIT DIRECT LOAN ........................................................................................................... 11
FIGURE 1.3 BANK-TO-BANK DIRECT LOAN ............................................................................................................ 12
TABLE 2.1 RISK COEFFICIENT ................................................................................................................................ 27
TABLE 2.2 COMBINATION OF BUYER’S & COUNTRY RISK CATEGORY .................................................................... 28
TABLE 2.3 BUYER’S RISK COEFFICIENT ................................................................................................................. 29
TABLE 2.4 QUALITY PRODUCT FACTOR ................................................................................................................. 30
TABLE 2.5 PERCENTAGE COVER FACTOR ............................................................................................................... 31
TABLE2.1 MPR FOR INDIA .................................................................................................................................... 31
TABLE 3.1 FINANCIAL ASSUMPTIONS ..................................................................................................................... 32
TABLE 3.2 PROJECT COST ................................................................................................................................. 33
TABLE 3-3 INTEREST RATE ............................................................................................................................... 34
TABLE 3-4 ANALYSIS SHEET ............................................................................................................................ 34

Page | ix
LIST OF FIGURES
FIGURE 1.1 TYPES OF FOREIGN INVESTMENT ............................................................................................................ 1
FIGURE 1.2 BUYER’S CREDIT DIRECT LOAN ........................................................................................................... 11
FIGURE 1.3 BANK-TO-BANK DIRECT LOAN ............................................................................................................ 12
Page | x
Table of Contents
DECLARATION ................................................................................................................................................. II
ACKNOWLEDGMENT ................................................................................................................................... III
CERTIFICATE .................................................................................................................................................. IV
EXECUTIVE SUMMARY .................................................................................................................................. V
LIST OF ABBREVATIONS .............................................................................................................................. VI
LIST OF TABLES........................................................................................................................................... VIII
LIST OF FIGURES ............................................................................................................................................ IX
TABLE OF CONTENTS .................................................................................................................................... X
CHAPTER 1: ........................................................................................................................................................ 1
1. INTRODUCTION ....................................................................................................................................... 1
1.1 BACKDROP OF SOURCES OF FOREIGN FINANCE ........................................................................... 1
1.1.1. METHODS OF FOREIGN INVESTMENT .................................................................................................. 1
1.1.1.1. Foreign Direct Investment ........................................................................................................ 2
1.1.1.2. External Commercial Borrowings (ECB) ................................................................................. 2
1.1.2 TYPES OF FOREIGN LOANS FOR IMPORT ........................................................................................... 11
1.1.2.1 Direct Loan to Foreign Buyer’s (Buyer’s Credit Loan, B/C) ................................................. 11
1.1.2.2 Direct Loan to Foreign Financial Institute (Bank-to-Bank Loan, B/L) ................................. 11
1.1.3. RBI GUIDELINES FOR TRADE CREDIT FOR IMPORTS IN INDIA............................................ 12
1.1.3.1. TRADE CREDITS FOR IMPORTS INTO INDIA ..................................................................... 12
1.2 PROBLEM STATEMENT ...................................................................................................................... 16
1.3 OBJECTIVE ............................................................................................................................................. 17
1.4. ORGANIZATIONAL PROFILE ......................................................................................................... 17
MISSION .......................................................................................................................................................... 18
VISION ............................................................................................................................................................ 19
CHAPTER 2: ...................................................................................................................................................... 20
2.1 FINANCIAL TERMS AND CONDITIONS FOR EXPORT CREDITS ................................................. 20
2.1.1. DOWN PAYMENT, MAXIMUM OFFICIAL SUPPORT AND LOCAL COSTS .......................... 20
2.1.2. CLASSIFICATION OF COUNTRIES FOR MAXIMUM REPAYMENT TERMS ...................... 21
2.1.3. MAXIMUM REPAYMENT TERMS .............................................................................................. 22
2.1.4. REPAYMENT OF PRINCIPAL AND PAYMENT OF INTEREST ............................................... 22
2.1.5. INTEREST RATES, PREMIUM RATES AND OTHER FEES ...................................................... 24
2.1.6. VALIDITY PERIOD FOR EXPORT CREDITS ............................................................................. 24
2.1.7. ACTION TO AVOID OR MINIMISE LOSSES .............................................................................. 24
2.1.8. MATCHING .................................................................................................................................... 25
2.1.9. MINIMUM FIXED INTEREST RATES UNDER OFFICIAL FINANCING SUPPORT............... 25
2.1.10. PREMIUM FOR CREDIT RISK ................................................................................................ 25
2.1.11. MINIMUM PREMIUM RATES FOR CREDIT RISK ............................................................... 26

Page | xi
2.2 CALCULATION OF THE MINIMUM PREMIUM RATES .................................................................. 26
2.2.1. MPR Formula .............................................................................................................................. 26
2.2.2. Applicable Country Risk Classification ...................................................................................... 27
2.2.3. Selection of the Appropriate Buyer Risk Category ..................................................................... 27
2.2.4. Horizon of Risk (HOR) ................................................................................................................ 29
2.2.5. Buyer Risk Credit Enhancements ............................................................................................... 30
2.2.6. Quality of Product Factor (QPF)................................................................................................. 30
2.2.7. Percentage of Cover Factor (PCF) .............................................................................................. 30
2.2.8. Better than Sovereign Factor (BTSF) .......................................................................................... 31
2.2.9. Local Currency Factor (LCF) ..................................................................................................... 31
2.3 MPR FOR INDIAN IMPORTER ............................................................................................................. 31
CHAPTER 3: ...................................................................................................................................................... 32
3.1 FINANCIAL ANALYSIS AND MODELLING........................................................................................ 32
3.1.1. FINANCIAL ASSUMPTIONS......................................................................................................... 32
3.1.2. PROJECT COST CALCULATION ................................................................................................ 33
3.1.3. EXCHANGE RATE ......................................................................................................................... 33
3.1.4. INTEREST RATE ............................................................................................................................ 33
3.2 PROJECT ANALYSIS ............................................................................................................................. 34
CHAPTER 4: ...................................................................................................................................................... 35
4.1 CONCLUSION & RECOMMENDATION .............................................................................................. 35
BIBLIOGRAPHY .............................................................................................................................................. 36
ANNEXURE 1 .................................................................................................................................................... 37

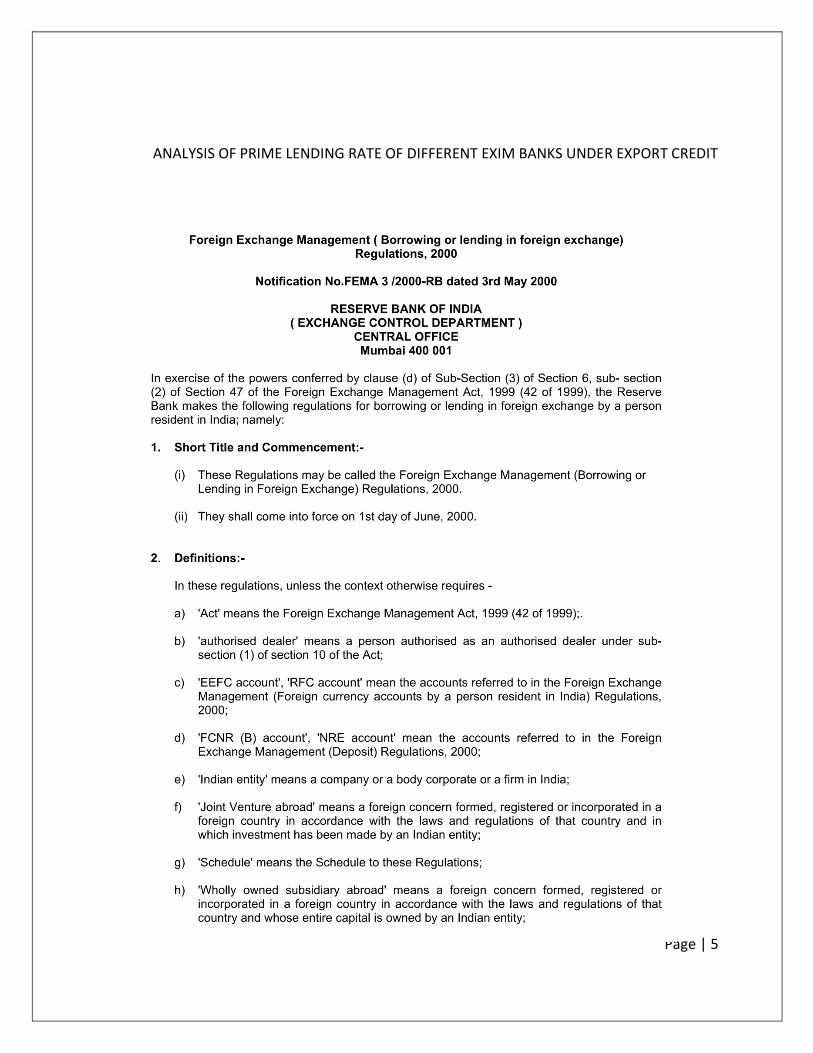
ANALYSIS OF PRIME LENDING RATE OF DIFFERENT EXIM BANKS UNDER EXPORT CREDIT
Page | 1
Chapter 1:
1. INTRODUCTION
1.1 BACKDROP OF SOURCES OF FOREIGN FINANCE
1.1.1. Methods of Foreign Investment
Figure 1.1 Types of Foreign Investment

ANALYSIS OF PRIME LENDING RATE OF DIFFERENT EXIM BANKS UNDER EXPORT CREDIT
Page | 2
1.1.1.1. Foreign Direct Investment
FDI benefits the domestic industry as well as the Indian consumer by providing opportunities for
technological up gradation, access to global managerial skills and practices, optimal utilization of
human and natural resources, making Indian industry internationally competitive, opening up
export markets, providing backward and forward linkages and access to international quality
goods & services.
FDI is Permitted Through two routes:
A. FIPB Route (or Government Route)
under this route, prior approval from Foreign Investment Promotion Board (FIPB),
Government of India is required for foreign investment.
B. Automatic Route of Reserve Bank of India
Under this route no prior approval for foreign investment is required. Investment by a person
resident outside India in shares or convertible debentures of an Indian company.
1.1.1.2. External Commercial Borrowings (ECB)
The Government of India has further liberalized ECB approvals. The Government have vided
Press Release F.No. 4(32)-2000-ECB dated September 1, 2000, has decided to operationalise the
automatic route for fresh ECB approvals up to USD 50 million and for refinancing of an existing
ECB. .
Accordingly, under the automatic route arrangement any legal entity registered under the
Companies Act, Societies Registration Act, Co-operative Societies Act, including proprietorship/
partnership concerns will henceforth be eligible to enter into loan agreements with overseas

ANALYSIS OF PRIME LENDING RATE OF DIFFERENT EXIM BANKS UNDER EXPORT CREDIT
Page | 3
lender(s) for raising fresh ECB with average maturity of not less than 3 years for an amount up to
USD 50 million and for refinancing an existing ECB provided it is in compliance with both,
ECB guidelines framed by the Ministry of Finance, Government of India and the regulations/
directions/ circulars issued by Reserve Bank in this regard. No prior approval is now required
from the Ministry of Finance/Reserve Bank of India for raising ECB up to USD 50 million and
for refinancing of an existing ECB.
The borrower shall ensure that ECB is raised from an internationally acceptable and/or
recognized lender, such as export credit agencies, suppliers of equipments, foreign collaborators,
foreign equity holders, international capital markets, reputed international banks and financial
institutions, etc. The lenders should be recognized and registered in the host countries for the
purpose of extending international finance.
Further, the loan should be organized through a reputed merchant banker registered with the
regulatory authorities of the host country, such as, USA, Japan, EU countries, Singapore, and
such other countries as may be notified from time to time by the Government of India.
The borrower shall submit through an authorized dealer of its choice, three copies of the loan
agreement (along with Form ECB and Form 83, in duplicate) to the concerned Regional Office
of the Reserve Bank after signing the same with the lender. The Regional Office of the Reserve
Bank would acknowledge receipt of the copies of the agreement and allot a loan identification
number to such an agreement.
The primary responsibility to ensure that ECB raised is in conformity with the ECB guidelines
and the Reserve Bank regulations/directions/circulars will be that of the concerned borrower. If,
however, at a later stage, any violation is found, appropriate action will be taken by Reserve
Bank under the Foreign Exchange Management Act, 1999.

ANALYSIS OF PRIME LENDING RATE OF DIFFERENT EXIM BANKS UNDER EXPORT CREDIT
Page | 4
Necessary draw - downs by the borrower will also be permitted under the automatic route
without prior permission of Reserve Bank. The borrower will, however, be required to file
quarterly returns in Form ECB-2 through the authorized dealer showing the details of drawls,
utilization and repayments made. This is to be submitted within 10 days of the close of the
calendar quarter to which it pertains.
The withholding tax exemptions would continue to be granted by the Ministry of Finance
(Department of Revenue/Department of Economic Affairs), Government of India.
For prepayment of outstanding ECBs (viz., 10% of the outstanding amount during the life of the
loan or ECBs with residual maturity up to one year), prior permission from Reserve Bank of
India, ECB Division, Exchange Control Department, Central Office, Mumbai will have to be
obtained by the borrower for which application will have to be submitted, duly forwarded by the
authorized dealer.
Opening of foreign currency account for parking ECB proceeds temporarily, pending utilization,
will require prior approval of the concerned Regional Office of Reserve Bank.
ANALYSIS OF PRIME LENDING RATE OF DIFFERENT EXIM BANKS UNDER EXPORT CREDIT
Page | 5

ANALYSIS OF PRIME LENDING RATE OF DIFFERENT EXIM BANKS UNDER EXPORT CREDIT
Page | 6
ANALYSIS OF PRIME LENDING RATE OF DIFFERENT EXIM BANKS UNDER EXPORT CREDIT
Page | 7

ANALYSIS OF PRIME LENDING RATE OF DIFFERENT EXIM BANKS UNDER EXPORT CREDIT
Page | 8

ANALYSIS OF PRIME LENDING RATE OF DIFFERENT EXIM BANKS UNDER EXPORT CREDIT
Page | 9

ANALYSIS OF PRIME LENDING RATE OF DIFFERENT EXIM BANKS UNDER EXPORT CREDIT
Page | 10

ANALYSIS OF PRIME LENDING RATE OF DIFFERENT EXIM BANKS UNDER EXPORT CREDIT
Page | 11
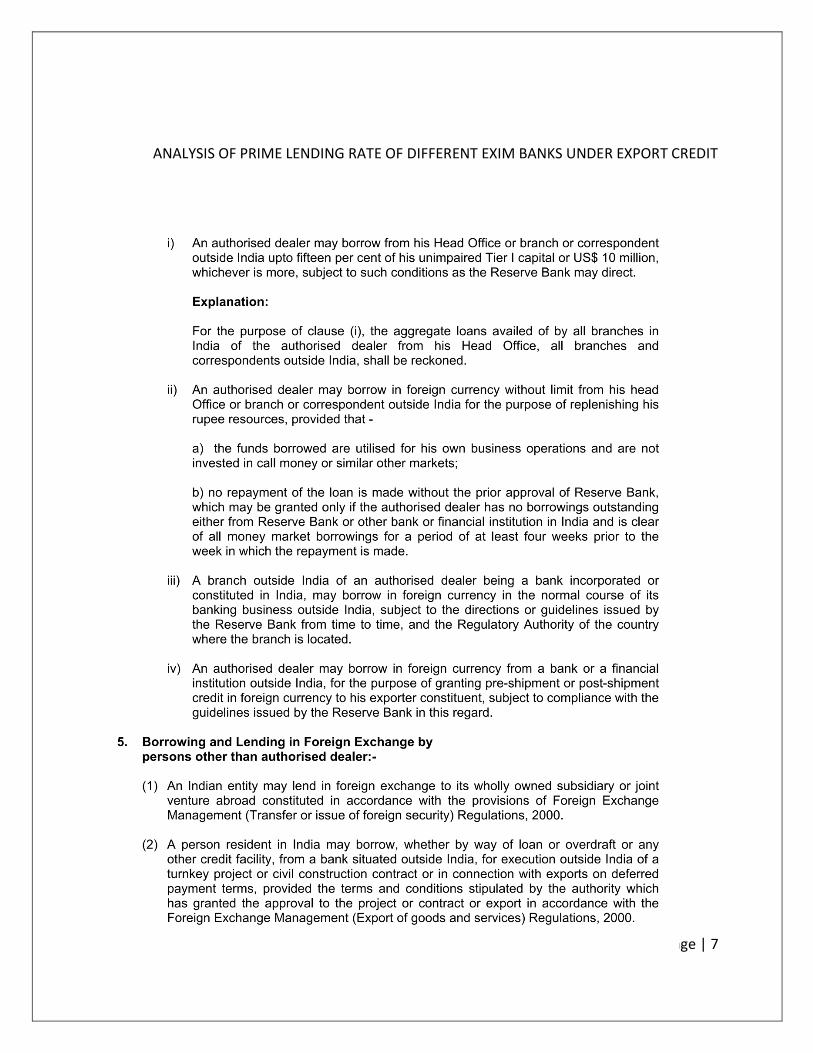
1.1.2 Types of Foreign Loans for Import
1.1.2.1 Direct Loan to Foreign Buyer’s (Buyer’s Credit Loan, B/C)
A buyer's credits (B/C) are direct loans provided by a foreign financial institute for financing the
import of their machinery and equipment or the utilization of their technical services. A direct
loan to an importer is called buyer's credit.
Figure 1.2 Buyer’s Credit Direct Loan
1.1.2.2 Direct Loan to Foreign Financial Institute (Bank-to-Bank Loan, B/L)
A bank-to-bank loan (B/L) are direct loans provided by a foreign financial institution to local
Financial Institution for financing the import of foreign machinery and equipment or the
utilization of foreign technical services. A direct loan to a financial institution is called a bank-to-
bank loan.

ANALYSIS OF PRIME LENDING RATE OF DIFFERENT EXIM BANKS UNDER EXPORT CREDIT
Page | 12
Figure 1.3 Bank-to-Bank Direct Loan
1.1.3. RBI GUIDELINES FOR TRADE CREDIT FOR IMPORTS IN INDIA
1.1.3.1. TRADE CREDITS FOR IMPORTS INTO INDIA
Trade Credits (TC) refer to credits extended for imports directly by the overseas supplier,
bank and financial institution for maturity of less than three years. Depending on the source of
finance, such trade credits include suppliers’ credit or buyers’ credit. Suppliers’ credit relates to
credit for imports into India extended by the overseas supplier, while buyers’ credit refers to
loans for payment of imports into India arranged by the importer from a bank or financial
institution outside India for maturity of less than three years. It may be noted that buyers’
credit and suppliers’ credit for three years and above come under the category of External
Commercial Borrowings (ECB) which are governed by ECB guidelines.
a. Amount and Maturity

ANALYSIS OF PRIME LENDING RATE OF DIFFERENT EXIM BANKS UNDER EXPORT CREDIT
Page | 13
AD banks are permitted to approve trade credits for imports into India up to USD 20
million per import transaction for imports permissible under the current Foreign
Trade Policy of the DGFT with a maturity period up to one year (from the date of
shipment). For import of capital goods as classified by DGFT, AD banks may approve
trade credits up to USD 20 million per import transaction with a maturity period of
more than one year and less than three years (from the date of shipment). No roll-
over/extension will be permitted beyond the permissible period.
The companies in the infrastructure sector, where “infrastructure” is as defined
under the extant guidelines on External Commercial Borrowings (ECB) have been
allowed to avail of trade credit up to a maximum period of five years for import of
capital goods as classified by DGFT subject to conditions that the trade credit must be
abinitio contracted for a period not less than fifteen months and should not be in the
nature of short-term roll overs. However, the condition of 'abinitio' buyers'credit
would be for 6 (six) months only for trade credits availed of on or before December
14, 2012. AD banks shall not approve trade credit exceeding USD 20 million per
import transaction.
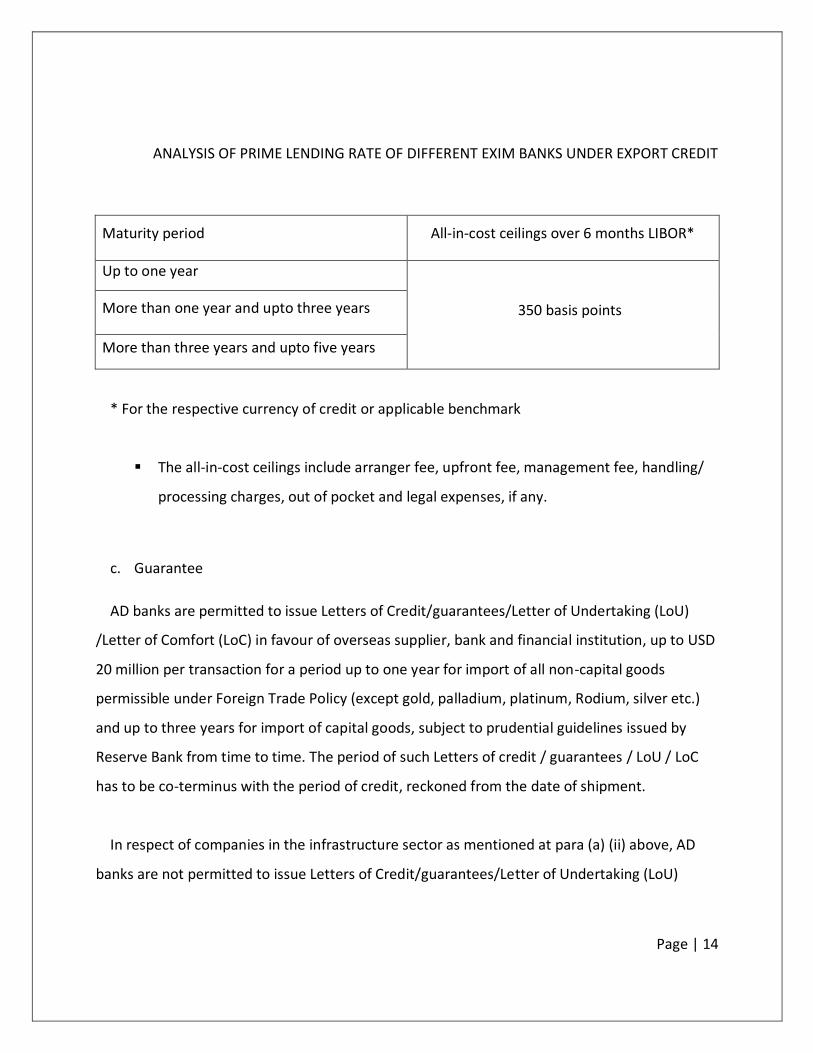
b. All-in-cost Ceilings
The existing all-in-cost ceilings are as under
ANALYSIS OF PRIME LENDING RATE OF DIFFERENT EXIM BANKS UNDER EXPORT CREDIT
Page | 14
Maturity period All-in-cost ceilings over 6 months LIBOR*
Up to one year
350 basis points More than one year and upto three years
More than three years and upto five years
* For the respective currency of credit or applicable benchmark
The all-in-cost ceilings include arranger fee, upfront fee, management fee, handling/
processing charges, out of pocket and legal expenses, if any.
c. Guarantee
AD banks are permitted to issue Letters of Credit/guarantees/Letter of Undertaking (LoU)
/Letter of Comfort (LoC) in favour of overseas supplier, bank and financial institution, up to USD
20 million per transaction for a period up to one year for import of all non-capital goods
permissible under Foreign Trade Policy (except gold, palladium, platinum, Rodium, silver etc.)
and up to three years for import of capital goods, subject to prudential guidelines issued by
Reserve Bank from time to time. The period of such Letters of credit / guarantees / LoU / LoC
has to be co-terminus with the period of credit, reckoned from the date of shipment.
In respect of companies in the infrastructure sector as mentioned at para (a) (ii) above, AD
banks are not permitted to issue Letters of Credit/guarantees/Letter of Undertaking (LoU)

ANALYSIS OF PRIME LENDING RATE OF DIFFERENT EXIM BANKS UNDER EXPORT CREDIT
Page | 15
/Letter of Comfort (LoC) in favour of overseas supplier, bank and financial institution for the
extended period beyond three years. (as amended vide AP DIR Circular No.28 dated 11.9.2012)
d. Reporting Arrangements
AD banks are required to furnish details of approvals, drawl, utilisation, and repayment of
trade credit granted by all its branches, in a consolidated statement, during the month, in form
TC (format in Annex IV) from April 2004 onwards to the Director, Division of International
Finance, Department of Economic Policy and Research, Reserve Bank of India, Central Office
Building, 8th floor, Fort, Mumbai – 400 001 (and in MS-Excel file through email) so as to reach
not later than 10th of the following month. Each trade credit may be given a unique
identification number by the AD bank.
AD banks are required to furnish data on issuance of LCs / Guarantees / LoU / LoC by all its
branches, in a consolidated statement, at quarterly intervals (format in Annex V) to the Chief
General Manager-in-Charge, Foreign Exchange Department, ECB Division, Reserve Bank of
India, Central Office Building, 11th floor, Fort, Mumbai – 400 001 (and in MS-Excel file through
email) from December 2004 onwards so as to reach the Department not later than 10th of the
following month. TRADE CREDITS FOR IMPORTS INTO INDIA
Trade Credits (TC) refer to credits extended for imports directly by the overseas supplier,
bank and financial institution for maturity of less than three years. Depending on the source of
finance, such trade credits include suppliers’ credit or buyers’ credit. Suppliers’ credit relates to
credit for imports into India extended by the overseas supplier, while buyers’ credit refers to
loans for payment of imports into India arranged by the importer from a bank or financial

ANALYSIS OF PRIME LENDING RATE OF DIFFERENT EXIM BANKS UNDER EXPORT CREDIT
Page | 16
institution outside India for maturity of less than three years. It may be noted that buyers’
credit and suppliers’ credit for three years and above come under the category of External
Commercial Borrowings (ECB) which are governed by ECB guidelines.
1.2 PROBLEM STATEMENT
Today the major problem solar developers are facing is the high cost of generation. The tariff
bids have reached at the level of Rs 8 and below. To compete with such low tariff bids cost of
generation should be minimised. Major part of project cost is covered by the Solar panel cost, if
this cost can be minimised then total project cost can be minimised.
Since the availability of sun is uncontrollable so improving the generation is quite
difficult and expensive. If we decrease the annual expense instead of increasing the generation
then also tariff can be brought down significantly.
Major constituents of cost of generations are depreciation and interest if we can reduce
interest payable on debt amount then the cost of generation can be reduced to a significant and
competitive level.
Foreign Solar panels are cheaper than those produced in India. Also if we are importing
goods from some country then we can apply for EXPORT CREDIT FINANCING which is
cheaper than the finance available through Indian financial institutes.
Prime Lending Rates in India are near about 13%. Interest paid on debt is a cash outflow and is
included in cost of generation. Such high cost of debt elevates the Levellised Tariff of Solar PV
Plant.

ANALYSIS OF PRIME LENDING RATE OF DIFFERENT EXIM BANKS UNDER EXPORT CREDIT
Page | 17
Finance from Foreign institutes such as ExIm Bank’s reduces the interest rate of debt and
hence decreases the total outflow of cash resulting in low cost of generation.
This project is the study of Financial Terms and Conditions for Export Credit Loan and
comparative financial analysis of 1MW SOLAR PV PLANT model financed from China,
Finland, Germany, Japan, Singapore, Taiwan, Thailand and United States of America.
1.3 OBJECTIVE
1. To study the methods of foreign investment.
2. To find the prime lending rate of EXIM Bank’s of different countries.
3. To calculate the project cost when Solar panels are imported from other country.
4. To prepare the Financial Model for 1MW Solar PV plant financed from different countries.
5. To suggest the method to minimize the project cost and hence minimizing the cost of
generation.
1.4. ORGANIZATIONAL PROFILE
Solar energy is renewable, non-polluting and highly cost-effective, requires little maintenance
and lasts a lifetime. It goes without saying that the future belongs to those countries which take
an initiative in tapping into solar energy solutions. India is one among the early entrants. The
support given by the government has seen the emergence of quite a few vibrant organizations
ANALYSIS OF PRIME LENDING RATE OF DIFFERENT EXIM BANKS UNDER EXPORT CREDIT
Page | 18
dedicated to the mission of solar energy with societal objectives taking precedence over
commerce. VSES is proud to be one such initiative.
Equipped with state-of art technology, intellect far ahead of the game and a team with
managerial and technical acumen, they endeavour to be a global leader in renewable energy
solutions.
VSES was founded in Visakhapatnam, Andhra Pradesh in the year 2012 with the objective of
providing cost-effective and indigenous solutions to the fledgling solar industry and thereby
contributing to national development. VSES has a distinction of being the tasted company in
India to offer indigenous solutions within a very short span of one year; the company has
acquired an impressive bevy of clients and is well in line with its vision of becoming a
technology leader in renewable energy.
The design and development of low cost solar solutions, especially solar wind hybrid systems
and solar hydel hybrids systems which is our forte demands an expertise across a gamut of
verticals. Backed by a team of professionals with years of experience in the above sectors that is
complemented beautifully by our support staff with administrative and business acumen and our
business model and integrity have gained us an early reputation as a quality player in this niche
market.
Mission
To enter the market as a technology and service provider of renewable energy projects and
become a world class player in the upcoming few years through the use of innovative
technologies, cost effective solutions and indigenous models.

ANALYSIS OF PRIME LENDING RATE OF DIFFERENT EXIM BANKS UNDER EXPORT CREDIT
Page | 19
Vision
To create self-sustainable societies through the use of renewable energy. And establish a basis
for technology, service and design in the market for others to follow and to completely reduce
the dependence on the non-renewable energy sources.
ANALYSIS OF PRIME LENDING RATE OF DIFFERENT EXIM BANKS UNDER EXPORT CREDIT
Page | 20
Chapter 2:
2.1 FINANCIAL TERMS AND CONDITIONS FOR EXPORT CREDITS
The Arrangement sets out limitations on terms and conditions that may be officially supported.
The Participants recognize that more restrictive financial terms and conditions than those
provided for by the Arrangement traditionally apply to certain trade or industrial sectors. The
Participants shall continue to respect such customary financial terms and conditions, in particular
the principle by which repayment terms do not exceed the useful life of the goods.
2.1.1. DOWN PAYMENT, MAXIMUM OFFICIAL SUPPORT AND
LOCAL COSTS
a. The Participants shall require purchasers of goods and services which are the subject of
official support to make down payments of a minimum of 15% of the export contract
value at or before the starting point of credit. For the assessment of down payments, the
export contract value may be reduced proportionally if the transaction includes goods and
services from a third country which are not officially supported. Financing/insurance of
100% of the premium is permissible. Premium may or may not be included in the export
contract value. Retention payments made after the starting point of credit are not regarded
as down payment in this context.
b. Official support for such down payments shall only take the form of insurance or
guarantee against the usual pre-credit risks.
c. Except as provided for in paragraphs b) and d), the Participants shall not provide official
support in excess of 85% of the export contract value, including third country supply but
excluding local costs.
d. The Participants may provide official support for local costs, provided that:

ANALYSIS OF PRIME LENDING RATE OF DIFFERENT EXIM BANKS UNDER EXPORT CREDIT
Page | 21
Official support provided for local costs shall not exceed 30% of the export
contract value.
It shall not be provided on terms more favourable/less restrictive than those
agreed for the related exports.
Where official support for local cost exceeds 15% of the export contract value,
such official support shall be subject to prior notification, pursuant to Article 48,
specifying the nature of the local costs being supported.
2.1.2. CLASSIFICATION OF COUNTRIES FOR MAXIMUM
REPAYMENT TERMS
a. Category I countries are High Income OECD countries. All other countries are in
Category II.
b. The following operational criteria and procedures apply when classifying countries:
Classification for Arrangement purposes is determined by per capita GNI as
calculated by the World Bank for the purposes of the World Bank classification of
borrowing countries.
In cases where the World Bank does not have enough information to publish per
capita GNI data, the World Bank shall be asked to estimate whether the country in
question has per capita GNI above or below the current threshold. The country
shall be classified according to the estimate unless the Participants decide to act
otherwise.
If a country is reclassified, the reclassification will take effect two weeks after the
conclusions drawn from the above-mentioned data from the World Bank have
been communicated to all Participants by the Secretariat.
In cases where the World Bank revises figures, such revisions shall be
disregarded in relation to the Arrangement. Nevertheless, the classification of a
country may be changed by way of a Common Line and Participants would

ANALYSIS OF PRIME LENDING RATE OF DIFFERENT EXIM BANKS UNDER EXPORT CREDIT
Page | 22
favourably consider a change due to errors and omissions in the figures
subsequently recognised in the same calendar year in which the figures were first
distributed by the Secretariat.
c. A country will change category only after its World Bank category has remained
unchanged for two consecutive years.
2.1.3. MAXIMUM REPAYMENT TERMS
The maximum repayment term varies according to the classification of the country of
destination.
a. For Category I countries, the maximum repayment term is five years, with the possibility
of agreeing up to eight-and-a-half years when the procedures for prior notification are
followed.
b. For Category II countries, the maximum repayment term is ten years.
c. In the event of a contract involving more than one country of destination the Participants
should seek to establish a Common Line to reach agreement on appropriate terms defined
by the World Bank on an annual basis according to per capita GNI.
2.1.4. REPAYMENT OF PRINCIPAL AND PAYMENT OF INTEREST
a. The principal sum of an export credit shall be repaid in equal instalments.
b. Principal shall be repaid and interest shall be paid no less frequently than every six
months and the first instalment of principal and interest shall be made no later than six
months after the starting point of credit.
c. For export credits provided in support of lease transactions, equal repayments of principal
and interest combined may be applied in lieu of equal repayments of principal as set out
in paragraph a).
ANALYSIS OF PRIME LENDING RATE OF DIFFERENT EXIM BANKS UNDER EXPORT CREDIT
Page | 23
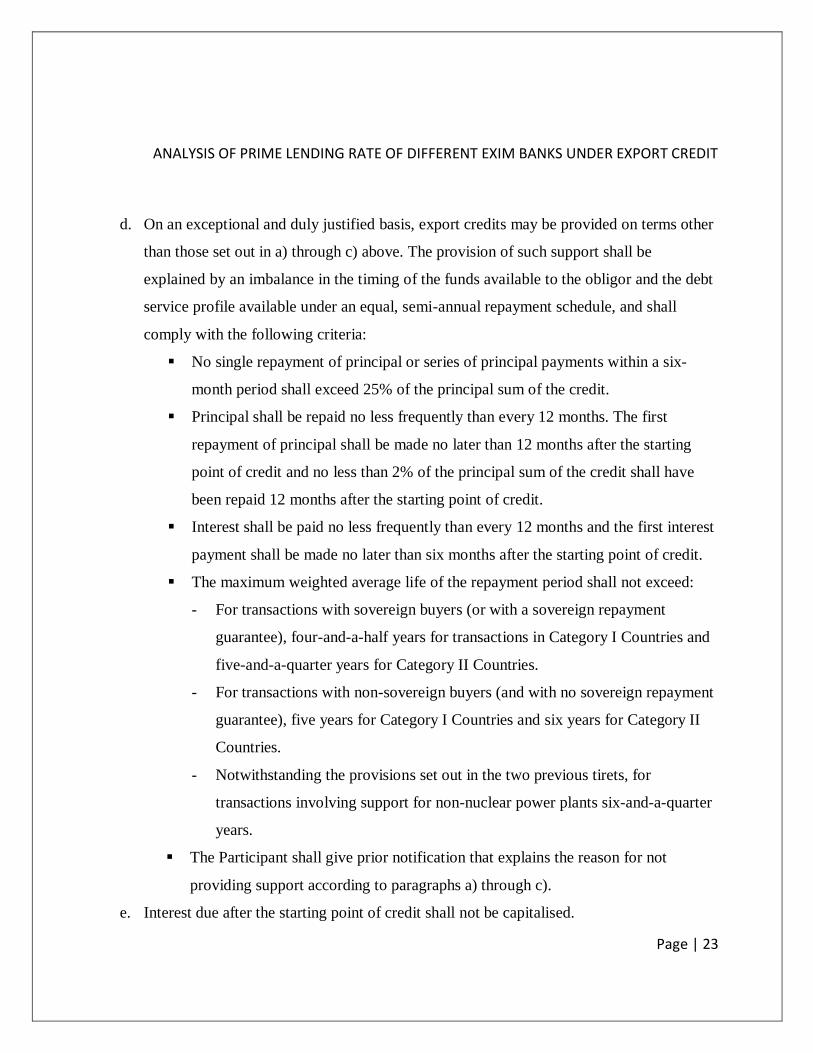
d. On an exceptional and duly justified basis, export credits may be provided on terms other
than those set out in a) through c) above. The provision of such support shall be
explained by an imbalance in the timing of the funds available to the obligor and the debt
service profile available under an equal, semi-annual repayment schedule, and shall
comply with the following criteria:
No single repayment of principal or series of principal payments within a six-
month period shall exceed 25% of the principal sum of the credit.
Principal shall be repaid no less frequently than every 12 months. The first
repayment of principal shall be made no later than 12 months after the starting
point of credit and no less than 2% of the principal sum of the credit shall have
been repaid 12 months after the starting point of credit.
Interest shall be paid no less frequently than every 12 months and the first interest
payment shall be made no later than six months after the starting point of credit.
The maximum weighted average life of the repayment period shall not exceed:
- For transactions with sovereign buyers (or with a sovereign repayment
guarantee), four-and-a-half years for transactions in Category I Countries and
five-and-a-quarter years for Category II Countries.
- For transactions with non-sovereign buyers (and with no sovereign repayment
guarantee), five years for Category I Countries and six years for Category II
Countries.
- Notwithstanding the provisions set out in the two previous tirets, for
transactions involving support for non-nuclear power plants six-and-a-quarter
years.
The Participant shall give prior notification that explains the reason for not
providing support according to paragraphs a) through c).
e. Interest due after the starting point of credit shall not be capitalised.

ANALYSIS OF PRIME LENDING RATE OF DIFFERENT EXIM BANKS UNDER EXPORT CREDIT
Page | 24
2.1.5. INTEREST RATES, PREMIUM RATES AND OTHER FEES
a. Interest excludes:
Any payment by way of premium or other charge for insuring or guaranteeing
supplier credits or financial credits;
Any payment by way of banking fees or commissions relating to the export credit
other than annual or semi-annual bank charges that are payable throughout the
repayment period; and
Withholding taxes imposed by the importing country.
b. Where official support is provided by means of direct credits/financing or refinancing,
the premium either may be added to the face value of the interest rate or may be a
separate charge; both components are to be specified separately to the Participants.
2.1.6. VALIDITY PERIOD FOR EXPORT CREDITS
Financial terms and conditions for an individual export credit or line of credit, other than the
validity period for the Commercial Interest Reference Rates (CIRRs), shall not be fixed for a
period exceeding six months prior to final commitment.
2.1.7. ACTION TO AVOID OR MINIMISE LOSSES
The Arrangement does not prevent export credit authorities or financing institutions from
agreeing to less restrictive financial terms and conditions than those provided for by the
Arrangement, if such action is taken after the contract award (when the export credit agreement
and ancillary documents have already become effective) and is intended solely to avoid or
minimise losses from events which could give rise to non-payment or claims.
ANALYSIS OF PRIME LENDING RATE OF DIFFERENT EXIM BANKS UNDER EXPORT CREDIT
Page | 25
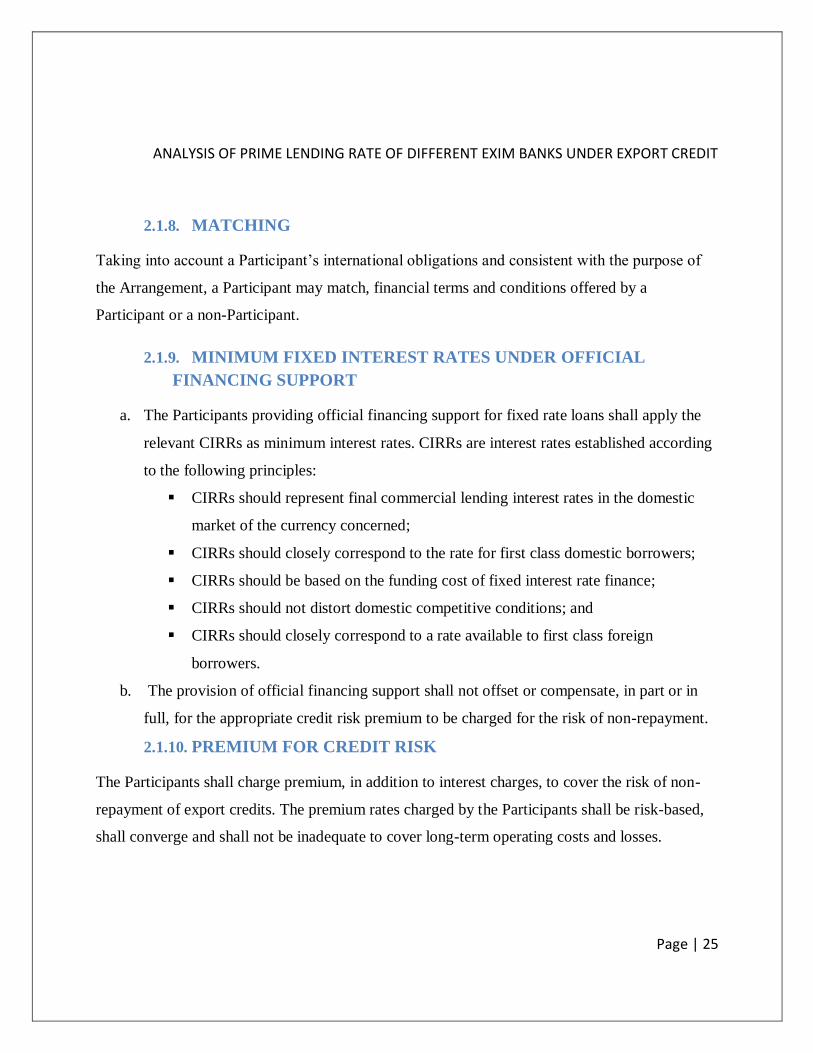
2.1.8. MATCHING
Taking into account a Participant’s international obligations and consistent with the purpose of
the Arrangement, a Participant may match, financial terms and conditions offered by a
Participant or a non-Participant.
2.1.9. MINIMUM FIXED INTEREST RATES UNDER OFFICIAL
FINANCING SUPPORT
a. The Participants providing official financing support for fixed rate loans shall apply the
relevant CIRRs as minimum interest rates. CIRRs are interest rates established according
to the following principles:
CIRRs should represent final commercial lending interest rates in the domestic
market of the currency concerned;
CIRRs should closely correspond to the rate for first class domestic borrowers;
CIRRs should be based on the funding cost of fixed interest rate finance;
CIRRs should not distort domestic competitive conditions; and
CIRRs should closely correspond to a rate available to first class foreign
borrowers.
b. The provision of official financing support shall not offset or compensate, in part or in
full, for the appropriate credit risk premium to be charged for the risk of non-repayment.
2.1.10. PREMIUM FOR CREDIT RISK
The Participants shall charge premium, in addition to interest charges, to cover the risk of non-
repayment of export credits. The premium rates charged by the Participants shall be risk-based,
shall converge and shall not be inadequate to cover long-term operating costs and losses.

ANALYSIS OF PRIME LENDING RATE OF DIFFERENT EXIM BANKS UNDER EXPORT CREDIT
Page | 26
2.1.11. MINIMUM PREMIUM RATES FOR CREDIT RISK
The Participants shall charge no less than the applicable Minimum Premium Rate (MPR) for
Credit Risk.
a. The applicable MPR is determined according to the following factors:
The applicable country risk classification;
The time at risk ( i.e. the Horizon of Risk or HOR);
The selected buyer risk category of the obligor;
The percentage of political and commercial risk cover and quality of official
export credit product provided;
Any country risk mitigation technique applied; and
Any buyer risk credit enhancements that have been applied.
b. MPRs are expressed in percentages of the principal value of the credit as if premium
were collected in full at the date of the first drawdown of the credit.
c. There are no MPRs for transactions involving obligors in Category 0 countries, High
Income OECD Countries and High Income Euro Area Countries. The premium rates
charged by Participants for transactions in such countries shall be determined on a case-
by-case basis.
2.2 CALCULATION OF THE MINIMUM PREMIUM RATES
2.2.1. MPR Formula
The formula for calculating the applicable MPR for an export credit involving an
obligor/guarantor in a country classified in Country Risk Categories 1-7 is:
MPR = { [ (ai* HOR + bi) * max (PCC, PCP) / 0.95 ] * (1-LCF) + [cin * PCC / 0.95 *
HOR * (1-CEF) ] }* QPFi * PCFi *BTSF

ANALYSIS OF PRIME LENDING RATE OF DIFFERENT EXIM BANKS UNDER EXPORT CREDIT
Page | 27
Where:
ai = country risk coefficient in country risk category i (i = 1-7)
cin = buyer risk coefficient for buyer category n ( n = SOV+, SOV/CCO, CC1-
CC5) in country risk category i (i = 1-7)
bi = constant for country category risk category i (i = 1-7)
HOR = horizon of risk
PCC = commercial (buyer) risk percentage of cover
PCP = political (country) risk percentage of cover
CEF = credit enhancements factor
QPF i = quality of product factor in country risk category i ( i = 1-7)
PCF = percentage of cover factor in country risk category i ( i = 1-7)
BTSF = better than sovereign factor
LCF = local currency factor
2.2.2. Applicable Country Risk Classification
The applicable country risk classification determines the country risk coefficient (ai) and
constant (bi) that are obtained from the following table:
1 2 3 4 5 6 7
(a) 0.090 0.200 0.350 0.550 0.740 0.900 1.100
(b) 0.350 0.350 0.350 0.350 0.750 1.200 1.800
Table 2.1 Risk Coefficient
2.2.3. Selection of the Appropriate Buyer Risk Category
The appropriate buyer risk category is selected from the following table, which provides
the combinations of country and buyer risk categories that have been established and the

ANALYSIS OF PRIME LENDING RATE OF DIFFERENT EXIM BANKS UNDER EXPORT CREDIT
Page | 28
agreed concordance between buyer risk categories CC1-CC5 and the classifications of
accredited CRAs.
Qualitative descriptions of each buyer risk category (SOV+ to CC5) have been
established to facilitate the classification of obligors (and guarantors).
Table 2.2 Combination of Buyer’s & Country Risk Category
The selected buyer risk category, in combination with the applicable country risk
category determines the buyer risk coefficient (cin) that is obtained from the following
table:

ANALYSIS OF PRIME LENDING RATE OF DIFFERENT EXIM BANKS UNDER EXPORT CREDIT
Page | 29
Table 2.3 Buyer’s Risk Coefficient
2.2.4. Horizon of Risk (HOR)
The Horizon of Risk (HOR) is calculated as follows:
For standard repayment profiles (i.e. equal semi-annual repayments of principal):
HOR = (length of the disbursement period * 0.5) + the length of the repayment
period
For non-standard repayment profiles:
HOR = (length of the disbursement period * 0.5) + (weighted average life of the
repayment period - 0.25) / 0.5
In the above formulas, the unit of measurement for time is years.
Percentage of Cover for Commercial (Buyer) Risk (PCC) and Political (Country) Risk
(PCP)
The Percentages of Cover (PCC and PCP) expressed as a decimal value ( i.e. 95% is
expressed as 0.95) in the MPR formula.

ANALYSIS OF PRIME LENDING RATE OF DIFFERENT EXIM BANKS UNDER EXPORT CREDIT
Page | 30
2.2.5. Buyer Risk Credit Enhancements
The value of the credit enhancement factor (CEF) is 0 for any transaction that is not
subject to any buyer risk credit enhancements. The value of the CEF for transactions that
are subject to buyer risk credit enhancements is determined and may not exceed 0.35.
2.2.6. Quality of Product Factor (QPF)
The QPF is obtained from the following table:
Table 2.4 Quality Product Factor
2.2.7. Percentage of Cover Factor (PCF)
The PCF is determined as follows:
For ( max(PCC, PCP) ≤ 0.95, PCF = 1)
For ( max(PCC, PCP) > 0.95, PCF = 1 + ( ( max(PCC, PCP) - 0.95) / 0.05 ) *
(Percentage of cover coefficient)
The percentage of cover coefficient is obtained from the following table:

ANALYSIS OF PRIME LENDING RATE OF DIFFERENT EXIM BANKS UNDER EXPORT CREDIT
Page | 31
Table 2.5 Percentage Cover Factor
2.2.8. Better than Sovereign Factor (BTSF)
When an obligor is classified in the “better than sovereign” (SOV+) buyer risk category,
BTSF = 0.9,
Otherwise BTSF = 1.
2.2.9. Local Currency Factor (LCF)
For transaction making use of local currency country risk mitigation, the value of the
LCF may not exceed 0.2. The value of the LCF for all other transactions is 0.
2.3 MPR FOR INDIAN IMPORTER
ai bi HOR PCC PCP LCF Cin CEF QPFi PCFi BTSF MPR
0.35 0.35 12.04167 0.00489 0.95 0.2 0.495 0.35 1 1 1 3.67%
Table2.6 MPR for India

ANALYSIS OF PRIME LENDING RATE OF DIFFERENT EXIM BANKS UNDER EXPORT CREDIT
Page | 32
Chapter 3:
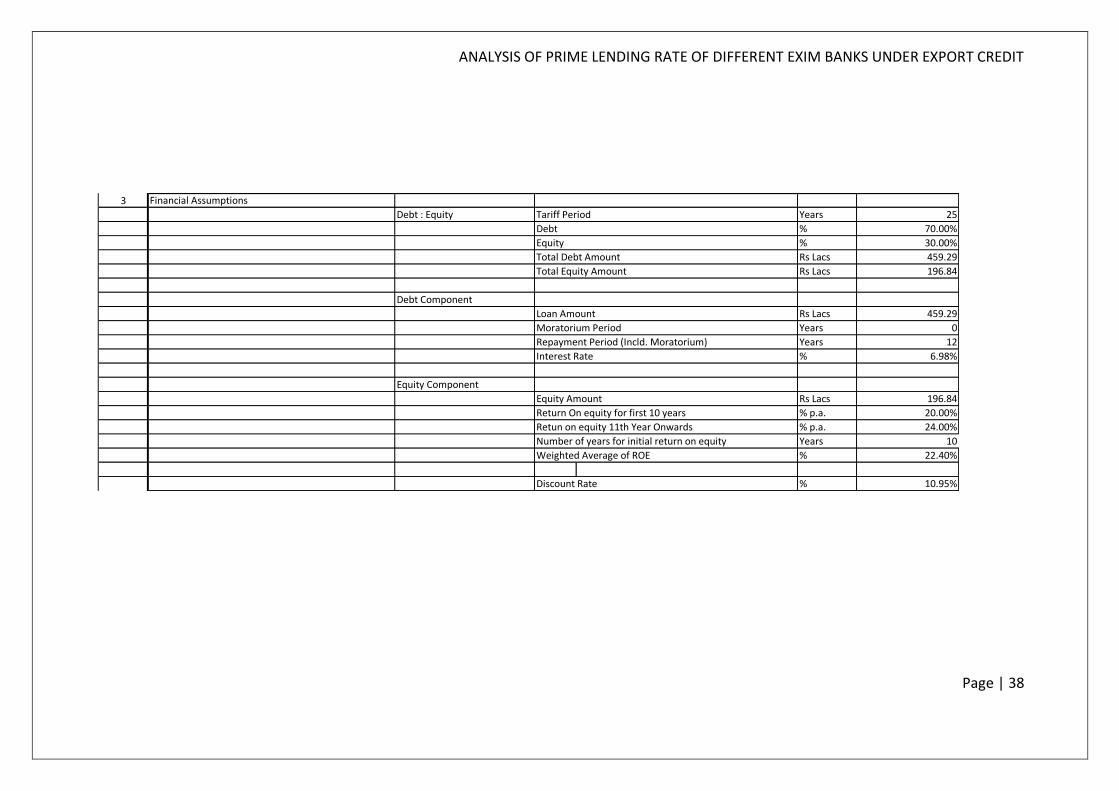
3.1 FINANCIAL ANALYSIS AND MODELLING
3.1.1. FINANCIAL ASSUMPTIONS
Table 3.7 Financial Assumptions
Particular No. Units
Capital Cost 6.56 Crs/MW
Plant Life 25 years
Tariff Period* 25 years
Debt 70.00%
Equity 30.00%
Debt Employed 459.2862482 lakhs/MW
Equity employed 196.8369635 lakhs/MW
Discoutn Rate 10.95% p.a.
Loan Teneure 12 years
Capcity Utilization
Factor (CUF)19.00%
Interest Rate
Depreciation 90.00%
Salvage Value 10.00%
5.83% p.a.
1.54% p.a.
20.00% p.a.
24.00% p.a.
Interest On
Working Capital
(10% + 3.5%) =
13.5%p.a.
Normative O&M
expenses11.63 Lakhs/MW
O&M escalation
Rate5.72% p.a.
2.00%
1.00%
Late Payment OF
surcharge1.25% per Month
Tax rate(30%+5%+3%) =
32.445%p.a.
Rebate
Return on Equity
(RoE)
Depreciation Rate

ANALYSIS OF PRIME LENDING RATE OF DIFFERENT EXIM BANKS UNDER EXPORT CREDIT
Page | 33
3.1.2. PROJECT COST CALCULATION
Capital Costs Units Input Value In Rs
Panel Cost $/Watt dc $ 0.59 Rs. 40.00
1MW $ 5,90,000.00 Rs. 4,00,02,000.00
Export cost
$ - Rs. -
Import cost
$ 1,02,733.35 Rs. 69,65,321.18
Appx. Local charges (transportation
and installation $ 1,25,000.00 Rs. 84,75,000.00
Ancillary Services & Products
$ 1,50,000.00 Rs. 1,01,70,000.00
Total Project Cost
$ 9,67,733.35 Rs. 6,56,12,321.18
Table 3.2 PROJECT COST
3.1.3. EXCHANGE RATE
1 USD = 67.8 INR
3.1.4. INTEREST RATE
Country Interest Rate
PLR PLR+ MPR
China 6% 9.67%
Finland 3.21% 6.88%

ANALYSIS OF PRIME LENDING RATE OF DIFFERENT EXIM BANKS UNDER EXPORT CREDIT
Page | 34
Germany 3.71% 7.38%
Japan 3.31% 6.98%
Singapore 5.38% 9.05%
Taiwan 2.88% 6.55%
Thailand 6.88% 10.55%
United States of America 2.71% 6.38%
Table 3-3 INTEREST RATE
3.2 PROJECT ANALYSIS
Country Interest
Rate
Assumed Project
Cost ( in Lakhs)
Cost of
Generation
Interest Paid (in
Lakhs) Project IRR
China 10% Rs. 656.12 Rs. 6.95 Rs. 268.37 20.05%
Finland 6.88% Rs. 656.12 Rs. 6.60 Rs. 190.95 19.79%
Germany 7.38% Rs. 656.12 Rs. 6.66 Rs. 204.83 19.83%
Japan 6.98% Rs. 656.12 Rs. 6.61 Rs. 193.73 19.80%
Singapore 9.05% Rs. 656.12 Rs. 6.87 Rs. 251.17 19.99%
Taiwan 6.55% Rs. 656.12 Rs. 6.55 Rs. 181.80 19.76%
Thailand 10.55% Rs. 656.12 Rs. 7.07 Rs. 292.65 20.13%
USA 6.38% Rs. 656.12 Rs. 6.53 Rs. 177.08 19.74%
Table 3-4 ANALYSIS SHEET

ANALYSIS OF PRIME LENDING RATE OF DIFFERENT EXIM BANKS UNDER EXPORT CREDIT
Page | 35
Chapter 4:
4.1 CONCLUSION & RECOMMENDATION
Due to current economic conditions i.e. current INR to USD exchange rate, the import
cost of solar panels has increased by about 30%. This increased cost is adversely affecting the
benefits of importing of solar panel and also the financing from other countries.
Even with such high exchange rate, the average cost of generation achieved is about
Rs.6.75 which is still competable in market.
After analysing the financial terms and conditions and also the trade agreements with
above mentioned countries, I recommend JAPAN as the most suitable country to get finance for
Viswa Surya Energy Solutions.
Reasons for recommending JAPAN:
ZERO Export Duty on Solar PV
Low Interest Rates
Japan Bank of International Cooperation (Formerly known as Japan’s ExIm Bank) has
been a prime investor in many Indian Solar projects such as for 25MW Solar Plat in
ANTA.
India and Japan has signed a bilateral trade agreement which promotes both trade and
investment, hence financing from Japan will be easier.
VSES is already importing their Solar Panel from Japan.

ANALYSIS OF PRIME LENDING RATE OF DIFFERENT EXIM BANKS UNDER EXPORT CREDIT
Page | 36
Bibliography Arrangement of Officially Supported Export Credit, retrieved from www.oec.org
Bilateral Trade Agreement 2010,with Japan, retrieved from www.commerce.nic.in
Export Loans from Japan, studied from www.jbic.go.jp
Export credit terms of USA, studied from www.exim.gov
Export Credit terms of Germany, studied from www.kfw.de
Concepts of foreign trade, studied from www.eximguru.com
AGREEMENT ON ECONOMIC COOPERATION BETWEEN THE GOVERNMENT
OF THE REPUBLIC OF INDIA AND THE GOVERNMENT OF THE REPUBLIC OF
FINLAND, studied from www.eximguru.com
Annual Report 2012-13 of China ExIm Bank, retrieved from www.eximbank.gov.cn
Financial Management- I.M Pandey

ANALYSIS OF PRIME LENDING RATE OF DIFFERENT EXIM BANKS UNDER EXPORT CREDIT
Page | 37
Annexure 1
Financial Model for 1MW Solar PV Plant Financed From Japan.
Assumption Sheet:
1000 KW Parameters JAPAN Financed
S. No. Sub Head Unit Assumption Value
1
Capacity KW 1000
% 19.00%
Lakhs KWh 16.644
% 0.00%
Lakhs KWh 16.644
% 0.00%
Years 25
2
Capital cost/MW Rs Lacs/MW 656.12
Annual Net Generation
Annual Deration
Useful Life
Project Cost
Power Plant Cost
Auxiliary Consumption
Assumption For Solar PV power Project
Assumption Head Sub Head (2)
Power Generation
Installed Power Generation Capacity
Capacity Utilization Factor
Annual Gross Generation
ANALYSIS OF PRIME LENDING RATE OF DIFFERENT EXIM BANKS UNDER EXPORT CREDIT
Page | 38
3
Debt : Equity Years 25
% 70.00%
% 30.00%
Rs Lacs 459.29
Rs Lacs 196.84
Debt Component
Rs Lacs 459.29
Years 0
Years 12
% 6.98%
Equity Component
Equity Amount Rs Lacs 196.84
Return On equity for first 10 years % p.a. 20.00%
Retun on equity 11th Year Onwards % p.a. 24.00%
Number of years for initial return on equity Years 10
Weighted Average of ROE % 22.40%
Discount Rate % 10.95%
Interest Rate
Loan Amount
Moratorium Period
Repayment Period (Incld. Moratorium)
Total Equity Amount
Debt
Equity
Total Debt Amount
Tariff Period
Financial Assumptions

ANALYSIS OF PRIME LENDING RATE OF DIFFERENT EXIM BANKS UNDER EXPORT CREDIT
Page | 39
4 Fiscal Assumptions
Assumed tariff (Iterative) Rs/kWh 10.39
Income tax % 32.45%
8.66
Depreciation
lakhs 590.5108906
lakhs 65.61232118
% 2.64%
% 5.83%
% 5.83%
% 1.54%
Years 12
% 40%
% 80%
Book depreciation first year
Book depreciation from second year
Depreciation rate for First 12 years
Depreciation rate 13th years onwards
Number of years for initial depreciation rate
Accelerated Depreciation for First Year
Accelerated Depreciation for Second Year onwards
Non Depreciable Amount (10%)
Fianancial Assumptions
Annuity Factor
Depreciable amount (90%)
5
For Fixed Charges
O&M Charges Months 1
Maintenance Spares (% of O&M expenses) % 15.00%
Recievables for Debtors Months 2
For Variable Charges
Interest on Working Capital % 13.50%
Working Capital
6
Power Plant (First Yr Of
Operation) Rs Lacs 11Total O&M Expenses
Escalation % 5.72%
Operation & Maintenance

ANALYSIS OF PRIME LENDING RATE OF DIFFERENT EXIM BANKS UNDER EXPORT CREDIT
Page | 40
7 Tax Corporate Tax % 32.45%
Land Lease Rate % 5.00%
MAT % 20.00%
Tax Holiday start Year Year 1
Tax holiday duration years 10
MAT Set OFF start year years 11
MAT Set OFF accumulation
allowed u/s 115JAA (3A) years 10
MAT SET OFF Duration years 11
ANALYSIS OF PRIME LENDING RATE OF DIFFERENT EXIM BANKS UNDER EXPORT CREDIT
Page | 41
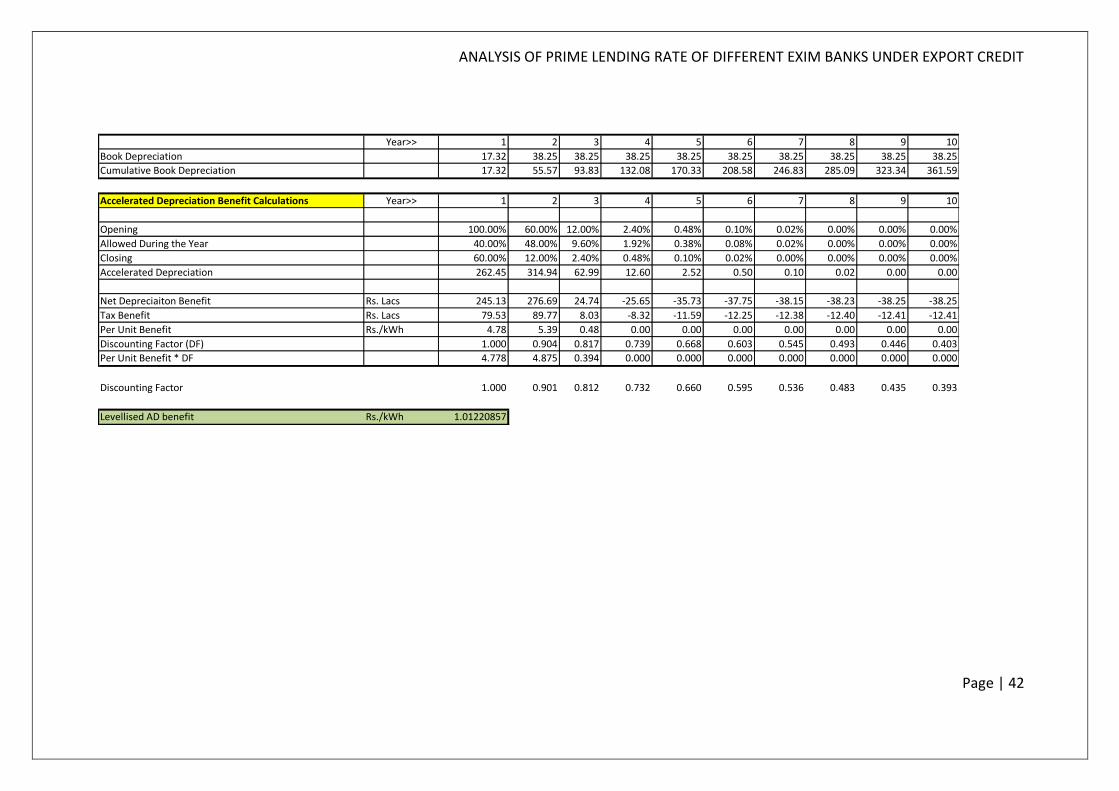
Depreciation Sheet:
Depreciaiton Calculation For SLM Value Units
CapEx 656.12 Rs lacs
Annual Net Genration 16.644 Lakh KWhs
Annual Deration 0.00% %
Life of Plant and Machinery/Project Life 25 Years
Annual Depreciaiton for Period Of term Loan 38.25198325 Laks/Yr
Advance against Depreciation 0 Lakhs/Yr
Amount remaining to be depreciated post term loan 131.4870916 Lakhs
Book Depreciation first year 2.64% %
Book Depreciation Second year 5.83% %
Depreciable amount 590.5108906 Rs lacs
Accelerated Depreciation first year 40.00% %
Accelerated Depreciation from second year 80.00% %
Corporate Tax 32.45% %
Year>> 1 2 3 4 5 6 7 8 9 10
Book Depreciation 17.32 38.25 38.25 38.25 38.25 38.25 38.25 38.25 38.25 38.25
Cumulative Book Depreciation 17.32 55.57 93.83 132.08 170.33 208.58 246.83 285.09 323.34 361.59
Accelerated Depreciation Benefit Calculations Year>> 1 2 3 4 5 6 7 8 9 10
Opening 100.00% 60.00% 12.00% 2.40% 0.48% 0.10% 0.02% 0.00% 0.00% 0.00%
Allowed During the Year 40.00% 48.00% 9.60% 1.92% 0.38% 0.08% 0.02% 0.00% 0.00% 0.00%
Closing 60.00% 12.00% 2.40% 0.48% 0.10% 0.02% 0.00% 0.00% 0.00% 0.00%
Accelerated Depreciation 262.45 314.94 62.99 12.60 2.52 0.50 0.10 0.02 0.00 0.00
Net Depreciaiton Benefit Rs. Lacs 245.13 276.69 24.74 -25.65 -35.73 -37.75 -38.15 -38.23 -38.25 -38.25
Tax Benefit Rs. Lacs 79.53 89.77 8.03 -8.32 -11.59 -12.25 -12.38 -12.40 -12.41 -12.41
Per Unit Benefit Rs./kWh 4.78 5.39 0.48 0.00 0.00 0.00 0.00 0.00 0.00 0.00
Discounting Factor (DF) 1.000 0.904 0.817 0.739 0.668 0.603 0.545 0.493 0.446 0.403
Per Unit Benefit * DF 4.778 4.875 0.394 0.000 0.000 0.000 0.000 0.000 0.000 0.000
Discounting Factor 1.000 0.901 0.812 0.732 0.660 0.595 0.536 0.483 0.435 0.393
Levellised AD benefit Rs./kWh 1.01220857
Depreciation Calculation
ANALYSIS OF PRIME LENDING RATE OF DIFFERENT EXIM BANKS UNDER EXPORT CREDIT
Page | 42
Depreciaiton Calculation For SLM Value Units
CapEx 656.12 Rs lacs
Annual Net Genration 16.644 Lakh KWhs
Annual Deration 0.00% %
Life of Plant and Machinery/Project Life 25 Years
Annual Depreciaiton for Period Of term Loan 38.25198325 Laks/Yr
Advance against Depreciation 0 Lakhs/Yr
Amount remaining to be depreciated post term loan 131.4870916 Lakhs
Book Depreciation first year 2.64% %
Book Depreciation Second year 5.83% %
Depreciable amount 590.5108906 Rs lacs
Accelerated Depreciation first year 40.00% %
Accelerated Depreciation from second year 80.00% %
Corporate Tax 32.45% %
Year>> 1 2 3 4 5 6 7 8 9 10
Book Depreciation 17.32 38.25 38.25 38.25 38.25 38.25 38.25 38.25 38.25 38.25
Cumulative Book Depreciation 17.32 55.57 93.83 132.08 170.33 208.58 246.83 285.09 323.34 361.59
Accelerated Depreciation Benefit Calculations Year>> 1 2 3 4 5 6 7 8 9 10
Opening 100.00% 60.00% 12.00% 2.40% 0.48% 0.10% 0.02% 0.00% 0.00% 0.00%
Allowed During the Year 40.00% 48.00% 9.60% 1.92% 0.38% 0.08% 0.02% 0.00% 0.00% 0.00%
Closing 60.00% 12.00% 2.40% 0.48% 0.10% 0.02% 0.00% 0.00% 0.00% 0.00%
Accelerated Depreciation 262.45 314.94 62.99 12.60 2.52 0.50 0.10 0.02 0.00 0.00
Net Depreciaiton Benefit Rs. Lacs 245.13 276.69 24.74 -25.65 -35.73 -37.75 -38.15 -38.23 -38.25 -38.25
Tax Benefit Rs. Lacs 79.53 89.77 8.03 -8.32 -11.59 -12.25 -12.38 -12.40 -12.41 -12.41
Per Unit Benefit Rs./kWh 4.78 5.39 0.48 0.00 0.00 0.00 0.00 0.00 0.00 0.00
Discounting Factor (DF) 1.000 0.904 0.817 0.739 0.668 0.603 0.545 0.493 0.446 0.403
Per Unit Benefit * DF 4.778 4.875 0.394 0.000 0.000 0.000 0.000 0.000 0.000 0.000
Discounting Factor 1.000 0.901 0.812 0.732 0.660 0.595 0.536 0.483 0.435 0.393
Levellised AD benefit Rs./kWh 1.01220857
Depreciation Calculation

ANALYSIS OF PRIME LENDING RATE OF DIFFERENT EXIM BANKS UNDER EXPORT CREDIT
Page | 43
Cost of Generation Sheet:
Working Capital Sheet:
Value Units656.12 Rs Lakhs
25 years
12 years
196.84 Rs Lakhs
20.00% %
24.00% %
10 years
5.83% %
1.54% %
12 years
10.95% %
5.72% %
8.66
Cost Of Generation Units Year 1 2 3 4 5 6 7 8 9 10
O&M expenses Rs Lacs 11.00 11.63 12.29 13.00 13.74 14.53 15.36 16.24 17.17 18.15
Depreciaition Rs Lacs 38.25198325 38.25198325 38.25198325 38.25198325 38.25198325 38.25198325 38.25198325 38.25198325 38.25198325 38.25198325
Cummulative Depreciaiton Rs Lacs 38.25198325 76.50396649 114.7559497 153.007933 191.2599162 229.5118995 267.7638827 306.015866 344.2678492 382.5198325
Interest on Term Loan Rs Lacs 30.84 28.17 25.50 22.82 20.15 17.48 14.81 12.14 9.46 6.79
Interest on Working Capital Rs Lacs 4.03 4.04 4.05 4.06 4.07 4.08 4.09 4.10 4.11 4.13
Return on Equity Rs Lacs 39.36739271 39.36739271 39.36739271 39.36739271 39.36739271 39.36739271 39.36739271 39.36739271 39.36739271 39.36739271
Total Cost of Generation Rs Lacs 123.49 121.46 119.46 117.50 115.58 113.71 111.88 110.09 108.36 106.68
Per Unit Cost Of Generation Rs/kWh 7.419699945 7.297446231 7.177382848 7.059635082 6.944335387 6.831623793 6.721648339 6.614565532 6.510540831 6.409749161
Discounting Factor 1 0.901306895 0.812354119 0.732180369 0.659919215 0.594789738 0.536088092 0.483179894 0.43549337 0.392513177
Levellised Tariff Rs./kWh 6.608531523
Levellised Tariff With AD benefit Rs./kWh 5.596322953
Discount rate
O&M escalation Rate
Annuity Factor (25 years)
Return on equity - Pretax (Initial Years 10 )
Return on equity - Pretax (later Years 11th Yr Onwards)
Number of years for initial return on equity
Depreciation rate for First 12 years
Depreciation rate 13th year onwards
Number of years for initial depreciation rate
Equity
InputsCapex
Life of plant and Machinery (Project life)
Number of years for initial depreciation rate

ANALYSIS OF PRIME LENDING RATE OF DIFFERENT EXIM BANKS UNDER EXPORT CREDIT
Page | 44
Value Units1000 kw
25 years
11 Lacs/MW
5.72% %
16.644 lakhs KWhs
10.39 Rs/kWh
15.00% of Yearly O&M cost
13.50% %
1 2 3 4 5 6 7 8 9 10
0.00 0.00 0.00 0.00 0.00 0.00 0.00 0.00 0.00 0.00
11.00 11.63 12.29 13.00 13.74 14.53 15.36 16.24 17.17 18.15
0.92 0.97 1.02 1.08 1.15 1.21 1.28 1.35 1.43 1.51
28.82 28.82 28.82 28.82 28.82 28.82 28.82 28.82 28.82 28.82
0.14 0.15 0.15 0.16 0.17 0.18 0.19 0.20 0.21 0.23
29.88 29.94 30.00 30.07 30.14 30.21 30.29 30.38 30.47 30.56
4.03 4.04 4.05 4.06 4.07 4.08 4.09 4.10 4.11 4.13Interest On working Capital
Annual Net Generation
Assumed tariff (Iterative)
Maintenance Spares
Interest on Working Capital
Working Capital
Fuel Cost ( 4 months Equivalent)
O&M (For One Year)
O&M expeses for 1 month
Receivables (2 months of energy charges)
Maintenance Spares
Total Working Capital
O&M Cost Escalation
InputsCapacity
Life of Plant and Machinery (Project Life)
O&M Cost

ANALYSIS OF PRIME LENDING RATE OF DIFFERENT EXIM BANKS UNDER EXPORT CREDIT
Page | 45
Term Loan Sheet:
Profit & Loss Sheet:
Value Units459.29 Lacs
6.98% %
196.84 Lacs
0 years
144 Months
3.19 lacs
0 1 2 3 4 5 6 7 8 9 10 11 12
3.19 3.19 3.19 3.19 3.19 3.19 3.19 3.19 3.19 3.19 3.19 3.19
3.19 3.19 3.19 3.19 3.19 3.19 3.19 3.19 3.19 3.19 3.19 3.19
3.19 3.19 3.19 3.19 3.19 3.19 3.19 3.19 3.19 3.19 3.19 3.19
3.19 3.19 3.19 3.19 3.19 3.19 3.19 3.19 3.19 3.19 3.19 3.19
3.19 3.19 3.19 3.19 3.19 3.19 3.19 3.19 3.19 3.19 3.19 3.19
3.19 3.19 3.19 3.19 3.19 3.19 3.19 3.19 3.19 3.19 3.19 3.19
3.19 3.19 3.19 3.19 3.19 3.19 3.19 3.19 3.19 3.19 3.19 3.19
3.19 3.19 3.19 3.19 3.19 3.19 3.19 3.19 3.19 3.19 3.19 3.19
3.19 3.19 3.19 3.19 3.19 3.19 3.19 3.19 3.19 3.19 3.19 3.19
3.19 3.19 3.19 3.19 3.19 3.19 3.19 3.19 3.19 3.19 3.19 3.19
3.19 3.19 3.19 3.19 3.19 3.19 3.19 3.19 3.19 3.19 3.19 3.19
3.19 3.19 3.19 3.19 3.19 3.19 3.19 3.19 3.19 3.19 3.19 3.19
38.27 38.27 38.27 38.27 38.27 38.27 38.27 38.27 38.27 38.27 38.27 38.27
38.27 76.55 114.82 153.10 191.37 229.64 267.92 306.19 344.46 382.74 421.01 459.29
Installment - 8
Installment - 9
Installment - 10
Installment - 11
Installment - 12
Total Installment
Cumulative Principal Repayment
Installment - 7
No. of Installment for Principal Repayment
Monthly Principal Repayment
Term Loan Repayment Details
Installment - 1
Installment - 2
Installment - 3
Installment - 4
Installment - 5
Installment - 6
Moratorium Period
User InputLoan Amount
Interest Rate
Equity
Term Loan Calculations

ANALYSIS OF PRIME LENDING RATE OF DIFFERENT EXIM BANKS UNDER EXPORT CREDIT
Page | 46
Profit and Loss Calcualation
Value Units
196.837 Rs lakhs
25 Years
32.45% %
20.00% %
1 Year
10 Years
11 Year
10 Years
11 Year
10.39 Rs
1 2 3 4 5 6 7 8 9 10
16.644 16.644 16.644 16.644 16.644 16.644 16.644 16.644 16.644 16.644
10.39 10.39 10.39 10.39 10.39 10.39 10.39 10.39 10.39 10.39
172.9312 172.9312 172.9312 172.9312 172.9312 172.9312 172.9312 172.9312 172.9312 172.9312
0 0 0 0 0 0 0 0 0 0
0 0 0 0 0 0 0 0 0 0
172.9312 172.9312 172.9312 172.9312 172.9312 172.9312 172.9312 172.9312 172.9312 172.9312
0 0 0 0 0 0 0 0 0 0
11.00 11.63 12.29 13.00 13.74 14.53 15.36 16.24 17.17 18.15
161.93 161.30 160.64 159.93 159.19 158.40 157.57 156.69 155.77 154.78
17.32 38.25 38.25 38.25 38.25 38.25 38.25 38.25 38.25 38.25
144.61 123.05 122.38 121.68 120.94 120.15 119.32 118.44 117.51 116.53
34.87 32.21 29.55 26.88 24.22 21.56 18.90 16.24 13.58 10.92
109.74 90.84 92.84 94.80 96.72 98.59 100.42 102.21 103.94 105.61
87.79 72.67 74.27 75.84 77.37 78.87 80.34 81.76 83.15 84.49
Corporate Tax rate
User Inputs
Equity
Life of plant and Machinery (Project Life)
Income from Carbon Market
MAT
Tax Holiday start Year
Tax holiday duration
MAT Set OFF start year
MAT Set OFF accumulation allowed u/s 115JAA (3A)
MAT SET OFF Duration
Levellised Tariff (Cost OF Generation )
Year
Net Energy Sold (lakh kWhs)
Tariff (Rs/kWh)
Income From Sale of Electricity (Lakhs)
Income from REC market
Total Income
Fuel Cost
O&M
EBDIT
Book Depreciation
EBIT
Interest on term loan and Working capital
EBT
PAT

ANALYSIS OF PRIME LENDING RATE OF DIFFERENT EXIM BANKS UNDER EXPORT CREDIT
Page | 47
1 2 3 4 5 6 7 8 9 10
109.74 90.84 92.84 94.80 96.72 98.59 100.42 102.21 103.94 105.61
127.06 129.09 131.09 133.05 134.97 136.84 138.68 140.46 142.19 143.87
109.74 90.84 92.84 94.80 96.72 98.59 100.42 102.21 103.94 105.61
0.00 0.00 0.00 0.00 0.00 0.00 0.00 0.00 0.00 0.00
109.74 90.84 92.84 94.80 96.72 98.59 100.42 102.21 103.94 105.61
1 2 3 4 5 6 7 8 9 10
0.00 0.00 0.00 0.00 0.00 0.00 0.00 0.00 0.00 0.00
21.95 18.17 18.57 18.96 19.34 19.72 20.08 20.44 20.79 21.12
0.00 0.00 0.00 0.00 0.00 0.00 0.00 0.00 0.00 0.00
0.00 0.00 0.00 0.00 0.00 0.00 0.00 0.00 0.00 0.00
21.95 18.17 18.57 18.96 19.34 19.72 20.08 20.44 20.79 21.12
87.79 72.67 74.27 75.84 77.37 78.87 80.34 81.76 83.15 84.49
44.60% 36.92% 37.73% 38.53% 39.31% 40.07% 40.81% 41.54% 42.24% 42.92%
EBT
Year
Gross Income (EBT + Book Depreciation)
Taxable Income
Loss Carried Over*
Taxable Income after loss Carried Over
Years for tax holiday
PAT
Post - Tax ROE
Income Tax
MAT
Set OFF under MAT
MAT Set OFF remaining at the end of each year*****
TAX Paid (MAT or IT)

ANALYSIS OF PRIME LENDING RATE OF DIFFERENT EXIM BANKS UNDER EXPORT CREDIT
Page | 48
Cash Flow Sheet:
Year
0 1 2 3 4 5 6 7 8 9 10 11 12
- 105.11 110.92 112.52 114.09 115.63 117.13 118.59 120.02 121.40 122.74 110.69 111.75
196.84 0.00 0.00 0.00 0.00 0.00 0.00 0.00 0.00 0.00 0.00 0.00 0.00
459.29 0.00 0.00 0.00 0.00 0.00 0.00 0.00 0.00 0.00 0.00 0.00 0.00
656.12 105.11 110.92 112.52 114.09 115.63 117.13 118.59 120.02 121.40 122.74 110.69 111.75
656.12 0.00 0.00 0.00 0.00 0.00 0.00 0.00 0.00 0.00 0.00 0.00 0.00
- 38.27 38.27 38.27 38.27 38.27 38.27 38.27 38.27 38.27 38.27 38.27 38.27
656.12 38.27 38.27 38.27 38.27 38.27 38.27 38.27 38.27 38.27 38.27 38.27 38.27
0.00 0.00 66.84 139.49 213.73 289.55 366.90 445.76 526.07 607.82 690.94 775.41 847.83
0.00 66.84 72.65 74.25 75.82 77.35 78.85 80.32 81.74 83.13 84.47 72.42 73.48
0.00 66.84 139.49 213.73 289.55 366.90 445.76 526.07 607.82 690.94 775.41 847.83 921.31
Particulars
Life of plant and Machinery (Project life) 25
Cash Flow Calculations
Total Outflow
Opening Balance
Surplus/Defict
Closing balance
Cash Profit
Equity
Loan Amount
Total Inflow
Project Cost
Loan Repayment

ANALYSIS OF PRIME LENDING RATE OF DIFFERENT EXIM BANKS UNDER EXPORT CREDIT
Page | 49
Balance Sheet:
Life of Plant and Machinery (Project Life) 25 Years
0 1 2 3 4 5 6 7 8 9 10 11 12
656.12 638.80 600.55 562.30 524.05 485.79 447.54 409.29 371.04 332.79 294.53 256.28
17.32 38.25 38.25 38.25 38.25 38.25 38.25 38.25 38.25 38.25 38.25 38.25
638.80 600.55 562.30 524.05 485.79 447.54 409.29 371.04 332.79 294.53 256.28 218.03
105.11 110.92 112.52 114.09 115.63 117.13 118.59 120.02 121.40 122.74 110.69 111.75
38.27 38.27 38.27 38.27 38.27 38.27 38.27 38.27 38.27 38.27 38.27 38.27
66.84 139.49 213.73 289.55 366.90 445.76 526.07 607.82 690.94 775.41 847.83 921.31
705.64 740.04 776.03 813.60 852.70 893.30 935.36 978.85 1023.73 1069.95 1104.12 1139.34
196.84 196.84 196.84 196.84 196.84 196.84 196.84 196.84 196.84 196.84 196.84 196.84 196.84
87.79 72.67 74.27 75.84 77.37 78.87 80.34 81.76 83.15 84.49 72.44 73.50
87.79 160.46 234.73 310.57 387.94 466.82 547.16 628.92 712.07 796.56 869.00 942.50
196.84 284.63 357.30 431.57 507.41 584.78 663.65 743.99 825.76 908.91 993.40 1065.84 1139.34
459.29 421.01 382.74 344.46 306.19 267.92 229.64 191.37 153.10 114.82 76.55 38.27 0.00
656.12 705.64 740.04 776.03 813.60 852.70 893.30 935.36 978.85 1023.73 1069.95 1104.12 1139.34
0.00 0.00 0.00 0.00 0.00 0.00 0.00 0.00 0.00 0.00 0.00 0.00
Cash Flow from Operations
AssetsGross Fixed Assets
Less : Book Depreciation
Net Fixed Assests
Balance Sheet
Check
Principal Payment
Cash and Equivalent
Total Assets
LiabilitiesEquity Share Capital
PAT for the Year
Reserves and Surplus
Networth
Rupee Debt
Total Liabilities
ANALYSIS OF PRIME LENDING RATE OF DIFFERENT EXIM BANKS UNDER EXPORT CREDIT
Page | 50
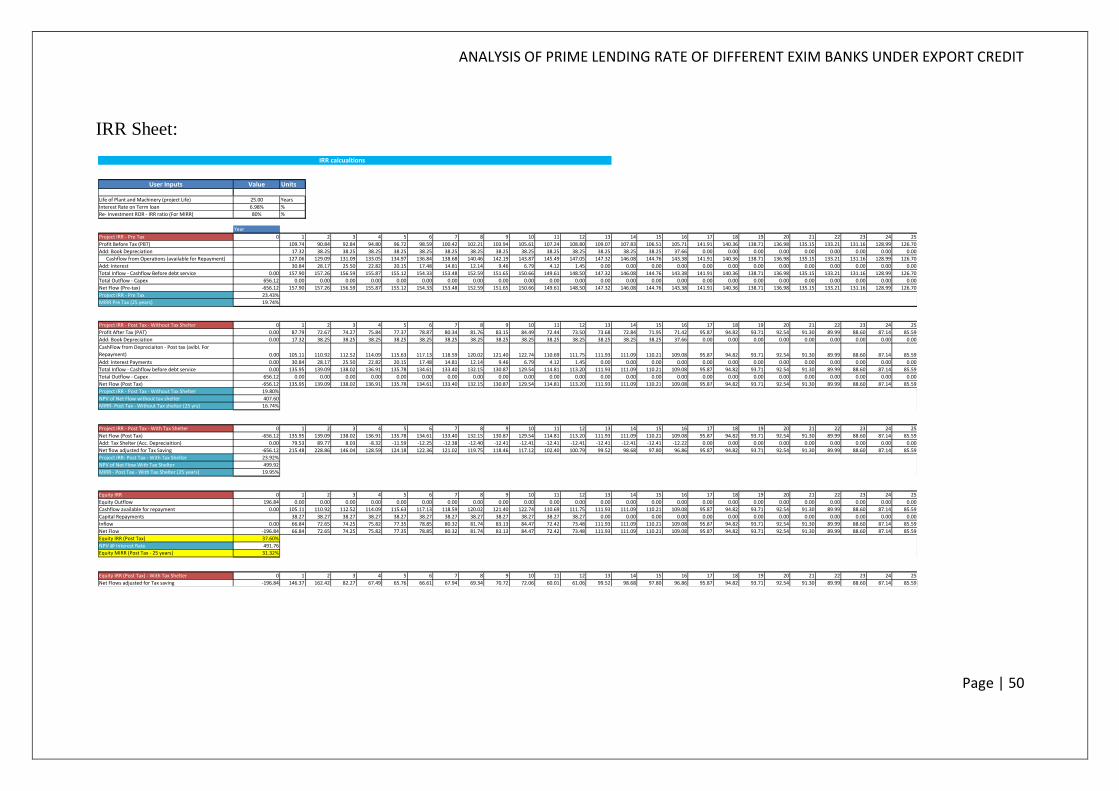
IRR Sheet:
Value Units
25.00 Years
6.98% %
80% %
Year
0 1 2 3 4 5 6 7 8 9 10 11 12 13 14 15 16 17 18 19 20 21 22 23 24 25
109.74 90.84 92.84 94.80 96.72 98.59 100.42 102.21 103.94 105.61 107.24 108.80 109.07 107.83 106.51 105.71 141.91 140.36 138.71 136.98 135.15 133.21 131.16 128.99 126.70
17.32 38.25 38.25 38.25 38.25 38.25 38.25 38.25 38.25 38.25 38.25 38.25 38.25 38.25 38.25 37.66 0.00 0.00 0.00 0.00 0.00 0.00 0.00 0.00 0.00
127.06 129.09 131.09 133.05 134.97 136.84 138.68 140.46 142.19 143.87 145.49 147.05 147.32 146.08 144.76 143.38 141.91 140.36 138.71 136.98 135.15 133.21 131.16 128.99 126.70
30.84 28.17 25.50 22.82 20.15 17.48 14.81 12.14 9.46 6.79 4.12 1.45 0.00 0.00 0.00 0.00 0.00 0.00 0.00 0.00 0.00 0.00 0.00 0.00 0.00
0.00 157.90 157.26 156.59 155.87 155.12 154.33 153.48 152.59 151.65 150.66 149.61 148.50 147.32 146.08 144.76 143.38 141.91 140.36 138.71 136.98 135.15 133.21 131.16 128.99 126.70
656.12 0.00 0.00 0.00 0.00 0.00 0.00 0.00 0.00 0.00 0.00 0.00 0.00 0.00 0.00 0.00 0.00 0.00 0.00 0.00 0.00 0.00 0.00 0.00 0.00 0.00
-656.12 157.90 157.26 156.59 155.87 155.12 154.33 153.48 152.59 151.65 150.66 149.61 148.50 147.32 146.08 144.76 143.38 141.91 140.36 138.71 136.98 135.15 133.21 131.16 128.99 126.70
23.43%
19.74%
0 1 2 3 4 5 6 7 8 9 10 11 12 13 14 15 16 17 18 19 20 21 22 23 24 25
0.00 87.79 72.67 74.27 75.84 77.37 78.87 80.34 81.76 83.15 84.49 72.44 73.50 73.68 72.84 71.95 71.42 95.87 94.82 93.71 92.54 91.30 89.99 88.60 87.14 85.59
0.00 17.32 38.25 38.25 38.25 38.25 38.25 38.25 38.25 38.25 38.25 38.25 38.25 38.25 38.25 38.25 37.66 0.00 0.00 0.00 0.00 0.00 0.00 0.00 0.00 0.00
0.00 105.11 110.92 112.52 114.09 115.63 117.13 118.59 120.02 121.40 122.74 110.69 111.75 111.93 111.09 110.21 109.08 95.87 94.82 93.71 92.54 91.30 89.99 88.60 87.14 85.59
0.00 30.84 28.17 25.50 22.82 20.15 17.48 14.81 12.14 9.46 6.79 4.12 1.45 0.00 0.00 0.00 0.00 0.00 0.00 0.00 0.00 0.00 0.00 0.00 0.00 0.00
0.00 135.95 139.09 138.02 136.91 135.78 134.61 133.40 132.15 130.87 129.54 114.81 113.20 111.93 111.09 110.21 109.08 95.87 94.82 93.71 92.54 91.30 89.99 88.60 87.14 85.59
656.12 0.00 0.00 0.00 0.00 0.00 0.00 0.00 0.00 0.00 0.00 0.00 0.00 0.00 0.00 0.00 0.00 0.00 0.00 0.00 0.00 0.00 0.00 0.00 0.00 0.00
-656.12 135.95 139.09 138.02 136.91 135.78 134.61 133.40 132.15 130.87 129.54 114.81 113.20 111.93 111.09 110.21 109.08 95.87 94.82 93.71 92.54 91.30 89.99 88.60 87.14 85.59
19.80%
407.60
16.74%
0 1 2 3 4 5 6 7 8 9 10 11 12 13 14 15 16 17 18 19 20 21 22 23 24 25
-656.12 135.95 139.09 138.02 136.91 135.78 134.61 133.40 132.15 130.87 129.54 114.81 113.20 111.93 111.09 110.21 109.08 95.87 94.82 93.71 92.54 91.30 89.99 88.60 87.14 85.59
0.00 79.53 89.77 8.03 -8.32 -11.59 -12.25 -12.38 -12.40 -12.41 -12.41 -12.41 -12.41 -12.41 -12.41 -12.41 -12.22 0.00 0.00 0.00 0.00 0.00 0.00 0.00 0.00 0.00
-656.12 215.48 228.86 146.04 128.59 124.18 122.36 121.02 119.75 118.46 117.12 102.40 100.79 99.52 98.68 97.80 96.86 95.87 94.82 93.71 92.54 91.30 89.99 88.60 87.14 85.59
23.92%
499.92
19.95%
0 1 2 3 4 5 6 7 8 9 10 11 12 13 14 15 16 17 18 19 20 21 22 23 24 25
196.84 0.00 0.00 0.00 0.00 0.00 0.00 0.00 0.00 0.00 0.00 0.00 0.00 0.00 0.00 0.00 0.00 0.00 0.00 0.00 0.00 0.00 0.00 0.00 0.00 0.00
0.00 105.11 110.92 112.52 114.09 115.63 117.13 118.59 120.02 121.40 122.74 110.69 111.75 111.93 111.09 110.21 109.08 95.87 94.82 93.71 92.54 91.30 89.99 88.60 87.14 85.59
38.27 38.27 38.27 38.27 38.27 38.27 38.27 38.27 38.27 38.27 38.27 38.27 0.00 0.00 0.00 0.00 0.00 0.00 0.00 0.00 0.00 0.00 0.00 0.00 0.00
0.00 66.84 72.65 74.25 75.82 77.35 78.85 80.32 81.74 83.13 84.47 72.42 73.48 111.93 111.09 110.21 109.08 95.87 94.82 93.71 92.54 91.30 89.99 88.60 87.14 85.59
-196.84 66.84 72.65 74.25 75.82 77.35 78.85 80.32 81.74 83.13 84.47 72.42 73.48 111.93 111.09 110.21 109.08 95.87 94.82 93.71 92.54 91.30 89.99 88.60 87.14 85.59
37.60%
491.76
31.32%
0 1 2 3 4 5 6 7 8 9 10 11 12 13 14 15 16 17 18 19 20 21 22 23 24 25
-196.84 146.37 162.42 82.27 67.49 65.76 66.61 67.94 69.34 70.72 72.06 60.01 61.06 99.52 98.68 97.80 96.86 95.87 94.82 93.71 92.54 91.30 89.99 88.60 87.14 85.59
Re- Investment ROR - IRR ratio (For MIRR)
User Inputs
Life of Plant and Machinery (project Life)
Interest Rate on Term loan
IRR calcualtions
MIRR Pre Tax (25 years)
Project IRR - Pre Tax
Profit Before Tax (PBT)
Add: Book Depreciation
Cashflow from Operations (available for Repayment)
Add: Interest
Total Inflow - Cashflow before debt service
Total Inflow - Cashflow Before debt service
Total Outflow - Capex
Net Flow (Pre-tax)
Project IRR - Pre Tax
Project IRR - Post Tax - Without Tax Shelter
Profit After Tax (PAT)
Add: Book Depreciation
CashFlow from Depreciaiton - Post tax (avlbl. For
Repayment)
Add: Interest Payments
NPV of Net Flow With Tax Shelter
MIRR - Post Tax - With Tax Shelter (25 years)
Total Outflow - Capex
Net Flow (Post Tax)
Project IRR - Post Tax - Without Tax Shelter
NPV of Net Flow without tax shelter
MIRR- Post Tax - Without Tax shelter (25 yrs)
Net Flow
Project IRR - Post Tax - With Tax Shelter
Net Flow (Post Tax)
Add: Tax Shelter (Acc. Depreciaition)
Net flow adjusted for Tax Saving
Project IRR- Post Tax - With Tax Shelter
Equity IRR
Equity Outflow
Cashflow available for repayment
Capital Repayments
Inflow
Equity IRR (Post Tax)
NPV @ Interest Rate
Equity MIRR (Post Tax - 25 years)
Equity IRR (Post Tax) - With Tax Shelter
Net Flows adjusted for Tax saving