of measuring vapor pressures of lubricants with their ... · vapor pressure, the quantity of the...
TRANSCRIPT

NASA Technical Memorandum 104633
Methods of Measuring Vapor Pressures of Lubricants With Their Additives Using TGA and/or Microbalances
John J. Scialdone, Michael K. Miller, and Alex F. Montoya
I May 1996
https://ntrs.nasa.gov/search.jsp?R=19960022382 2018-11-09T15:33:02+00:00Z

NASA Technical Memorandum 104633
Methods of Measuring Vapor Pressures of Lubricants With Their Additives Using TGA and/or Microbalances
John J. Scialdone, Michael K. Miller, and Alex F. Montoya
National Aeronautics and I Space Administration
I Goddard Space Flight Center Greenbelt, Maryland 20771
1996

800 Elkridge Landing Road, Linthicum Heights, MD 2 1090-2934, (301 ) 62 1-0390.

Methods of Measuring Vapor Pressures of Lubricants With Their Additives Using TGA and/or Microbalances
ABSTRACT The life of a space system may be critically dependent on the lubrication of some. of its moving parts. The vapor pressure, the quantity of the available lubricant, the temperature and the exhaust venting conduc- tance passage are important considerations in the selection and application of a lubricant. In addition, the oil additives employed to provide certain properties of low friction, surface tension, antioxidant and load bearing characteristics, are also very important and need to be known with regard to their amounts and vapor pressures. This paper reports on the measurements and analyses carried out to obtain those param- eters for two often employed lubricants, the Apiezon@-C and the Krytox@ AB. The measurements were made employing an electronic microbalance and a Thermogravimetic Analyzer (TGA) modified to operate in a vacuum. The results have been compared to other data on these oils when available. The identification of the mass fractions of the additives in the oil and their vapor pressures as a function of the temperature were carried out. These may be used to estimate the lubricant life given its quantity and the system vent exhaust conductance. It was found that the Apiezon@-C has-three main components with different rates of evaporation while the Krytox@ did not indicate any measurable additive.
Introduction
Future space missions will employ systems and mechanisms which need to last for many years with- out maintenance. They will have to survive in an environment of very low ambient pressure, high ra- diation, energetic particles, meteoroids, absence of gravity, exposure to coniraminani gases and partides and be limited in their weight and sizes. One of the important limiting features of these systems is the lubrication of moving parts which requires critical attention. The life of the lubricant is predicated on its vapor pressures at the operating conditions, and on its chemical additives, which are employed to pro-
. duce certain characteristics of friction, surface ten- sion, and load. The vapor pressures affected expo- nentially by the operating temperatures, the lubrica- tion regimes, the amount of lubricant, and the am- bient pressure dictate with the conductance of the vent passage, the rate of lube loss, and the eventual lubricated system failure. Another important con- sideration of a lubricated system, is the migration of the lubricant in liquid or molecular form on critical nearby surfaces. The migration and resultant de-
posits can cause thermo-optical degradation of those surfaces especially when the deposit is exposed to high radiations. These are some of the reasons to know the lube vapor pressures as characterized by the presence of oil additives. This paper reports the iiiedsuienieiits of the vapor piessure of CWO coin- monly employed lubricants, the Apiezon@-C and the Krytox@AB. The measurements were made using a modified Thermogravemetric Analyzer (TGA), and an electronic microbalance. The results have been compared to data from manufacturers and from other sources of measurements.
Experimental
The Oils As indicated, the two lubricants tested are the Apiezon"! C and the Krytox@ 143 AB. The ApiezonO C (MA79 g/mole) is a stable oil with a low vapor pressure (V.P.) designed for vacuum use. It includes esters and spe- cially selected hydrocarbons. According to the manu- facturer, it is unaf€ected by traces of water and other
Apiezone is a product of Biddle Instruments, Blue Bell, PA. Krytoxa is a DuPont De Nemours and Company (Inc.) product.
1

vapors and does not liberate corrosive acids. Its physi- cal properties are reported in reference 1. The refer- ence includes the vapor pressures versus tempera- tures obtained using the Knudsen method. The manufacturer indicates that the oil can be treated with antioxidant to allow a large number of atmospheric exposures and can include inhibitors and passivators as additives. The ApiezonO C tested in this report contained a 5% lead naphthanate (Pb-N) additive which had been added by Ball Bros. for space appli- cations and reported by them to have been performed successfully for many years since the 1960s. The oil does not pass the outgassing material acceptance criteria ASTM-E595 (reference 2) and concerns about its use were raised. These resulted in this and other investigations on the oil mass losses versus temperatures and on the assessment of the contami- nation hazards which could result from the evapora- tion of the lead-naphthanate additive. The initial investigation (reference 3) about this oil indicated the following results: 1. The percentage of the Pb-N in the oil remained unchanged after oil degassing, as indicated by x-ray fluorescent spectroscopy and Fl3R analyses. 2. The oil absorbs atmospheric gases as other hydrocarbon oils do. It forms visible bubbles after being exposed for about 20 days to normal environment. Those entrapped gases are released in a vacuum and they may splash oil on nearby surfaces if the oil is not degassed for 30-40 minutes in a low vacuum at nor- mal temperature. 3. The oil vapor pressures ob- tained from mass rate losses at 3 temperatures re- corded by a Calm analytical microbalance for a period of 48 hours, varied from 2 x lo8 torr at 10 "C to 1.2 x 10⁶ @ 70 "C. Those pressures are shown for compari- son in a plot of pressures, obtained from other meth- ods, which will be discussed later.
The KrytoxO 143 AB oil is a Perfluorinated Alkyl Polyether designed to be used in vacuum pumps handling reactive chemicals. According to the manu- facturer it has excellent oxidative and thermal sta-
bility, chemical inertness, low vapor pressure, ex- cellent lubricity and is compatible with metal plas- tics and elastomers. These properties and plots of the vapor pressures obtained using the Knudsen ef- fusion method are included in reference 4. The oil with a mole mass of 3500 g/mole consists of a se- ries of fluorine end-capped linear homopolymers. The polymer chain is completely saturated and in- cludes C, 0 and F with no H or additives. The vapor pressures indicated in the reference are reported here with the present results. In addition to those vapor pressures, values obtained using an equation devel- oped in reference 5 from an isoteniscope measure- ments are also shown. Also reported, are the vapor pressures of the oil obtained from the rate of accu- mulation of condensed oil on a Thermal Quartz Crys- tal Microbalance (TQCM) located on the wall of a box containing a motor lubricated with this oil (ref- erence 6).
Test Data
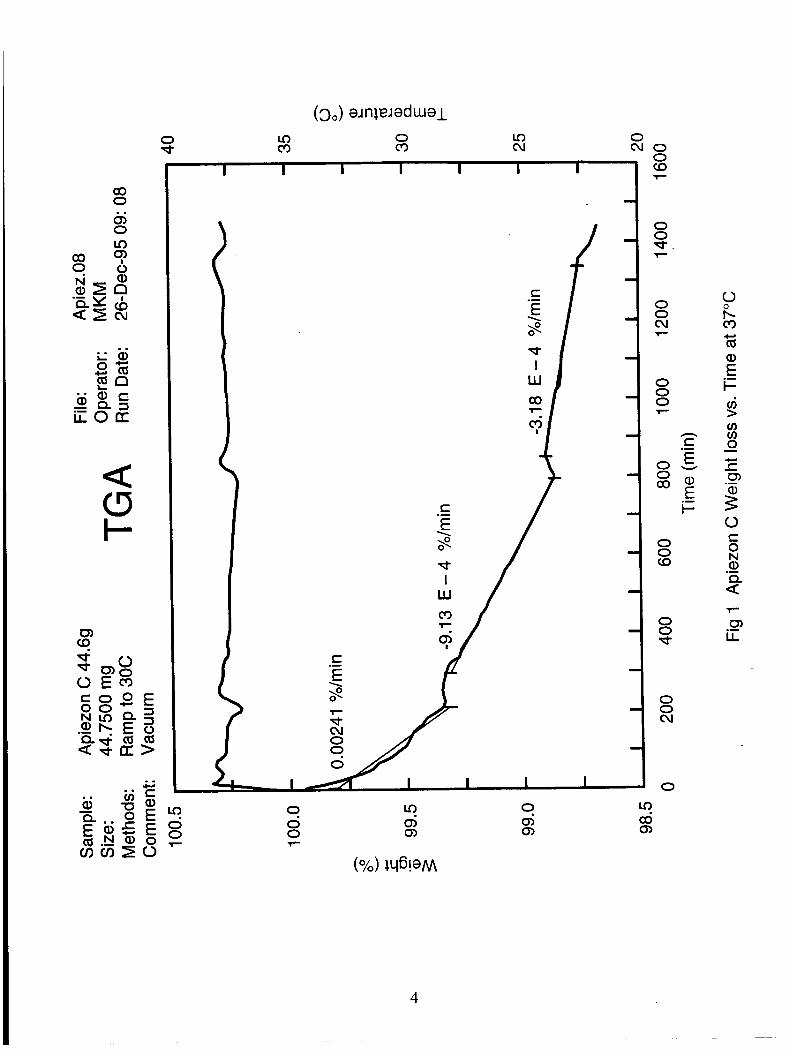
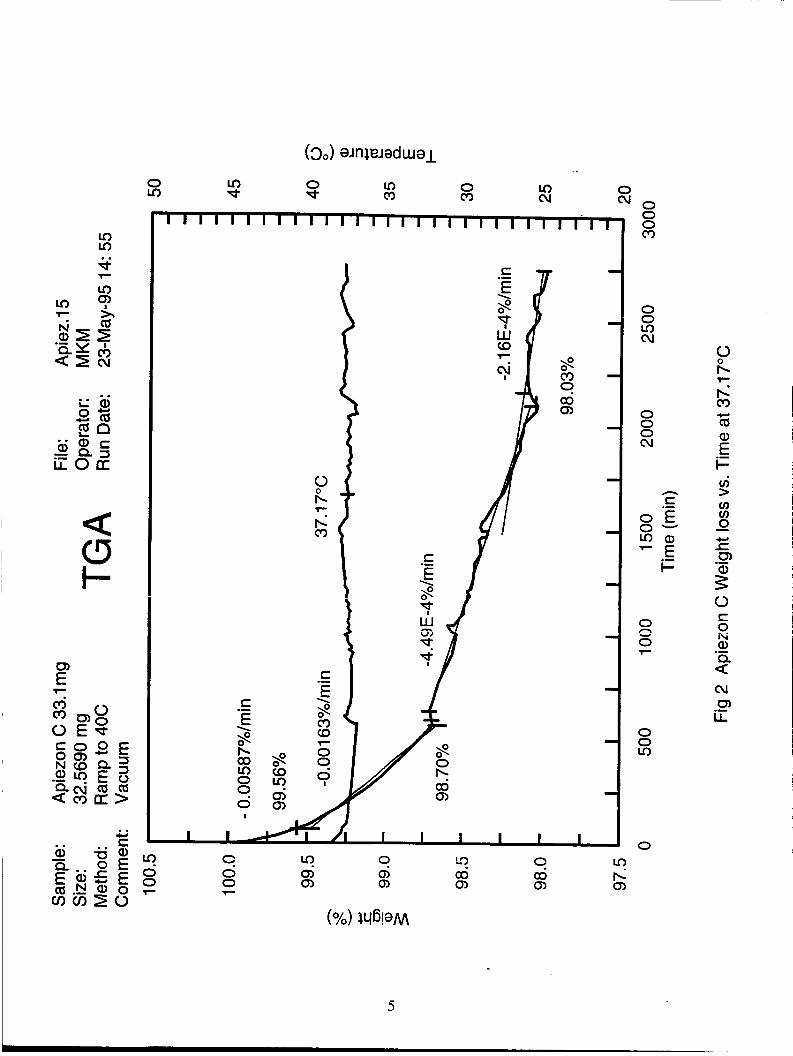
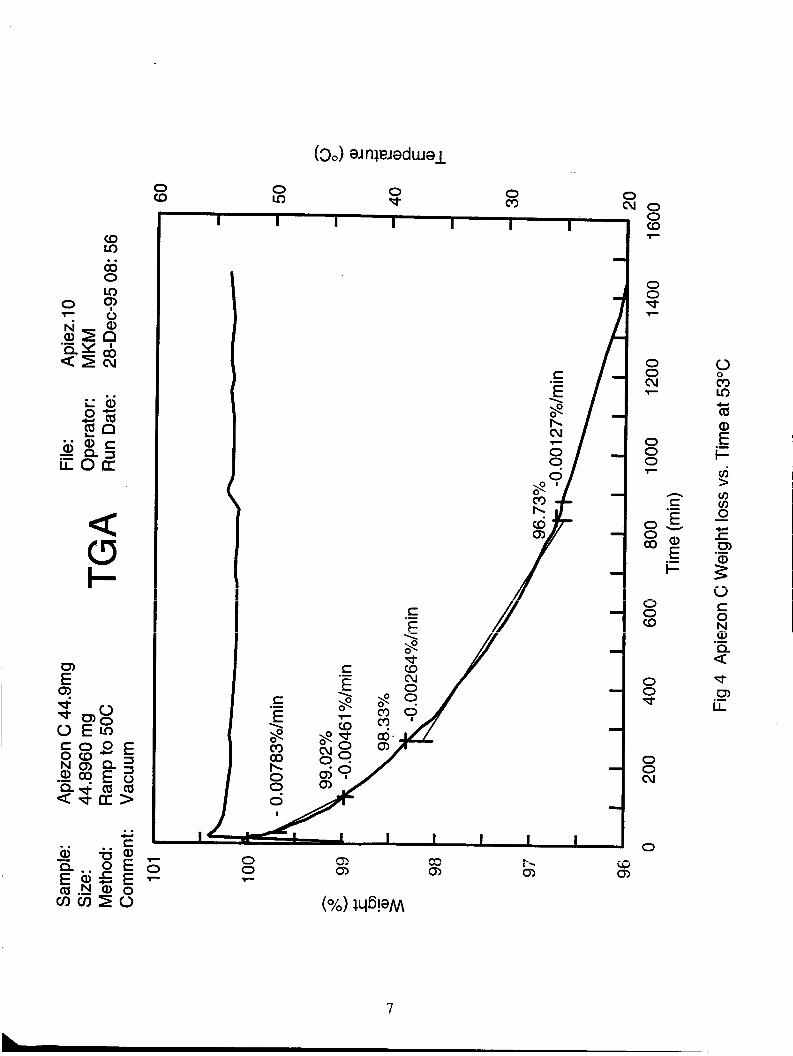
The two oils were tested in a TA Instruments 951 TGA which was modified to accept a vacuum of less than 10" torr in the volume where the oil to be ana- lyzed is contained. The electronic balance of the TGA measures continuously the mass loss of the oil which is held in a basket at a preset temperature. The mass and the temperature are continuously monitored and computer recorded. The mass loss and the rate of mass loss for the oils held at constant temperatures were utilized to calculate the vapor presures of the oil and its components. The per- centage of those components in the oil were obtained from changes in mass loss rates occurring during the tests and the duration of each of those rates. ApiezonO mass losses were carried out at tempera- tures of 37.51,37.17,45,53 and 70 "C as shown in (figures 1, 2, 3, 4 and 5). The KrytoxO tests were carried at several temperatures as indicated on the plot of its vapor pressures. Individual plots of mass
2

loss for the Krytox@ are not included since the pres- sures were obtained from the mass loss rates directly, with no concern for components since they are known to be absent in this oil.
Analvsis
Figures 1 ,2 ,3 and 4 show the percent mass loss of the Apiezon@ oil versus time at 4 different tempera- tures. Along the mass loss curves at those tempera- tures, the changes in loss rates occur and are well distinguishable. The location of the changes are also reflected in the plot of the temperatures. Those changes are produced by the components of the oil and have been interpreted to reflect the presence or the depletion of oil components. The temporary changes in temperature reflect the depletion of one of the components of the oil. During the evapora- tion of that component, the temperature of the oil is constant and the supplied evaporation energy is con- stant. However, when the component is depleted, the supplied energy exceeds the requirements and the oil temperature increases. The instrument then adjusts the amount of energy being supplied and the temperature returns to the set vaiue. The four fig- ures indicate that Apiezon has 3 major different rates of evaporation. These 3 rates have been empioyed to obtain the corresponding vapor pressures of 3 stages of the oil evaporation and they have been taken to reflect the presence of 3 components in the oil. Figure 5 shows the mass loss of the oil at 70 OC. At that temperature, the higher volatile components of the oil are rapidly being exhausted and it is more difficult to obtain the loss rates versus time of the oil components.
The vapor pressures were obtained from the rate of mass loss w(g/s) at the various test temperatures uti- lizing the Langmuir's relation w = PA =/ 17.14 ( g / s ) where P(torr) is the pressure, T(K) the tem- perature, M(g/mole) the mole mass and A(cm2) is the exposed surface area of the oil. The various oil
components were identified by the different mass loss rates shown by the record of the mass loss ver- sus time. The mole mass M for the components uti- lized in the above equation were estimated by com- paring the ratios of the loss rates of the components to that of the long term rates which reflect the known mole mass of the oil (M=479g/mole). For example, the loss rate of the long term oil component at 45 "C (figure 3) was 9.56~10-~ %/min while the rate of the second component was 2 . 9 9 ~ 1 0 ~ %/min, i.e., 3.1 times greater than the long term rate. The mole mass of the second component was then assumed to be 3.1 times smaller than that of the final component. The method was carried out for the data of each iso- thermal test and the results were then averaged. The average ratio for the second component was found to be 3.06 and for the first component 8.95 so that the first component may have a M=479/8.95=54g/ mole and the second M=479/3.06= 156g/mole.
.
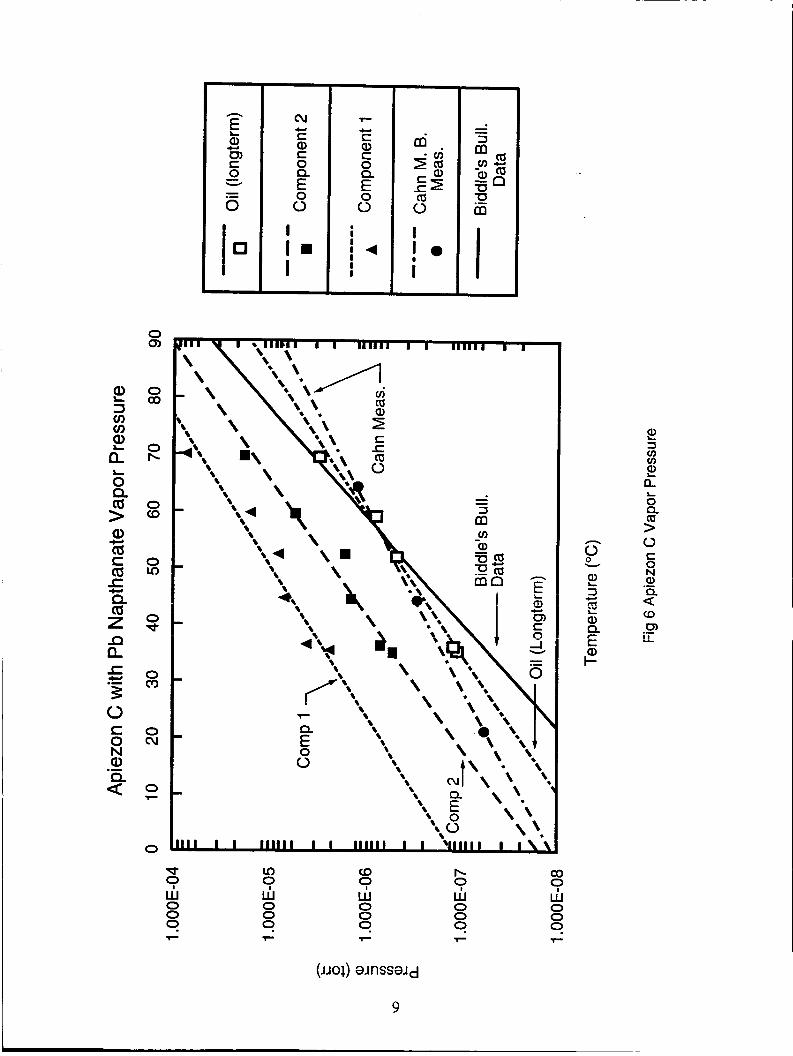
The vapor pressures (V.P.) and the fractions of the various components in the oil have been obtained from the isothermal evaporation rates shown in fig- ures 1,2,3,4. The values of the rates and the peri- ods of time during which those rates existed are in- dicated. Those rates have been identified as rate RI, R2 and R3 where Rl idenufies the iniiiai evaporaiion rate of the oil. The V.P. for each of those regions of the evaporation were calculated using the indicated equation applied for the 4 tested temperatures and using the estimated mole masses. Figure 6 shows those V.P. The process was carried out for each of the 3 recognized components.
Component 1 has a V.P. about 7 times higher than that of component 2, about 30 times higher than that of the component 3 which is the long term and the major component of the oil. The V.P. of the same oil as reported by the manufacturer (reference 1) and as calculated from measurements using a vacuum Cahn micobalance (reference 3) are shown. The Cahn measurements recorded the integrated evaporation
3
00 0 Q, 0 ..
a 0 I-
0 d.
m m
.. ..
0 c3
I I I I I I I
9 0 0
0 0 *. v
0 0 cv 7
0 0 0 7
n c o w
.- E
E i=
s a
0 0 (0
0 0 *
0 0 cv
0
Ln co a
4
Lo 0 In 0 0 a 0 m * N O d- 0 m cv 0 0 c3
C .- E 8 \
b co In 0 0 0 I
I I I I I I
9 0 0
9 co Q)
0 0 In cu
0 0 0 cu
n C
0- m a 0 -E - €
i=
8 0 F
0 0 In
0
5

c u m - 0 )
a (3 I-
F 9
In d-
m 0 N . cu
I I I I I I I I I I I
0 0 T
0) m b m
(D 0)
7
0 0 0 7
n C
o w .- E
SQ .- I-
O 0 (D
0 0 d-
0 0 cu
0
6
0 co
co m co 0 Lo
..
a u
0 0 m N o
0 I I I I I I I
0 0 F
.- E 52- t
i=
2, 0 CQ
0 0 *
0 0 cv
0
7

m
0 7 .. 7
a c3 I-
co m m g 0 E b
0 co
S .- E \ 3 cu d m 0 9 I
0 cu
0 0 7
s! cq a3
h
I I I I
Lo m Ln co
0 co
0 0 * 7
0 0 0 7
n S
o w .- E
E i=
Z Q )
0 0 (0
0 0 d-
0 0 cv
0
8
I
0 m
* v) CD b co 9 W
9 W
9 W 0 0 0 0 0 0 0 0 0 0 9 0
9 W
9 W
9

loss of the oil during 48 hours of tests carried at several temperatures. No differentation of the component's rates was possible with the Cahn balance. The V.P. from those two sources appear to match those of the TGA long term component at a temperature of 60 "C.
The actual V.P. of the oil characterized by the 3 stages of evaporation and the components fractions in the oil were obtained as follows. The measured evaporation rate R1 includes the evaporation of component 2 and 3 while the rate R2 includes that of component 3, R3. The rate R3 is the long term evaporation of the lube and does not contain other components. The actual evaporation of the component 1 is then r,,=Rl-(r,+r2), for a component 2 is r2=R2-r3 and for a component 3 is r3=R3. These relations were applied and solved for the four tested temperatures and eventually the results averaged as shown in Table 1. For example, for the test at 45 "C, the results using the rates shown in figure 3 were r,=5.75x10³ %/min, r2=2.0Mx103 %/min and r3=9.56x10⁴%/min. The percentage refers to the original amount of the oil used in the test as indi- cated in the figure (36.08 mg for the 45 "C test).
The percentage of those components in the oil were obtained using the above rates ri(%/min) and the length of time 6 each of those rates (Ri) existed as indicated by the curves for mass losses versus time. For example for the 45 "C test, the amount of compo- nent one is M,,=r, t ,=5 .75~10-~ %/min x 60 min=o.345%, for component two m2=r2t2=2.034x 1 O4 %/min x 540 min=1.098% and for component three m3=100%-(m,+m2)%=98.5%. The average for the 4 tested temperatures, as shown in Table 1, are: 0.37 1 % for component one, 0.746% for component two and 98.85% for the long term component three. The percentages for components one and two are quite small and could reflect the molecular distribu- tion of the oil with component one being the frac- tion of molecules with the lowest molecular mass and component three the highest and largest frac-
tion of the oil. This may indicate that no other addi- tive is included in the oil other than the 5% lead- naphthanate which as indicated from other analyses remains unchanged at least at these temperatures.
The V.P. of the Krytox@ 143 AI3 as shown in figure 7 was obtained from isothermal tests at temperatures shown by data points and varying from 22 to 84 "C. The figure shows also the V.P. obtained from other sources. The Vacuum TGA results, reported here, are about 5% of those reported in the Dupont bulle- tin for this oil and about 10 times higher than the values measured in a system utilizing oil condensa- tion on a TQCM mounted on the surface of a box which contained a motor lubricated with this oil (ref- erence 6) . Another comparison is with values re- ported in reference 7 obtained with a isoteniscope at high temperatures (>lo0 "C) and extrapolated to lower temperatures. These values are 2-3 orders of magnitude lower than those found here. The oil has no additives and no differentiation of rates of losses were noted during TGA testing.
Conclusions
The vapor pressures as a function of temperature of the components of two lubes, the Hydrocarbon based Apiezon@ and the perfluorinated Alkyl Polyether KrytoxO were obtained experimentally using a TGA instrument modified to work in vacuum. These oils are frequently employed to lubricate space niecha- nisms. An important result of the tests and their in- terpretations has been the identification of the frac- tion of additives in the oil and their respective rates of evaporation as a function of temperatures. Using the method developed here in conjunction with TGA measurements, the life of the lubricant which de- pends on the rates of evaporation of the oil compo- nents and the amount of those components in the oil, can be estimated when the lube exhaust conduc- tance is known.
10

m 00 Q)
09 (v
0, Q)
c\! 9 co Q) 3 i- ,I o
3 0 X m m
T-
c" T-
II P 0 X (D
0)
v
v!
P 0 X 00 T-
T-
ci
3 0 X d r
T .- a, m a 0
0
w
w- (0 a2 0 ?
m 0 r'
co b Q! v
It 4-
c v) a
3
- z1
P 2 v) v)
U S a c 0
0 Q
G 0 a,
.- c 2
2 - c
2
8
0 'c 0 a,
a
.-
.- f c Y- O
a c Q)
c a 0 0 U 0
s - _- z c
5
a E
c 0
0 n (51 > a,
.- c 2
3 0 X m (D
cu
v
(9
3 0 x * m (v
v
9
c? 0 X
a0
7
7
r r
t 0 x m m
T-
a!
Q)
0 5 'c
In * "!
d a 9:
3 a-0
3 0 X cu m
T-
c\!
~
c? 0 x In
In
T-
F'
i- c? 0 X d
d
7
cu
p! 0
x b Q)
7
T T-
b
m
r
r; sz In * b m I-
; i- .E l l E - .$? 8 - Y .- i- E
11

12

For the oil analyzed here, it was found that the Apiezon@ C lube includes 3 components with dif- ferent rates of evaporation. It has an initial high evaporation rate followed by a second and eventu- ally a lower long term rate. In fact, the initial rate applies to 0.37% of the oil mass and has a rate about 7 times higher than that of the second evaporation rate which applies to 0.75% of the oil. The initial rate is also about 30 times higher than the rate of the long term fraction of the oil which is 98.85% of the lube. The vapor pressure of this oil at 20 “C has an initial value of 6 ~ 1 0 - ~ torr and a final long term pres- sure of 2x10-* torr. The time for the change from one pressure to the other depends on the amount of the components in the oil. Those pressures and the evaporation rates are of course exponential functions of the temperatures and equations of pressures ver- sus temperature could be derived from the plots shown here.
The results of the tests for the Krytox@ AB show as expected the absence of additives and that its vapor pressure as shown in the plot of V.P. versus tempera- ture is about 5x10⁸ torr at 20 “C and 2x10⁶ torr at 70 “C. These pressures are about one order of magni- tude lower than those given by the manufacturer but
a special test set-up. Comparison with other mea- surements of vapor pressure have been included in the presentation of the V.P. for both oils.
bigher ‘,k,m t h e prwided !qj the iise of a TQC?”t il?
Acknowledaement
One of the authors, M.K. Miller, wishes to thank Dr. P. Chen for his guidance and advice while he was at GSFC as a P E S T (Program for Research and Edu- cation for Space Technology) graduate student of the Air Force Academy.
Ref e re nces
1. “Apiezon,-Oil, Grease and Waxes for High Vacuum Work”, Biddle Instrument, Bulletin #43c.
2. “Total Mass Loss (TML) and Collected Volatile Condensable Materials (CVCM) from Outgassing in a Vacuum Environment”, American Society for Testing and Materials, E-595-90 Standard Test Method, Philadelphia, PA, 1990.
3. “EOS-PM Bearing Lubricant Analysis: Apiezon- C with 5% Lead Naphthanate”, J.J. Scialdone memo 950425A, Code 313 Memo Bank, to EOS AM Project/M. Domen, NASA-GSFC Greenbelt, MD.
4. “Krytox,, Fluorinated Oils”, Dupont Technical Literature-E.I. duPont de Nemours & Co., Inc., Wilmington, DE 19898.
5. “Krytox Vapor Pressure”, J.J. Scialdone memo 941214, Code 3 13, Memo Bank, to Deputy Chief of Surface Science BrancWS 140 NASA Lewis RC, NASA-GSFC Greenbelt, MD.
6 . “Sounder High Temperature Filter Wheel Test
Scialdone Memo 950908A, Code 3 13 Memo Bank, to R. Ross, GOES Project/415, NASA-GSFC Greenbelt, MD.
T T ~ : . . ~ T-.---- t .._- n..A-t- nx:---L-i ---- - 9 T T uaii i i j L L I I I ~ L I & U I C y u a i u i v i i L i w u a i d i i L c , J.J.
7. G. H. Allborn, “Vapor Pressure and Evaporation Rate of Fluids in Vacuum as Determined from Am- bient Pressure Measurements”, Asle Transactions, Vol. 20,3, pg. 209-220.
13
Form Approved REPORT DOCUMENTATION PAGE I OMB NO. 0704-0788
I. TITLEANDSUBTITLE
Methods of Measuring Vapor Pressures of Lubricants With Their Additives Using TGA and/or Microbalances
i. AUTHOR@)
'ubk reporbng burden for this cdleuion of information IS estmated to average 1 hour per respmse. including the tme for reviemng Instructmns. searchvlg exlstng data x)ums. gatherang nd mantanma the data needed. and completng and revlewHlg the collection 01 infonnalmn Send comments reaardlna this burden estunate of anv aher a w of this coIIectm 01
5. FUNDING NUMBERS
Code 313
ifcmatlon. m&ding SuggeStionS for redUCmg thlS burden. 10 WashngtMl Headquarters S e w s . Directorate for-lnfomiallon Operatms and Repoks. 1215 Jefferson Davis Hghway Sune 2w. Arlmgtar. VA 22202-4302, and to the Onlce Of Management and Budget. Paperwork Reduction Prole3 (0704-0188). Washington. Dc 20503 AGENCY USE ONLY (Leave blank) I 2. REPORT DATE I 3. REPORT TYPE AND DATES COVERED
b. SPONSOWNGlMONITORlNG AGENCY NAMYS) AND ADDREWES)
NASA Aeronautics and Space Administration Washington, D.C. 20546-0001
10. SPONSORINGMONITORING AGENCY REPORT NUMBER
TM- 104633
'. PERFORMING ORGANlZATlON NAME(S) AND ADDRESS(ES1 I 8. PERFORMING ORGANIZATION
12a. DISIRIBWIOWAVALABILITY STATEMENT
Unclassified-Unlimited Subject Category: 24 Report available from the NASA Center for Aerospace Information, 8x3 E!k,",dg:e kcd ing Read, Lin:hicurn Heiph's, ?.El 2!0?0; (30!) 62!-03?0.
. . . . Goddard Space Flight Center Greenbelt, Maryland 2077 1
12b. DISTRIBUTION CODE
REPORT NUMBER
96A0063 1
14. SUBJECT TERMS Temperature-controlled Quartz Crystal Microbalance (TQCM), lubricants, vapor pressure
17. SECURITY CWFICATION 48. SECURITY CLASSIFICATION 19. SECURITY CLASSIFICATION OF REPORT OF THIS PAGE OF ABSTRACT
Unclassified Unclassified Unclassified
15. NUMBER OF PAGES 13
16. PRICE CODE
20. LIMITATION OF ABSTRACT
Unlimited
The life of a space system may be critically dependent on the lubrication of some of its moving parts. The vapor pressure, the quantity of the available lubricant, the temperature and the exhaust venting conductance passage are important considerations in the selection and application of a lubricant. In addition, the oil additives employed to provide certain properties of low friction, surface tension, antioxidant and load bearing characteristics, are also very important and need to be known with regard to their amounts and vapor pressures. This paper reports on the measurements and analyses carried out to obtain those parameters for two often employed lubricants, the Apiezon@-C and the Krytox@ AB. The measurements were made employing an electronic microbalance and a thermogravimetic analyzer (TGA) modified to operate in a vacuum. The results have been compared to other data on these oils when available. The identification of the mass fractions of the additives in the oil and their vapor pressures as a function of the temperature were carried out. These may be used to estimate the lubricant life given its quantity and the system vent exhaust conductance. It was found that the Apiezon@-C has three main components with different rates of evaporation while the Krytox@did not indicate any measurable additive.