of may a procedure for the assessment of the … procedure for the assessment of the undrained shear...
TRANSCRIPT
NGM 2016 Reykjavik
Proceedings of the 17th
Nordic Geotechnical Meeting
Challenges in Nordic Geotechnic 25th
– 28th
of May
IGS 533 NGM 2016 - Proceedings
A procedure for the assessment of the undrained shear strength
profile of soft clays
Vikas Thakur
Norwegian University of Science and Technology, Norway, [email protected]
Odd Arne Fauskerud1, Vidar Gjelsvik
2, Stein Christensen
3, Frode Oset
4, Steinar Nordal
5,
Margareta Viklund6, Stein-Are Strand
7
1Multiconsult As, Norway
2Norwegian Geotechnical Institute, Norway
3SINTEF Building and Infrastructure, Norway
4Norwegian Public Roads Administration, Norway
5Norwegian University of Science and Technology, Norway
6Norwegian National Rail Administration, Norway
7Norwegian Water Resources and Energy Directorate, Norway
ABSTRACT
In the geotechnical research community, there is widespread agreement that the choice of the
characteristic undrained shear strength (cuA) is very important and plays an essential role in the
design and stability analysis of various geotechnical constructions placed in or on soft clay
deposits. Thus, the choice of undrained shear strength, both conservative and non-conservative,
could have major economic (and social) consequences in many projects. This paper summarizes
the work carried out by engineers and scientists representing various institutions in Norway to
provide a sound engineering method to determine characteristic shear strength of soft clays. This
paper presents a recommendation on how to determine a characteristic cuA profile based on
laboratory and in situ testing methods and discuss the impact of stress history, strain rates,
Atterberg’s limits, and sample disturbance on the undrained shear strength of soft clays measured
at a single borehole location. The discussion is supported by the results obtained from laboratory
and field-testing. This paper highlights the key issues related to the extrapolation of undrained
shear strength of soft clay from a given borehole location to a large soil volume.
Keywords: Soft clays, undrained shear strength, sample disturbance.
1 INCEPTION
The concept of shear strength goes back to
1773 when Coulomb proposed the following
equation:
(1)
This was the first time that shear strength (f)
was regarded as consisting of two parts, i.e.,
cohesive resistance (c) and frictional
resistance (), that increase proportionally
with normal pressure (). However, the
strength parameters c and , as introduced by
Coulomb, remained difficult to determine,
especially when cohesive soils were
involved. Based on numerous direct shear
tests from 1934 to 1937, Hvorslev reached
the two main conclusions that
cohesion (c) depends merely on water
content;
the angle of internal friction () is a soil
characteristic.
Hvorslev replaced the normal pressure in Eq.
1 with effective normal stress or the
difference of total stress and pore pressure as
(2)
Investigation, testing and monitoring
NGM 2016 - Proceedings 534 IGS
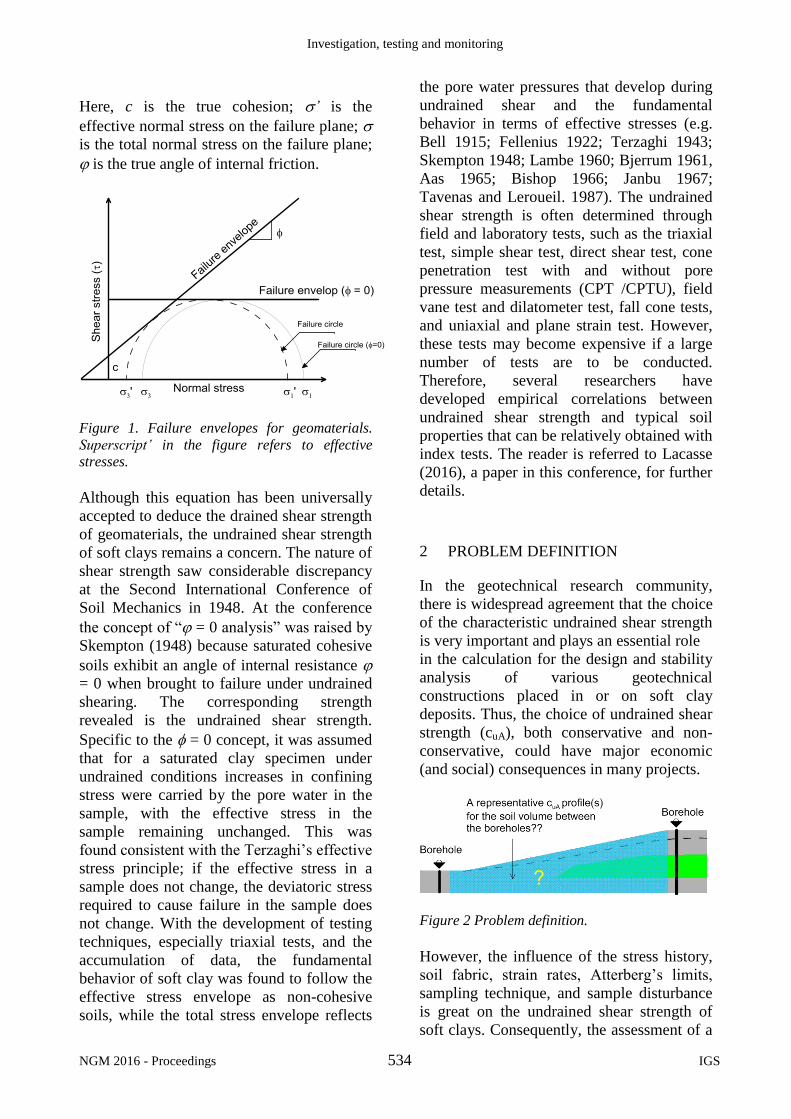
Here, c is the true cohesion; ’ is the
effective normal stress on the failure plane;
is the total normal stress on the failure plane;
is the true angle of internal friction.
Figure 1. Failure envelopes for geomaterials.
Superscript’ in the figure refers to effective
stresses.
Although this equation has been universally
accepted to deduce the drained shear strength
of geomaterials, the undrained shear strength
of soft clays remains a concern. The nature of
shear strength saw considerable discrepancy
at the Second International Conference of
Soil Mechanics in 1948. At the conference
the concept of “ = 0 analysis” was raised by
Skempton (1948) because saturated cohesive
soils exhibit an angle of internal resistance
= 0 when brought to failure under undrained
shearing. The corresponding strength
revealed is the undrained shear strength.
Specific to the = 0 concept, it was assumed
that for a saturated clay specimen under
undrained conditions increases in confining
stress were carried by the pore water in the
sample, with the effective stress in the
sample remaining unchanged. This was
found consistent with the Terzaghi’s effective
stress principle; if the effective stress in a
sample does not change, the deviatoric stress
required to cause failure in the sample does
not change. With the development of testing
techniques, especially triaxial tests, and the
accumulation of data, the fundamental
behavior of soft clay was found to follow the
effective stress envelope as non-cohesive
soils, while the total stress envelope reflects
the pore water pressures that develop during
undrained shear and the fundamental
behavior in terms of effective stresses (e.g.
Bell 1915; Fellenius 1922; Terzaghi 1943;
Skempton 1948; Lambe 1960; Bjerrum 1961,
Aas 1965; Bishop 1966; Janbu 1967;
Tavenas and Leroueil. 1987). The undrained
shear strength is often determined through
field and laboratory tests, such as the triaxial
test, simple shear test, direct shear test, cone
penetration test with and without pore
pressure measurements (CPT /CPTU), field
vane test and dilatometer test, fall cone tests,
and uniaxial and plane strain test. However,
these tests may become expensive if a large
number of tests are to be conducted.
Therefore, several researchers have
developed empirical correlations between
undrained shear strength and typical soil
properties that can be relatively obtained with
index tests. The reader is referred to Lacasse
(2016), a paper in this conference, for further
details.
2 PROBLEM DEFINITION
In the geotechnical research community,
there is widespread agreement that the choice
of the characteristic undrained shear strength
is very important and plays an essential role
in the calculation for the design and stability
analysis of various geotechnical
constructions placed in or on soft clay
deposits. Thus, the choice of undrained shear
strength (cuA), both conservative and non-
conservative, could have major economic
(and social) consequences in many projects.
Figure 2 Problem definition.
However, the influence of the stress history,
soil fabric, strain rates, Atterberg’s limits,
sampling technique, and sample disturbance
is great on the undrained shear strength of
soft clays. Consequently, the assessment of a
A procedure for the assessment of undrained shear strength profile of soft clays
IGS 535 NGM 2016 - Proceedings
representative cuA of soft clays has been
challenging since the inception of the
concept. A simplified approach is therefore
adopted for design purposes. It needs to be
emphasized that cuA of the soil is the
undrained shear strength that is assumed to
be mobilized along the slip surface 450
inclined from the major principle stress.
The undrained shear strength cuA profiles
with depth are usually established at some
selected boreholes where the information is
collected. These cuA profiles are later
interpolated to the soil volume between the
boreholes. Thus, the accuracy of a cuA profile
at the boreholes is crucial because the soil
volume between the boreholes depends on
the representativeness of the cuA profiles at
the boreholes. As a first step, this paper
presents a procedure for assessing the cuA
profile at a borehole. A discussion follows on
the important aspects to consider when the
cuA profile is estimated for a large soil
volume. This paper summarizes the work
carried out by engineers and scientists
representing various institutions in Norway.
The overall aim of the work presented in this
paper has been to provide a method to make a
sound engineering judgement related to the
determination of the characteristic shear
strength of soft clays.
3 UNDRAINED SHEAR STRENGTH
ESTIMATION
In this paper, a characteristic cuA profile
refers to the active undrained shear strength
profile most likely to occur, deduced based
on available and relevant measurements and
experience data. In many cases, this is a
mean value or a weighted mean of available
data. If measurements (interpreted strength
values) show relatively great variation with
depth, additional caution must be taken when
selecting the cuA profile.
An empirical relationship widely used in
Norway is SHANSEP, which stands for
stress history and normalized stress
engineering parameters (Ladd and Foot
1974). This SHANSEP principle is expressed
by the following formula:
cuA = OCRm
po' (3)
Where
= constant
m = constant
OCR = pc'/po' (over consolidation ratio)
pc' = effective pre-consolidation pressure
po' = effective vertical stress.
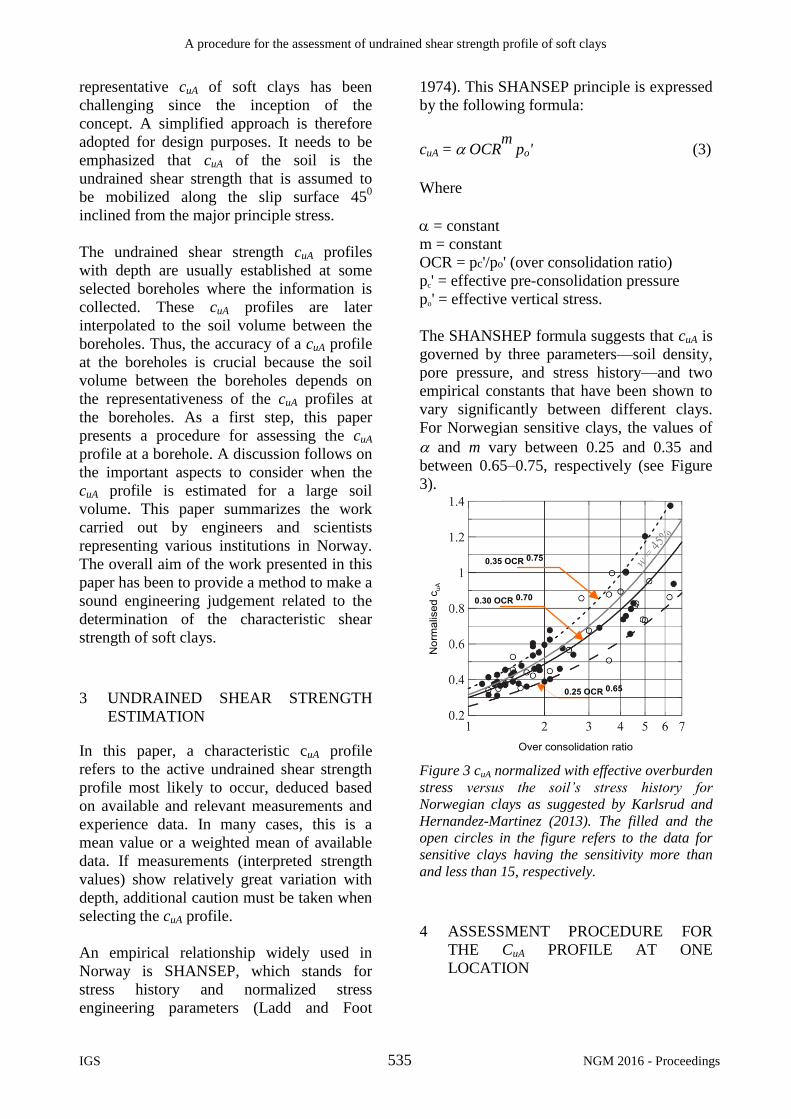
The SHANSHEP formula suggests that cuA is
governed by three parameters—soil density,
pore pressure, and stress history—and two
empirical constants that have been shown to
vary significantly between different clays.
For Norwegian sensitive clays, the values of
and m vary between 0.25 and 0.35 and
between 0.65–0.75, respectively (see Figure
3).
Figure 3 cuA normalized with effective overburden
stress versus the soil’s stress history for
Norwegian clays as suggested by Karlsrud and
Hernandez-Martinez (2013). The filled and the
open circles in the figure refers to the data for
sensitive clays having the sensitivity more than
and less than 15, respectively.
4 ASSESSMENT PROCEDURE FOR
THE CuA PROFILE AT ONE
LOCATION
Investigation, testing and monitoring
NGM 2016 - Proceedings 536 IGS
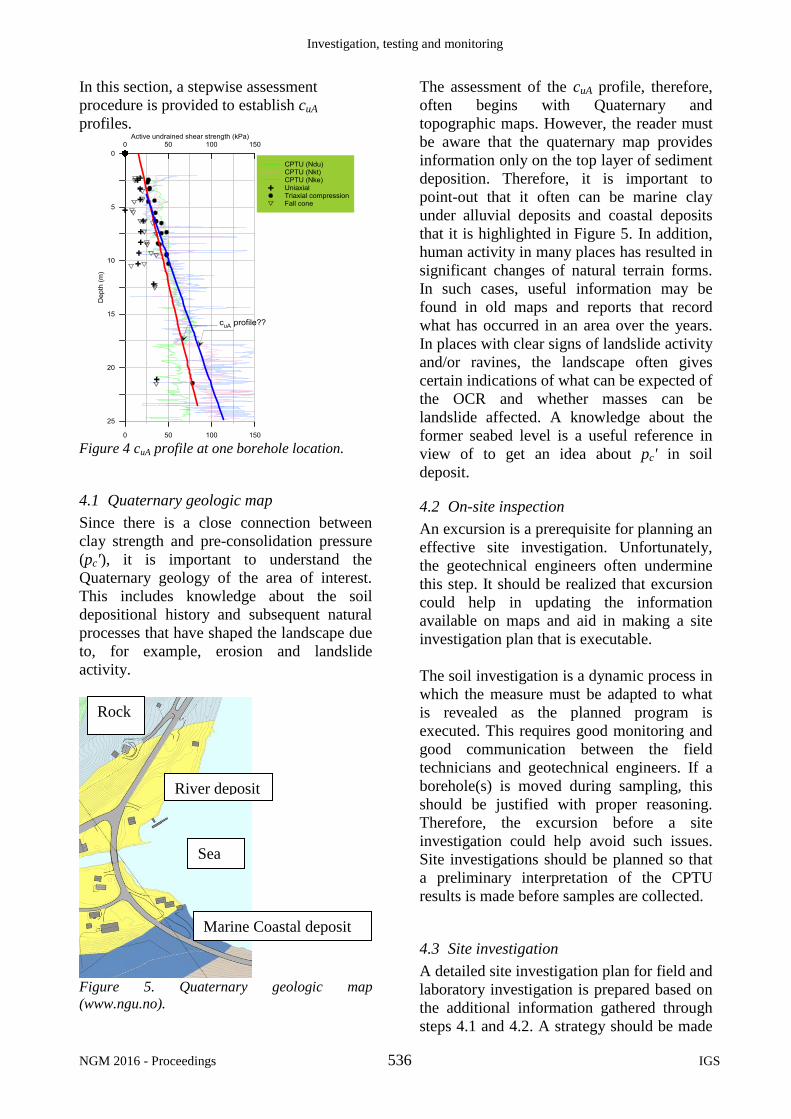
In this section, a stepwise assessment
procedure is provided to establish cuA
profiles.
Figure 4 cuA profile at one borehole location.
4.1 Quaternary geologic map
Since there is a close connection between
clay strength and pre-consolidation pressure
(pc'), it is important to understand the
Quaternary geology of the area of interest.
This includes knowledge about the soil
depositional history and subsequent natural
processes that have shaped the landscape due
to, for example, erosion and landslide
activity.
Figure 5. Quaternary geologic map
(www.ngu.no).
The assessment of the cuA profile, therefore,
often begins with Quaternary and
topographic maps. However, the reader must
be aware that the quaternary map provides
information only on the top layer of sediment
deposition. Therefore, it is important to
point-out that it often can be marine clay
under alluvial deposits and coastal deposits
that it is highlighted in Figure 5. In addition,
human activity in many places has resulted in
significant changes of natural terrain forms.
In such cases, useful information may be
found in old maps and reports that record
what has occurred in an area over the years.
In places with clear signs of landslide activity
and/or ravines, the landscape often gives
certain indications of what can be expected of
the OCR and whether masses can be
landslide affected. A knowledge about the
former seabed level is a useful reference in
view of to get an idea about pc' in soil
deposit.
4.2 On-site inspection
An excursion is a prerequisite for planning an
effective site investigation. Unfortunately,
the geotechnical engineers often undermine
this step. It should be realized that excursion
could help in updating the information
available on maps and aid in making a site
investigation plan that is executable.
The soil investigation is a dynamic process in
which the measure must be adapted to what
is revealed as the planned program is
executed. This requires good monitoring and
good communication between the field
technicians and geotechnical engineers. If a
borehole(s) is moved during sampling, this
should be justified with proper reasoning.
Therefore, the excursion before a site
investigation could help avoid such issues.
Site investigations should be planned so that
a preliminary interpretation of the CPTU
results is made before samples are collected.
4.3 Site investigation
A detailed site investigation plan for field and
laboratory investigation is prepared based on
the additional information gathered through
steps 4.1 and 4.2. A strategy should be made
Marine Coastal deposit
River deposit
Rock
Sea
A procedure for the assessment of undrained shear strength profile of soft clays
IGS 537 NGM 2016 - Proceedings
to establish total stations. The total station
refers to the reference boreholes where the
following information must be collected:
Total or rotary sounding
Pore pressure measurements (in at least two
levels)
CPTU, field vane shear tests
Soil sampling, using preferably Ø72 mm or
Ø54 mm tube sampling of good quality
Index parameters, including the Atterberg’s
limits
Odometer test from at least two levels
Anisotropically consolidated undrained
compression/extension triaxial tests from at
least two levels.
For the slope stability calculation, at least
two total stations, one at the top and another
at the toe of the slope, are recommended. The
site investigation should be consistent with
the critical sections where stability
calculations are to be performed. An
assessment is needed of how large the soil
volume/area will be because the soil
investigation should provide a basis for
assessing layering and properties potentially
involving soil volume.
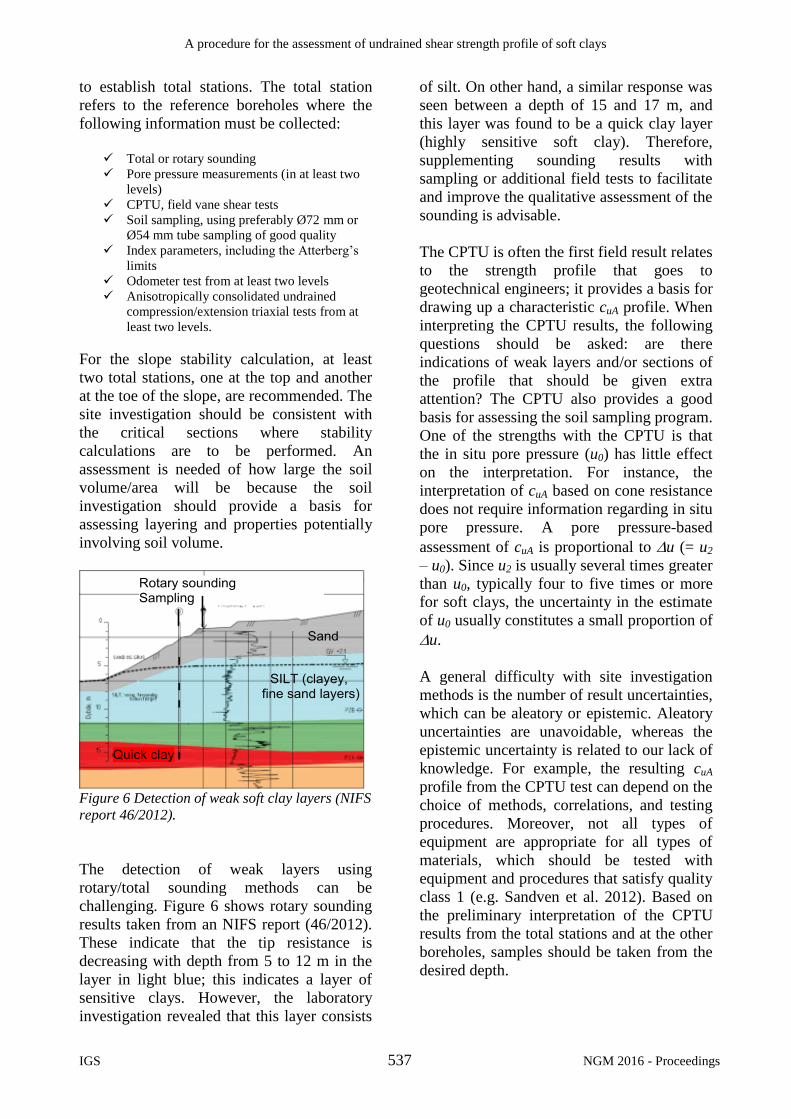
Figure 6 Detection of weak soft clay layers (NIFS
report 46/2012).
The detection of weak layers using
rotary/total sounding methods can be
challenging. Figure 6 shows rotary sounding
results taken from an NIFS report (46/2012).
These indicate that the tip resistance is
decreasing with depth from 5 to 12 m in the
layer in light blue; this indicates a layer of
sensitive clays. However, the laboratory
investigation revealed that this layer consists
of silt. On other hand, a similar response was
seen between a depth of 15 and 17 m, and
this layer was found to be a quick clay layer
(highly sensitive soft clay). Therefore,
supplementing sounding results with
sampling or additional field tests to facilitate
and improve the qualitative assessment of the
sounding is advisable.
The CPTU is often the first field result relates
to the strength profile that goes to
geotechnical engineers; it provides a basis for
drawing up a characteristic cuA profile. When
interpreting the CPTU results, the following
questions should be asked: are there
indications of weak layers and/or sections of
the profile that should be given extra
attention? The CPTU also provides a good
basis for assessing the soil sampling program.
One of the strengths with the CPTU is that
the in situ pore pressure (u0) has little effect
on the interpretation. For instance, the
interpretation of cuA based on cone resistance
does not require information regarding in situ
pore pressure. A pore pressure-based
assessment of cuA is proportional to u (= u2
– u0). Since u2 is usually several times greater
than u0, typically four to five times or more
for soft clays, the uncertainty in the estimate
of u0 usually constitutes a small proportion of
u.
A general difficulty with site investigation
methods is the number of result uncertainties,
which can be aleatory or epistemic. Aleatory
uncertainties are unavoidable, whereas the
epistemic uncertainty is related to our lack of
knowledge. For example, the resulting cuA
profile from the CPTU test can depend on the
choice of methods, correlations, and testing
procedures. Moreover, not all types of
equipment are appropriate for all types of
materials, which should be tested with
equipment and procedures that satisfy quality
class 1 (e.g. Sandven et al. 2012). Based on
the preliminary interpretation of the CPTU
results from the total stations and at the other
boreholes, samples should be taken from the
desired depth.
Investigation, testing and monitoring
NGM 2016 - Proceedings 538 IGS
4.4 Soil characterization and sample quality
assessment
Literature e.g., Berre et al. (1969), La
Rochelle and Lefebvre (1970), Bjerrum
(1973), Leroueil et al. (1979), Nagaraj et al.
(1990, 2003), Lunne et al. (1997), Ladd and
DeGroot (2003), Leroueil and Hight (2003),
Karlsrud and Hernandez-Martinez (2013),
Amundsen et al. (2015), and Amundsen et
al. (2016) suggest that soft clays could be
prone to sample disturbance—especially
when sampled using tube samplers (54, 76, or
95 mm diameter). On the contrary, block
sampling in soft clay is considered to capture
a more realistic soil behavior can be captured
in the laboratory, as illustrated in Figure 7.
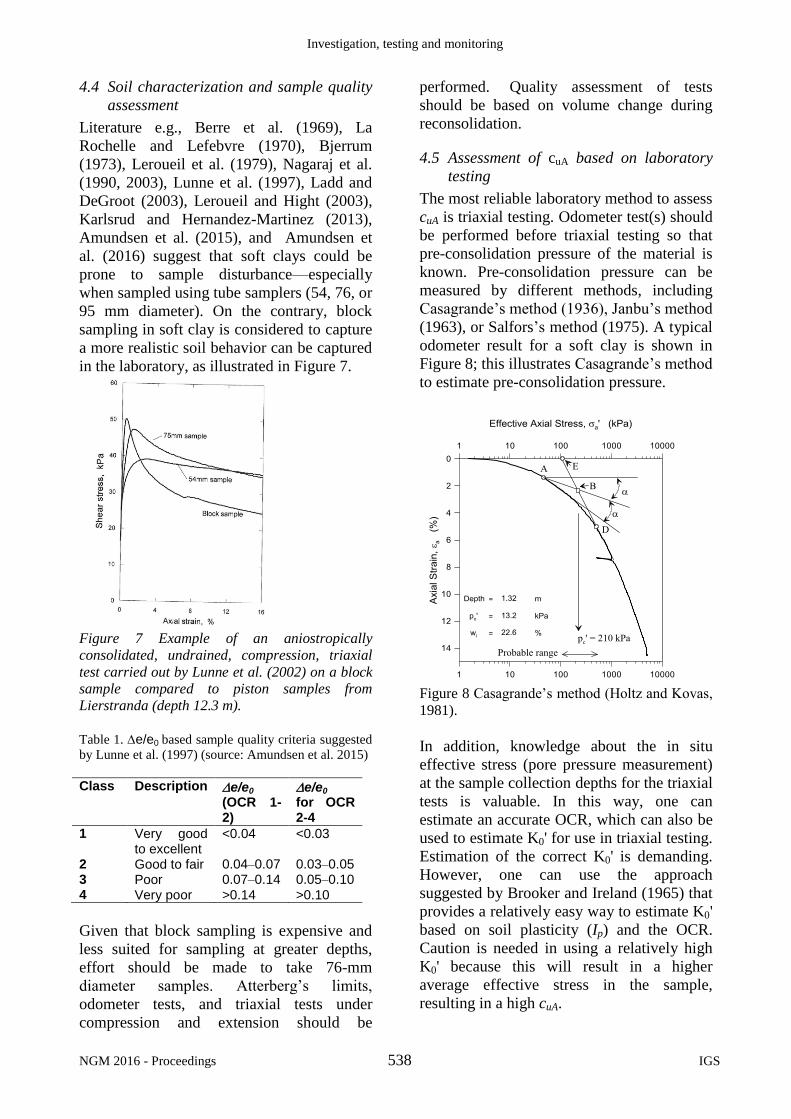
Figure 7 Example of an aniostropically
consolidated, undrained, compression, triaxial
test carried out by Lunne et al. (2002) on a block
sample compared to piston samples from
Lierstranda (depth 12.3 m).
Table 1. e/e0 based sample quality criteria suggested
by Lunne et al. (1997) (source: Amundsen et al. 2015)
Class Description e/e0
(OCR 1-2)
e/e0
for OCR 2-4
1 Very good to excellent
<0.04 <0.03
2 Good to fair 0.04–0.07 0.03–0.05 3 Poor 0.07–0.14 0.05–0.10 4 Very poor >0.14 >0.10
Given that block sampling is expensive and
less suited for sampling at greater depths,
effort should be made to take 76-mm
diameter samples. Atterberg’s limits,
odometer tests, and triaxial tests under
compression and extension should be
performed. Quality assessment of tests
should be based on volume change during
reconsolidation.
4.5 Assessment of cuA based on laboratory
testing
The most reliable laboratory method to assess
cuA is triaxial testing. Odometer test(s) should
be performed before triaxial testing so that
pre-consolidation pressure of the material is
known. Pre-consolidation pressure can be
measured by different methods, including
Casagrande’s method (1936), Janbu’s method
(1963), or Salfors’s method (1975). A typical
odometer result for a soft clay is shown in
Figure 8; this illustrates Casagrande’s method
to estimate pre-consolidation pressure.
Figure 8 Casagrande’s method (Holtz and Kovas,
1981).
In addition, knowledge about the in situ
effective stress (pore pressure measurement)
at the sample collection depths for the triaxial
tests is valuable. In this way, one can
estimate an accurate OCR, which can also be
used to estimate K0' for use in triaxial testing.
Estimation of the correct K0' is demanding.
However, one can use the approach
suggested by Brooker and Ireland (1965) that
provides a relatively easy way to estimate K0'
based on soil plasticity (Ip) and the OCR.
Caution is needed in using a relatively high
K0' because this will result in a higher
average effective stress in the sample,
resulting in a high cuA.
A procedure for the assessment of undrained shear strength profile of soft clays
IGS 539 NGM 2016 - Proceedings
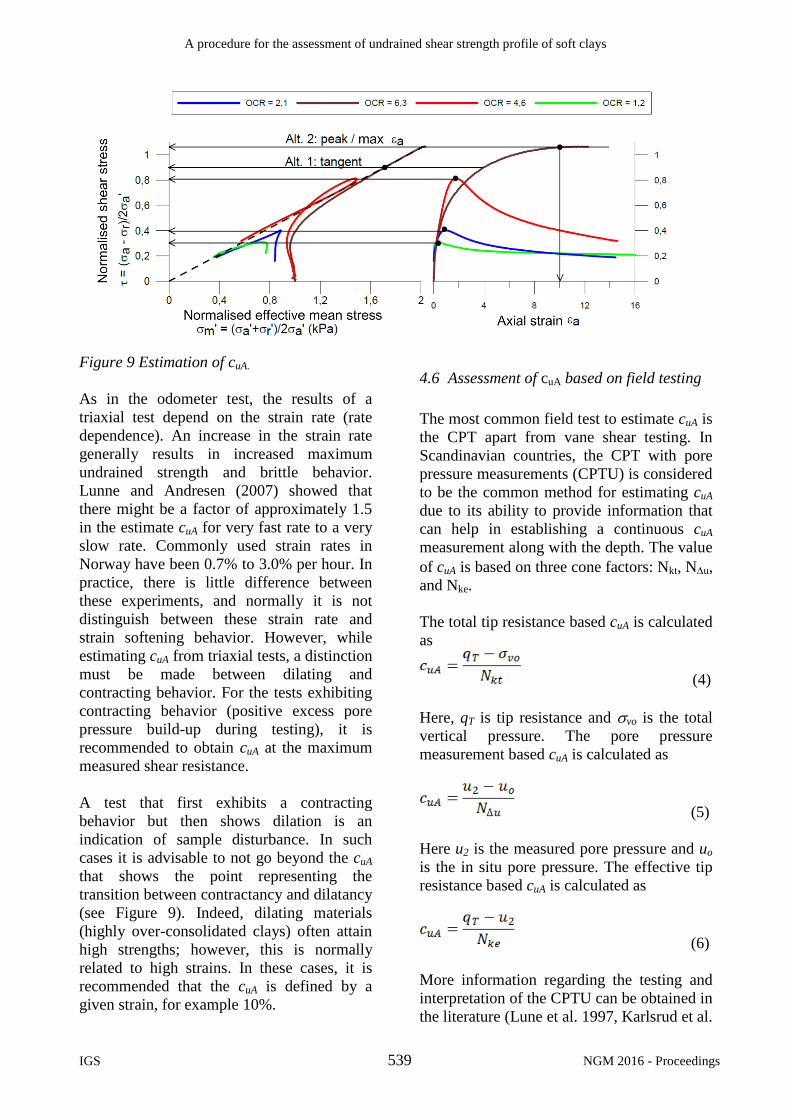
Figure 9 Estimation of cuA.
As in the odometer test, the results of a
triaxial test depend on the strain rate (rate
dependence). An increase in the strain rate
generally results in increased maximum
undrained strength and brittle behavior.
Lunne and Andresen (2007) showed that
there might be a factor of approximately 1.5
in the estimate cuA for very fast rate to a very
slow rate. Commonly used strain rates in
Norway have been 0.7% to 3.0% per hour. In
practice, there is little difference between
these experiments, and normally it is not
distinguish between these strain rate and
strain softening behavior. However, while
estimating cuA from triaxial tests, a distinction
must be made between dilating and
contracting behavior. For the tests exhibiting
contracting behavior (positive excess pore
pressure build-up during testing), it is
recommended to obtain cuA at the maximum
measured shear resistance.
A test that first exhibits a contracting
behavior but then shows dilation is an
indication of sample disturbance. In such
cases it is advisable to not go beyond the cuA
that shows the point representing the
transition between contractancy and dilatancy
(see Figure 9). Indeed, dilating materials
(highly over-consolidated clays) often attain
high strengths; however, this is normally
related to high strains. In these cases, it is
recommended that the cuA is defined by a
given strain, for example 10%.
4.6 Assessment of cuA based on field testing
The most common field test to estimate cuA is
the CPT apart from vane shear testing. In
Scandinavian countries, the CPT with pore
pressure measurements (CPTU) is considered
to be the common method for estimating cuA
due to its ability to provide information that
can help in establishing a continuous cuA
measurement along with the depth. The value
of cuA is based on three cone factors: Nkt, Nu,
and Nke.
The total tip resistance based cuA is calculated
as
(4)
Here, qT is tip resistance and vo is the total
vertical pressure. The pore pressure
measurement based cuA is calculated as
(5)
Here u2 is the measured pore pressure and uo
is the in situ pore pressure. The effective tip
resistance based cuA is calculated as
(6)
More information regarding the testing and
interpretation of the CPTU can be obtained in
the literature (Lune et al. 1997, Karlsrud et al.
Investigation, testing and monitoring
NGM 2016 - Proceedings 540 IGS
2005). It is clear from Eqs. 4–6 that cuA will
depend on the cone factors. Several
correlations exist for the Nkt, Nke, and Nu
parameters to calculate cuA. Some of these are
discussed below.
The widely accepted method in Norway was
proposed by Karlsrud et al. (2005), who
compared the CPTU with cuA from block
samples and suggested the cone factors Nkt
and Nu based on the OCR and soil plasticity
index (Ip). The Nke parameter was correlated
with Bq (pore pressure parameter) and it can
be defined as
(7)
Separate suggestions, as listed below, were
made for soil having sensitivities less than or
more than 15:
For St<15
Nkt = 7.8 + 2.5∙logOCR+0.082∙Ip (8)
Nu = 6.9 – 4.0∙logOCR+0.07∙Ip (9)
Nke = 11.5 – 9.05∙Bq (10)
Bq = 0.88 – 0.51∙log OCR (11)
For St>15
Nkt = 8.5 + 2.5∙logOCR (12)
Nu = 9.8 – 4.5∙logOCR (13)
Nke = 12.5 – 11.0∙ Bq (14)
Bq = [1.15 – 0.67∙log OCR] (15)
Authors are referred to Karlsrud et al. (2005),
Sandven et al. (2014) for an elaborated
information regarding the CPTU
interpretation using Eqns 8-15. Similarly, the
Swedish Geotechnical Institute (2007) has
suggested the following equation to calculate
Nkt :
Nkt = 13.4 + 6.65 wL (16)
Here, wL is the liquid limit. If wL is
unknown, then one can assume Nkt = 16.3 for
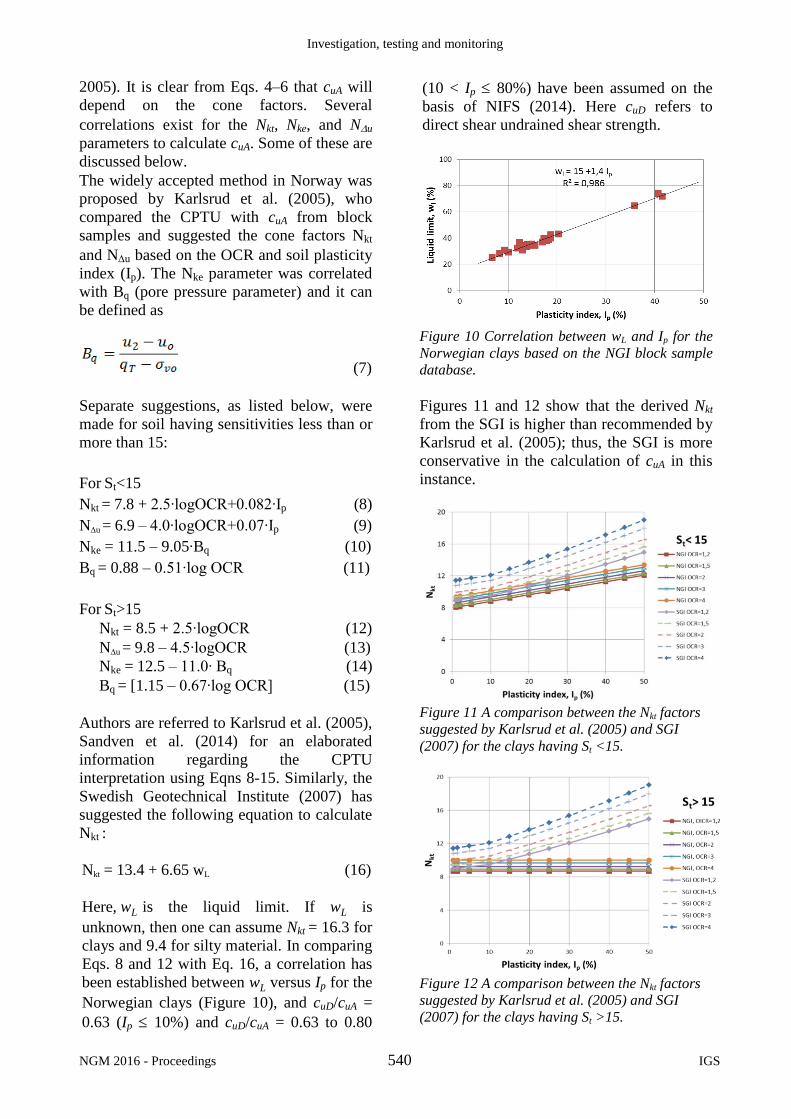
clays and 9.4 for silty material. In comparing
Eqs. 8 and 12 with Eq. 16, a correlation has
been established between wL versus Ip for the
Norwegian clays (Figure 10), and cuD/cuA =
0.63 (Ip 10%) and cuD/cuA = 0.63 to 0.80
(10 < Ip 80%) have been assumed on the
basis of NIFS (2014). Here cuD refers to
direct shear undrained shear strength.
Figure 10 Correlation between wL and Ip for the
Norwegian clays based on the NGI block sample
database.
Figures 11 and 12 show that the derived Nkt
from the SGI is higher than recommended by
Karlsrud et al. (2005); thus, the SGI is more
conservative in the calculation of cuA in this
instance.
Figure 11 A comparison between the Nkt factors
suggested by Karlsrud et al. (2005) and SGI
(2007) for the clays having St <15.
Figure 12 A comparison between the Nkt factors
suggested by Karlsrud et al. (2005) and SGI
(2007) for the clays having St >15.

A procedure for the assessment of undrained shear strength profile of soft clays
IGS 541 NGM 2016 - Proceedings
Norwegian geotechnical consultancy firms
have also established their own practice to
estimate the cone factors. In addition to
Karlsrud et al. (2005), Multiconsult and
Norconsult use Bq to estimate NU, Nkt, and
Nke based on Lunne et al. (1997). Tables 2
and 3 present their recommendations, and
Figure 13 illustrates these correlations along
with the data from Lunne et al. (1997). Some
differences are obvious for the Nke and Nu
parameters recommended by these two
firms.
Table 2. Multiconsult’s recommendation (Source:
NGF seminar, 2010)
Basis Factors Cone factors (based on Bq)
Pore pressure Nu Nu = 1.8 + 7.25∙Bq
Total tip resistance
Nkt Nkt = 18.7 –
12.5∙Bq
Effective tip resistance
Nke Nke = 13.8 – 12.5∙Bq
Table 3. Norconsults’s recommendation (Source:
NGF seminar, 2010)
Basis Factors Cone factors
(based on Bq)
Pore pressure Nu Nu = 1.0 + 9.0∙Bq
Total tip resistance
Nkt Nkt = 19.0 – 12.5∙Bq
Effective tip resistance
Nke Nke = 16.0 – 14.5∙Bq
Before selecting a value for the cone factors,
the basis of selection and the available
information in terms of routine
investigations, in situ pore pressure,
odometer, and triaxial tests are needed, and
the choice of the interpretation method needs
consideration and justification. Moreover,
the validity of the interpretation of factors Nkt
and Nu and especially for Nu at low Bq
must be considered. Vane shear testing is
another approach to obtained DSS tests at a
desired depth. However, interpretation of
undrained shear strength is not very reliable
for clays with Ip < 10% as a proper
correction factor for low plastic clay has not
been established. The reader is referred to
Gylland et al. (2016), a paper in this
conference, for further details.
Figure 13 Cone factors versus Bq.
Investigation, testing and monitoring
NGM 2016 - Proceedings 542 IGS
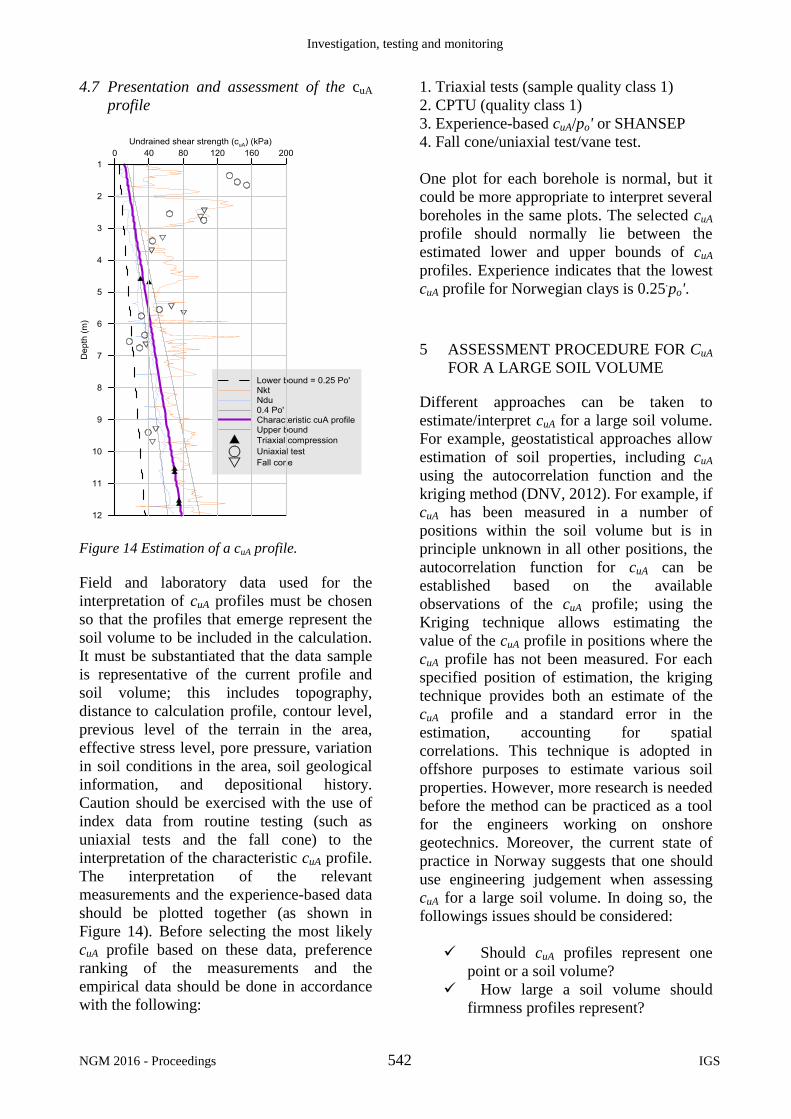
4.7 Presentation and assessment of the cuA
profile
Figure 14 Estimation of a cuA profile.
Field and laboratory data used for the
interpretation of cuA profiles must be chosen
so that the profiles that emerge represent the
soil volume to be included in the calculation.
It must be substantiated that the data sample
is representative of the current profile and
soil volume; this includes topography,
distance to calculation profile, contour level,
previous level of the terrain in the area,
effective stress level, pore pressure, variation
in soil conditions in the area, soil geological
information, and depositional history.
Caution should be exercised with the use of
index data from routine testing (such as
uniaxial tests and the fall cone) to the
interpretation of the characteristic cuA profile.
The interpretation of the relevant
measurements and the experience-based data
should be plotted together (as shown in
Figure 14). Before selecting the most likely
cuA profile based on these data, preference
ranking of the measurements and the
empirical data should be done in accordance
with the following:
1. Triaxial tests (sample quality class 1)
2. CPTU (quality class 1)
3. Experience-based cuA/po' or SHANSEP
4. Fall cone/uniaxial test/vane test.
One plot for each borehole is normal, but it
could be more appropriate to interpret several
boreholes in the same plots. The selected cuA
profile should normally lie between the
estimated lower and upper bounds of cuA
profiles. Experience indicates that the lowest
cuA profile for Norwegian clays is 0.25.po'.
5 ASSESSMENT PROCEDURE FOR CuA
FOR A LARGE SOIL VOLUME
Different approaches can be taken to
estimate/interpret cuA for a large soil volume.
For example, geostatistical approaches allow
estimation of soil properties, including cuA
using the autocorrelation function and the
kriging method (DNV, 2012). For example, if
cuA has been measured in a number of
positions within the soil volume but is in
principle unknown in all other positions, the
autocorrelation function for cuA can be
established based on the available
observations of the cuA profile; using the
Kriging technique allows estimating the
value of the cuA profile in positions where the
cuA profile has not been measured. For each
specified position of estimation, the kriging
technique provides both an estimate of the
cuA profile and a standard error in the
estimation, accounting for spatial
correlations. This technique is adopted in
offshore purposes to estimate various soil
properties. However, more research is needed
before the method can be practiced as a tool
for the engineers working on onshore
geotechnics. Moreover, the current state of
practice in Norway suggests that one should
use engineering judgement when assessing
cuA for a large soil volume. In doing so, the
followings issues should be considered:
Should cuA profiles represent one
point or a soil volume?
How large a soil volume should
firmness profiles represent?
A procedure for the assessment of undrained shear strength profile of soft clays
IGS 543 NGM 2016 - Proceedings
Could it be that consistently weak
layers will have significance?
Are there large variations in the
layering and soil conditions detected,
or can we interpolate between points
where we have data?
Identify how many boreholes must be
established and which data need to be
included in determining the cuA at each
borehole. The number of boreholes for the
cuA profile depends on topographic conditions
and variations in soil conditions.
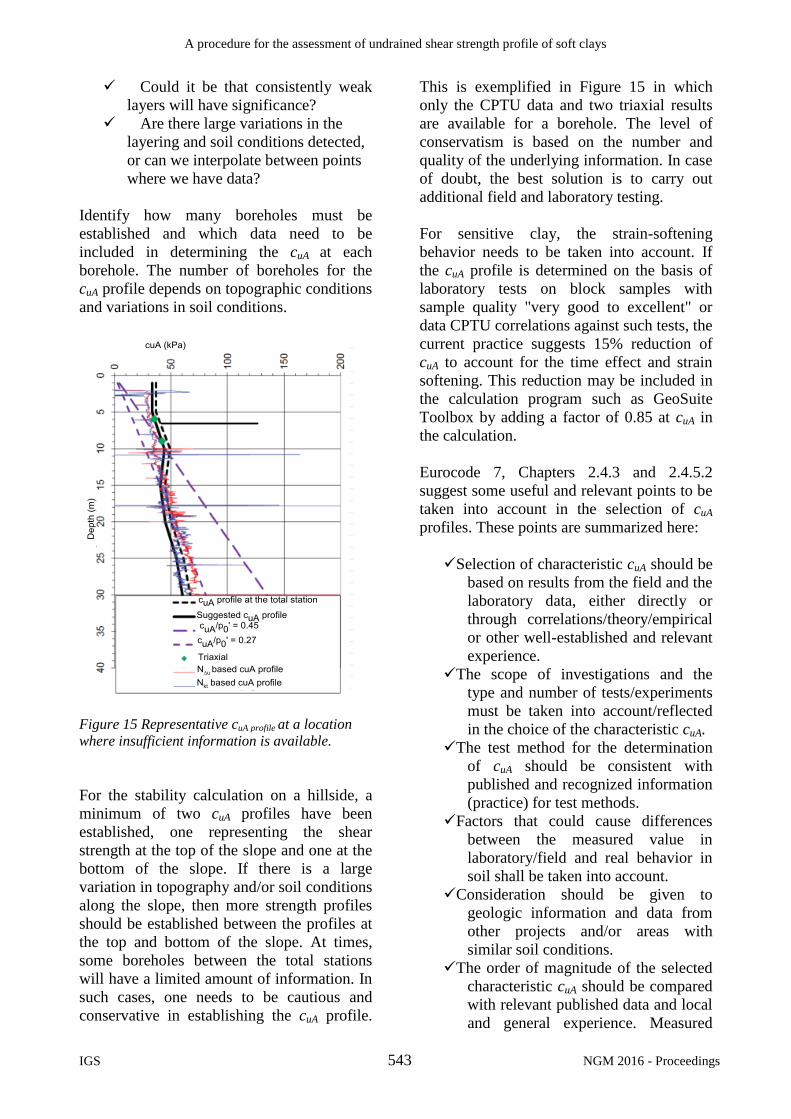
Figure 15 Representative cuA profile at a location
where insufficient information is available.
For the stability calculation on a hillside, a
minimum of two cuA profiles have been
established, one representing the shear
strength at the top of the slope and one at the
bottom of the slope. If there is a large
variation in topography and/or soil conditions
along the slope, then more strength profiles
should be established between the profiles at
the top and bottom of the slope. At times,
some boreholes between the total stations
will have a limited amount of information. In
such cases, one needs to be cautious and
conservative in establishing the cuA profile.
This is exemplified in Figure 15 in which
only the CPTU data and two triaxial results
are available for a borehole. The level of
conservatism is based on the number and
quality of the underlying information. In case
of doubt, the best solution is to carry out
additional field and laboratory testing.
For sensitive clay, the strain-softening
behavior needs to be taken into account. If
the cuA profile is determined on the basis of
laboratory tests on block samples with
sample quality "very good to excellent" or
data CPTU correlations against such tests, the
current practice suggests 15% reduction of
cuA to account for the time effect and strain
softening. This reduction may be included in
the calculation program such as GeoSuite
Toolbox by adding a factor of 0.85 at cuA in
the calculation.
Eurocode 7, Chapters 2.4.3 and 2.4.5.2
suggest some useful and relevant points to be
taken into account in the selection of cuA
profiles. These points are summarized here:
Selection of characteristic cuA should be
based on results from the field and the
laboratory data, either directly or
through correlations/theory/empirical
or other well-established and relevant
experience.
The scope of investigations and the
type and number of tests/experiments
must be taken into account/reflected
in the choice of the characteristic cuA.
The test method for the determination
of cuA should be consistent with
published and recognized information
(practice) for test methods.
Factors that could cause differences
between the measured value in
laboratory/field and real behavior in
soil shall be taken into account.
Consideration should be given to
geologic information and data from
other projects and/or areas with
similar soil conditions.
The order of magnitude of the selected
characteristic cuA should be compared
with relevant published data and local
and general experience. Measured

Investigation, testing and monitoring
NGM 2016 - Proceedings 544 IGS
values should be reconciled with
empirical data to verify that the size
falls within the expected range of
variation.
The estimated characteristic cuA should
be based on a conservative estimate
of the values that have the greatest
impact on relevant
issue/analysis/calculation.
The magnitude of soil volume included
in the calculations/analyses should be
reflected in the choice of cuA.
Because the lab and field tests in most
cases will only occupy a very small
proportion of the volume of soil that
will be involved in an
analysis/calculation, so should the
characteristic cuA be chosen as a
conservative estimate for the mean
values of measured/derived values
found by experiments in the field.
It is important to focus on weak areas
and/or weak layers that may be
significant for the analysis.
Caution should be exercised in the use
of values that require large
deformations.
6 CLOSING REMARKS
This paper presents a procedure to assess the
undrained shear strength profile of soft clays.
In doing so, various aspects relevant for the
estimation of the strength profile are
discussed in light of existing literature and
field and laboratory data. The work here is
mainly applicable but not limited to stability
problems in Norwegian clays. Finally, this
paper suggests that the representativeness of
the estimated cuA profile depends on how
well the geotechnical information,
experience, and engineering judgement are
combined.
7 ACKNOWLEDGMENTS
The authors of this paper acknowledge the
Natural Hazards–Infrastructure for Floods
and Slides Program–NIFS
(www.naturfare.no), funded by the
Norwegian Public Roads Administration,
Norwegian Water Resources and Energy
Directorate, and Norwegian National Rail
Administration.
8 REFERENCES
Aas, G. (1965) “Study of the Effect of Vane Shape
and Rate of Strain on Measured Values of In Situ
Shear Strength of Clays,” Proc. 6th Int. Conf. on Soil
Mech. Found. Engg., Montreal, Vol. I., 141-145.
Amundsen, H. A., A. Emdal, R. Sandven and V.
Thakur (2015). On engineering characterization of a
low plastic sensitive soft clay. GeoQuebec, Quebec.
Amundsen, H. A., V. Thakur and A. Emdal (2016).
Sample disturbance in block samples of low plastic
soft clays. 17th
Nordic Geotechnical Meeting, Island.
Bell A L (1915). Lateral pressure and resistance of
clay and the supporting power of clay foundations. Mi.
Proc. Institute for Civil Engineers. Vol 149, 233.
Berre T, T. Lunne, K.H. Andersen, S. Strandvik
and M Sjursen (2007). Potential improvements of
design parameters by taking block samples of soft
marine Norwegian clays. Canadian Geotechnical
Journal, Volume 44(6), 698-716.
Berre, T., K. Schjetne and S. Sollie (1969).
Sampling disturbance of soft marine clays. Proc. of the
7th
ICSMFE, Special Session, Mexico.
Bishop A. W. (1966), The strength of soils as
engineering materials. Rankine Lecture,
Geotechnique, 16 (2), 91 – 130
Bjerrum, L. (1961). The effective shear strength
parameters of sensitive clays. ISSMGE, 5 Paris, 1961,
Proceedings Vol. 1, pp 23-28. (NGI pub 45)
Bjerrum, L. (1973). Problems of soil mechanics
and construction on soft clays. State-of-the-art report.
Proc. of the 8th
ICSMFE, Moscow.
Brooker, E.W. and H.O. Ireland (1965). Earth
Pressure at Rest Related to Stress History. Canadian
Geotechnical Journal, Vol. 2 (1), 1-15
Casagrande, A. (1936). The determination of the
pre-consolidation load and its practical significance. In
Proceedings of the First International Conference on
Soil Mechanics and Foundation Engineering Boston,
Vol. III, Discussion D-34, 60.
DeGroot, D. J., S. E. Poirier and M. M. Landon
(2005). Sample disturbance-Soft clays. Studia
Geotechnica et Mechanica, Vol. 27(3-4), 91-105.
DNV (2012). Recommended Practice DNV-RP-
C207- Statistical Representation of Soil Data.
Fellenius W. (1922). Statens Jarnvagars
Geoteknisk Kommission, Stockholm
Gylland A, Thakur V, Emdal A (2016), Extended
interpretation basis for the vane shear test. 17th Nordic
Geotechnical Meeting, Island.
Gylland, A.S, H.P Jostad, S. Nordal,and A Emdal
(2013) Micro-level investigation of the in situ shear
vane failure geometry in sensitive clay. Geotechnique.
63(14),1264-1270.
Holtz, R.D. and W.D. Kovacs, W.D. (1981). “An
Introduction to Geotechnical Engineering,” Prentice-
Hall, Inc., New Jersey, 733 pp.
Janbu N (1967) Grunnlag i geoteknikk. Tapir
A procedure for the assessment of undrained shear strength profile of soft clays
IGS 545 NGM 2016 - Proceedings
Janbu, N. (1963). Soil compressibility as
determined by oedometer and triaxial tests. In
Proceedings of the third European Conference Soil
Mechanics, Wiesbadem. Vol. 1, pp. 19–25.
Karlsrud K and Hernandez-Martinez F G (2013).
Strength and deformation properties of Norwegian
clays from laboratory tests on high quality block
samples. Canadian Geotechnical Journal, 50(12):
1273-1293.
Karlsrud K., Lunne T., Kort D.A., Strandvik S. (2005).
CPTU correlations for clays. In: Proc. of 16th
ICSMGE, Osaka. Millpress, Rotterdam: 693-702
La Rochelle, P. and G. Lefebvre (1970). Sampling
disturbance in Champlain clays. Proc. of the Symp. on
Sampling of soil and rock, ASTM.
Lacasse S (2016). Keynote lecture on undrained
shear strength of soils. 17th
Nordic Geotechnical
Meeting, Island.
Ladd CC, Foot R. (1974). New design procedure
for stability of soft clays. Journal of the Geotechnical
Engineering Division, ASCE 100(7), 763-786.
Ladd, C.C. and DeGroot, D.J. (2003). "Recommended
Practice for Soft Ground Site Characterization." The
Arthur Casagrande Lecture, Proceedings of the 12th
Panamerican Conference on Soil Mechanics and
Geotechnical Engineering, Boston, MA, Vol. 1, pp.
3‐57.
Lambe T W (1960). A mechanistic picture of shear
strength in clay. ASCE Research conference on shear
strength of cohesive soils, 555-580.
Lefebvre, G. and C. Poulin (1979). A new method
of sampling in sensitive clay. Can. Geotech. J. 16(1),
226-233.
Leroueil, S. and D. W. Hight (2003). Behaviour
and properties of natural soils and soft rocks.
Characterisation and Engineering Properties of Natural
Soils.
Leroueil, S. and P. R. Vaughan (1990). The
general and congruent effects of structure in natural
soils and weak rocks. Géotechnique 40(3), 467-488.
Leroueil, S., M. Roy, P. L. Rochelle and F. A.
Tavenas (1979). Behavior of Destructured Natural
Clays. J. Geotech. Eng. Div. 105(6), 759-778.
Lunne, T. & Andersen, K.H. 2007. Soft clay shear
strength parameters for deepwater geotechnical
design. Proc., 6th OSIG, SUT, London, UK, 151–176.
Lunne, T., Robertson, P. K. and Powell, J. J. M.
(1997): Cone Penetration Testing in Geotechnical
Practice. Blackie Academic & Professional.
Lunne, T., Robertson, P.K. & Powell, J.J.M. 2002.
Cone penetration testing in geotechnical practice.
Spon Press.
Lunne, T., T. Berre and S. Strandvik (1997).
Sample disturbance effects in soft low plastic
Norwegian clay. Proc. of the Symp. on Recent
Develop. in Soil and Pavement Mech., Rio de Janeiro.
Nagaraj, T. S., B. R. S. Murthy, A. Vatsala and R.
C. Joshi (1990). Analysis of Compressibility of
Sensitive Soils. J. Geotech. Eng. 116(1), 105-118.
Nagaraj, T. S., N. Miura, S. G. Chung and K. N.
Prasad (2003). Analysis and assessment of sampling
disturbance of soft sensitive clays. Géotechnique
53(7), 679-683.
NIFS (2014). www.naturfare.no
NGF Seminar (2010); NGM seminar NGF seminar
om bruk og misbruk av CPTU og vingeboring. CPTU
Seminar 24-25.8.2010.
NIFS-rapport 14/2014. En omforent anbefaling for
bruk av anisotropifaktorer i prosjektering i norske
leirer.
NIFS-rapport 14/2014. En omforent anbefaling for
bruk av anisotropifaktorer i prosjektering i norske
leirer.
Norsk Standard NS-EN 1997-1:2004+NA: 2008.
Eurokode 7: Geoteknisk prosjektering Del 1:
Allmenne regler.
Norsk Standard NS-EN 1997-1:2004+NA: 2008.
Eurokode 7: Geoteknisk prosjektering Del 1:
Allmenne regler.
Rolf Sandven, A. Vik, S. Rønning, E.Tørum
(2012). Detektering av kvikkleire fra ulike
sonderingsmetoder. NIFS rapport nr. 46-2012. Utgitt
av NVE.
Sallfors, G. (1975) Preconsolidation Pressure of
Soft High Plastic Clays, Ph.D. thesis, Chalmers
University of Technology, Gothenburg, Sweden.
Sandven Rolf, A. Vik, S. Rønning, E.Tørum
(2012). Detektering av kvikkleire fra ulike
sonderingsmetoder. NIFS rapport nr. 46-2012. Utgitt
av NVE.
SGI (2007): Skjuvhållfasthet–utvärdering i
kohesionsjord. Information 3.
Skempton, A.W. (1948a). “The = 0 Analysis of
Stability and Its Theoretical Basis”, Proc. 2n Intern.
Conf. on Soil Mechanics and Foundation Engineering,
1, 72-78.
Tanaka, H. (2000). Sample quality of cohesive
soils : Lessons from three sites, Ariake, Bothkennar
and Drammen. Soils and foundations 20(4), 57-74
Tavenas, F. and S. Leroueil (1987). State-of-the-art
on laboratory and in-situ stress-strain-time behavior of
soft clays. Proceedings of the International
Symposium on Geotechnical Engineering of Soft
Soils, Mexico City, 1–46.
Tavenas, F. and S. Leroueil (1987). State-of-the-art
on laboratory and in-situ stress-strain-time behavior of
soft clays. Proceedings of the International
Symposium on Geotechnical Engineering of Soft
Soils, Mexico City, 1–46.
Tergazhi K (1943). Theoritical Soil Mechanics.
John Wiley, New York.

Investigation, testing and monitoring
NGM 2016 - Proceedings 546 IGS