of - home | genetics
TRANSCRIPT

THE GENETIC MAP 0%’ ESCHERICHIA COLI K-12
AUSTIN L. TAYLOR A N D MARIANNE S. THOMAN
Laboratory of Molecular Biology, National Institute of Neurological Diseases and Blindness, National Institutes of Health, Bethesda, Maryland
Received May 18, 1964
OF the several known methods for locating the positions of genetic markers on the single linkage group of Escherichia coli, the one most convenient and
satisfactory for mapping long chromosomal segments is the interrupted conju- gation technique described by WOLLMAN, JACOB and HAYES (1956). This method uses strong mechanical agitation to sever the conjugation tube that unites mating cell pairs. As a consequence. the unilateral transfer of chromosome from the donor. or Hfr, conjugant cell to the recipient, or F-, partner is terminated. Since the donor cell injects its chromosome at a constant speed and with a specific orientation, periodic interruption of transfer permits a determination of the time when a given genetic marker of the donor first becomes evident in the recipient cell. The time intervening between the transfer of two markers is a measure of the distance between them; hence a genetic map based on time units can be constructed by this method.
No single Hfr strain can be used to map the entire chromosome because the speed of transfer, which is constant during injection of the first one third to one half of the chromosome, apparently decreases later on (JACOB and WOLLMAN 1958). This limitation is offset, however, by the fact that Hfr strains may have different “points-of-origin”; that is, they may transfer different chromosomal regions initially during conjugation (JACOB and WOLLMAN 1957). The unique points-of-origin of three very high frequency (Vhf) donor strains described by TAYLOR and ADELBERG (1960) made it possible to extend genetic mapping over the full length of the chromosome. These and other donor strains have been used extensively since that time to assign precise map locations to the growing cata- logue of genetic markers in E. coli, and one of the objectives of this report is to present a detailed genetic map based on new data from both this laboratory and many others as well. Several improvements in experimental technique have brought greater accuracy to the basic mapping method. Consequently, this report will also include some revisions of previously published mapping data, plus a revised estimate of the total length (in time units) of the map of E. coli.
MATERIALS A N D METHODS
Bacteria and phages. The bacteria referred to in this paper were all originally derived from E . coli K-12. The properties of Vhf donor strains AB311, AB312, and AB313 were described by TAYLOR and ADELBERC (1960). Hfr strain AB259 was originally designated Hfr 3000 and it has the properties of strain Hfr H (WOLLMAN. JACOB and HAYES 1956). Hfr strain AB261 (originally
Cenebrs 5 0 : 6 3 4 7 7 October, I’llj4

660 A. L. TAYLOR AND M. S. THOMAN
Hfr P4X-6) was described by ADELBERG and BURNS (1960). Vhf strain AB451 is similar to AB261 except that it requires threonine, leucine and thiamine for growth instead of methionine. The number of polyauxotrophic F- recipient strains used in this study was too large to permit listing of their full genotypes. Strain numbers of the various F- stocks and the auxotrophy markers used in the crosses are given in the tables of results. Stocks of phage T6 were made from a wild-type strain given to us by A. D. HERSHEY. The male-specific RNA phage strain MS-2 isolated by A. J. CLARK (unpublished) was used to selectively kill donor bacteria. Transducing phage Plkc (LENNOX 1955) was given to us by S. E. LURIA.
Media: The synthetic minimal medium used for the selection of genetic recombinants and the broth medium used for routine cultivation of bacteria were described by ADELBERC and BURNS (1960).
Cultural and mating conditions: Bacterial stocks were maintained either on broth agar slants or as lyophilized cultures. Parental strains were reisolated from single colonies and checked for their genetic markers a few days prior to their use in crosses. Approximately 108 bacteria from overnight broth cultures were inoculated in 10 ml of fresh broth and incubated at 37°C with aeration until the cultures reached midexponential phase, or a titer of about 5 x 10⁸ cells per ml. Crosses were started by mixing the parental cultures in appropriate volume ratios to give final titers of about 2 x 10' donor cells and 4 x 10⁸ F- cells per ml. The mating mixtures were gently agitated at 37°C for 5 min to allow formation of specific pairs and then diluted, as described by DE HAAN and GROSS (1962), into 100 ml of fresh prewarmed broth to prevent, o r at least reduce, further pair formation. The mixtures were diluted 1:100, 1:200, or 1:500, depending on the fertility of the individual crosses; in all cases, the highest dilution which would produce adequate numbers of recombinants was used. The one-liter Erlenmeyer flasks containing the diluted cells were left undisturbed in a water bath at 37°C for the remainder of the experiment.
Interruption of mating: Samples (2.0 ml) were removed from the flask at 2 to 5 min intervals and transferred into 15 x 100 mm metal test tubes; these were attached to a Lourdes homogenizer fitted with a Model 15-ATT rotary knife assembly. Cell pairs were separated by blending the samples for one minute at a transformer setting of 30. The rotary knife was cleaned between samples by running it in several large volumes of sterile water. Duplicate 0.1 ml samples of the blended material were plated on various minimal media to select for different classes of genetic recombinants. Exconjugant donor cells were killed after the blending to prevent them from forming new mating pairs on the plates. The genotypes of the parental strains determined the mode of killing. For example, the selective plating media contained 200 pg/ml of strepto- mycin to kill the donors in crosses between streptomycin-sensitive donors and streptomycin- resistant F- strains. Streptomycin-resistant donor strains were killed with phage T6 if the F- parent was T6-resistant, or with phage MS-2 if the F- was T6-sensitive. (We are indebted to S. FALKOW for suggesting the phage MS-2 method to us.) The blended samples were mixed with 1.0 ml of broth containing about 2 x 10¹⁰ phages, incubated 10 min at 37°C to allow adsorption, and then plated on selective media. Growth of phage-resistant mutants of the donor strains was prevented by omitting required growth factors of the donor parents from the selective media.
RESULTS
The genetic maps of donor strains AB261 and AB451: Strain AB261 was first crossed to F- strain AB1 133 to measure the time of entry of the familiar reference markers, proA, thr and arg (the genetic symbols used in this paper are defined in Table 6) . A plot of the number of recombinants found in successive blended samples versus the time of blending is shown in Figure 1A. Note that the transfer curve of each selected marker has a low initial slope that is followed by a steeper secondary slope. This is in marked contrast to the transfer curves originally described by WOLLMAN et al. (1956) and later confirmed by many others. Their results showed that the number of recombinants increased linearly with time,

GENETIC MAP OF E. coli 66 1
and the resulting straight line plots were readily extrapolated to the time axis to give unambiguous times of entry for selected donor markers. Upward-breaking curves were encountered in about 25 percent of the crosses performed in this study. Their occurrence was not correlated with the use of particular selective and mating conditions or specific recipient strains in the crosses; it did appear, however, that certain donor strains produced these anomalous curves more fre- quently than other strains. Comparison of the times of entry obtained by extra- polating either the first or the second slopes to the time axis showed that the former values varied less than the latter in duplicate experiments. This suggested that the early recombinants, though they represented only a small proportion of the ultimate yield, were nonetheless the significant ones for measuring the time of entry of donor markers. Additional evidence to support this view came from the following cross.
The locus of purD relative to the reference loci proA and arg was determined in crosses of donor AB261 to F- strain AT1380. The results, illustrated in Figure lB, show that the proA+ marker first enters zygotes at 5.5 minutes, purD+ at 23 minutes, and arg+ at 23.5 minutes, as measured from the intercepts of the first slopes. On the other hand, the distance between purD and arg appears to be five times greater (2.5 minutes) if the second slopes are extrapolated to the time axis. It is known from the studies of LENNOX (1955) and DEMEREC et al. (1958) that the frequency of joint transfer of two closely linked markers in phage- mediated transduction varies inversely with the distance between markers. More- over, the joint transduction of loci separated by more than 1.5 minutes during conjugation at 37°C is extremely rare. It was therefore expected that the purD and arg loci would be cotransduced if they were only 0.5 minutes apart and that
TIME OF SAMPLING IN MINUTES
FIGURE 1.-Kinetics of chromosome transfer by donor strain AB261. A. Kinetics for a cross to i.ecipient strain AB1133. B. Kinetics for a cross to recipient strain AT1380.

662 A. L. TAYLOR AND M. S. THOMAN
they would not be measurably cotransduced if they were separated by 2.5 minutes. In transduction crosses of strain AT1380 with phage P1 grown on a prototrophic donor strain, the purD+ and arg+ markers were incorporated jointly in 35 to 40 percent of recombinants selected for the inheritance of either marker alone. This relatively high frequency of cotransduction fits in well with the close linkage originally inferred from the “first slope” time of entry data, and it also rules out the 2.5 minute distance obtained from the second slopes. We conclude that the second slopes of transfer curves do not provide a reliable means for deter- mining the distances between chromosomal markers.
The locus of one additional marker, pyrB, was determined in crosses between F- strain AT1385 and donor strain AB451, which has the same point-of-origin and transfers its chromosome in the same orientation as strain AB261. Breaks in the slopes of the transfer curves were not observed in these crosses. and the times of entry of reference markers proA and arg were identical to those obtained with strain AB261 (Table 1) . A map of the region analyzed with strains AB261 and AB451 is presented in Figure 2. The map distances between loci were com- puted from the data of Table 1 as the average time interval separating the trans- fer of pairs of donor markers, one member of the pair being a reference locus and the other an unknown. Thus, proA and pyrB are separated in time by an average 12.0 minutes in two experiments, proA and arg are separated by an average 18.3 minutes in four experiments, and so on.
The genetic map of donor strain AB259: Strain AB259 was crossed to five different F- recipients to determine the loci of proB, purE, lys + met. aroA, and purB relative to the reference loci leu or proA and gal. The time of entry data obtained in duplicate trials of each cross are recorded in Table 2. Strain AB259 was also used in one experiment to map the pyrA locus; the results of this cross
FIGURE &.-Map of the chromosomal segment transferred by donor strains AB261 and AB451. The symbol 0 indicates the pobnt-of-origin and the arrowhead shows the direction of chromo- some transfer by the donors. The average map distances between loci are given in minutes.
TABLE 1
Time of entry of markers transferred by strains AB261 and AB451
Selected markers of the donor parent Recipient parent Donor parent
strain No. strain No. proA thr w B purD nr8-j
AB1 133 AB26 1 5 5 12.0 24.0 AT1385 AB45 1 5.0 17.0 23.0
5 5 17.5 AT1380 AB261 4.5 22.5 23 0
5.5 23.0 23.5
GENETIC MAP OF E. coli 663
TABLE 2
Time of en try of markers transferred by strain AB259
Selected markers of the donor palent
thr p ~ r A leu proA proB purE l y s f m e t gal aroA purB
AT22 1 3 7.25 7.5 7.75 AT221 7 8.0 15.5
8 0 16.0 AT2270 14.0 18.5 24.0
15.0 19.5 24.0 AT2036 15.5 22.0 25.0
14 5 21.5 23.5 AB1321 14 0 23.5 27.5
15 0 29.0 AB 1 325 15.0 24 0 32 5
15 0 24.0 32.0
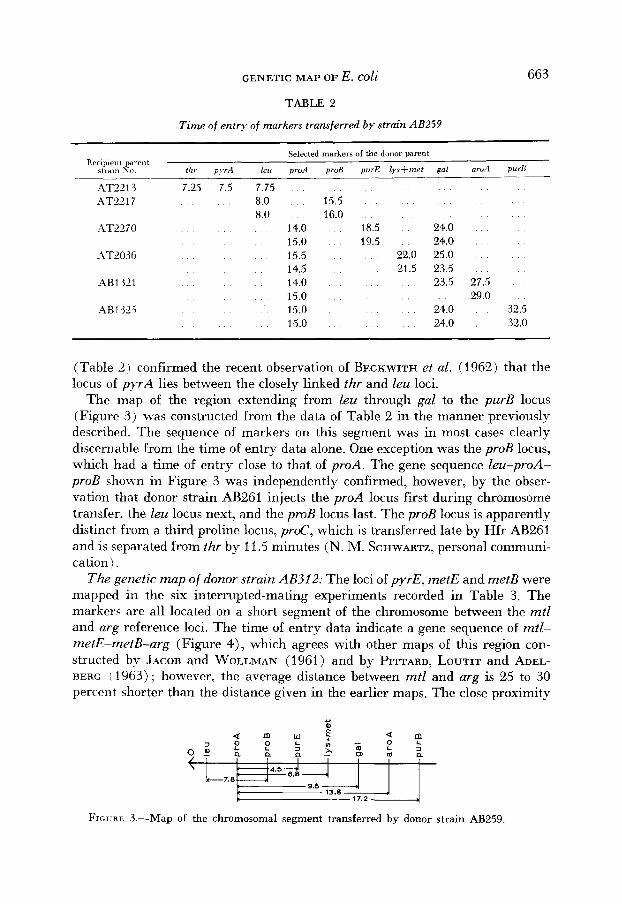
(Table 2 ) confirmed the recent observation of BECKWITH et al. (1962) that the locus of p y r A lies between the closely linked thr and leu loci.
The map of the region extending from leu through gal to the purB locus (Figure 3 ) was constructed from the data of Table 2 in the manner previously described. The sequence of markers on this segment was in most cases clearly discernable from the time of entry data alone. One exception was the proB locus, which had a time of entry close to that of proA. The gene sequence leu-proA- proB shown in Figure 3 was independently confirmed, however, by the obser- vation that donor strain AB261 injects the proA locus first during chromosome transfer. the leu locus next, and the proB locus last. The proB locus is apparently distinct from a third proline locus, proC, which is transferred late by Hfr AB261 and is separated from thr by 11.5 minutes (N. M. SCHWARTZ, personal communi- cation).
The genetic map of donor strain AB312: The loci of pyrE, metE and metB were mapped in the six interrupted-mating experiments recorded in Table 3. The markers are all located on a short segment of the chromosome between the mtl and arg reierence loci. The time of entry data indicate a gene sequence of mtl- metE-metB-arg (Figure 4)) which agrees with other maps of this region con- structed by- JACOB and WOLLMAN (1961) and by PITTARD, LOUTIT and ADEL- BERG i 1963) ; however, the average distance between mtl and arg is 25 to 30 percent shorter than the distance given in the earlier maps. The close proximity
FIGVRE 3.-Map of the chromosomal segment transferred by donor strain AB259

664 A. L. TAYLOR AND M. S. THOMAN
TABLE 3
Time of entry of markers transferred by strain AB312
Selected markers of the donor parent Recipient parent
strain No. malA mtl PYrE metE metB arg-l
AB1376 13.0 19.5 20.0 . . . . . . 26.0 13.0 19.0 19.5 . . . . . . . .
AT21 32 14.5 20.5 . . . 22.0 . . . 27.5 16.0 22.0 . . . 24.0 . . 29.5
AB356 15.0 20.5 . . . . . 25.0 25.5 14.5 20.5 . . . . . . 26.0 27.0
of pyrE to mtl that was found in the AB312 x AB1376 crosses did not agree with the data of BECKWITH et al. (1962), which placed the pyrE locus in a different chromosome segment close to the gal loci. The reconciliation of these conflicting observations is described elsewhere (TAYLOR et al., 1964).
T h genetic maps of donor strains AB323 and AB311: Eleven markers in the region extending from mtl through malA to his were mapped with strain AB313, using zy l , malA, or his as reference loci. Note that three of the F- recipients listed in Table 4 carry the his-2 marker and that seven other recipients carry a differ- ent histidine marker, his-4. It was expected that his-2 and his4 would be closely linked and would therefore be usable as a single reference locus common to both sets of recipient strains. This assumption was based on the knowledge that all the his loci of Salmonella typhimurium, a bacterium whose linkage map is highly similar to that of E. coli (SANDERSON and DEMEREC 1964), are clustered in a single small region (HARTMAN et al., 1960). The interrupted matings of strain AB313 nevertheless indicated a rather large difference in the apparent times of entry of his-I + and his-4+ (see Table 4). The mean time of entry in four experi- ments was 40.5 minutes for his-l+ and 47.0 minutes in 12 experiments for his-4+, the mean difference being 6.5 minutes.
As a further check on this result, the two his markers were mapped again with strain AB311, a donor that is isogenic with strain AB313 except that it transfers the his loci early during conjugation (TAYLOR and ADELBERG 1960). These crosses showed that his-Z+ and his-4+ now had nearly identical times of entry; moreover, there was no significant difference in the distance between each of the two his markers and a tryB reference marker (see Figure 5 and the first two crosses in Table 5). These observations confirmed our original expectation that the two his alleles would be closely linked. The conflicting results obtained with these two donor strains can be explained on the hypothesis that strain AB313
b 0.5 - FIGURE 4.-Map of the chromosomal segment transferred by donor strain AB312.

GENETIC MAP OF E. coli TABLE 4
Time of entry of markers transferred by strain AB313
665
Selected marker of the donor parent Recipient parent
strain No. nit1 cysA xyl maM argE aerA lys phe.4 iyr cysC aroC purC pheB aroB his-1 his-4
AB442
AT2272
AT2090 AT2034 AT2002
AT2092
AT2273 AT2024
AB 1322
AB444
AT2022 AB1320
. . . . . . . 9.0 9.5 15.0 . . . . . . . . . . . . . . . . . . . . . . 10.5 11.0 16.0 . . . . . . . . . . . . . . . . . . . . . . . . . . . .
. . . . . 16.0 20.5 . . . . . . . . . . . . . . . . . . . . . . . . . . . . . .
. . . . . . . . . . 24.0 . . . . . . . . . . . . . . . . . . . . . . . . 48.0 . . . . . . . . . 25.0 . . . . . . . . . . . . . . . . . 47.0
. . . . 25.5 . . . . . . . . . . . . . . . . . . . 48.0 9.0 . . . . . 14.0 . . . . . . . 29.5 . . . . . . 35.0 . . . . . . 40.0 . . . 9.5 . . . . . . 15.0 . . . . . . . . 29.0 . . . . . . . 34.5 . . . . 40.5 . . . . . . . 14.5 . . . . . . . . 29.0 45.0 . . . . . . . . . . . . . . . . 31.0 46.0 . . . . . . . . . . . . 30.5 . . . . . . . . . . . . . . . 47.5
. . . 10.5 . . . . . . . . . . . . 33.0 . . . . . . . . . . . . . . 49.0 . . . . . . . . . . . . . . . . . . 34.0 . . . . . . . . . . . . . . 47.0
10.0 14.5 . . . . . . . . . . . . 34.0 34.5 . . . . . 41.0 . . . . . . . 16.0 . . . . . . . . . . . . 34.5 35.5 . . . . . . . . . .
10.0 . . . . . . . . . 35.0 . . . . . . 46.0 10.5 . . . . . . . . . . . . . . . . . . . . . 36.5 . . . 46.0
. . . . . . . . . . . . . . . . . . . . . . . . . . . 37.0 . . , 46.5 . . . . . . . . . . . . . . . . . . . . . . . . . . . . . . . . . . . . . 38.0 . . . 47.5
9.0 14.5 18.5 . . . . . . . . . . . . . . . . . . . . . . . . . . . . . . .
. . . . . . . . . . . . . . . . . 22.0 . . . . . . . . . . . . 35.0 40.5
. .
. . . . . . . . . . . . . . . .
. . . . . . . . . . . . . . . .
. . . . . . . . . . . .
I I I I I
h i 5-4'
10 20 30 40 50 TIME OF SAMPLING IN MINUTES
FIGURE 5.-Kinetics of chromosome transfer by donor strain AB31 1 in crosses to recipient strain AT2121 (solid circles and triangles) and to recipient strain AT1372 (open circles and triangles).
666 A. L. TAYLOR A N D M . S. THOMAN
TABLE 5 Time of entry of markers transferred by strain AB311
Selected markers of the donor parent Recipient parent
strain No. his-I his-4 aroD-5 aroD-6 tryB
AT2121 5.5 7.0
AT1372 6.5 6.0
AB1359 6.0 6.5
AB 1360 6.0 5.5
. . . . . . 19.5
. . . . . 22.0
. . . . . 21.0
. . . . . . 21 .o 12.0 . . . . . . 12.5 . . . . . . . . 12.5 . . .
. . 11.5 . . .
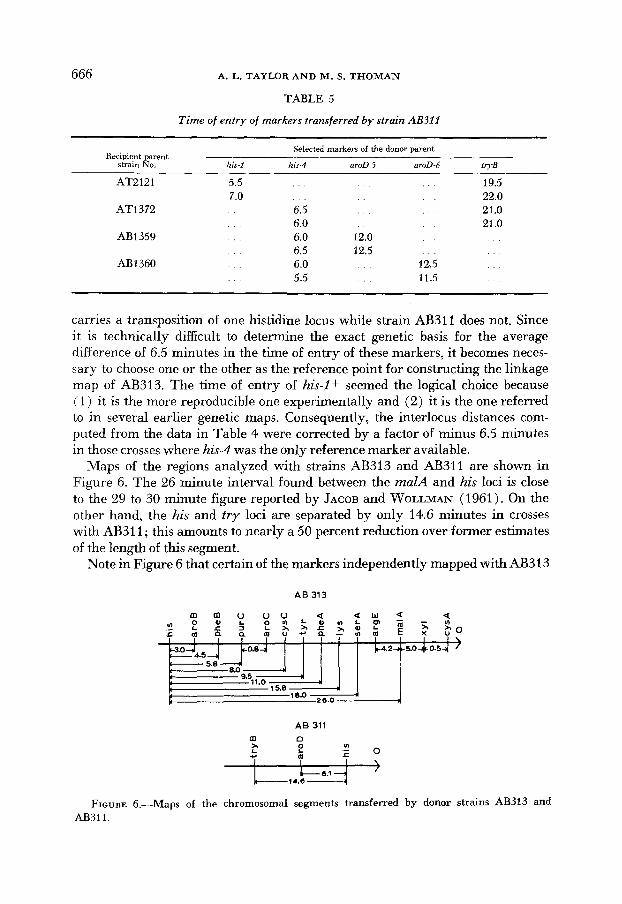
carries a transposition of one histidine locus while strain AB311 does not. Since it is technically difficult to determine the exact genetic basis for the average difference of 6.5 minutes in the time of entry of these markers, it becomes neces- sary to choose one or the other as the reference point for constructing the linkage map of AB313. The time of entry of his-Z+ seemed the logical choice because ( 1 ) it is the more reproducible one experimentally and (2) it is the one referred to in several earlier genetic maps. Consequently, the interlocus distances com- puted from the data in Table 4 were corrected by a factor of minus 6.5 minutes in those crosses where his-4 was the only reference marker available.
Maps of the regions analyzed with strains AB313 and AB311 are shown in Figure 6. The 26 minute interval found between the malA and his loci is close to the 29 to 30 minute figure reported by JACOB and WOLLMAN (1961). On the other hand, the his and try loci are separated by only 14.6 minutes in crosses with AB31 1 ; this amounts to nearly a 50 percent reduction over former estimates of the length of this segment.
Note in Figure 6 that certain of the markers independently mapped with AB313
AB 311
c 0.1 ) 14.0
FIGURE 6.-Maps of the chromosomal segments transferred by donor strains AB313 and AB31 1.
GENETIC MAP OF E. coli 667
(e.g., pheA, tyr, cy&) have closely similar times of entry. I t should be empha- sized that time of entry differences of only 1 or 2 minutes in separate experiments are usually too small to permit unequivocal ordering of loci on the chromosome. This is specially true for markers far from the chromosomal point-of-origin, be- cause extrapolations to the time axis become progressively less accurate with in- creasing distance from the origin. The inferred sequence for some of the closely linked markers shown in Figure 6 must therefore be considered as tentative until such time that more detailed mapping data become available.
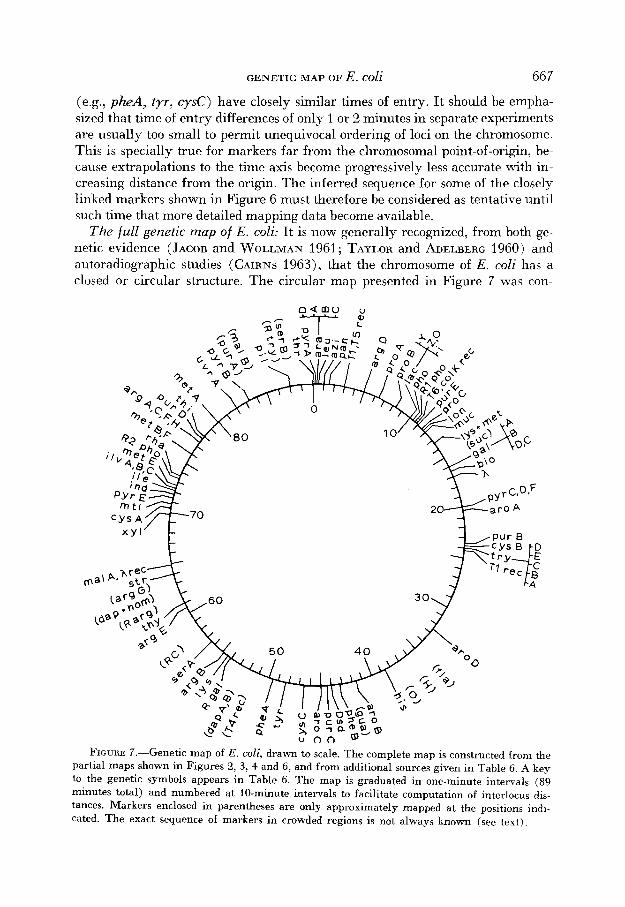
The full genetic map of E. coli: It is now generally recognized, from both ge- netic evidence (JACOB and WOLLMAN 1961; TAYLOR and ADELBERG 1960) and autoradiographic studies (CAIRNS 1963), that the chromosome of E. coli has a closed or circular structure. The circular map presented in Figure 7 was con-
FIGURE 7.-Genetic map of E . coli, drawn to scale. The complete map is constructed from the partial maps shown in Figures 2, 3, 4 and 6, and from additional sources given in Table 6. A key to the genetic symbols appears in Table 6. The map is graduated in one-minute intervals (89 minutes total) and numbered at 10-minute intervals to facilitate computation of interlocus dis- tances. Markers enclosed in parentheses are only approximately mapped at the positions indi- cated. The exact sequence of markers in crowded regions is not always known (see text).

668 A. L. TAYLOR A N D M. S. THOMAN
structed by joining together the individual map segments of the six donor strains described in the preceding paragraphs. For this purpose, the arg-3 marker that was mapped with strain AB261 and the arg-2 marker that was mapped with donor AB312 were treated as if they occupied a single locus on the genetic map, although they are actually alleles of two separate but closely linked loci. The com- bined segments cover the full length of the chromosome, except for the short region between the gal and try loci; the gap was closed by including in Figure 7 the 8-minute interval given by JACOB and WOLLMAN (1961) for this segment. The over-all length of the map, in time units, is 89 minutes.
The most recent complete map of E. coli appeared in the monograph of JACOB and WOLLMAN (1961, p. 165). However, new mapping data have accumulated rapidly since that time. In an effort to bring the chromosome map of E. coli up to date, we have included much of this new information in Figure 7. References to the individual sources of published and unpublished mapping data are given in Table 6. There has also been marked progress in identifying the biochemical functions determined by these gene loci. For this reason, we have also indicated wherever possible the specific enzymes associated with the genetic markers listed in Table 6.
Table 6 is not a complete list of all the known loci of E. coli; i t is limited instead to those loci which have been mapped with reasonable accuracy either by time of entry experiments, by transduction, or by linkage analyses in uninterrupted Hfr x F- crosses. Even so, the available data are often too limited to permit a precise ordering of all the loci in crowded regions of the map. For example, the exact order of 11 single and complex loci in the segment from xyl to metA (see (Figure 7) is known, but the correct positions in this sequence of four additional markers-namely ile, R2pho, rha and thi-are not known, even though each has been independently mapped in this region by its time of entry during conju- gation.
DISCUSSION
Interrupted-mating experiments performed with several donor strains showed that the number of recombinants found in successive blended samples does not always increase uniformly as a function of time. In several experiments, the number of recombinants increased slowly at first, then more rapidly some 5 to 15 minutes later. Independent tests suggested that extrapolation of the initial slopes of the resulting anomalous transfer curves provides the most accurate time of entry data and that extrapolation from the steeper second slopes generally tends to exaggerate the distance between loci.
Reexamination of data obtained in previous experiments revealed that the early recombinants were undetected in some instances; in others, they were SO
few in number that they were thought to be prototrophic revertants rather than recombinants. Previous mapping data were thus often based on extrapolations from second slopes, and this may account for the consistent trend toward diminu- tion of interlocus distances that typifies most of the new mapping data. As a consequence of this trend, the total length in time units of the E. coli linkage

GENETIC MAP OF E. coli 669
group was reduced to about four fifths of its previously estimated length-89 minutes versus 108 minutes (JACOB and WOLLMAN 1961 ) or 11 1 minutes (TAY- LOR and ADELBERG 1960).
The increased sensitivity of the present method for detecting early recombi- nants is largely due to two simple changes in experimental procedure. First, the blended samples were plated directly, without benefit of washing or further dilution in buffer to reduce the amount of broth transferred to the agar plates. Under these conditions, the number of recombinants recovered per donor cell in the mating mixtures was 10 to 50 times greater than in previous experiments where cells were diluted in buffer prior to plating. GROSS (in DE HAAN and GROSS 1962) reported that small amounts of broth enhance the recovery of genetic recombinants from zygotes on minimal agar plates. This effect may well account for the increased yields of recombinants. The second modification was the blend- ing of samples at closely spaced intervals of 2 or 3 minutes. The shallow initial slopes of the upward-breaking transfer curves would not have been detected in many experiments had the intervals between samples been extended to 5 or more minutes.
Anomalous transfer curves similar to the ones shown in Figure 1A and 1B have also been observed consistently in intergeneric crosses between Shigella Hfr donors and E. coli recipients (H. SCHNEIDER and S. FALKOW personal communi- cation). Although the physical basis for this phenomenon is still unknown, a plausible explanation for the broken slopes can be derived from a comparison of the kinetics of chromosome transfer in crosses with Hfr strains AB261 and AB451. Recall that AB261 and AB451 are identical in direction of transfer and in point- of-origin, but that the former produces transfer curves having two slopes whereas the latter produces single slope curves. The slopes generated by the secondary rise in pro+ and arg+ recombinants in the AB261 crosses were equal, within the limits of experimental variation, to the slopes of the corresponding transfer curves obtained in AB451 crosses. Thus, both donor strains ultimately transfer these markers to recipients with equal efficiency, and they differ only in that the bulk of the recombinants formed in the AB261 crosses do not appear until after a delay of 5 to 15 minutes. This, together with the observation that the delay is shortest for early markers and progressively longer for later markers (see Figures 1A and l B ) , suggests that the majority of AB261 donor cells inject their chromo- somes at a slower speed than AB451 donors. The shallow initial slopes which extrapolate to the same time of entry values as the corresponding AB451 transfer curves (Table 1) would then be produced by a minority population of AB261 donors that inject at the same speed as strain AB451. Although other interpreta- tions are not excluded by the present data, the notion of variable rates of chromo- some transfer in differenb cells of a mating Hfr population does satisfactorily account for the shape of the anomalous transfer curves. Moreover, these observa- tions complement the earlier studies of DE HAAN and GROSS (1962), who showed that certain other variations in the kinetics of chromosome transfer could also be best explained on the basis of different rates of transfer among individual donor cells.

.3
5
E 0 ;
cj %
W E d - " E q
? 3 s
U
.2 cl
w 2 m
t a


.3 3
8 w' * 1 i
1 3 '3 -f ".
2 % $ 4 C 0 . E
%
U
.3 4
. . h . . . . U ) . .
: : :gi8 !2 . . . . . : . : : :2
s .* .d c M
w

.e.- 3 . . e C D
8 .- Y
m GJ

6 74 A. L. TAYLOR AND M. S . THOMAN
The incorporation of mapping data from many independent sources into a single scale drawing of the genetic map results in a marked grouping of loci into short crowded regions (Figure 7). Note for example the clusters around the leu, lac, try, purC, Zys, str, and ilv loci. In most of these crowded regions, the exact sequence of loci on the chromosome is at best only partially determined. It is expected, therefore, that some of the sequences shown in Figure 7 will be revised when more refined mapping data become available. On the other hand, it is also expected that this detailed map will be useful both as a guide for further mapping studies in E. coli and as a reference point for future comparisons of the coli map with the chromosome maps of other bacterial species.
SUMMARY
The loci of 34 markers were determined by the interrupted conjugation tech- nique. Of these, 20 were markers hitherto unmapped by this method. The map distances between certain pairs of loci were found to be 10 to 50 percent shorter than in older published maps. As a consequence, the over-all length of the genetic map in time units was reduced to 89 minutes, or about four fifths of its former length. Anomalies in the kinetics of chromosome transfer were discovered in some of the crosses, and their importance in interpreting the results of interrupted mating experiments was discussed. In addition, recent mapping data from many laboratories were compiled; a revised map based on them shows the positions of 100 gene loci.
LITERATURE CITED
(Numbers are for purposes of reference in Table 6).
1. ADELBERG, E. A., and S. N. BURNS, 1960 coli. J. Bacteriol. 79: 321-330.
2. ADELBERG, E. A., and H. E. UMBARGER, 1953
Genetic variation in the sex factor of Escherichia
Isoleucine and valine metabolism in Escher- ichia coli. V. a-ketoisovaleric acid accumulation. J. Biol. Chem. 205 : 475-482.
3. ADLER, H. I., and A. A. HARDIGREE, 1964 sensitivity to radiation in Escherichia coli. J. Bacteriol. 87: 720-726.
4. ADLER, J., and A. D. KAISER, 1963 transduction with phage PI. Virology 19: 11 7-126.
5. ALF~LDI, L., G. S. STENT, and R. C. CLOWES, 1962 control (RC) locus in Escherichia coli. J. Mol. Biol. 5: 348-355.
6. AMES, B. N., and P. E. HARTMAN, 1963 The histidine operon. Cold Spring Harbor Symp. Quant. Biol. 28: 349-356.
7. AMES, B. N., P. E. HARTMAN, and F. JACOB, 1963 Chromosomal alterations affecting the regulation of histidine biosynthetic enzymes in Salmonella. J. Mol. Biol. 7: 23-42.
8. ARMSTRONG, F. B., and R. P. WAGNER, 1962 Mutants of Salmonella deficient in reducto- isomerase. Genetics 47: 1581-1593.
9. BACK, K. J. C., and E. G. WESTAWAY, 1962 Studies on a mutant strain of Escherichia coli which requires both methionine and lysine for growth. J. Gen. Microbiol. 27: 41-50.
10. BECKWITH, J. R., A. B. PARDEE, R. AUSTRIAN, and F. JACOB, 1962 Coordination of the synthesis of the enzymes in the pyrimidine pathway of Escherichia coli. J. Mol. Biol. 5 : 618-634.
Analysis of a gene controlling cell division and
Mapping of the galactose genes of Escherichia coli by
The chromosomal site of the RNA

GENETIC MAP OF E. coli 675
11. BUTTIN, G., 1962 Sur la structure de l'operon galactose chez Escherichia coli K12. ComPt. Rend. 255: 1233-1235.
Mkanismes Sgulateurs dans la biosynthAse des enzymes du mktabolisme du galactose chez Escherichia coli K12. 11. Le dkterminisme gknktique de la rkgulation. J . Mol. Biol. 7: 183-205.
13. CAIRNS, J., 1963 The bacterial chromosome and its manner of replication as seen by autoradiography. J. Mol. Biol. 4: 208-213.
14. COHEN, G. N., J. PATTE, P. TRUFFA-BACHI, C. SAWAS, and M. DOUDOROFF, 1963 Repression and end product inhibition in a branched biosynthetic pathway. Contribution to Colloq. Intern. du Conceil Nat. Recherche Sci. (Marseille, July 1963). (In press).
Genetic suppression of purine-requiring mutants of Salmonella typhimurium. (Abstr.) Bacteriol. Proc. p. 97.
On the separation of the tryptophan synthetase of Escherichia coli into two protein components. Proc. Natl. Acad. Sci. U.S. 44: 1161-1170.
17. DEMEREC, M., 1963 Proposal for a uniform nomenclature in bacterial genetics. Microbial Genetics Bull. 19: 30-34.
18. DEMEREC, M., E. L. LAHR, T. MIYAKE, I. GOLDMAN, E. BALBINDER, S. BANIC, K. HASHIMOTO, Bacterial genetics. Carnegie Inst. Wash. Ybk.
The biochemical characterization of cysteine-requir-
Genetic control of repression of
Succinic ester and amide of
12. , 1963
15. COON, R. G., and J. S. GOTS, 1961
16. CRAWFORD, I., and C. YANOFSKY, 1958
E. V. GLANVILLE, and J. D. GROSS, 1958 57: 3904%.
ing mutants of Salmonella typhimurium. J. Bid. Chem. 238: 1019-1024..
alkaline phosphatase in E. coli. J. Mol. Biol. 3: 425438.
homoserine: some spontaneous and enzymatic reactions. Science 143 : 50-53. Recombinants gCnktiques de souches marqukes
par rksistance aux colicines et aux bactkriophages. Ann. Inst. Pasteur 83 : 283-294. Genetic studies on tryptophanase mutants of Escher-
ichia coli K-12. (Abstr.) Bacteriol. Proc. p. 18.
The partial purification and properties of indole-3- glycerol phosphate synthetase from Escherichia coli. Biochim. Biophys. Acta 43 : 489-500.
Purine metabolism in bacteria. VI. Accumulations by mutants lacking adenylosuccinase. J . Bacteriol. 78: 320-325.
26. , 1961 Genetic and biochemical analysis of adenine-specific auxotrophs of Salmonella typhimurium. (Abstr.) Bacteriol. Proc. p. 185.
27. GORINI, L., W. GUNDERSEN, and M. BURGER, 1961 Genetics of regulation of enzyme synthesis in the arginine biosynthetic pathway of Escherichia coli. Cold Spring Harbor Symp. Quant. Biol. 24: 173-182.
Transfer delay and chromosome withdrawal during conjugation in Escherichia coli. Genet. Research 3 : 251-272.
Fine structure mapping by complete transduction between histidine-requiring Salmonella mutants. J. Gen. Microbiol. 22 : 323-353.
Complementation studies of arabinose genes in Escherichia coli. Genetics 4.8: 1397-1410.
F' and F mediated transductions in Escherichia coli K12. Japan. J. Genet. 36: 307-318.
19. DREYFUSS, J., and K. J. MONTY, 1963
20. ECHOLS, H., A. GAREN, S. GAREN, and A. TOBIUANI, 1961
21. FLAVIN, M., C . DELAVIER-KLUTCHKO, and C. SLAUGHTER, 1964
22. FR~D~RICQ, P., and M. BETZ-BAREAU, 1952
23. GARTNER, T. K., and M. RILEY, 1964
24. GIBSON, F., and C. YANOFSKY, 1960
25. GOLLUB, E. G., and J. S. GOTS, 1959
28. HAAN, P. G. DE, and J. D. GROSS, 1962
29. HARTMAN, P. E., J. C. LOPER, and D. SERMAN, 1960
30. HELLING, R. B., and R. WEINBERG, 1963
31. HIROTA, Y., and P. H. A. SNEATH, 1961

676 32. HOWARD-FLANDERS, P., R. P. BOYCE, E. SIMSON, and L. THERIOT, 1962 A genetic locus in
Escherichia coli K-12 that controls the reactivation of UV-photoproducts associated with thymine in DNA. Proc. Natl. Acad. Sci. U.S. 48: 2109-2115.
33. HOWARD-FLANDERS, P., E. SIMSON, and L. THERIOT, 1964 A locus that controls filament formation and sensitivity to radiation in Escherichia coli K-12. Genetics 49 : 237-246.
34. ISHIBASHI, M., Y. SUGINO, and Y. HIROTA, 1964 Chromosomal location of thymine and arginine genes in Escherichia coli and an F' incorporating them. J. Bacteriol. 87: 554-561.
On the regulation of gene activity. Cold Spring Harbor
Analyze des groupes de liaison genetique de differ-
37. -- , 1958 Genetic and physical determinations of chromosomal segments in
38.
39. JUNGWIRTH, C., S. R. GROSS, P. MARGOLIN, and H. E. UMBARGER, 1963
A. L. TAYLOR A N D M. S . THOMAN
35. JACOB, F., and J. MONOD, 1961
36. JACOB, F., and E. L. WOLLMAN, 1957
Symp. Quant. Biol. 26: 193-208.
entes souches donatrices $Escherichia coli K-12. Compt. Rend. 245 : 1840-1843.
Escherichia coli. Symp. Soc. Exptl. Biol. 12: 75-92.
, 1961 Sexuality and the Genetics of Bacteria. Academic Press, New York. The biosynthesis
of leucine. I. The accumulation of P-carboxy P-hydroxyisocaproate by leucine auxo- trophs of Salmonella typhimurium and Neurospora crassa. Biochem. 2: 1-6.
Hereditary defects in galactose metabolism in Escherichia coli mutants. I. Determination of enzyme activities. Proc. Natl. Acad. Sci. U.S. 45: 1776-1786.
40.. KALCKAR, H. M., K. KURAHASHI, and E. JORDAN, 1959
41. LARRABEE, A. R., S. ROSENTHAL, R. E. CATHOU, and J. M. BUCHANAN, 1963 Enzymatic synthesis of the methyl group of methionine. IV. Isolation, characterization, and role of 5-methyl tetrahydrofolate. J. Biol. Chem. 238: 1025-1031.
42. LEDERBERG, E. M., 1955 Pleitropy for maltose fermentation and phage resistance in
Dual effects of structural genes in Escherichia coli.
Transduction of linked genetic characters of the host by bacteriophage
Genetic and chemical studies with alkaline phosphatase of Escherichia
Studies on repression of arginine biosynthesis in Escherichia coli. Cold
Escherichia coli K-12. (Abstr.) Genetics 4.fJ: 580-581.
43. LEE, N., and E. ENGLESBERG, 1962 Proc. Natl. Acad. Sci. U S . 4.8: 335-348.
44. LENNOX, E. S., 1955
45. LEVINTHAL, C., 1959
45. MAAS, W., 1961
P1. Virology 1: 190-206.
coli. Brookhaven Symp. Biol. 12: 76-83.
Spring Harbor Symp. Quant. Biol. 26: 183-191.
47. M.AAS, R., and W. K. MAAS, 1962 Introduction of a gene from Escherichia coli B into Hfr
The genetics of fimbriation in Escherichia coli.
Genetic fine structure of the leucine operon in Salmonella. Genetics
and F- strains of Escherichia coli K-12. Proc. Natl. Acad. Sci. U S . 48: 1887-1893.
48. MACCACARO, G. A., and W. HAYES, 1961 Genet. Research 2: 394-405.
a: 44-457.
mucoid mutants of Escherichia coli K-12. Proc. Natl. Acad. Sci. US. 51: 239-246.
49. MARGOLIN, P., 1963
50. MARKOVITZ, A., 1964 Regulatory mechanisms for synthesis of capsular polysaccharide in
Specialized transduction of tryptophan markers in Escherichia coli 51. MATSUSHIRO, A., 1963 K-12 by bacteriophage $J 80. Virology 19: 475-482.
52. MCFALL, E., Personal communication
53. ORSKOV, F., and I. ORSKOV, 1962 Behavior of Escherichia coli antigens in sexual recombi- nation. Acta Pathol. Microbiol. Scand. 55: 99-109.

GENETIC MAP OF E. coli 677
Gene transfer by F' strains of
3-enolpyruvylshikimate 5-phosphate, an inter- mediate in the biosynthesis of anthranilate. Proc. Natl. Acad. Sci. U.S. 48: 864-867.
Genetic map of Salmonella typhimurium.
54. PITTARD, A. J., J. S. LOUTIT, and E. A. ADELBERG, 1963 Escherichia coli K-12. J. Bacteriol. 85: 1394-1401.
55. RIVERA, A., and P. R. SRINIVASAN, 1962
56. SANDERSON, K. E., and M. DEMEREC, 1964 Microbial Genetics Bull. 20: 11-15.
57. SCHWARTZ, N. M., Personal communication. 58. SMITH, 0. H., and C. YANOFSKY, 1960 1 - (0-carboxyphenylamino) -1-deoxyribulose 5-phos-
phate, a new intermediate in the biosynthesis of tryptophan. J. Biol. Chem. 235: 2051- 2057.
Linkage analysis with very high frequency males of Escherichia coli. Genetics 45: 1233-1243.
The chromosomal location of the structural gene for orotidylic acid pyrophosphorylase in E . coli. J. Mol. Biol. 8: 771.
Biosynthesis of seiine in Escherichia coli and Salmonella typhimurium. J. Bacteriol. 85: 1431-1439.
Induction of acetylornithine 8-transaminase during pathway-wide repression, pp. 293-300. Informational Macromolecules. Edited by H. J. VOGEL, V. BRYSON, and J. 0. LAMPEN. Academic Press, New York.
Nature of the genetic blocks in the isoleucine- valine mutants of Salmonella. Genetics 45 : 1375-1386.
64. WIESMEYER, H., and M. COHN, 1960 The characterization of the pathway of maltose utilization by Escherichia coli. 111. A description of the concentrating mechanism. Biochim. Biophys. Acta 39: 4.1.0-447.
Transduction sp&ifique du marqueur biotine par le bactdriophage A. Compt. Rend. 257: 4225-4226.
Conjugation and genetic recombination in Escherichia coli K-12. Cold Spring Harbor Symp. Quant. Biol. 21: 141-161.
Transduction and recombination study of linkage relationships among the genes controlling tryptophan synthesis in Escherichia coli. Virology 8 : 425-447.
59. TAYLOR, A. L.: and E. A. ADELBERG, 1960
60. TAYLOR, A. L., J. R. BECKWITH, A. B. PARDEE, R. AUSTRIAN, and F. JACOB, 1964
61. UMBARGER, H. E., M. A. UMBARGER, and P. M. L. SIU, 1963
62. VOGEL, H. J., D. F. BACON, and A. BAICH, 1963
63. WAGNER, R. P., and A. BERGQUIST. 1960
65. WOLLMAN: E. L., 1963
66. WOLLMAN, E. L., F. JACOB, and W. HAYES, 1956
67. YANOFSKY, C., and E. S. LENNOX, 1959