of extraction kinetics of bioactive compounds from...
TRANSCRIPT

Determination of extraction kinetics of bioactive compounds from spent coffee grounds (Coffea arábica)
Ashley Sthefanía Caballero Galván, Daissy Lorena Restrepo Serna, Mariana Ortíz Sánchez, Carlos Ariel Cardona Alzate*
Universidad Nacional de Colombia sede Manizales, Instituto de Biotecnología y Agroindustria. Laboratorio de Equilibrios Químicos y Cinética Enzimática. Departamento de Ingeniería
Química. Manizales, Colombia
Research group on chemical, Catalytic and Biotechnological Processes 1

Research group on chemical, Catalytic and Biotechnological Processes 2
Introduction Methodology Results Conclusion Acknowledgements References
The Coffee• Annual production of 156.6 million bags of 60 kilograms in 2016.
• This product is responsible for the generation of large quantities of waste, asthe coffee pot, grounds and mucilage
Spent coffee grounds are the major residues ofthe soluble coffee industry, generating 6 milliontons per year and causing economic andenvironmental issues when this residue isdischarged to the surroundings or incinerated
Several authors have reported the use of the spent coffee grounds (SCG) to obtain different added‐value products and thus, increasing thesustainability of the global coffee industry. Different studies have reported large quantities of polyphenolic components in the SCG with a highconcentration of chlorogenic acid. There is several applications of these components in the food, pharmaceutics and cosmetic industry.
Figure 1. Coffee plantation Figure 2. Spent coffee grounds

Research group on chemical, Catalytic and Biotechnological Processes 3
Introduction Methodology Results Conclusion Acknowledgements References
Polyphenolic Compounds
Figure 3. Chlorogenic acid structure
Applications
Anti‐cancer
Anti‐diabetic
Anti‐microbial
Anti‐allergenic
Antioxidant
ExtractionTechnology
Conventional
Solventextraction
Soxhletextraction
Mechanicextraction
Non‐conventional
Supercriticalfluid
extraction
Ultrasoundassistedextraction
Molecular distillation
Microwave assisted extraction
• Polyphenolic compounds are part of secondarymetabolites, being identified more than 8.000compounds.
The determination of the extraction kinetics has high importance for thedesign of the extraction equipment, allowing an optimization of the time, energy and cost of the process. Additionally, the determination of theextraction kinetics provides a great knowledge about the extraction rates

Research group on chemical, Catalytic and Biotechnological Processes 4
Introduction Methodology Results Conclusion Acknowledgements References
Model Equation
Gaussian model y ∗ exp
Richards model y∗
Reciprocal Quadratic model y∗ ∗
Weibull model y ∗ exp ∗
Exponential models y ∗ exp ∗
Steinhart‐Hart model y∗ ∗
Kinetic Models
Model Equation
Rational model y ∗∗ ∗
Bleasdale model y a b ∗
Heat Capacity model y ∗
Shifted Power y ∗
Modified Hoerl model y ∗ ∗
Exponential Association 3 model y ∗ exp ∗

Research group on chemical, Catalytic and Biotechnological Processes 5
Introduction Results Conclusion Acknowledgements ReferencesMethodology
Extractives (NREL/TP‐510‐42619),
Cellulose (T203 os‐74 ASTM 1695‐77)
Holocellulose (ASTM D1104) Lignin (T222)
Moisture Ash (NREL/TP‐510‐42622),
Characterization of raw material
Collection and drying of raw material
Characterization of rawmaterial
Polyphenolic compoundsextraction
Determination of polyphenolic compounds
Obtaining extraction kinetics

Research group on chemical, Catalytic and Biotechnological Processes 6
Introduction Results Conclusion Acknowledgements ReferencesMethodology
Extraction Vacuum filtration Centrifugation Analysis of extractives
Equipment: Ultrasonic processor UP50H (Hielscher Ultrasound Technology)Ultrasonic power: 750 W Frequency: 20 kWhTemperature: 50 °C ± 2 °CSolvent/sample ratio: 20:1Solvent: Ethanol 60% v/vTime intervals: 10, 20 30 40 50 and 60 min
Ultrasound Assisted Extraction
Temperature: 25 °CSolvent/sample ratio: 20:1Solvent: Ethanol 60% v/vTime: 8 hours
Sample weight: 10 g.Solvent volumen: 250 mLSolvent: Ethanol 60% v/vTime: 5 hours
Soxhlet ExtractionSolvent Extraction

Research group on chemical, Catalytic and Biotechnological Processes 7
Introduction Methodology Conclusion Acknowledgements ReferencesResults
This work* Reference [6] Reference[2]Extractives 25.64 ± 0.27 ND ‐‐‐Holocellulose 50.32 ± 2.03 ‐‐‐ ‐‐‐Cellulose 21.48 ± 0.06 8.6 (Glucose) 12.40 ± 0.70
(Glucose)Hemicellulose 28.84 ± 2.09 36.7 39.10 ± 1.90
Lignin 19.83 ± 0.76 ND 23.90 ± 1.70Ash 0.94 ± 0.05 1.6 30. ± 0.10*All the percentages are expressed by weight.
Table 1. Physicochemical composition of SCG.
Figure 1. Phenolics compounds concentration vs time.

Research group on chemical, Catalytic and Biotechnological Processes 8
Introduction Methodology Conclusion Acknowledgements ReferencesResults
Extraction kinetics of phenolic compounds
(Folin-Ciocalteu)

Research group on chemical, Catalytic and Biotechnological Processes 9
Introduction Methodology Conclusion Acknowledgements ReferencesResults
• Gaussian model
390.74 ∗ exp478.66
2 ∗ 494.07 . 1
• Richards model
390.05
1 exp 6.56 0.02 ∗ . . 2
• Reciprocal Quadratic model1
4.00 ∗ 10 6.30 ∗ 10 ∗ 6.92 ∗ 10 ∗ . 3
• Weibull model582.55 189.54 ∗ exp 5.20 ∗ 10 ∗ . . 4
• Richards model.
. . ∗ .Eq. 5
• Exponential models
346.80 ∗ exp 1.66 ∗ 10 ∗ . 6
Solvent extraction (TPC total phenoliccompounds)
Soxhlet Extraction
R2=0.997
R2=0.999
R2=0.984
R2=0.986
R2=0.995
R2=0.984

Research group on chemical, Catalytic and Biotechnological Processes 10
Introduction Methodology Conclusion Acknowledgements ReferencesResults
• Richards model
650.45
1 exp 292.44 5.61 ∗ , . . 7
• Weibull model657.59 86.90 ∗ exp 6.42 ∗ 10 ∗ . . 8
• Gaussian model
702.73 ∗ exp128.40
2 ∗ 182.02 . 9
Ultrasound assisted extraction
Technology Phenolic compound (mg/L)
Solvent extraction 392.50
Soxhlet extraction 559.09
UAE 650.453
R2=0.973
R2=0.982
R2=0.966

Research group on chemical, Catalytic and Biotechnological Processes 11
Introduction Methodology Conclusion Acknowledgements ReferencesResults
Extraction kinetics of chlorogenic acid

Research group on chemical, Catalytic and Biotechnological Processes 12
Introduction Methodology Conclusion Acknowledgements ReferencesResults
• Steinhart‐Hart model1
0.33 6.80 ∗ 10 ∗ 5.38 ∗ 10 ∗ . 10
• Exponential Association 3 model21.65 ∗ 1.25 exp 4.86 ∗ 10 ∗ . 11
• Rational model5.61 0.11 ∗
1 2.13 ∗ 10 ∗ 1.59 ∗ 10 ∗ . 12
Solvent Extraction (CAC chlorogenicacid content)
Soxhlet Extraction
• Weibull model243.85 226.74 ∗ exp 1.33 ∗ 10 ∗ . . 13
• Bleasdale model
1.13 ∗ 10 1.97 ∗ 10 ∗ . . 14
• Steinhart‐Hart model1
1.37 ∗ 10 2.54 ∗ 10 ∗ 4.96 ∗ 10 ∗ . 15
R2=0.997
R2=0.998
R2=0.997
R2=0.997
R2=0.997
R2=0.997
Research group on chemical, Catalytic and Biotechnological Processes 13
Introduction Methodology Conclusion Acknowledgements ReferencesResults
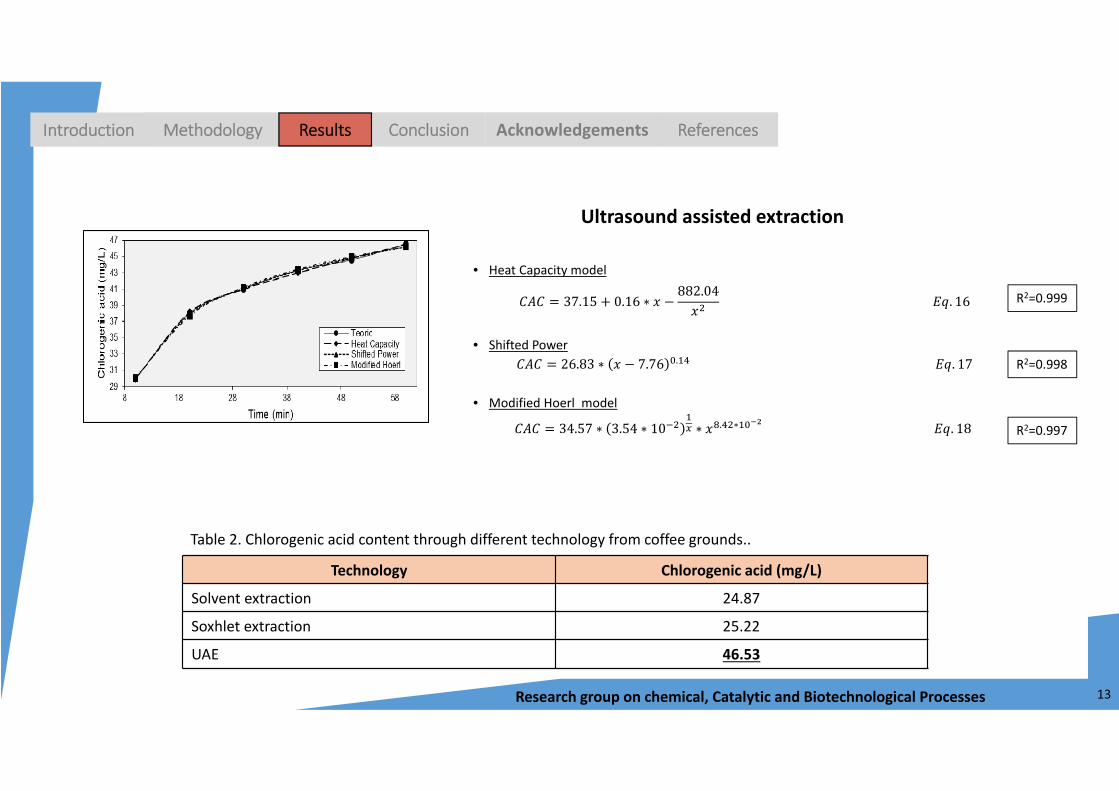
• Heat Capacity model
37.15 0.16 ∗882.04
. 16
• Shifted Power26.83 ∗ 7.76 . . 17
• Modified Hoerl model
34.57 ∗ 3.54 ∗ 10 ∗ . ∗ . 18
Ultrasound assisted extraction
Technology Chlorogenic acid (mg/L)
Solvent extraction 24.87
Soxhlet extraction 25.22
UAE 46.53
Table 2. Chlorogenic acid content through different technology from coffee grounds..
R2=0.997
R2=0.998
R2=0.999

Research group on chemical, Catalytic and Biotechnological Processes 14
Introduction Methodology Results Acknowledgements ReferencesConclusion
The ultrasound assisted extraction method, with ethanol 60%v/v as dissolvent, proved to be an effectivealternative method for the extraction of polyphenolic compounds
Spent coffee grounds presented a high concentration of chlorogenic acid making these coffee residues anattractive raw material for the food and pharmaceutical industry.
The kinetics obtained are very useful for future equipment design and overall process analysis

Research group on chemical, Catalytic and Biotechnological Processes 15
Introduction Methodology Results Conclusion ReferencesAcknowledgements
The authors express their gratitude to the Universidad Nacional de Colombia sede Manizales, the Hermes byfinancing of mobility (code 7181) and the project of techno-economic and environmental assessment of abiorefinery using coffee waste (code 35434).

Research group on chemical, Catalytic and Biotechnological Processes 16
Introduction Methodology Results Conclusion Acknowledgements References
[1] F. A. Service, “Coffee: World Markets and Trade,” United States Dep. Agric., 2016.[2] L. F. Ballesteros, J. A. Teixeira, and S. I. Mussatto, “Chemical, Functional, and Structural Properties of Spent Coffee Grounds and Coffee Silverskin,” Food
Bioprocess Technol., vol. 7, no. 12, pp. 3493–3503, 2014.[3] L. A. G., “Anaerobic digestion of wastes; spent coffee grounds,” Biomass, vol. 3, no. 4, pp. 247–268, 1983.[4] S. I. Mussatto, L. F. Ballesteros, S. Martins, and J. A. Teixeira, “Extraction of antioxidant phenolic compounds from spent coffee grounds,” Sep. Purif.
Technol., vol. 83, no. 1, pp. 173–179, 2011.[5] R. Campos Vega, G. Loarca Piñaa, H. Vergara Castañeda, and D. Oomahb, “Spent coffee grounds: A review on current research and future prospects,”
Trends Food Sci. Technol., no. 11, 2015.[6] S. I. Mussatto, L. M. Carneiro, J. P. a Silva, I. C. Roberto, and J. a. Teixeira, “A study on chemical constituents and sugars extraction from spent coffeegrounds,” Carbohydr. Polym., vol. 83, no. 2, pp. 368–374, 2011.[7] L. Bravo, D. Sources, and N. Significance, “Polyphenols: chemistry, dietary sources, metabolism, and nutritional significance.,” Nutr. Rev., vol. 56,no. 11, pp. 317–333, 1998.[8] T. Ozcan, a. Akpinar‐Bayizit, L. Yilmaz‐Ersan, and B. Delikanli, “Phenolics in Human Health,” Int. J. Chem. Eng. Appl., vol. 5, no. 5, pp. 393–396,2014.[9] a Michalak, “Phenolic Compounds and Their Antioxidant Activity in Plants Growing under Heavy Metal Stress,” Plant Cell, vol. 15, no. 4, pp. 523–530, 2006.[10] I. X. Cerón, J. C. Higuita, and C. A. Cardona, “Design and analysis of antioxidant compounds from Andes Berry fruits (Rubus glaucus Benth) using anenhanced‐fluidity liquid extraction process with CO2 and ethanol,” J. Supercrit. Fluids, vol. 62, pp. 96–101, 2012.[11] N. Abdullah Al‐Dhabia, K. Ponmurugana, and P. Maran Jeganathanb, “Development and validation of ultrasound‐assisted solid‐liquid extraction ofphenolic compounds from waste spent coffee grounds,” Ultrason. Sonochem., vol. 34, pp. 206–213, 2017.[12] T. Bin Zou, M. Wang, R. Y. Gan, and W. H. Ling, “Optimization of ultrasound‐assisted extraction of anthocyanins from mulberry, using responsesurface methodology,” Int. J. Mol. Sci., vol. 12, no. 5, pp. 3006–3017, 2011.[13] A. Sluiter, R. O. Ruiz, C. Scarlata, J. Sluiter, D. Templeton, and D. of Energy, “Determination of Extractives in Biomass,” Biomass Anal. Technol. TeamLab. Anal. Proced., no. January, pp. 1–8, 2004.

Research group on chemical, Catalytic and Biotechnological Processes 17
Introduction Methodology Results Conclusion Acknowledgements References
[14] A. Sluiter et al., “Determination of Ash in Biomass,” Microbiology, vol. 154, no. January, pp. 2956–69, 2008.[15] J. S. Han and J. S. Rowell, “Chemical Composition of Fibers,” Pap. Compos. from agro‐based Resour., pp. 83–134, 1997.[16] J. A. Quintero, J. Moncada, and C. A. Cardona, “Techno‐economic analysis of bioethanol production from lignocellulosic residues in Colombia: A processsimulation approach,” Bioresour. Technol., vol. 139, pp. 300–307, 2013.[17] T. Roukas and P. Kotzekidou, “Lactic acid production from deproteinized whey by mixed cultures of free and coimmobilized Lmtobacillus casei and LmtococcusZactis cells using fedbatch culture,” Enzyme Microb. Technol., vol. 22, no. 97, pp. 199–204, 1998.[18] R. S. Rao, C. P. Jyothi, R. S. Prakasham, P. N. Sarma, and L. V. Rao, “Xylitol production from corn fiber and sugarcane bagasse hydrolysates by Candida tropicalis,”Bioresour. Technol., vol. 97, no. 15, pp. 1974–1978, 2006.[19] S. I. Mussatto, E. M. S. Machado, S. Martins, and J. A. Teixeira, “Production, Composition, and Application of Coffee and Its Industrial Residues,” Food BioprocessTechnol., vol. 4, no. 5, pp. 661–672, 2011.[20] C. A. Cardona Alzate and O. J. Sánchez Toro, “Energy consumption analysis of integrated flowsheets for production of fuel ethanol from lignocellulosic biomass,”Energy, vol. 31, no. 13, pp. 2447–2459, 2006.[21] J. D. P. Araújo, C. A. Grande, and A. E. Rodrigues, “Vanillin production from lignin oxidation in a batch reactor,” Chem. Eng. Res. Des., vol. 88, no. 8, pp. 1024–1032, 2010.

Research group on chemical, Catalytic and Biotechnological Processes 18
Introduction Methodology Results Conclusion Acknowledgements References
Thanks for your attention
Ashley Sthefanía Caballero Galván, Daissy Lorena Restrepo Serna, Mariana Ortíz Sánchez, Carlos Ariel Cardona Alzate*
Universidad Nacional de Colombia sede Manizales, Instituto de Biotecnología y Agroindustria. Laboratorio de Equilibrios Químicos y Cinética Enzimática. Departamento de Ingeniería Química. Manizales, Colombia