oecd guideline for the testing of chemicals · oecd guideline for the testing of chemicals proposal...
TRANSCRIPT

OECD/OCDE
OECD GUIDELINE FOR THE TESTING OF CHEMICALS
Proposal for updating Test Guideline 487
In Vitro Mammalian Cell Micronucleus Test
INTRODUCTION
1. The in vitro micronucleus (MNvit) assay is a genotoxicity test for the detection of micronuclei
(MN) in the cytoplasm of interphase cells. Micronuclei may originate from acentric chromosome
fragments (i.e. lacking a centromere), or whole chromosomes that are unable to migrate to the poles
during the anaphase stage of cell division. The assay detects the activity of clastogenic and aneugenic
chemicals (1) (2) in cells that have undergone cell division during or after exposure to the test substance.
This Test Guideline allows the use of protocols with and without the actin polymerisation inhibitor
cytochalasin B (cytoB). The addition of cytoB prior to the targeted mitosis allows for the identification
and selective analysis of micronucleus frequency in cells that have completed one mitosis because such
cells are binucleate (3) (4). This Test Guideline also allows the use of protocols without cytokinesis
block, provided there is evidence that the cell population analysed has undergone mitosis.
2. In addition to using the MNvit assay to identify chemicals that induce micronuclei, the use of a
cytokinesis block, immunochemical labelling of kinetochores, or hybridisation with
centromeric/telomeric probes (fluorescence in situ hybridisation (FISH)), also can provide information
on the mechanisms of chromosome damage and micronucleus formation (5) (6) (7) (8) (9) (10) (11) (12)
(13) (14) (15) (16). The labelling and hybridisation procedures can be used when there is an increase in
micronucleus formation and the investigator wishes to determine if the increase was the result of
clastogenic and/or aneugenic events.
3. Micronuclei represent damage that has been transmitted to daughter cells, whereas chromosome
aberrations scored in metaphase cells may not be transmitted. In either case, the changes may not be
compatible with cell survival. Because micronuclei in interphase cells can be assessed relatively
objectively, laboratory personnel need only determine whether or not the cells have undergone division
and how many cells contain a micronucleus. As a result, the preparations can be scored relatively
quickly and analysis can be automated. This makes it practical to score thousands instead of hundreds of
cells per treatment, increasing the power of the assay. Finally, as micronuclei may arise from lagging
chromosomes, there is the potential to detect aneuploidy-inducing agents that are difficult to study in
conventional chromosomal aberration tests, e.g. OECD Test Guideline 473 (17). However, the MNvit
assay does not allow for the differentiation of chemicals inducing changes in chromosome number
and/or ploidy from those inducing clastogenicity without special techniques such as FISH described
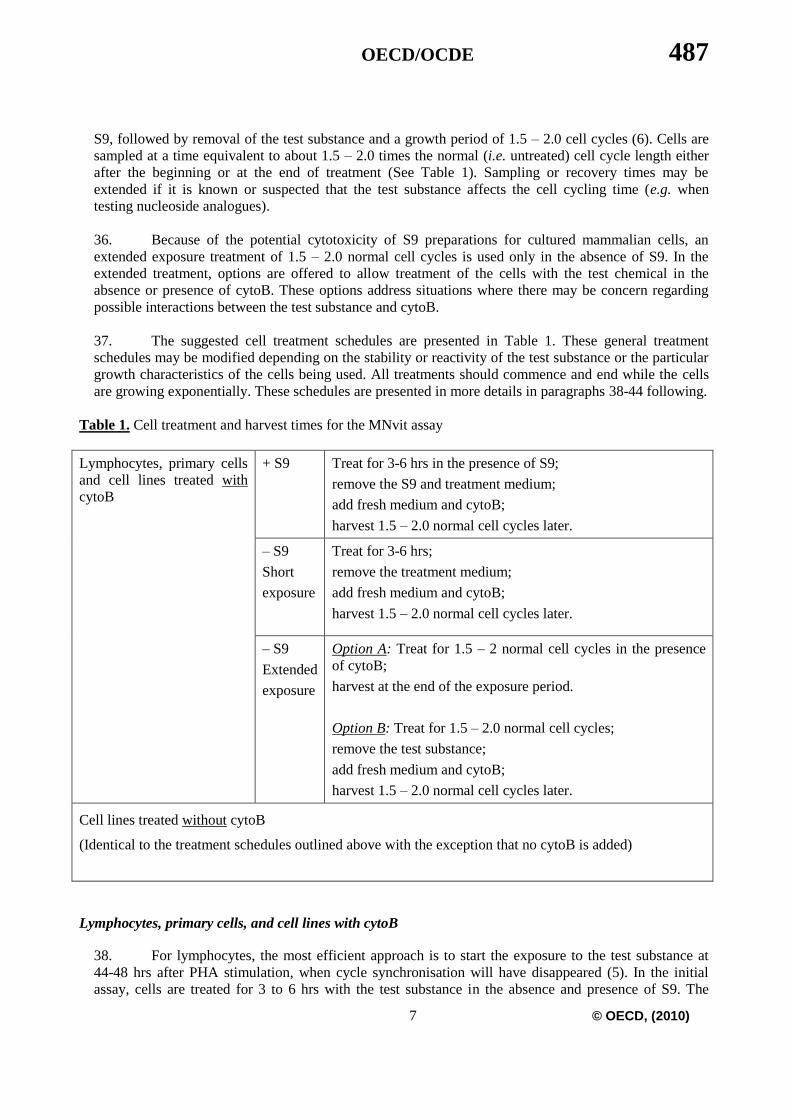
under paragraph 2.
4. The MNvit assay is an in vitro method that typically uses cultured human or rodent cells. It
provides a comprehensive basis for investigating chromosome damaging potential in vitro because both
aneugens and clastogens can be detected.
5. The MNvit assay is robust and effective in a variety of cell types, and in the presence or absence
of cytoB. There are extensive data to support the validity of the MNvit assay using various rodent cell
lines (CHO, V79, CHL/IU, and L5178Y), human cell line TK6 and human lymphocytes (18) (19) (20)
(21) (22) (23) (24) (25) (26) (27) (28) (29) (30) (31) (35) (B2) (B3) (B4). These include, in particular,
the international validation studies co-ordinated by the Société Française de Toxicologie Génétique
487 OECD/OCDE
© OCDE, (2010) 2
(SFTG) (18) (19) (20) (21) (22) and the reports of the International Workshop on Genotoxicity Testing
(4) (16). The available data have also been re-evaluated in a weight-of-evidence retrospective validation
study by the European Centre for the Validation of Alternative Methods (ECVAM) of the European
Commission (EC), and the test method has been endorsed as scientifically valid by the ECVAM
Scientific Advisory Committee (ESAC) (32) (33) (34). HepaRG (B5)(B6), HepG2 cells (36) (37) and
primary Syrian Hamster Embryo cells (38) has been described, although they have not been used in
validation studies. At the present time, the available data suggest it is important to consider the p53
status, genetic (karyotype) stability, DNA repair capacity and origin (rodent versus human) of the cells
chosen for testing (Pfuhler et al., 2011). These characteristics may be considered relevant for
demonstration of chemical safety in human population.
6. Definitions used are provided in Annex 1.
INITIAL CONSIDERATIONS
7. Tests conducted in vitro generally require the use of an exogenous source of metabolic activation
unless the cells are metabolically competent with respect to the substances being tested. The exogenous
metabolic activation system does not entirely mimic in vivo conditions. Care should also be taken to
avoid conditions that would lead to artifactual positive results which do not reflect intrinsic
mutagenicity, and may arise from such factors as marked changes in pH or osmolality, or by high levels
of cytotoxicity (39) (40) (41).
8. To analyse the induction of micronuclei, it is essential that mitosis has occurred in both treated
and untreated cultures. The most informative stage for scoring micronuclei is in cells that have
completed one mitosis during or after treatment with the test substance.
PRINCIPLE OF THE TEST
9. Cell cultures of human or mammalian origin are exposed to the test substance both with and
without an exogenous source of metabolic activation unless cells with an adequate metabolizing
capability are used.
10. During or after exposure to the test substance, the cells are grown for a period sufficient to allow
chromosome or spindle damage to lead to the formation of micronuclei in interphase cells. For induction
of aneuploidy, the test substance should ordinarily be present during mitosis. Harvested and stained
interphase cells are analysed for the presence of micronuclei. Ideally, micronuclei should only be scored
in those cells that have completed mitosis during exposure to the test substance or during the post-
exposure period, if one is used. In cultures that have been treated with a cytokinesis blocker, this is
achieved by scoring only binucleated cells. In the absence of a cytokinesis blocker, it is important to
demonstrate that the cells analysed are likely to have undergone cell division during or after exposure to
the test substance. For all protocols, it is important to demonstrate that cell proliferation has occurred in
both the control and treated cultures, and the extent of test substance-induced cytotoxicity or cytostasis
should be assessed in the cultures (or in parallel cultures) that are scored for micronuclei.
DESCRIPTION OF THE METHOD
Preparations
11. Cultured primary human peripheral blood lymphocytes (5) (19) (42) (43) and a number of rodent
cell lines such as CHO, V79, CHL/IU, and L5178Y cells or human cell lines such as TK6 may be used
(18) (19) (20) (21) (22) (25) (26) (27) (28) (30) (35) ) (B2) (B3) (B4) (see §5.). The use of other cell

OECD/OCDE 487
3 © OECD, (2010)
lines and types should be justified based on their demonstrated performance in the assay, as described in
the Acceptability Criteria section. Because the background frequency of micronuclei will influence the
sensitivity of the assay, it is recommended that cell types with a low, stable background frequency of
micronucleus formation and a stable karyotype be used.
12. Human peripheral blood lymphocytes should be obtained from young (approximately 18-35
years of age), healthy, non-smoking individuals with no known recent exposures to genotoxic chemicals
or radiation. [If cells from more than one donor are pooled for use, the number of donors should be
specified. The micronucleus frequency increases with age and this trend is more marked in females than
in males (44) and this should be taken into account in the selection of donor cells for pooling]
[Alternative: It should be considered in the selection of donor cells for pooling that the baseline
incidence of micronucleus frequencies increases with age and that this trend is more marked in females
than in males (44)]. Cell cultures are maintained in an exponential cell growth and no more
synchronized during exposure to the test substance.
Media and culture conditions
13. Appropriate culture medium and incubation conditions (culture vessels, CO2 concentration,
temperature, and humidity) should be used for maintaining cultures. Cell lines should be checked
routinely for the stability of the modal chromosome number and the absence of Mycoplasma
contamination, and should not be used if contaminated or if the modal chromosome number has
changed. The normal cell cycle time for the culture conditions used in the testing laboratory should be
established and appropriate to the cell line. If the cytokinesis-block method is used then the
concentration of the cytokinesis inhibitor should be optimised for the particular cell type and should be
shown to produce a good yield of binucleate cells for scoring.
Preparation of cultures
14. Cell lines: cells are propagated from stock cultures, seeded in culture medium at a density such
that the cultures will not reach confluency in monolayers, and suspension cultures will not reach
excessive density before the time of harvest, and incubated at 37°C.
15. Lymphocytes: whole blood treated with an anti-coagulant (e.g. heparin), or separated
lymphocytes, are cultured at 37°C in the presence of a mitogen e.g. phytohaemagglutinin (PHA) prior to
exposure to the test substance and cytoB.
Metabolic activation
16. Exogenous metabolising systems should be used when employing cells with inadequate
endogenous metabolic capacity. The most commonly used system is a co-factor-supplemented post-
mitochondrial fraction (S9) prepared from the livers of rodents treated with enzyme-inducing agents
such as Aroclor 1254 (45) (46) or a combination of phenobarbitone and -naphthoflavone (46) (47) (48)
(49). The latter combination does not conflict with the Stockholm Convention on Persistent Organic
Pollutants (50) and has been shown to be as effective as Aroclor 1254 for inducing mixed-function
oxidases (46) (47) (48) (49). The S9 fraction typically is used at concentrations ranging from 1-10%
(v/v) in the final test medium. The choice of type and concentration of exogenous metabolic activation
system or metabolic inducer employed may be influenced by the class of chemical being tested. For a
more detailed discussion on this, please see Section 4.1.4 of the Introduction chapter.

487 OECD/OCDE
© OCDE, (2010) 4
Test substance preparation
17. Solid test substances should be dissolved in appropriate solvents or vehicles and diluted, if
appropriate, prior to treatment of the cells. Where this is not possible with compatible solvents,
suspensions may need to be used. Liquid test substances may be added directly to the test systems and/or
diluted prior to treatment. Gases or volatile substances should be tested by appropriate modifications to
the standard protocols, such as treatment in sealed vessels (52) (53). Fresh preparations of the test
substance should be used unless stability data demonstrate the acceptability of storage.
Test Conditions
Solvents/vehicles
18. The solvent/vehicle should be chosen to optimize the solubility of the test agent without
adversely impacting the assay conduct, i.e., cell growth, integrity of the test material, reaction with
culture vessels, metabolic activation system, etc. (B8). It is recommended that, wherever possible, the
use of an aqueous solvent should be considered first. Well established solvent/vehicles are for example
water, cell culture medium, dimethyl sulfoxide. Generally organic solvents should not exceed 1% (v/v)
and aqueous solvents should not exceed 10% (v/v) in the final treatment medium. If other than well
established solvents are used, their use should be supported by data indicating their compatibility with
the test substance and their lack of genetic toxicity. In the absence of that supporting data, it is important
to include untreated controls (see Glossary) to demonstrate that no deleterious or mutagenic effects are
induced by the chosen solvent.
Use of cytoB as a cytokinesis blocker
19. One of the most important considerations in the performance of the MNvit assay is ensuring that
the cells being scored have completed mitosis during the treatment or the post-treatment incubation
period, if one is used. CytoB is the agent that has been most widely used to block cytokinesis because it
inhibits actin assembly, and thus prevents separation of daughter cells after mitosis, leading to the
formation of binucleated cells (5) (54) (55). Micronucleus scoring, therefore, can be limited to cells that
have gone through mitosis during or after treatment. The effect of the test substance on cell proliferation
kinetics can be measured simultaneously. CytoB should be used of as a cytokinesis blocker when human
lymphocytes are used because cell cycle times will be variable within cultures and among donors and
because not all lymphocytes will respond to PHA. Other methods have been used when testing cell lines
to determine if the cells being scored have divided; these are addressed below (see Paragraph 25).
20. The appropriate concentration of cytoB should be determined by the laboratory for each cell type
to achieve the optimal frequency of binucleated cells in the solvent/vehicle control cultures. The
appropriate concentration of cytoB is usually between 3 and 6 g/ml.
Measuring cell proliferation and cytotoxicity and choosing exposure concentrations
21. When determining the highest test substance concentration to be tested, concentrations that have
the capability of producing artifactual positive responses, such as those producing excessive cytotoxicity
(see Paragraph 27), precipitation in the culture medium (see Paragraph 28), and marked changes in pH
or osmolality (see Paragraph 7), should be avoided. If the test chemical causes a marked change in the
pH of the medium at the time of addition, the pH might be adjusted by buffering the final treatment
medium so as to avoid artifactual positive results and to maintain good cell growth.

OECD/OCDE 487
5 © OECD, (2010)
22. Measurements of cell proliferation are made to assure that the treated cells have undergone
mitosis during the assay and that the treatments are conducted at appropriate levels of cytotoxicity (see
Paragraph 28). Cytotoxicity should be determined with and without metabolic activation in cells that do
not require metabolic activation using the relative increase in cell counts (RICC) or relative population
doubling (RPD) (see Annex 2 for formulas) unless cytoB is used (B2). When cytoB is used, cytotoxicity
can be determined using the replication index (RI) (see Annex 2 for formula).
23. Treatment of cultures with cytoB, and measurement of the relative frequencies of mononucleate,
binucleate, and multi-nucleate cells in the culture, provides an accurate method of quantifying the effect
on cell proliferation and the cytotoxic or cytostatic activity of a treatment (5), and ensures that only cells
that divided during or after treatment are scored.
24. In studies with cytoB, cytostasis/cytotoxicity can be quantified from the cytokinesis-block
proliferation index (CBPI) (5) (26) (56) or may be derived from the RI from at least 500 cells per culture
(see Annex 2 for formulas). When cytoB is used to assess cell proliferation, a CBPI or RI should be
determined from at least 500 cells per culture. These measurements among others can be used to
estimate cytotoxicity by comparing values in the treated and control cultures. Assessment of other
indicators of cytotoxicity (e.g. confluency, cell number, apoptosis, necrosis, metaphase counting) can
also provide useful information for assessing cytotoxicity.
25. In studies without cytoB, it is necessary to demonstrate that the cells scored in the culture have
undergone division during or following treatment with the test substance, otherwise false negative
responses may be produced. Methods that have been used for ensuring that divided cells are being
scored include incorporation and subsequent detection of bromodeoxyuridine (BrdU) to identify cells
that have replicated (57), the formation of clones when cells from permanent cell lines are treated and
scored in situ on a microscope slide (Proliferation Index (PI)) (25) (26) (27) (28), or the measurement of
Relative Population Doubling (RPD) or Relative Increase in Cell Count (RICC) or other proven methods
(16) (56) (58) (59) (see Annex 2 for formulas). At late sampling times (e.g. option B treatment for 1.5-2
normal cell cycles and harvest after an additional 1.5-2 normal cell cycles, i.e. 3-4 normal cell cycles in
total), RPD might underestimate cytotoxicity (B7). Under these circumstances RICC could be a better
measure. Alternatively, the evaluation of cytotoxicity after a 1.5-2 normal cell cycles would be a helpful
estimate. Assessment of other markers for cytotoxicity or cytostasis (e.g. confluency, cell number,
apoptosis, necrosis, metaphase counting) can also provide useful information for assessing cytotoxicity.
26. At least three analysable test concentrations from duplicate cultures should be evaluated. For
substances demonstrating little or no toxicity, concentration intervals of approximately 2 to 3 fold will
usually be appropriate. However, many substances exhibit steep concentration response curves and in
order to obtain data at low and moderate toxicity, it will be necessary to use more closely spaced
concentrations. When it is desirable to study the dose response relationship in detail, more than three
concentrations will be needed. In these cases a larger number of concentrations (single cultures or
duplicates) will be necessary. If single cultures are used then the negative control should be in duplicate.
Where cytotoxicity occurs, the test concentrations selected should cover a range from that producing
cytotoxicity as described in paragraph 27 and including concentrations at which there is moderate and
little or no cytotoxicity.
27. If the maximum concentration is based on cytotoxicity, the highest concentration should aim to
produce 55 ± 5% cytotoxicity. Care should be taken not to markedly exceed 50% cytotoxicity because
higher levels may induce chromosome damage as a secondary effect of cytotoxicity (60).
28. For poorly soluble compounds that are not cytotoxic at concentrations lower than the lowest
insoluble concentration, the highest concentration should produce turbidity or a precipitate visible by

487 OECD/OCDE
© OCDE, (2010) 6
eye or with the aid of an inverted microscope at the end of the treatment. Even if cytotoxicity occurs
above the lowest insoluble concentration, it is advisable to test at only one concentration inducing
turbidity or with visible precipitate because artifactual effects may result from the precipitate. For
suspension cultures, care should be taken to assure that the precipitate does not interfere with the
conduct of the assay (e.g. staining or scoring).
29. If no cytotoxicity or precipitate is observed, the highest test concentration should correspond to
[0.01 M, 5 mg/mL or 5 l/mL, whichever is the lowest]. For mixtures (no one component is more than
50% of the total by weight or volume), the top concentration should be 5 mg/ml. In some circumstances,
for mixtures, higher concentrations might be advisable.
Controls
30. Concurrent negative vehicle controls should be included in each experiment conducted either
with or without metabolic.
31. Positive controls are needed to demonstrate the ability of the cells used, and the test protocol,
to identify clastogens and aneugens under the conditions of the test protocol used. A mutagen that
requires metabolic activation (see table in annex) should be used to affirm the metabolic capability of
the metabolic activation system preparation
32. Positive controls should be used at concentrations expected to give a reproducible and
detectable increase over background which demonstrates the sensitivity of the test system i.e. the effects
are clear but do not immediately reveal the identity of the coded slides to the reader. Because in vitro
mammalian cell tests for genetic toxicity are sufficiently standardized the use of positive controls may
be confined to a chemical requiring metabolic activation (provided it is done concurrently with the non-
activated test using the same treatment duration) to demonstrate the activity of the metabolic activation
system and the responsiveness of the test system.
33. At the present time, no aneugens are known that require metabolic activation for their
genotoxic activity (16). Currently accepted positive controls for aneugenic activity are, for example,
colchicine and vinblastine. Other substances may be used if they induce micronuclei solely, or primarily,
through aneugenic activity. To avoid the need for two positive controls (for clastogenicity and
aneugenicity) without metabolic activation, the aneugenicity control can serve as the positive control
without S9, and the clastogenicity control can be used to test the adequacy of the metabolic activation
system used. Positive controls for both clastogenicity and aneugenicity should be used in cells that do
not require S9. Suggested positive control chemicals are included in Annex 3.
PROCEDURE
Treatment Schedule
34. In order to maximise the probability of detecting an aneugen or clastogen acting at a specific
stage in the cell cycle, it is important that sufficient numbers of cells are treated with the test substance
during all stages of their cell cycles. The treatment schedule for cell lines and primary cell cultures may,
therefore, differ somewhat from that for lymphocytes which require mitogenic stimulation to begin their
cell cycle and these are considered in Paragraphs 38-40 (16).
35. Theoretical considerations, together with published data (18) indicate that most aneugens and
clastogens will be detected by a short term treatment period of 3 to 6 hrs in the presence and absence of
OECD/OCDE 487
7 © OECD, (2010)
S9, followed by removal of the test substance and a growth period of 1.5 – 2.0 cell cycles (6). Cells are
sampled at a time equivalent to about 1.5 – 2.0 times the normal (i.e. untreated) cell cycle length either
after the beginning or at the end of treatment (See Table 1). Sampling or recovery times may be
extended if it is known or suspected that the test substance affects the cell cycling time (e.g. when
testing nucleoside analogues).
36. Because of the potential cytotoxicity of S9 preparations for cultured mammalian cells, an
extended exposure treatment of 1.5 – 2.0 normal cell cycles is used only in the absence of S9. In the
extended treatment, options are offered to allow treatment of the cells with the test chemical in the
absence or presence of cytoB. These options address situations where there may be concern regarding
possible interactions between the test substance and cytoB.
37. The suggested cell treatment schedules are presented in Table 1. These general treatment
schedules may be modified depending on the stability or reactivity of the test substance or the particular
growth characteristics of the cells being used. All treatments should commence and end while the cells
are growing exponentially. These schedules are presented in more details in paragraphs 38-44 following.
Table 1. Cell treatment and harvest times for the MNvit assay
Lymphocytes, primary cells
and cell lines treated with
cytoB
+ S9 Treat for 3-6 hrs in the presence of S9;
remove the S9 and treatment medium;
add fresh medium and cytoB;
harvest 1.5 – 2.0 normal cell cycles later.
– S9
Short
exposure
Treat for 3-6 hrs;
remove the treatment medium;
add fresh medium and cytoB;
harvest 1.5 – 2.0 normal cell cycles later.
– S9
Extended
exposure
Option A: Treat for 1.5 – 2 normal cell cycles in the presence
of cytoB;
harvest at the end of the exposure period.
Option B: Treat for 1.5 – 2.0 normal cell cycles;
remove the test substance;
add fresh medium and cytoB;
harvest 1.5 – 2.0 normal cell cycles later.
Cell lines treated without cytoB
(Identical to the treatment schedules outlined above with the exception that no cytoB is added)
Lymphocytes, primary cells, and cell lines with cytoB
38. For lymphocytes, the most efficient approach is to start the exposure to the test substance at
44-48 hrs after PHA stimulation, when cycle synchronisation will have disappeared (5). In the initial
assay, cells are treated for 3 to 6 hrs with the test substance in the absence and presence of S9. The
487 OECD/OCDE
© OCDE, (2010) 8
treatment medium is removed and replaced with fresh medium containing cytoB, and the cells are
harvested 1.5 – 2.0 normal cell cycles later.
39. If both initial tests of the short (3-6 hrs) treatment are negative or equivocal, a subsequent,
extended exposure treatment without S9 is used. Two treatment options are available and are equally
acceptable. However, It might be more appropriate to follow Option A for stimulated lymphocytes
where exponential growth may be declining at 96 hrs following stimulation. Also, cultures of cells
should not have reached confluence by the final sampling time in Option B.
Option A: The cells are treated with the test substance for 1.5 – 2.0 normal cell cycles, and
harvested at the end of the treatment time.
Option B: The cells are treated with the test substance for 1.5 – 2.0 normal cell cycles. The
treatment medium is removed and replaced with fresh medium, and the cells are harvested after
additional 1.5 - 2.0 normal cell cycles.
40. Primary cells and cell lines should be treated in a similar manner to lymphocytes except that it
is not necessary to stimulate them with PHA for 44-48 hrs. Cells other than lymphocytes should be
exposed such that at the time of study termination, the cells are still in log-phase growth.
Cell lines without cytoB
41. Cells should be treated for 3-6 hrs in the presence and absence of S9. The treatment medium is
removed and replaced with fresh medium, and the cells are harvested 1.5 – 2.0 normal cell cycles later.
42. If both initial tests of the short (3-6 hrs) treatment are negative or equivocal, a subsequent,
extended exposure treatment (without S9) is used. Two treatment options are available, both of which
are equally acceptable:
Option A: The cells are treated with the test substance for 1.5 – 2.0 normal cell cycles, and
harvested at the end of the treatment time.
Option B: The cells are treated with the test substance for 1.5 – 2.0 normal cell cycles. The
treatment medium is removed and replaced with fresh medium, and the cells are harvested after
additional 1.5 - 2.0 normal cell cycles.
43. In monolayers, mitotic cells (identifiable as being round and detaching from the surface) may
be present at the end of the 3-6 hr treatment. Because these mitotic cells are easily detached, they can be
lost when the medium containing the test substance is removed. Care should be taken to collect these
when cultures are washed, and to return them to the cultures, to avoid losing cells that are in mitosis, and
at risk for micronuclei, at the time of harvest.
Number of cultures
44. Duplicate cultures should normally be used for each test substance concentration and for the
negative (vehicle or untreated) control cultures. Where single cultures are used, e.g. for study of the
shape of the dose response relationship (see § on number of test concentrations), an increased number of
concentrations has to be analysed but negative controls should be done in duplicate.
OECD/OCDE 487
9 © OECD, (2010)
Cell harvest and slide preparation
45. Each culture is harvested and processed separately. Cell preparation may involve hypotonic
treatment, but this step is not necessary if adequate cell spreading is otherwise achieved. Different
techniques can be used in slide preparation provided that high-quality cell preparations for scoring are
obtained. Cell cytoplasm should be retained to allow the detection of micronuclei and (in the
cytokinesis-block method) reliable identification of binucleate cells.
46. The slides can be stained using various methods, such as Giemsa or fluorescent DNA specific
dyes (59). The use of a DNA specific stain (e.g. acridine orange (61) or Hoechst 33258 plus pyronin-Y
(62)) can eliminate some of the artifacts associated with using a non-DNA specific stain. Anti-
kinetochore antibodies, FISH with pancentromeric DNA probes, or primed in situ labelling with
pancentromere-specific primers, together with appropriate DNA counterstaining, can be used to identify
the contents (chromosome fragment) of micronuclei if mechanistic information of their formation is of
interest (15)(16). Other methods for differentiation between clastogens and aneugens may be used if
they have been shown to be effective.
Analysis
47. All slides, including those of the solvent/vehicle and the controls, should be independently
coded before the microscopic analysis. Alternatively, coded samples can be analysed using a validated,
automated flow cytometric or image analysis system.
48. In cytoB-treated cultures, micronucleus frequencies should be analysed in at least 2000
binucleated cells per concentration (at least 1000 binucleated cells per culture; two cultures per
concentration). If single cultures are used, at least 2000 binucleated cells per concentration should be
scored from that culture. If substantially fewer than 1000 binucleate cells per culture, or 2000 if a single
culture is used, are available for scoring at each concentration, and if a significant increase in
micronuclei is not detected, the test should be repeated using more cells, or at less toxic concentrations,
whichever is appropriate. Care should be taken not to score binucleate cells with irregular shapes or
where the two nuclei differ greatly in size; neither should binucleate cells be confused with poorly
spread multi-nucleate cells. Cells containing more than two main nuclei should not be analysed for
micronuclei, as the baseline micronucleus frequency may be higher in these cells (63) (64) Scoring of
mononucleate cells is acceptable if the test substance is shown to interfere with cytoB activity.
49. In cell lines assayed without cytoB treatment, micronuclei should be scored in at least 2000
cells per concentration (at least 1000 cells per culture; two cultures per concentration). Where only one
culture per concentration is used, at least 2000 cells should be scored from that culture.
50. When cytoB is used, a CBPI or an RI should be determined to assess cell proliferation (see
Annex 2) using at least 500 cells per culture. When treatments are performed in the absence of cytoB, it
is essential to provide evidence that the cells being scored have proliferated, as discussed in Paragraphs
23-26.
Proficiency of the laboratory
51. In order to demonstrate proficiency, the laboratory should perform a series of experiments with
reference positive chemicals acting via different mechanisms (Annex 2) and various solvents. These
positive and negative control responses should be consistent with the published literature. During the
course of these investigations, the laboratory should establish:

487 OECD/OCDE
© OCDE, (2010) 10
- A historical positive control range and distribution
- A historical negative (untreated, vehicle) control range and distribution
Re-evaluation of laboratory proficiency is recommended if major changes to the experimental conditions
(e.g. use of automated instead of manual scoring techniques; use of a new cell type) are proposed for the
assay.
DATA AND REPORTING
Treatment of results
52. If the cytokinesis-block technique is used, only the frequencies of binucleate cells with
micronuclei (independent of the number of micronuclei per cell) are used in the evaluation of
micronucleus induction. Scoring of the numbers of cells with one, two, or more micronuclei could
provide useful information, but is not mandatory.
53. Concurrent measures of cytotoxicity and/or cytostasis for all treated and solvent/vehicle
control cultures should be determined (58). The CBPI or the RI should be calculated for all treated and
control cultures as measurements of cell cycle delay when the cytokinesis-block method is used. In the
absence of cytoB, the RPD or the RICC or PI should be used (see Annex 2).
54. Individual culture data should be provided. Additionally, all data should be summarised in
tabular form.
55. Chemicals that induce micronuclei in the MNvit assay may do so because they induce
chromosome breakage, chromosome loss, or a combination of the two. Further analysis using anti-
kinetochore antibodies, centromere specific in situ probes, or other methods may be used to determine
whether the mechanism of micronucleus induction is due to clastogenic and/or aneugenic activity.
Evaluation and interpretation of results
[this section needs to be further discussed by the Expert group]
56. There is no requirement for verification by additional testing of a clear positive or negative
response. Equivocal results may be clarified by analysis of another 1000 cells from all the cultures to
avoid loss of blinding. If this approach does not resolve the result, further testing should be performed.
Modification of study parameters over an extended or narrowed range of conditions, as appropriate,
should be considered in follow-up experiments. Study parameters that might be modified include the test
concentration spacing, the timing of treatment and cell harvest, and/or the metabolic activation
conditions.
57. Although there are several criteria for a positive result, biological relevance of the results should
be considered first. Appropriate statistical methods may be used as an aid in evaluating the test results.
However, the results of statistical testing should be assessed with respect to dose-response relationship
and a statistically significant increase alone is not sufficient for the determination of a positive result. A
result can be considered clearly biologically relevant if the following criteria are all satisfied:
(1) the increase is dose-related,
(2) at least one of the measure points is statistically significant higher than the concurrent negative
control,
OECD/OCDE 487
11 © OECD, (2010)
(3) the positive result is reproducible (e.g. between duplicates or between independent
experiments),
(4) the positive result is outside the range of the historical negative control data.
The positive and negative controls are within the historical positive range for the test within the laboratory.
58. Although most experiments will give clearly positive or negative results, in some cases the
data set will preclude making a definite judgement about the activity of the test substance. These
equivocal or questionable responses may occur regardless of the number of times the experiment is
repeated.
59. Positive results from the MNvit assay indicate that the test substance induces chromosome
breakage loss, in cultured mammalian cells. Negative results indicate that, under the test conditions
used, the test substance does not induce chromosome breaks and/or gain or loss in cultured mammalian
cells.
Test Report
60. The test report should include the following information:
Test substance:
- identification data and Chemical Abstract Services Registry Number (CASRN);
- physical nature and purity;
- physico-chemical properties relevant to the conduct of the study;
- reactivity of the test substance with the solvent/vehicle or cell culture media;
Solvent/Vehicle:
- justification for choice of solvent/vehicle;
- solubility and stability of the test substance in solvent/vehicle;
Cells:
- type and source of cells used;
- suitability of the cell type used;
- absence of mycoplasma, if applicable;
- for cell lines, information on cell cycle length, doubling time or proliferation index;
- where lymphocytes are used, sex, age and number of blood donors, if applicable;
- where lymphocytes are used, whether whole blood or separated lymphocytes are exposed;
- number of passages, if applicable;
- methods for maintenance of cell cultures, if applicable;
- modal number of chromosomes;
- normal (negative control) cell cycle time;
Test Conditions:
- identity of cytokinesis blocking substance (e.g. cytoB), if used, and its concentration and
duration of cell exposure;
- rationale for selection of concentrations and number of cultures, including cytotoxicity data
and solubility limitations, if available;
- composition of media, CO2 concentration, if applicable;

487 OECD/OCDE
© OCDE, (2010) 12
- concentrations of test substance;
- concentration (and/or volume) of vehicle and test substance added;
- incubation temperature and time;
- duration of treatment;
- harvest time after treatment;
- cell density at seeding, if applicable;
- type and composition of metabolic activation system, including acceptability criteria;
- positive and negative controls;
- methods of slide preparation and staining technique used;
- criteria for micronucleus identification;
- numbers of cells analysed;
- methods for the measurements of cytotoxicity;
- any supplementary information relevant to cytotoxicity;
- criteria for considering studies as positive, negative, or equivocal;
- method(s) of statistical analysis used;
- methods, such as use of kinetochore antibody, to characterise whether micronuclei contain
whole or fragmented chromosomes, if applicable;
Results (individual data):
- the number of cells plated (or treated) and the number of cells harvested for each culture;
- measurement of cytotoxicity used, e.g. CBPI or RI in the case of cytokinesis-block method;
RICC, RPD or PI when cytokinesis-block methods are not used; other observations when
applicable, e.g. cell confluency, apoptosis, necrosis, metaphase counting, frequency of
binucleated cells;
- signs of precipitation;
- data on pH and osmolality of the treatment medium, if determined;
- definition of acceptable cells for analysis;
- distribution of mono-, bi-, and multi-nucleated cells if a cytokinesis block method is used;
- number of cells with micronuclei given separately for each treated and control culture, and
defining whether from binucleate or mononucleate cells, where appropriate;
- concentration-response relationship, where possible;
- concurrent negative (solvent/vehicle) and positive control data (concentrations and
solvents);
- historical negative (solvent/vehicle) and positive control data, with ranges, means and
standard deviation and confidence interval (e.g. 95%);
- statistical analysis; p-values if any;
Discussion of the results:
Conclusions.

OECD/OCDE 487
13 © OECD, (2010)
LITERATURE
(1) Kirsch-Volders, M. (1997), Towards a validation of the micronucleus test. Mutation Res., 392, 1-
4.
(2) Parry, J.M. and Sors, A. (1993), The detection and assessment of the aneugenic potential of
environmental chemicals: the European Community aneuploidy project, Mutation Res., 287, 3-15.
(3) Fenech, M. and Morley, A.A. (1985), Solutions to the kinetic problem in the micronucleus assay,
Cytobios., 43, 233-246.
(4) Kirsch-Volders, M., Sofuni, T., Aardema, M., Albertini, S., Eastmond, D., Fenech, M., Ishidate,
M. Jr, Lorge, E., Norppa, H., Surralles, J., von der Hude, W. and Wakata, A. (2000), Report from the In
Vitro Micronucleus Assay Working Group, Environ. Mol. Mutagen., 35, 167-172.
(5) Fenech, M. (2007), Cytokinesis-block micronucleus cytome assay, Nature Protocols, 2(5), 1084-
1104.
(6) Fenech, M. and Morley, A.A. (1986), Cytokinesis-block micronucleus method in human
lymphocytes: effect of in-vivo ageing and low dose X-irradiation, Mutation Res., 161, 193-198.
(7) Eastmond, D.A. and Tucker, J.D. (1989), Identification of aneuploidy-inducing agents using
cytokinesis-blocked human lymphocytes and an antikinetochore antibody, Environ. Mol. Mutagen., 13, 34-
43.
(8) Eastmond, D.A. and Pinkel, D. (1990), Detection of aneuploidy and aneuploidy-inducing agents
in human lymphocytes using fluorescence in-situ hybridisation with chromosome-specific DNA probes,
Mutation Res., 234, 9-20.
(9) Miller, B.M., Zitzelsberger, H.F., Weier, H.U. and Adler, I.D. (1991), Classification of
micronuclei in murine erythrocytes: immunofluorescent staining using CREST antibodies compared to in
situ hybridization with biotinylated gamma satellite DNA, Mutagenesis, 6, 297-302.
(10) Farooqi, Z., Darroudi, F. and Natarajan, A.T. (1993), The use of fluorescence in-situ
hybridisation for the detection of aneugens in cytokinesis-blocked mouse splenocytes, Mutagenesis, 8,
329-334.
(11) Migliore, L., Bocciardi, R., Macri, C. and Lo Jacono, F. (1993), Cytogenetic damage induced in
human lymphocytes by four vanadium compounds and micronucleus analysis by fluorescence in situ
hybridization with a centromeric probe, Mutation Res., 319, 205-213.
(12) Norppa, H., Renzi, L. and Lindholm, C. (1993), Detection of whole chromosomes in micronuclei
of cytokinesis-blocked human lymphocytes by antikinetochore staining and in situ hybridization,
Mutagenesis, 8, 519-525.
(13) Eastmond, D.A, Rupa, D.S. and Hasegawa, L.S. (1994), Detection of hyperdiploidy and
chromosome breakage in interphase human lymphocytes following exposure to the benzene metabolite

487 OECD/OCDE
© OCDE, (2010) 14
hydroquinone using multicolor fluorescence in situ hybridization with DNA probes, Mutation Res., 322, 9-
20.
(14) Marshall, R.R., Murphy, M., Kirkland, D.J. and Bentley, K.S. (1996), Fluorescence in situ
hybridisation (FISH) with chromosome-specific centromeric probes: a sensitive method to detect
aneuploidy, Mutation Res., 372, 233-245.
(15) Zijno, P., Leopardi, F., Marcon, R. and Crebelli, R. (1996), Analysis of chromosome segregation
by means of fluorescence in situ hybridization: application to cytokinesis-blocked human lymphocytes,
Mutation Res., 372, 211-219.
(16) Kirsch-Volders, M., Sofuni, T., Aardema, M., Albertini, S., Eastmond, D., Fenech, M., Ishidate
Jr., M., Lorge, E., Norppa, H., Surrallés, J., von der Hude, W. and Wakata, A. (2003), Report from the in
vitro micronucleus assay working group. Mutation Res., 540, 153-163.
(17) OECD (1997), In Vitro Mammalian Chromosome Aberration Test, Test Guideline No. 473,
OECD Guidelines for Testing of Chemicals, OECD, Paris. Available at:
[www.oecd.org/env/testguidelines]
(18) Lorge, E., Thybaud, V., Aardema, M.J., Oliver, J., Wakata, A., Lorenzon G. and Marzin, D.
(2006), SFTG International collaborative Study on in vitro micronucleus test. I. General conditions and
overall conclusions of the study, Mutation Res., 607, 13-36.
(19) Clare, G., Lorenzon, G., Akhurst, L.C., Marzin, D., van Delft, J., Montero, R., Botta, A., Bertens,
A., Cinelli, S., Thybaud, V. and Lorge, E. (2006), SFTG International collaborative study on the in vitro
micronucleus test. II. Using human lymphocytes, Mutation Res., 607, 37-60.
(20) Aardema, M.J., Snyder, R.D., Spicer, C., Divi, K., Morita, T., Mauthe, R.J., Gibson, D.P.,
Soelter, S., Curry, P.T., Thybaud, V., Lorenzon, G., Marzin, D. and Lorge, E. (2006), SFTG International
collaborative study on the in vitro micronucleus test, III. Using CHO cells, Mutation Res., 607, 61-87.
(21) Wakata, A., Matsuoka, A., Yamakage, K., Yoshida, J., Kubo, K., Kobayashi, K., Senjyu, N.,
Itoh, S., Miyajima, H., Hamada, S., Nishida, S., Araki, H., Yamamura, E., Matsui, A., Thybaud, V.,
Lorenzon, G., Marzin, D. and Lorge, E. (2006), SFTG International collaborative study on the in vitro
micronucleus test, IV. Using CHO/IU cells, Mutation Res., 607, 88-124.
(22) Oliver, J., Meunier, J.-R., Awogi, T., Elhajouji, A., Ouldelhkim, M.-C., Bichet, N., Thybaud, V.,
Lorenzon, G., Marzin, D. and Lorge, E. (2006), SFTG International collaborative study on the in vitro
micronucleus test, V. Using L5178Y cells, Mutation Res., 607, 125-152.
(23) Albertini, S., Miller, B., Chetelat, A.A. and Locher, F. (1997), Detailed data on in vitro MNT and
in vitro CA: industrial experience, Mutation Res., 392, 187-208.
(24) Miller, B., Albertini, S., Locher, F., Thybaud, V. and Lorge, E. (1997), Comparative evaluation
of the in vitro micronucleus test and the in vitro chromosome aberration test: industrial experience,
Mutation Res., 392, 45-59.
(25) Miller, B., Potter-Locher, F., Seelbach, A., Stopper, H., Utesch, D. and Madle, S. (1998),
Evaluation of the in vitro micronucleus test as an alternative to the in vitro chromosomal aberration assay:
position of the GUM Working Group on the in vitro micronucleus test. Gesellschaft fur Umwelt-
Mutations-forschung, Mutation Res., 410, 81-116.

OECD/OCDE 487
15 © OECD, (2010)
(26) Kalweit, S., Utesch, U., von der Hude, W. and Madle, S. (1999), Chemically induced
micronucleus formation in V79 cells – comparison of three different test approaches, Mutation Res. 439,
183-190.
(27) Kersten, B., Zhang, J., Brendler Schwaab, S.Y., Kasper, P. and Müller, L. (1999), The
application of the micronucleus test in Chinese hamster V79 cells to detect drug-induced
photogenotoxicity, Mutation Res. 445, 55-71.
(28) von der Hude, W., Kalweit, S., Engelhardt, G., McKiernan, S., Kasper, P., Slacik-Erben, R.,
Miltenburger, H.G., Honarvar, N., Fahrig, R., Gorlitz, B., Albertini, S., Kirchner, S., Utesch, D., Potter-
Locher, F., Stopper, H. and Madle, S. (2000), In vitro micronucleus assay with Chinese hamster V79 cells -
results of a collaborative study with in situ exposure to 26 chemical substances, Mutation Res., 468, 137-
163.
(29) Garriott, M.L., Phelps, J.B. and Hoffman, W.P. (2002), A protocol for the in vitro micronucleus
test, I. Contributions to the development of a protocol suitable for regulatory submissions from an
examination of 16 chemicals with different mechanisms of action and different levels of activity, Mutation
Res., 517, 123-134.
(30) Matsushima, T., Hayashi, M., Matsuoka, A., Ishidate, M. Jr., Miura, K.F., Shimizu, H., Suzuki,
Y., Morimoto, K., Ogura, H., Mure, K., Koshi, K. and Sofuni, T. (1999), Validation study of the in vitro
micronucleus test in a Chinese hamster lung cell line (CHL/IU), Mutagenesis, 14, 569-580.
(31) Elhajouji, A., and Lorge, E. (2006), Special Issue: SFTG International collaborative study on in
vitro micronucleus test, Mutation Res., 607, 1-152.
(32) ECVAM (2006), Statement by the European Centre for the Validation of Alternative Methods
(ECVAM) Scientific Advisory Committee (ESAC) on the scientific validity of the in vitro micronucleus
test as an alternative to the in vitro chromosome aberration assay for genotoxicity testing. ESAC 25th
meeting, 16-17 November, 2006, Available at: [http://ecvam.jrc.it/index.htm]
(33) ESAC (2006), ECVAM Scientific Advisory Committee (ESAC) Peer Review, Retrospective
Validation of the In Vitro Micronucleus Test, Summary and Conclusions of the Peer Review Panel,
Available at: [http://ecvam.jrc.it/index.htm]
(34) Corvi, R., Albertini, S., Hartung, T., Hoffmann, S., Maurici, D., Pfuhler, S, van Benthem, J.,
Vanparys P. (2008), ECVAM Retrospective Validation of in vitro Micronucleus Test (MNT),
Mutagenesis, 23, 271-283.
(35) Zhang, L.S., Honma, M., Hayashi, M., Suzuki, T., Matsuoka, A. and Sofuni, T. (1995), A
comparative study of TK6 human lymphoblastoid and L5178Y mouse lymphoma cell lines in the in vitro
micronucleus test, Mutation Res., 347, 105-115.
(36) Ehrlich, V., Darroudi, F., Uhl, M., Steinkellner, S., Zsivkovits, M. and Knasmeuller, S. (2002),
Fumonisin B1 is genotoxic in human derived hepatoma (HepG2) cells, Mutagenesis, 17, 257-260.
(37) Knasmüller, S., Mersch-Sundermann, V., Kevekordes, S., Darroudi, F., Huber, W.W., Hoelzl, C.,
Bichler, J. and Majer, B.J. (2004), Use of human-derived liver cell lines for the detection of environmental
and dietary genotoxicants; current state of knowledge, Toxicol., 198, 315-328. .

487 OECD/OCDE
© OCDE, (2010) 16
(38) Gibson, D.P., Brauninger, R., Shaffi, H.S., Kerckaert, G.A., LeBoeuf, R.A., Isfort, R.J. and
Aardema, M.J. (1997), Induction of micronuclei in Syrian hamster embryo cells: comparison to results in
the SHE cell transformation assay for National Toxicology Program test chemicals, Mutation Res., 392,
61-70.
(39) Scott, D., Galloway, S.M., Marshall, R.R., Ishidate, M. Jr., Brusick, D., Ashby, J. and Myhr, B.C.
(1991), International Commission for Protection Against Environmental Mutagens and Carcinogens,
Genotoxicity under extreme culture conditions. A report from ICPEMC Task Group 9, Mutation Res., 257,
147-205.
(40) Morita, T., Nagaki, T., Fukuda, I. and Okumura, K. (1992), Clastogenicity of low pH to various
cultured mammalian cells, Mutation Res., 268, 297-305.
(41) Brusick, D. (1986), Genotoxic effects in cultured mammalian cells produced by low pH treatment
conditions and increased ion concentrations, Environ. Mutagen., 8, 789-886.
(42) Fenech, M. and Morley, A.A. (1985), Measurement of micronuclei in lymphocytes, Mutation
Res., 147, 29-36.
(43) Fenech, M. (1997), The advantages and disadvantages of cytokinesis-blood micronucleus
method, Mutation Res., 392, 11-18.
(44) Bonassi, S., Fenech, M., Lando, C., Lin, Y.P., Ceppi, M., Chang, W.P., Holland, N., Kirsch-
Volders, M., Zeiger, E., Ban, S., Barale, R., Bigatti, M.P., Bolognesi, C., Jia, C., Di Giorgio, M., Ferguson,
L.R., Fucic, A., Lima, O.G., Hrelia, P., Krishnaja, A.P., Lee, T.K., Migliore, L., Mikhalevich, L., Mirkova,
E., Mosesso, P., Muller, W.U., Odagiri, Y., Scarffi, M.R., Szabova, E., Vorobtsova, I., Vral, A. and Zijno,
A. (2001), HUman MicroNucleus Project: international database comparison for results with the
cytokinesis-block micronucleus assay in human lymphocytes, I. Effect of laboratory protocol, scoring
criteria and host factors on the frequency of micronuclei, Environ. Mol. Mutagen. 37, 31-45.
(45) Maron, D.M. and Ames, B.N. (1983), Revised methods for the Salmonella mutagenicity test,
Mutation Res., 113, 173-215.
(46) Ong, T.-m., Mukhtar, M., Wolf, C.R. and Zeiger, E. (1980), Differential effects of cytochrome
P450-inducers on promutagen activation capabilities and enzymatic activities of S-9 from rat liver, J.
Environ. Pathol. Toxicol., 4, 55-65.
(47) Elliott, B.M., Combes, R.D., Elcombe, C.R., Gatehouse, D.G., Gibson, G.G., Mackay, J.M. and
Wolf, R.C. (1992), Alternatives to Aroclor 1254-induced S9 in in-vitro genotoxicity assays. Mutagenesis,
7, 175-177.
(48) Matsushima, T., Sawamura, M., Hara, K. and Sugimura, T. (1976), A safe substitute for
Polychlorinated Biphenyls as an Inducer of Metabolic Activation Systems, In: de Serres, F.J., Fouts, J. R.,
Bend, J.R. and Philpot, R.M. (eds), In Vitro Metabolic Activation in Mutagenesis Testing, Elsevier, North-
Holland, pp. 85-88.
(49) Johnson, T.E., Umbenhauer, D.R. and Galloway, S.M. (1996), Human liver S-9 metabolic
activation: proficiency in cytogenetic assays and comparison with phenobarbital/beta-naphthoflavone or
Aroclor 1254 induced rat S-9, Environ. Mol. Mutagen., 28, 51-59.
OECD/OCDE 487
17 © OECD, (2010)
(50) UNEP (2001), Stockholm Convention on Persistent Organic Pollutants, United Nations
Environment Programme (UNEP). Available at: [http://www.pops.int/]
(51) Doherty, A.T., Ellard, S., Parry, E.M. and Parry, J.M. (1996), An investigation into the activation
and deactivation of chlorinated hydrocarbons to genotoxins in metabolically competent human cells,
Mutagenesis, 11, 247-274.
(52) Krahn, D.F., Barsky, F.C. and McCooey, K.T. (1982), CHO/HGPRT Mutation Assay: Evaluation
of Gases and Volatile Liquids, In: Tice, R.R., Costa, D.L. and Schaich, K.M. (eds), Genotoxic Effects of
Airborne Agents. New York, Plenum, pp. 91-103.
(53) Zamora, P.O., Benson, J.M., Li, A.P. and Brooks, A.L. (1983), Evaluation of an exposure system
using cells grown on collagen gels for detecting highly volatile mutagens in the CHO/HGPRT mutation
assay, Environ. Mutagenesis 5, 795-801.
(54) Fenech, M. (1993), The cytokinesis-block micronucleus technique: a detailed description of the
method and its application to genotoxicity studies in human populations, Mutation Res., 285, 35-44.
(55) Phelps, J.B., Garriott, M.L., and Hoffman, W.P. (2002), A protocol for the in vitro micronucleus
test. II. Contributions to the validation of a protocol suitable for regulatory submissions from an
examination of 10 chemicals with different mechanisms of action and different levels of activity, Mutation
Res., 521, 103-112.
(56) Kirsch-Volders, M., Sofuni, T., Aardema, M., Albertini, S., Eastmond, D., Fenech, M., Ishidate,
M. Jr., Kirchner, S., Lorge, E., Morita, T., Norppa, H., Surralles, J., Vanhauwaert, A. and Wakata, A.
(2004), Corrigendum to "Report from the in vitro micronucleus assay working group", Mutation Res., 564,
97-100.
(57) Pincu, M., Bass, D. and Norman, A. (1984), An improved micronuclear assay in lymphocytes,
Mutation Res., 139, 61-65.
(58) Lorge, E., Hayashi, M., Albertini, S. and Kirkland, D. (2008), Comparison of different methods
for an accurate assessment of cytotoxicity in the in vitro micronucleus test. I. Theoretical aspects, Mutation
Res., 655, 1-3.
(59) Surralles, J., Xamena, N., Creus, A., Catalan, J., Norppa, H. and Marcos, R. (1995), Induction of
micronuclei by five pyrethroid insecticides in whole-blood and isolated human lymphocyte cultures,
Mutation Res., 341, 169-184.
(60) Galloway, S. (2000), Cytotoxicity and chromosome aberrations in vitro: Experience in industry
and the case for an upper limit on toxicity in the aberration assay, Environ. Molec. Mutagenesis 35, 191-
201.
(61) Hayashi, M., Sofuni, T., and Ishidate, M. Jr. (1983), An Application of Acridine Orange
Fluorescent Staining to the Micronucleus Test, Mutation Res., 120, 241-247.
(62) MacGregor, J. T., Wehr, C. M., and Langlois, R. G. (1983), A Simple Fluorescent Staining
Procedure for Micronuclei and RNA in Erythrocytes Using Hoechst 33258 and Pyronin Y, Mutation Res.,
120, 269-275.
487 OECD/OCDE
© OCDE, (2010) 18
(63) Hayashi, M., Sofuni, T. and Ishidate, M. Jr. (1983), An application of acridine orange fluorescent
staining to the micronucleus test, Mutation Res., 120, 241-247.
(64) Fenech, M., Chang, W.P., Kirsch-Volders, M., Holland, N., Bonassi, S. and Zeiger, E. (2003),
HUMN project: detailed description of the scoring criteria for the cytokinesis-block micronucleus assay
using isolated human lymphocyte cultures, Mutation Res., 534, 65-75.
(65) Hoffman, W.P., Garriott, M.L. and Lee, C. (2003), In vitro micronucleus test, In: Encyclopedia
of Biopharmaceutical Statistics, Second edition. S. Chow (ed.), Marcel Dekker, Inc. New York, NY, pp.
463-467.
(B1) M. Hayashi, K. Dearfield, P. Kasper, D. Lovell, HJ. Martus, V. Thybaud. Compilation and use of
genetic toxicity historical control Data Mutat.Res.:Genet.Toxicol. Environ.
Mutagen.(2010),doi:10.1016/j.mrgentox.2010.09.007.
(B2) Kirkland D. (2010), Evaluation of different cytotoxic and cytostatic measures for the in vitro
micronucleus test (MNVit): Introduction to the collaborative trial, Mutation Res., 702 (2) Special issue.
(B3) Hashimoto K., Nakajima Y., Matsamura S., Chatani F. (2011), Comparison of four different
treatment conditions of extended exposure in the in vitro micronucleus assay using TK6 lymphoblastoid
cells, Regul. Toxicol. Pharmacol., 59, 28-36.
(B4) Honma M. and Hayashi M. (2011), Comparison of in vitro micronucleus and gene mutation assay
results for p53-competent versus p53-deficient human lymphoblastoid cells, Environ. Mol. Mutagen., 52,
373-384.
(B5) Le Hegarat L., Dumont J., Josse R., Huet S., Lanceleur R., Mourot A., Poul J.-M., Guguen-Guillouzo
C., Guillouzo A. and Fessard V. (2010), Assessment of the genotoxic potential of indirect chemical
mutagens in HepaRG cellsby the comet and the cytokinesis-block micronucleus assays, Mutagenesis, 25,
555-560.
(B6) Josse R., Rogue A., Lorge E., Guillouzo A. (2011), An adaptation of the human HepaRG cells to the
in vitro micronucleus assay, Mutagenesis, advanced access publication.
(B7) Honma M. (2011), Cytotoxicity measurement in in vitro chromosome aberration test and
micronucleus test, Mutation Res., 724, 86-87.
(B8) Kirkland D., Culture medium
(B9) Richardson, C., Williams, D.A., Allen, J.A., Amphlett, G., Chanter, D.O., and Phillips, B. (1989).
Analysis of Data from In Vitro Cytogenetic Assays. In: Statistical Evaluation of Mutagenicity Test Data.
Kirkland, D.J., (ed) Cambridge University Press, Cambridge, pp. 141-154.
Pfuhler S., Fellows M., van Benthem J., Corvi R., Curren R., Dearfield K., Fowler P., Frötschl R.,
Elhajouji A., Le Hégarat L., Kasamatsu T., Kojima H., Ouédraogo G., Scott A., Speit G. (2011), In vitro
genotoxicity test approaches with better predictivity: Summary of an IWGT workshop, Mutation Res., 723,
101-107..
OECD/OCDE 487
19 © OECD, (2010)
Annex 1
DEFINITIONS
Aneugen: any substance or process that, by interacting with the components of the mitotic and meiotic cell
division cycle, leads to aneuploidy in cells or organisms.
Aneuploidy: any deviation from the normal diploid (or haploid) number of chromosomes by a single
chromosome or more than one, but not by entire set(s) of chromosomes (polyploidy).
Apoptosis: programmed cell death characterized by a series of steps leading to a disintegration of cells
into membrane-bound particles that are then eliminated by phagocytosis or by shedding.
Cell proliferation: increase in cell number as a result of mitotic cell division.
Centromere: DNA region of a chromosome where both chromatids are held together and on which both
kinetochores are attached side-to-side.
Clastogen: any substance or process which causes structural chromosomal aberrations in populations of
cells or organisms.
Cytokinesis: the process of cell division immediately following mitosis to form two daughter cells, each
containing a single nucleus.
Cytokinesis-Block Proliferation index (CBPI): the proportion of second-division cells in the treated
population relative to the untreated control (see Annex 2 for formula).
Cytostasis: inhibition of cell growth (see Annex 2 for formula).
Cytotoxicity: harmful effects to cell structure or function ultimately causing cell death.
Genotoxic: a general term encompassing all types of DNA or chromosome damage, including breaks,
adducts rearrangements, mutations, chromosome aberrations, and aneuploidy. Not all types of genotoxic
effects result in mutations or stable chromosome damage.
Interphase cells: cells not in the mitotic stage.
Kinetochore: a protein-containing structure that assembles at the centromere of a chromosome to which
spindle fibres associate during cell division, allowing orderly movement of daughter chromosomes to the
poles of the daughter cells.
Micronuclei: small nuclei, separate from and additional to the main nuclei of cells, produced during
telophase of mitosis or meiosis by lagging chromosome fragments or whole chromosomes.
Mitosis: division of the cell nucleus usually divided into prophase, prometaphase, metaphase, anaphase
and telophase.
Mitotic index: the ratio of cells in metaphase divided by the total number of cells observed in a population
of cells; an indication of the degree of cell proliferation of that population.

487 OECD/OCDE
© OCDE, (2010) 20
Mutagenic: produces a heritable change of DNA base-pair sequences(s) in genes or of the structure of
chromosomes (chromosome aberrations).
Non-disjunction: failure of paired chromatids to disjoin and properly segregate to the developing daughter
cells, resulting in daughter cells with abnormal numbers of chromosomes.
Polyploidy: numerical chromosome aberrations in cells or organisms involving entire set(s) of
chromosomes, as opposed to an individual chromosome or chromosomes (aneuploidy).
Proliferation Index (PI): method for cytotoxicity measurement when cytoB is not used (see Annex 2 for
formula).
Relative Increase in Cell Count (RICC): method for cytotoxicity measurement when cytoB is not used
(see Annex 2 for formula).
Relative Population Doubling (RPD): method for cytotoxicity measurement when cytoB is not used (see
Annex 2 for formula).
Replication Index (RI): the proportion of cell division cycles completed in a treated culture, relative to
the untreated control, during the exposure period and recovery (see annex 2 for formula).
Solvent/vehicle:
Untreated control:

OECD/OCDE 487
21 © OECD, (2010)
Annex 2
FORMULAS FOR CYTOTOXICITY ASSESSMENT
1. When cytoB is used, evaluation of cytotoxicity should be based on the Cytokinesis-Block
Proliferation Index (CBPI) or Replicative Index (RI) (16) (58). The CBPI indicates the average number
of cell cycles per cell during the period of exposure to cytoB, and may be used to calculate cell
proliferation. The RI indicates the relative number of nuclei in treated cultures compared to control
cultures and can be used to calculate the % cytostasis:
% Cytostasis = 100-100{(CBPIT _ 1) ÷ (CBPIC
_ 1)}
And:
T = test chemical treatment culture
C = vehicle control culture
Where:
((No. mononucleate cells) + (2 × No. binucleate cells) + (3 × No. multinucleate cells))
CBPI = -------------------------------------------------------------------------------------------------------
(Total number of cells)
Thus, a CBPI of 1 (all cells are mononucleate) is equivalent to 100% cytostasis.
Cytostasis = 100-RI
((No. binucleated cells) + (2 × No. multinucleate cells)) ÷ (Total number of cells)T
RI = --------------------------------------------------------------------------------------------------- × 100
((No. binucleated cells) + (2 × No. multinucleate cells)) ÷ (Total number of cells)C
T= treated cultures
C= control cultures
2. Thus, an RI of 53% means that, compared to the numbers of cells that have divided to form
binucleate and multinucleate cells in the control culture, only 53% of this number divided in the treated
culture, i.e. 47% cytostasis.
3. When cytoB is not used, evaluation of cytotoxicity based on Relative Increase in Cell Counts
(RICC) or on Relative Population Doubling (RPD) is recommended (58), as both take into account the
proportion of the cell population which has divided.
(Increase in number of cells in treated cultures (final – starting))
RICC = --------------------------------------------------------------------------------- × 100
(Increase in number of cells in control cultures (final – starting))
(No. of Population doublings in treated cultures)
RPD = ----------------------------------------------------------------- × 100
(No. of Population doublings in control cultures)
487 OECD/OCDE
© OCDE, (2010) 22
where:
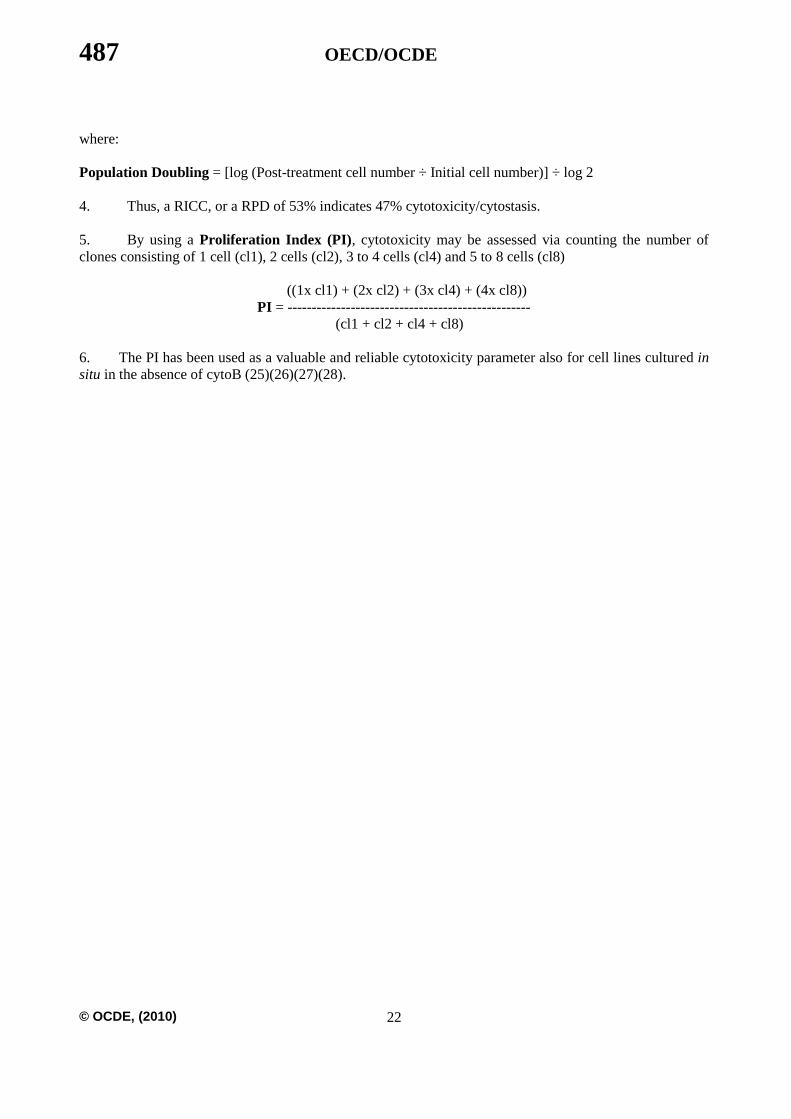
Population Doubling = [log (Post-treatment cell number ÷ Initial cell number)] ÷ log 2
4. Thus, a RICC, or a RPD of 53% indicates 47% cytotoxicity/cytostasis.
5. By using a Proliferation Index (PI), cytotoxicity may be assessed via counting the number of
clones consisting of 1 cell (cl1), 2 cells (cl2), 3 to 4 cells (cl4) and 5 to 8 cells (cl8)
((1x cl1) + (2x cl2) + (3x cl4) + (4x cl8))
PI = --------------------------------------------------
(cl1 + cl2 + cl4 + cl8)
6. The PI has been used as a valuable and reliable cytotoxicity parameter also for cell lines cultured in
situ in the absence of cytoB (25)(26)(27)(28).

OECD/OCDE 487
23 © OECD, (2010)
Annex 3
REFERENCE CHEMICALS RECOMMENDED FOR ASSESSING LABORATORY
PERFORMANCE AND FOR SELECTION OF POSITIVE CONTROLS
Category Chemical CASRN
1. Clastogens active without metabolic activation
Cytosine arabinoside 147-94-4
Mitomycin C 50-07-7
2. Clastogens requiring metabolic activation
Benzo(a)pyrene 50-32-8
Cyclophosphamide 50-18-0
3. Aneugens
Colchicine 64-86-8
Vinblastine 143-67-9
Positive control chemicals should be able to provide appropriate demonstration of metabolic activation and
detection of relevant endpoints or mechanisms covered by the test (clastogenicity and aneuploidy).