oecd economic surveys european union · this overview is extracted from the economic survey of the...
TRANSCRIPT

OECD Economic Surveys
European Union June 2018
OVERVIEW
http://www.oecd.org/eco/surveys/economic-survey-european-union-and-euro-area.htm
This Overview is extracted from the Economic Survey of the European Union. The Survey is
published on the responsibility of the Economic and Development Review Committee (EDRC) of
the OECD, which is charged with the examination of the economic situation of member countries.
This document and any map included herein are without prejudice to the status of or sovereignty
over any territory, to the delimitation of international frontiers and boundaries and to the name
of any territory, city or area.
OECD Economic Surveys: European Union© OECD 2018
You can copy, download or print OECD content for your own use, and you can include excerpts
from OECD publications, databases and multimedia products in your own documents,
presentations, blogs, websites and teaching materials, provided that suitable acknowledgment of
OECD as source and copyright owner is given. All requests for public or commercial use and
translation rights should be submitted to [email protected]. Requests for permission to photocopy
portions of this material for public or commercial use shall be addressed directly to the Copyright
Clearance Center (CCC) at [email protected] or the Centre français d’exploitation du droit de
copie (CFC) at [email protected].

EXECUTIVE SUMMARY │ 1
OECD ECONOMIC SURVEYS EUROPEAN UNION 2018 © OECD 2018
Executive summary
The economy is expanding supported by accommodative macroeconomic policies
Policies to pursue stronger growth and make it more inclusive are needed

2│ EXECUTIVE SUMMARY
OECD ECONOMIC SURVEYS EUROPEAN UNION 2018 © OECD 2018
The EU economy is finally growing robustly. After years of crisis, the European economy has
robustly expanded in 2017 (Figure A), helped by
very accommodative monetary policy, mildly
expansionary fiscal policy and a recovering
global economy. GDP growth is projected to
remain strong in 2018 and 2019 by the standards
of recent years.
Figure A. The economy has recovered strongly
Source: OECD (2018), OECD Economic Outlook:
Statistics and Projections (database).
StatLink2http://dx.doi.org/10.1787/88893374742
…but important challenges remain
With an expansion underway, attention needs
to shift to Europe’s long-term challenges.
Wellbeing disparities, the UK vote to exit the
EU, low potential growth, an ageing population
and continuous technological developments are
all important challenges. To further strengthen
the confidence of all its citizens (Figure B), the
European Union needs to focus on policies that
support a stronger and more inclusive growth.
Figure B. Citizens' trust in the EU is recovering
% of population claiming they tend to trust the EU, as an
institution
Source: European Commission, Public Opinion in the
European Union, Standard Eurobarometer Survey.
StatLink2http://dx.doi.org/10.1787/888933747451
Bringing everyone on board to revive the
European project. Income inequality in EU
countries is on average lower than in other
OECD countries. At the same time, the crises
have left a legacy of social problems and
discontent. Unemployment remains above pre-
crisis levels in many countries and real wages
fell sharply in some countries hard hit by the
crisis and stagnated or barely grew in others.
Youth unemployment, at about 16% on
average, remains high and there are still too
many youth left behind.
Improving long-term growth is key to make
growth more inclusive
Potential growth has fallen substantially
since the financial crisis (Figure C). Sustained
improvements in living standards are held back
by weak productivity and investment in many
countries. The EU can lift the EU’s low growth
potential by creating the right incentives and
conditions to support national reforms. Across
Europe there is ample scope for reforms to
boost competition, encourage innovation and
business dynamism and make growth more
inclusive. It is in good times that countries can
best afford the adjustment costs of such
reforms.
Figure C. The EU's potential output growth is
low As a percentage of potential GDP
Source: OECD (2018), OECD Economic Outlook:
Statistics and Projections (database).
StatLink2http://dx.doi.org/10.1787/88893374740
Deepening the Single Market is a key EU
lever to enhance prosperity. A dynamic and
large single market, that stimulates competition
and efficiency, is the EU’s main asset for
spurring productivity, investment and economic
growth. However, the single market remains
2
4
6
8
10
12
-6
-4
-2
0
2
4
2006 2008 2010 2012 2014 2016 2018
Real GDP growth
Unemployment rate (rhs)
Y-o-y % changes % of the labour force
Projections
0
10
20
30
40
50
60
70
2004 2006 2008 2010 2012 2014 2016
%
0.0
0.5
1.0
1.5
2.0
2.5
3.0
3.5
2000 2002 2004 2006 2008 2010 2012 2014 2016
European Union United States
Economic conditions keep improving…
EXECUTIVE SUMMARY │ 3
OECD ECONOMIC SURVEYS EUROPEAN UNION 2018 © OECD 2018
fragmented, with barriers in key areas,
including services, transport, finance, energy
and digital markets. Removing unnecessary
barriers to competition and cutting red tape can
help to improve economic dynamism,
facilitating firm entry and exit, reallocation of
resources across firms and technological
diffusion. New efforts to complete the single
market by creating new business opportunities
would also stimulate business investment,
which is increasing but remains below pre-
crisis.
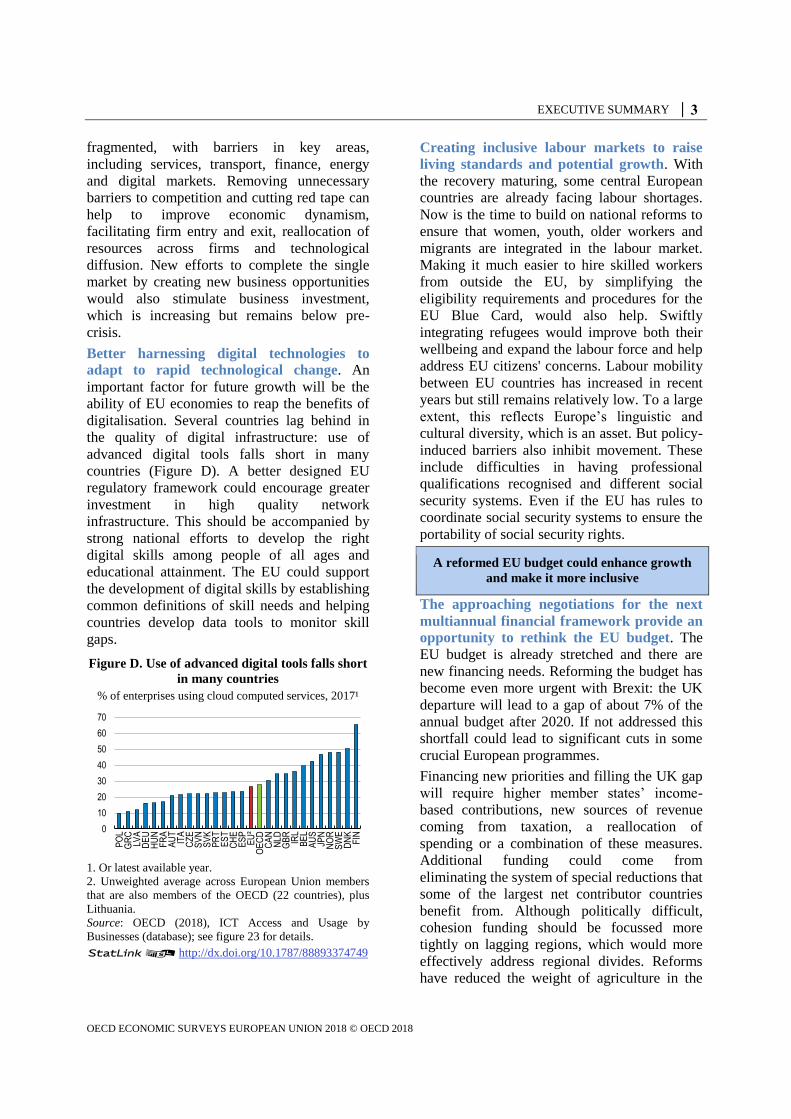
Better harnessing digital technologies to
adapt to rapid technological change. An
important factor for future growth will be the
ability of EU economies to reap the benefits of
digitalisation. Several countries lag behind in
the quality of digital infrastructure: use of
advanced digital tools falls short in many
countries (Figure D). A better designed EU
regulatory framework could encourage greater
investment in high quality network
infrastructure. This should be accompanied by
strong national efforts to develop the right
digital skills among people of all ages and
educational attainment. The EU could support
the development of digital skills by establishing
common definitions of skill needs and helping
countries develop data tools to monitor skill
gaps.
Figure D. Use of advanced digital tools falls short
in many countries
% of enterprises using cloud computed services, 2017¹
1. Or latest available year.
2. Unweighted average across European Union members
that are also members of the OECD (22 countries), plus
Lithuania.
Source: OECD (2018), ICT Access and Usage by
Businesses (database); see figure 23 for details.
StatLink2http://dx.doi.org/10.1787/88893374749
Creating inclusive labour markets to raise
living standards and potential growth. With
the recovery maturing, some central European
countries are already facing labour shortages.
Now is the time to build on national reforms to
ensure that women, youth, older workers and
migrants are integrated in the labour market.
Making it much easier to hire skilled workers
from outside the EU, by simplifying the
eligibility requirements and procedures for the
EU Blue Card, would also help. Swiftly
integrating refugees would improve both their
wellbeing and expand the labour force and help
address EU citizens' concerns. Labour mobility
between EU countries has increased in recent
years but still remains relatively low. To a large
extent, this reflects Europe’s linguistic and
cultural diversity, which is an asset. But policy-
induced barriers also inhibit movement. These
include difficulties in having professional
qualifications recognised and different social
security systems. Even if the EU has rules to
coordinate social security systems to ensure the
portability of social security rights.
A reformed EU budget could enhance growth
and make it more inclusive
The approaching negotiations for the next
multiannual financial framework provide an
opportunity to rethink the EU budget. The
EU budget is already stretched and there are
new financing needs. Reforming the budget has
become even more urgent with Brexit: the UK
departure will lead to a gap of about 7% of the
annual budget after 2020. If not addressed this
shortfall could lead to significant cuts in some
crucial European programmes.
Financing new priorities and filling the UK gap
will require higher member states’ income-
based contributions, new sources of revenue
coming from taxation, a reallocation of
spending or a combination of these measures.
Additional funding could come from
eliminating the system of special reductions that
some of the largest net contributor countries
benefit from. Although politically difficult,
cohesion funding should be focussed more
tightly on lagging regions, which would more
effectively address regional divides. Reforms
have reduced the weight of agriculture in the
0
10
20
30
40
50
60
70
PO
LG
RC
LVA
DE
UH
UN
FR
AA
UT
ITA
CZ
ES
VN
SV
KP
RT
ES
TC
HE
ES
PE
U²
OE
CD
CA
NN
LDG
BR
IRL
BE
LA
US
JPN
NO
RS
WE
DN
KF
IN

4 │ EXECUTIVE SUMMARY
OECD ECONOMIC SURVEYS EUROPEAN UNION 2018 © OECD 2018
EU budget to 37%. However, about 27% of the
support to producers is still linked to production
and should be phased out. Spending on R&D,
which only accounts for 13% of the EU budget,
should be significantly increased given
Europe’s low growth potential and the evidence
of the value added of EU-level R&D support
compared to national programmes. The EU
could better support those who lose out from
globalisation and are displaced by technological
change through a reformed and better funded
European Globalisation Adjustment Fund.
Increased funding for programmes with a strong
apprenticeship component and job-placement
support such as “Erasmus Pro” could help less
qualified workers, especially youth.
Narrowing regional divides
The EU’s record on reducing regional income
disparities is mixed. Average regional
disparities in GDP per capita have declined
over the last decade. But progress on regional
convergence came to a halt with the crisis and
has not resumed since (Figure E). Figure E. Convergence in regional GDP per
capita came to a halt with the crisis
Population-weighted coefficient of variation1, %
1. The graph shows disparities in GDP per capita (in PPS)
between NUTS-2 EU regions.
Source: European Commission (see figure 14). StatLink2http://dx.doi.org/10.1787/88893374758
Making the best of cohesion policy to reduce
regional divides. To further support income
convergence, cohesion spending should focus
on items with long-term growth benefits and
clear spillovers across borders, including human
capital, innovation and transport, energy and
digital networks. There is too much focus on
spending the funds and not enough on the
quality of investment. Higher co-funding rates
could encourage greater spending effectiveness.
Slow starts of projects at the beginning of the
programming period (Figure F) lead to a back-
loading of investment resulting in poor project
quality. Reducing the burden of administration
is a must to make cohesion policy more
effective and reduce slow starts. Creating a
single-rule book for EU funding could help. Figure F. Slow use of structural funds is common
Spending as a % of planned investment¹
1. 2014-20 programming period, as of end 2017.
Source: European Commission (2018), Cohesion Open
Data Portal for the European Structural and Investment
Funds (https://cohesiondata.ec.europa.eu/ ).
StatLink2http://dx.doi.org/10.1787/88893374757
Climate change is a global challenge that
requires all countries to act decisively
Over 90% of Europeans see climate change
as a serious problem. Under the Paris
agreement, the EU and its member states
committed to reducing greenhouse-gas (GHG)
emissions by at least 40% by 2030 from 1990
levels. Policy must be strengthened, even more
so to meet the objective of “significantly less
than 2°”. The EU emission trading system
(ETS) has not played as great a role as it could
in driving low-carbon investments. The
recession, extensive promotion of renewables
and other measures have generated a large
surplus of allowances and a low carbon price.
The ETS will need to be tightened further and
taxation increased on the use of fossil fuel
outside electricity generation. Bringing all
emissions, notably transport, into the ETS could
make room to progressively replace most other
climate policies. Working through price
incentives would increase coherence and lower
overall costs. Supporting policies, ranging from
smart grids and other infrastructure, through
energy labelling and information provision, will
remain necessary.
38
40
42
44
46
48
2000 2002 2004 2006 2008 2010 2012 2014 2016
0
5
10
15
20
25
30
35
40
ITA
ES
PS
VK
SV
NC
ZE
BE
LP
OL
HU
NG
BR
LVA
GR
CF
RA
EU
28D
NK
ES
TLT
UD
EU
NLD
PR
TS
WE
IRL
AU
TLU
XF
IN

EXECUTIVE SUMMARY │ 5
OECD ECONOMIC SURVEYS EUROPEAN UNION 2018 © OECD 2018
MAIN FINDINGS KEY RECOMMENDATIONS
Reforming the EU budget to foster more inclusive growth
There are new priorities to support more inclusive growth that need to be financed and the departure of the UK will lead to a financing gap. The burden of financing the EU budget does not reflect countries ability to pay.
Consider enhancing the efficiency of spending and increasing revenues, and reassess how the European budget is financed.
Phase out production-based payments in the Common Agricultural Policy.
Increase research and development (R&D) spending.
Reducing regional divides by making cohesion policy more effective
There is a significant productivity gap between less developed regions and the rest.
Prioritise cohesion funding to less developed regions.
Multiple objectives are reducing the effectiveness of cohesion policy, scattering resources and making evaluating its effectiveness very difficult.
Better target cohesion funding on spending with long-term growth benefits (human capital, innovation and network infrastructure), and to projects with clear spillovers across borders.
There is too much focus on spending structural and cohesion funds and not enough on the quality of investment.
Consider increasing national co-financing rates to encourage better project selection taking into account the relative impact of the project and the EU added value.
The overwhelming amount of regulation, with frequent rule changes makes cohesion policy difficult to manage and control.
Create a “single rule book” for EU funding programmes.
Use e-government and e-procurement more often.
Leveraging the single market to improve long-term growth and living standards
Business services experience many administrative and regulatory barriers.
Simplify administrative formalities for the establishment and provision of cross-border services, and provide guidance on implementing EU legislation.
European energy markets are too fragmented; high market concentration and weak competition remain an issue, investment is insufficient and final energy prices are high for citizens and businesses.
Pursue the planned cross-border co-operation on power system operation and trade, including interconnection capacity calculations and reserve margins.
A shortage of workers with the right digital skills is constraining investment and productivity.
Develop tools to help member states monitor digital skill needs. Set EU standards for the monitoring of digital skills and task content of occupations.
Eliminating barriers to people working and supporting intra-EU mobility
The EU is relatively weak at attracting highly skilled foreign workers.
Make effective the proposed simplification of eligibility and procedures for the EU Blue Card for high-skilled labour migrants.
Intra-EU labour mobility is weak owing to linguistic differences, slow recognition of qualifications and barriers to access regulated professions among others.
Increase spending on mobility programmes such as Erasmus+, and facilitate access irrespective of socio-economic background.
Foster the harmonisation of professions’ curricula at the EU level.
Make the electronic European professional card available to all sectors.
Methods to circumvent labour and tax laws persist. Step up efforts at the EU level to coordinate the design and organisation of joint cross-border labour and tax control activities.
Better protecting EU citizens in the face of change
The effectiveness of the European Globalisation Adjustment Fund is reduced by a complex and slow approval process.
Revise application requirements and procedures to speed the use of the Fund and expand eligibility to workers affected by other shocks, such as automation.
Over 90% of Europeans see climate change as a serious problem. To meet the EU 2030 greenhouse-gas emission targets without excessive costs, policy needs to be tightened, with more attention given to cost-effectiveness.
Increase the price of greenhouse gas emissions and consider bringing all fuel use, including transport, into the EU Emissions Trading System (ETS).
Increase minimum tax rates on fossil fuel use that falls outside the ETS, especially where tax rates are currently low or zero.

6 │
OECD ECONOMIC SURVEYS EUROPEAN UNION 2018 © OECD 2018

KEY POLICY INSIGHTS │ 7
OECD ECONOMIC SURVEYS EUROPEAN UNION 2018 © OECD 2018
Key Policy Insights
The economic expansion continues
Time is ripe for a reform of the EU budget
Addressing regional divides
Deepening the single market
Strengthening labour markets
Fighting climate change

8 │ KEY POLICY INSIGHTS
OECD ECONOMIC SURVEYS EUROPEAN UNION 2018 © OECD 2018
Challenges facing the European Union
After years of crisis, a positive economic momentum has taken hold in the European
Union over the last couple of years, helped by very accommodative monetary policy,
mildly expansionary fiscal policy and a recovering global economy. Growth has
continued at a dynamic pace in 2017, broadening across sectors and countries and
lowering unemployment.
These positive developments provide an opportunity to renew efforts to meet the long-
term challenges facing the European Union. Sustained improvements in living standards
are held back by weak productivity and investment in many countries. Europe’s rapid
ageing will lead to a decline in output per capita and squeeze public finances, unless
employment rates and productivity increase. The short and medium term economic
impact of the UK departure from the EU (“Brexit”) on the EU has been estimated to be
relatively small (Kierzenkowski et al., 2016), but some short-term disruptions cannot be
ruled out. Migration remains an important concern for Europeans. The numbers of
refugees entering the EU have come down, but the latest wave of refugees has shown the
limitations of the EU policy. An additional challenge, discussed in the accompanying
Euro Area Survey, is how to put the economic and monetary union on a stronger footing
to make the euro area less vulnerable to crises.
In view of these challenges, the EU needs to show more than ever the concrete benefits it
brings to people. Citizens’ trust on the European Union is on the rise, after having
significantly fallen during the sovereign and refugee crises, but the popularity of the EU
remains strikingly low by past standards (Figure 1). Part of this discontent stems from
significant gaps in well-being among EU citizens in key areas including income, jobs,
health and education (Figure 2). Income inequality is lower in Europe than in other
OECD countries, but the crises have left a legacy of social problems. Unemployment
remains above pre-crisis levels in many countries and is painfully high in some others
(Figure 3), especially among young people. Real wages have stagnated or barely grown in
most countries, and have fallen significantly in countries hard hit by the crisis. There are
also significant regional divides across Europe. While leading European regions, mostly
cities and major urban areas grow ahead, lagging regions seem to stall (OECD, 2018a;
Bachtler et al. 2017).
Figure 1. Trust in the EU is recovering, but remains below pre-crisis levels
Respondents claiming they tend to trust the European Union, as an institution, in per cent of total respondents
1. Unweighted average of Greece, Italy, Portugal and Spain.
Source: European Commission, Public Opinion in the European Union, Standard Eurobarometer Survey.
StatLink 2 http://dx.doi.org/10.1787/888933747546
0
10
20
30
40
50
60
70
0
10
20
30
40
50
60
70
2004 2005 2006 2007 2008 2009 2010 2011 2012 2013 2014 2015 2016 2017
European Union, 28 countries Southern Europe EU countries¹
% %

KEY POLICY INSIGHTS │ 9
OECD ECONOMIC SURVEYS EUROPEAN UNION 2018 © OECD 2018
Figure 2. Average well-being is high, but there are significant inequalities
Better Life Index, 20171
1. Each well-being dimension is measured by one to four indicators from the OECD Better Life Index
set. Normalised indicators are averaged with equal weights. Indicators are normalised to range between 10
(best) and 0 (worst) according to the following formula: (indicator value - minimum value) / (maximum value
- minimum value) x 10.
2. European Union member countries that are also members of the OECD (21 countries).
3. The panel shows well-being outcomes in various dimensions for people in the European Union
with different socio-economic background. In the dimensions of "income and wealth", "health" and "civic
engagement and governance", “high (/low) achievers” are people with an income belonging to the top
/(bottom) quintile of the income distribution; in "jobs and earnings", “high (/low) achievers” are people with
the high/(low)est educational attainment (i.e. ISCED 5/6 versus ISCED 0/1/2) or with gross earnings
belonging to the top /(bottom) quintile of the distribution; in "education and skills", "high (/low) achievers”
are people with a score belonging to the top /(bottom) quintile of the PISA index of economic, social and
cultural status; Outcomes are shown as normalised scores on a scale from 0 (worst condition) to 10 (best
condition) computed over OECD countries, Brazil, the Russian Federation and South Africa.
Source: OECD (2017), OECD Better Life Index, www.oecdbetterlifeindex.org .
StatLink 2 http://dx.doi.org/10.1787/888933747565
0
2
4
6
8
10Income and wealth
Jobs and earnings
Housing
Work and life balance
Health status
Education and skillsSocial connections
Civic engagementand governance
Environmental quality
Personal security
Subjective well-being
A. Well-being indicators
European Union²
OECD
0
2
4
6
8
10Income and wealth
Jobs and earnings
Health statusEducation and skills
Civic engagement and governance
B. Well-being inequalities in the European Union3
High achievers in the European Union
Low achievers in the European Union

10 │ KEY POLICY INSIGHTS
OECD ECONOMIC SURVEYS EUROPEAN UNION 2018 © OECD 2018
Figure 3. Unemployment has fallen but remains significant
Unemployment rates, per cent of the labour force
1. European Union 28 countries.
2. Unweighted average.
Source: Eurostat (2018), "Employment and unemployment (LFS)", Eurostat database.
StatLink 2 http://dx.doi.org/10.1787/888933747584
Policies to pursue stronger growth and make it more inclusive are mostly to be
undertaken at the national level, but EU policies are needed to complement national
efforts. Against this backdrop, the main messages of this Survey are:
With an expansion under way, attention needs to shift to Europe’s long-term
challenges. A reformed EU budget could enhance growth and make it more
inclusive by stepping up investment in R&D, better targeted cohesion and
agriculture spending to more effectively address regional divides, and increased
funding to support less qualified youth.
To spur long term growth and sustained improvements in living standards, the EU
needs to revive the single market project, by removing remaining barriers in
services, energy, digital and transport. Greater intra-EU labour mobility and
making it much easier to hire skilled workers from outside the EU could ease
labour shortages.
Deepening the single market and faster adoption of digital technologies will
create new jobs but put at risk others. The EU should better help lagging regions
catch up and support those who lose out from globalisation and are displaced by
technological change.
Recent macroeconomic developments and short-term prospects
The upswing continues
The European economy is growing at a fast pace (Figure 4), is broadening across sectors
and countries, and is supported mostly by domestic demand (Figure 5, Panel A).
Improving labour markets and very favourable financing conditions continue to boost
incomes, and together with higher consumer confidence (Figure 5, Panel B), private
consumption, despite lacklustre real wage growth in a majority of member states.
0
5
10
15
20
25
0
5
10
15
20
25
2000 2001 2002 2003 2004 2005 2006 2007 2008 2009 2010 2011 2012 2013 2014 2015 2016 2017 2018
European Union¹
Average² - Greece, Italy and Spain
Average² - Germany, the Netherlands and the United Kingdom
Average² - Czech Republic, Hungary, Poland and the Slovak Republic

KEY POLICY INSIGHTS │ 11
OECD ECONOMIC SURVEYS EUROPEAN UNION 2018 © OECD 2018
Investment is expanding at a dynamic pace in most countries (Figure 5, Panel C), as
private investment expands sustained by buoyant business sentiment, rising profits and
easy financial conditions. Public investment, on the other hand, remains subdued in some
member states (Figure 6). Exports have continued to strengthen on the back of an
improved economic outlook in Europe and the rebound in world trade. Business and
consumer confidence indicators remain very high pointing to healthy growth ahead and in
some sectors and countries firms are starting to face equipment and capacity constraints
(Figure 5, Panel D).
Figure 4. The upturn continues and is broad-based
Real GDP, index 2007-Q4=100
1. European Union member countries that are also members of the OECD (22 countries).
Source: OECD (2018), OECD Economic Outlook: Statistics and Projections (database).
StatLink 2 http://dx.doi.org/10.1787/888933747603
85
90
95
100
105
110
115
120
2007 2009 2011 2013 2015 2017
France Germany
Italy Spain
United Kingdom EU ¹
70
80
90
100
110
120
130
140
2007 2009 2011 2013 2015 2017
Belgium Greece
Netherlands Poland
Sweden EU ¹

12 │ KEY POLICY INSIGHTS
OECD ECONOMIC SURVEYS EUROPEAN UNION 2018 © OECD 2018
Figure 5. The broad-based recovery should positively support investment growth
1. Difference between the percentages of respondents giving positive and negative replies.
2. European Union member countries that are also members of the OECD (22 countries).
3. Percentage of businesses answering that their business is limited by shortage of space and/or
equipment.
4. Difference between the percentages of respondents assessing that their current production capacity
is more than sufficient and the percentage share of those assessing the latter as not sufficient,
Source: OECD (2018), OECD Economic Outlook: Statistics and Projections (database); European
Commission (2018), Business and Consumer Surveys (database), Brussels.
StatLink 2 http://dx.doi.org/10.1787/888933747622
Balances , %
-40
-30
-20
-10
0
10
20
30
2005 2007 2009 2011 2013 2015 2017
Industrial confidenceServices confidenceConsumer confidence
B. Private sector confidence is highBalances¹, %
Long-termaverages
60
70
80
90
100
110
120
2005 2007 2009 2011 2013 2015 2017
France Germany
Italy Spain
United Kingdom European Union²
C. Investment is picking upReal gross fixed capital formation, index Q4 2007=100
0
10
20
30
40
50
60
700.0
2.5
5.0
7.5
10.0
12.5
15.0
17.5
20.0
2005 2007 2009 2011 2013 2015 2017
Available equipment limits production (left axis)
Capacity constraints (right axis)
4
D. More manufacturing businesses are facing equipment and capacity constraints
% of businesses³
-6
-4
-2
0
2
4
6
2005 2007 2009 2011 2013 2015 2017
Total domestic demand
Real GDP growth, year-on-year % changes
A. Domestic demand is the main driver of growth
Contributions to real GDP growth, %

KEY POLICY INSIGHTS │ 13
OECD ECONOMIC SURVEYS EUROPEAN UNION 2018 © OECD 2018
Figure 6. Private investment is recovering, while public investment remains subdued
Volume¹
1. The series underlying the displayed indices are deflated by the GDP deflator.
2. European Union member countries that are also members of the OECD (22 countries).
3. Private investment is obtained as gross fixed capital formation of the total economy minus
government fixed capital formation (appropriation account).
Source: OECD (2018), OECD Economic Outlook: Statistics and Projections (database).
StatLink 2 http://dx.doi.org/10.1787/888933747641
Labour market conditions also continue to improve. Employment and labour force
participation rates in many countries are now above their levels prior to the crisis
(Figure 7), helped by stronger demand and by reforms that have raised activation,
enhanced job creation and lowered barriers to female labour force participation (OECD,
2017a). The EU average unemployment rate was 7.1 in April 2018. Yet, significant
differences remain across countries (Figure 8, Panel A) and most EU countries have yet
to regain their pre-crisis unemployment levels. There are also significant differences in
unemployment across regions (Figure 9).
60
70
80
90
100
110
120
2007 2009 2011 2013 2015 2017
European Union² United States
A. Public investmentIndex 2007=100
60
70
80
90
100
110
120
2007 2009 2011 2013 2015 2017
European Union² United States
B. Private investment³Index 2007=100

14│ KEY POLICY INSIGHTS
OECD ECONOMIC SURVEYS EUROPEAN UNION 2018 © OECD 2018
Figure 7. Participation rates have risen in many countries
Labour force as a percentage of the population aged 15-74
1. Unweighted average across European Union member countries that are also members of the OECD
(22 countries) and Lithuania.
Source: OECD (2018), OECD Economic Outlook: Statistics and Projections (database).
StatLink 2 http://dx.doi.org/10.1787/888933747660
Figure 8. The labour market is improving but wage pressures remain limited
1. Measures, for each single monthly observation, the range between the minimum and the maximum
unemployment rate registered across EU Member States.
2. Real wages are measured as labour compensation per employee deflated by the GDP deflator.
3. European Union member countries that are also members of the OECD (22 countries).
Source: Eurostat 92018), "Employment and unemployment (Labour Force Survey)", Eurostat database;
OECD (2018), OECD Economic Outlook: Statistics and Projections (database).
StatLink 2 http://dx.doi.org/10.1787/888933747679
45
50
55
60
65
70
75
1995 2000 2005 2010 2015
France Germany
Italy Spain
United Kingdom EU ¹
45
50
55
60
65
70
75
1995 2000 2005 2010 2015
Belgium Greece
Netherlands Poland
Sweden EU ¹
0
5
10
15
20
25
2005 2007 2009 2011 2013 2015 2017
Min-to-max range¹
Unemployment rate, EU28
A. The unemployment rate keeps decliningPer cent of the labour force
-3.0
-2.0
-1.0
0.0
1.0
2.0
3.0
2013 2014 2015 2016 2017
European Union³JapanUnited StatesOECD
B. Real wage growth²Year-on-year percentage changes

KEY POLICY INSIGHTS │ 15
OECD ECONOMIC SURVEYS EUROPEAN UNION 2018 © OECD 2018
Although labour shortages are beginning to appear in some countries, improving labour
market conditions have not yet translated into much wage pressures (Figure 8, Panel B).
A number of factors seem to weigh on wage growth including still significant labour
market slack in some countries and weak productivity growth in past years. The shares of
involuntary part-time work and discouraged workers in the labour force are still elevated
and declining only slowly (OECD, 2017b), suggesting that labour market slack is
probably bigger than what the unemployment rate suggests. Faster wage growth may
have also been held down in recent years by an increasing share of part-time jobs, rising
female labour force participation and growing employment in low-wage service sectors
(OECD, 2018b; Broadbent, 2015; Daly and Hobijn, 2017).
Figure 9. Regional unemployment rates in the European Union: difference in levels between
2007 and 2016
Source: Eurostat (2018), “Regional labour market statistics”, Eurostat Database.
StatLink 2 http://dx.doi.org/10.1787/888933747698

16 │ KEY POLICY INSIGHTS
OECD ECONOMIC SURVEYS EUROPEAN UNION 2018 © OECD 2018
At the same time, the labour market situation is not homogenous across Europe. While
some countries, like Greece and Spain still face high unemployment rates (Figure 3), the
labour market is tightening in a number of central European countries like Germany and
Poland. Indeed, business surveys indicate that labour market shortages are a key factor
limiting production and firms’ growth in Poland and other Visegrad countries (Figure 10),
that are benefiting from the revival in the global economy thanks to their close ties to
global value chains.
Figure 10. Labour shortages are increasing in some countries, especially in central Europe
Percentage of manufacturing firms pointing to labour shortages as a factor limiting production
1. Hungary, Czech and Slovak Republics; unweighted average.
Source: European Commission (2018), "Industry/Business Climate Indicator", Business and Consumer
Surveys, Brussels.
StatLink 2 http://dx.doi.org/10.1787/888933747717
Imbalances within Europe have declined asymmetrically since the financial crisis, with
adjustments mainly taking place in countries with larger net external liabilities. Net
external debtor countries that had persistent and large current account deficits before the
crisis, such as Portugal and Spain, have seen significant current account and some net
foreign asset adjustments (Figure 11), reflecting moderated domestic demand and a more
competitive economy. However, additional adjustments are needed to bring the net
international investment position to more sustainable levels in some countries. At the
same time, elevated external surpluses have persisted in Germany, the Netherlands and
Sweden. These external surpluses have led the European Union average current account
surplus to reach a peak of 2.6% of EU GDP in 2017, with significant projected current
account surpluses also in 2018 and 2019. Reforms to remove barriers to entry in services
and higher spending in public infrastructure, would help reduce the large current account
surplus in Germany, while higher public spending in R&D would in the short term reduce
the current account surplus in the Netherlands. In countries with previously large current
account deficits, structural policies aimed at fostering productivity growth and further
improvements in price and non-price competitiveness would help to unwind the large net
foreign liabilities.
-10
0
10
20
30
40
50
60
-10
0
10
20
30
40
50
60
2004 2005 2006 2007 2008 2009 2010 2011 2012 2013 2014 2015 2016 2017 2018
European Union Germany Poland Other Visegrad countries¹

KEY POLICY INSIGHTS │ 17
OECD ECONOMIC SURVEYS EUROPEAN UNION 2018 © OECD 2018
Figure 11. The EU current account surplus remains high
As a percentage of GDP
1. The EU28 is an unweighted average.
Source: Eurostat (2018), "Balance of payments statistics and international investment positions (BPM6)",
Eurostat Database.
StatLink 2 http://dx.doi.org/10.1787/888933747736
GDP growth is projected to average slightly above 2% per annum in the region in 2018-
19 supported by accommodative macroeconomic policies and a recovering world
economy (Table 1). While all EU economies are showing positive growth rates, they are
at varying points in their cycles (Table 2). Rising employment should boost incomes and
support private consumption, as wages are expected to rise faster than in the past. High
business confidence, increasing corporate profitability and encouraging global demand
should keep supporting investment. Despite tepid export growth, a large area-wide
current account surplus will remain, with a projected continuation of significant current
account surpluses in Germany and the Netherlands. Inflation will gradually strengthen in
an environment with higher oil prices, disappearing slack and higher wage growth.
-16
-12
-8
-4
0
4
8
12
16
GRC PRT ESP IRL GBR ITA FRA NLD DEU SWE
A. Current account balance
2008 2017
Current account balance EU28,¹
2017
Current account balance EU28¹,
2008
-160
-120
-80
-40
0
40
80
IRL PRT ESP GRC ITA FRA NLD SWE GBR DEU
B. Net international investment position
2008 2017

18 │ KEY POLICY INSIGHTS
OECD ECONOMIC SURVEYS EUROPEAN UNION 2018 © OECD 2018
Table 1. Macroeconomic indicators and projections
European Union, 1 annual percentage change, volume (2015 prices)
Projections
2015 2016 2017 2018 2019
Gross domestic product (GDP) 2.2 1.9 2.6 2.3 2.1
Private consumption 2.0 2.3 2.0 1.7 1.7
Government consumption 1.3 1.6 1.2 1.5 1.3
Gross fixed capital formation 3.5 3.0 3.8 4.3 3.9
Final domestic demand 2.2 2.3 2.2 2.2 2.1
Total domestic demand 2.2 2.2 2.2 2.2 2.1
Exports of goods and services 6.0 3.6 5.7 4.7 4.6
Imports of goods and services 6.2 4.8 4.9 4.6 4.7
Other indicators (growth rates, unless specified)
Potential GDP 1.4 1.4 1.4 1.5 1.5
Output gap2 -2.1 -1.7 -0.5 0.3 0.9
Employment 1.2 1.7 1.4 1.3 0.9
Unemployment rate 9.5 8.6 7.7 7.1 6.8
GDP deflator 1.2 0.9 1.3 1.6 1.9
Consumer price index 0.0 0.3 1.8 1.8 1.9
Core consumer prices 0.9 0.9 1.2 1.4 1.9
Household saving ratio, net3 5.2 4.9 4.3 4.2 4.1
Current account balance4 2.1 2.1 2.6 2.7 2.8
General government fiscal balance4 -2.4 -1.7 -1.0 -0.8 -0.5
Underlying general government fiscal balance2 -1.3 -0.9 -0.7 -0.9 -0.9
Underlying general government primary fiscal balance2
0.6 0.9 1.0 0.7 0.7
General government gross debt (Maastricht)4 87.0 86.5 84.2 82.4 80.7
General government net debt4 67.5 68.5 64.9 63.1 61.2
Three-month money market rate, average 0.2 0.0 -0.1 0.0 0.3
Memorandum item
Gross government debt4 105.1 106.0 102.2 100.2 98.2
1. European Union member countries that are also members of the OECD (22 countries).
2. As a percentage of potential GDP.
3. As a percentage of household disposable income.
4. As a percentage of GDP.
Source: OECD (2018), "OECD Economic Outlook No. 103", OECD Economic Outlook: Statistics and
Projections (database).
KEY POLICY INSIGHTS │ 19
OECD ECONOMIC SURVEYS EUROPEAN UNION 2018 © OECD 2018
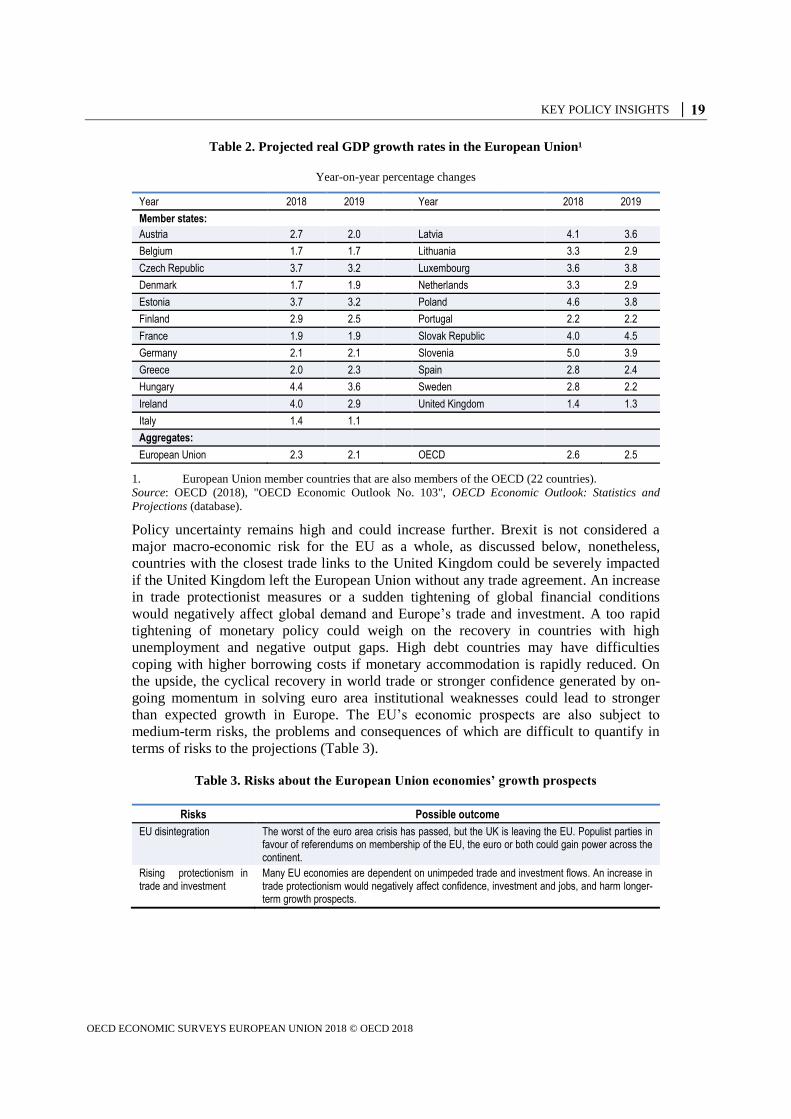
Table 2. Projected real GDP growth rates in the European Union¹
Year-on-year percentage changes
Year 2018 2019 Year 2018 2019
Member states:
Austria 2.7 2.0 Latvia 4.1 3.6
Belgium 1.7 1.7 Lithuania 3.3 2.9
Czech Republic 3.7 3.2 Luxembourg 3.6 3.8
Denmark 1.7 1.9 Netherlands 3.3 2.9
Estonia 3.7 3.2 Poland 4.6 3.8
Finland 2.9 2.5 Portugal 2.2 2.2
France 1.9 1.9 Slovak Republic 4.0 4.5
Germany 2.1 2.1 Slovenia 5.0 3.9
Greece 2.0 2.3 Spain 2.8 2.4
Hungary 4.4 3.6 Sweden 2.8 2.2
Ireland 4.0 2.9 United Kingdom 1.4 1.3
Italy 1.4 1.1
Aggregates:
European Union 2.3 2.1 OECD 2.6 2.5
1. European Union member countries that are also members of the OECD (22 countries).
Source: OECD (2018), "OECD Economic Outlook No. 103", OECD Economic Outlook: Statistics and
Projections (database).
Policy uncertainty remains high and could increase further. Brexit is not considered a
major macro-economic risk for the EU as a whole, as discussed below, nonetheless,
countries with the closest trade links to the United Kingdom could be severely impacted
if the United Kingdom left the European Union without any trade agreement. An increase
in trade protectionist measures or a sudden tightening of global financial conditions
would negatively affect global demand and Europe’s trade and investment. A too rapid
tightening of monetary policy could weigh on the recovery in countries with high
unemployment and negative output gaps. High debt countries may have difficulties
coping with higher borrowing costs if monetary accommodation is rapidly reduced. On
the upside, the cyclical recovery in world trade or stronger confidence generated by on-
going momentum in solving euro area institutional weaknesses could lead to stronger
than expected growth in Europe. The EU’s economic prospects are also subject to
medium-term risks, the problems and consequences of which are difficult to quantify in
terms of risks to the projections (Table 3).
Table 3. Risks about the European Union economies’ growth prospects
Risks Possible outcome
EU disintegration The worst of the euro area crisis has passed, but the UK is leaving the EU. Populist parties in favour of referendums on membership of the EU, the euro or both could gain power across the continent.
Rising protectionism in trade and investment
Many EU economies are dependent on unimpeded trade and investment flows. An increase in trade protectionism would negatively affect confidence, investment and jobs, and harm longer-term growth prospects.

20│ KEY POLICY INSIGHTS
OECD ECONOMIC SURVEYS EUROPEAN UNION 2018 © OECD 2018
Dealing with the UK departure from the EU
Risks on macroeconomic and financial stability are manageable
Brexit is not considered a major macro-economic risk for the EU. While a “hard” Brexit
would generate a large negative shock to the UK economy reducing GDP by an estimated
3.3% by 2020, the impact on the EU as a whole will reduce GDP by around 1 percentage
point by 2020 according to OECD estimates (Kierzenkowski et al. 2016). Nonetheless the
impact will vary across member states and some countries, like Ireland will be more
severely impacted (OECD, 2018c). The political agreement between the EU and UK to
set up a 21-month transition period after Brexit is a positive step in defining the economic
relationship during the transition period (Box 1 and OECD, 2017c). However, there are
still areas where agreement needs to be reached for the transition period to take effect as
part of the withdrawal agreement.
Box 1. Overview of key developments in the Brexit negotiations since early 2018
On 28 February 2018, the European Commission published the EU's proposal for a
Withdrawal Agreement between the European Union and the United Kingdom that
translates into legal terms the joint report from the negotiators of the European Union and
the United Kingdom government from December 2017 on the first phase of negotiations.
On 19th March 2018, lead negotiators from the European Commission and the UK
government presented a coloured version of the Draft Agreement on the withdrawal of
the UK from the European Union. Text highlighted in green in the Draft Agreement
corresponds to issues that were agreed at negotiators' level and will only be subject to
technical legal revision, such as citizens’ rights, the financial settlement, the transition
period, some of the other separation issues. Notable details include:
The transition period will last until 31 December 2020. During this period the UK
will continue to apply fully the Union acquis, therefore effectively remaining in
the EU single market and customs union.
The rights of UK citizens living in EU countries and EU citizens living in the UK
will be fully protected according to Union law. Individuals who relocate during
the transition period will continue to have their rights protected after 2020 in line
with the arrangements found in the Draft Withdrawal agreement.
The UK will have the right to negotiate trade deals with other countries. However
if a trade deal is agreed upon during the transition period, it cannot be
implemented until after December 31, 2020.
During the transition period, the UK is excluded from participation in the Union
decision-making but may be exceptionally invited to attend, without voting rights,
comitology or Commission expert groups or similar meetings where the UK is
concerned or where it is necessary for the effective implementation of Union
acquis. The UK will remain subject to the EU Common Fisheries Policy, and will
have consultation rights regarding the setting of the 2020 fishing opportunities.
The draft Agreement includes a Protocol providing for a “backstop” solution for
the border between Ireland and Northern Ireland issue that the Joint Report called
for. This states that in absence of any agreed upon solutions, Northern Ireland
will maintain full alignment with the single market and customs rules following
the end of the transition period.

KEY POLICY INSIGHTS │ 21
OECD ECONOMIC SURVEYS EUROPEAN UNION 2018 © OECD 2018
During transition, institutions of the European Union will have the Treaty powers
in relation to UK as if it were a Member State. In particular the Court of Justice
will have the same jurisdiction as now with respect to UK.
However, transitional arrangements are part of the Withdrawal Agreement. This means
that there will be no legal certainty about the transition until the Withdrawal Agreement
has been ratified by the EU and the UK.
On 23rd
March 2018, the European Council adopted the guidelines on the framework for
the future relationship with the UK after Brexit. The EU stated its determination to have
as close as possible a partnership with the UK in the future. Such a partnership should
cover trade and economic cooperation as well as other areas, in particular the fight against
terrorism and international crime, as well as security, defence and foreign policy.
The Brexit process is now on-going in several strands:
1) Pursuit of negotiations and finalisation of the Withdrawal Agreement with the UK,
which includes an agreement on transitional arrangements.
2) Scoping of the framework for the future relationship. This will be elaborated in a
political declaration accompanying the Withdrawal Agreement.
3) Preparing EU institutions, Member States, and stakeholders for the UK becoming a
third country, possibly without a ratified Withdrawal Agreement.
Sources: European Council (Art. 50) guidelines on the framework for the future EU-UK relationship; Draft
Agreement on the withdrawal of the United Kingdom of Great Britain and Northern Ireland from the
European Union and the European Atomic Energy Community; Text of the Draft Withdrawal Agreement.
Risks on financial stability for the EU as a whole from Brexit should be manageable if
financial market participants are sufficiently prepared for various exit scenarios. The
Financial Policy Committee at the Bank of England and the European Banking Authority
have pointed to several risks of disruption to the end-users of financial services (BoE,
2018; EBA, 2017). Although a number of important financial services are provided from
London, it is unlikely that the access of EU entities’ to financial services will be restricted
(ECB, 2017). EU entities will probably retain sufficient access to wholesale and retail
financial services post-Brexit, as most financial services are currently already provided in
the EU-27 and relevant UK entities can relocate part of their activities to other EU
member states.
On the other hand, moving from a wholesale banking centred in London to a potentially
more fragmented banking landscape might increase the cost of capital for households and
non-financial corporations, as the economies of scale and scope of the London industry
may diminish (ECB, 2017). In this respect, the EU should see the UK departure from the
EU as an opportunity to advance faster on the Capital Markets Union, as argued in the
Euro Area Survey. A fully developed Capital Markets Union would enhance both the
domestic and cross-border supply of capital, especially to small and medium-sized
enterprises, and facilitate risk-sharing in the European Union. Recent proposals by the
Commission for more harmonised rules on distribution of investment funds, cross-border
transactions in claims and regulatory treatment of covered bonds, as discussed in the Euro
Area Survey, are a step in the right direction.
Brexit will have significant consequences for the EU’s finances, as the UK is one of the
biggest net payers to the EU budget. The consequences of Brexit on the 2014-2020

22 │ KEY POLICY INSIGHTS
OECD ECONOMIC SURVEYS EUROPEAN UNION 2018 © OECD 2018
multiannual financial framework have been addressed by the UK commitment to pay its
annual contribution until 2020, as well as outstanding commitments as at end-2020,
which will be paid after 2020. However, from 2021 onwards the UK departure will likely
lead to a permanent funding gap of about 7% or 10 billion Euros per year (EC, 2017a;
Hass and Rubio, 2017).
Time is ripe for a reform of the EU budget
The negotiation of the next multiyear budgetary period to start in 2018 and the UK
departure from the EU present an opportunity to reform the EU budget. The EU budget is
already stretched and some spending had to be reduced in recent years to finance
emerging needs (ECA, 2016). The entire EU budget accounts for approximatively 1% of
the EU’s annual GNI (Figure 12), and around 2% of EU public expenditure. In view of
scarce resources, the EU budget should complement national budgets by focusing on EU
policies with the highest potential for value added and where EU funding can lead to
economies of scale, efficiency gains and generate cross-national externalities and benefits
for the EU and its citizens. Examples of these include cross-border infrastructure projects,
R&D spending, or to fight climate change.
In addition, new challenges need to be addressed. For instance, the recent migration crisis
has showed that additional EU action will be needed to address internal, external security
or external border control issues that are now only marginally financed by the common
budget (EC, 2018a).
Figure 12. The EU budget is small and has declined over time
Source: European Commission.
StatLink 2 http://dx.doi.org/10.1787/888933747755
Reducing economic and social differences between member states and regions are also
important challenges for the European Union and crucial for the long-term success of the
EU project. A significant part of the EU budget (43.6%) already seeks such redistribution
mainly through cohesion policy, which promotes economic convergence as well as social
and territorial cohesion, and via the Common Agricultural Policy through support for
rural development, accounting for around 24% of the CAP budget (Figure 13).
European Union, gross national income EUR 14 791 billion
EuropeanUnion, Member States' public expenditure EUR 6 906
billion
European Union, annual budget EUR 155 billion
A. Size of the EU budgetRelative to EU's GNI and public spending, 2016
0.5
0.6
0.7
0.8
0.9
1.0
1.1
1.2
1.3
Average1993-1999
Average2000-2006
Average2007-2013
Average2014-2020
B. Size of the EU budgetPer cent of gross national income,

KEY POLICY INSIGHTS │ 23
OECD ECONOMIC SURVEYS EUROPEAN UNION 2018 © OECD 2018
Figure 13. What does the EU budget finance?
2014-2020 multiannual financial framework
Source: European Commission.
StatLink 2 http://dx.doi.org/10.1787/888933747774
There is scope to make EU cohesion spending more redistributive. The bulk of cohesion
support does go to poorer regions and poorer member states. But, relatively wealthier
regions also receive significant cohesion support: 25% of the funds (90 billion Euros)
over 2014-20 will go to regions with a GDP per capital above 75% of the EU-28 average.
Although politically difficult, cohesion funding should be directed mostly to lagging
regions with a GDP per capita of less than 75% of the EU average. Improving spending
oversight and reducing bureaucracy, could also bring some savings and improve the
effectiveness of cohesion policy, as discussed below. Moreover, the EU budget could
become more inclusive by supporting better those left behind in the EU. The European
Globalisation Fund needs to be improved and its scope broadened not only to help
workers displaced by globalisation or an economic crisis, but also due to other reasons
such as automation. Additional funding to support the career and mobility opportunities
of less qualified workers, especially youth, through strengthened mobility programmes
would also be helpful, as discussed below.
There is also scope to reform the Common Agricultural Policy (CAP). Reforms since the
nineties have considerably reduced its weight in the EU budget (from 70% in the 1960s to
37% today) and improved the composition of support (OECD, 2017d). Payments that do
not require production have gained weight, offering producers the flexibility to respond to
market signals and make production choices independently from support. However, about
27% of the support to producers is linked to production and maintains prices above world
levels. In addition, direct payments (about 70% of CAP spending) are still largely
determined by historic entitlements and concentrated on large farms and land owners
(EC, 2017c). In a recent evaluation of the CAP (OECD, 2017d), the OECD advises that to
achieve long-term competitiveness and productivity gains, production based payments
39%
34%
13%
6%
6% 2%
Sustainable growth: natural resourcesAgricultureRural developmentFisheriesEnvironment and other
Economic, social andterritorial cohesionResearch and innovationICTSMEsLow-carbon economyClimate change and riskEnvironment and resource efficiencyTransport and energyEmploymentSocial inclusionVocational training
Competitiveness for growth and jobsEducationEnergyIndustry and SMEsNetworks and technologyResearch and innovationTransport
Administration
Global EuropeDevelopment & international cooperationNeighbourhood and enlargementHumanitarian aidForeign policy instruments
Security and citizenshipMigration and home affairsHealth and food safetyCultureJustice

24 │ KEY POLICY INSIGHTS
OECD ECONOMIC SURVEYS EUROPEAN UNION 2018 © OECD 2018
need to be phased out. Direct support should be re-assessed and better targeted to the
provision of European public goods such as environment and climate change and to
facilitate the transition towards farming methods more resilient to climate risk.
Agricultural reforms carried out in other countries, such as Australia, could provide
useful insights.
Higher spending in R&D should be a priority for the future in a context where EU
productivity is low and European research competes with other global players. However,
research and development accounts only for about 13% of the EU budget and 10% of
total public investment in research and innovation in the EU, despite of evidence of
significant value added of EU spending compared to national R&D public spending.
According to its interim evaluation, 83 % of Horizon 2020-funded projects would not
have gone ahead without EU-level support (EC, 2017b). The budget for the post-2020 EU
research and innovation programme should be significantly increased.
How to finance new priorities and fill in the UK gap in the EU budget?
Given the political difficulties in increasing member states contributions or on agreeing
on new sources of funding, cutting spending in some areas to finance others might appear
appealing. However, research suggests that financing the UK gap only via spending
reductions would imply a significant cut in some of the EU’s flagship programmes, such
as eliminating the entire EU R&D funding (Horizon 2020) plus the fund for asylum,
migration and integration (Hass and Rubio, 2017). This suggests that financing new
priorities and filling the UK gap will require higher member states’ contributions, finding
new sources of revenue, reducing spending or a combination of these different options.
At present, about 70% of the budget is financed through member states contributions
based on their income level (GNI), with the rest coming from contributions from national
value added taxes and custom duties collected at EU external borders. EU countries have
historically supported GNI-based contributions to finance the EU budget as it is seen as a
fair burden-sharing system reflecting countries relative ability to pay. But, when account
is taken of the special reductions (“rebates”) that some of the largest net contributors
(including the UK, Germany, the Netherlands, Sweden and Austria) have the budget is
regressive (Monti et al. 2017). The withdrawal of the UK from the EU entails the end of
the UK reduction. Eliminating the reductions for the other countries (“rebates on the
rebate”) would bring additional resources, and make the system more redistributive and,
less complex and opaque.
Additional revenues from national taxes could complement member states GNI-based
contributions, as proposed by the high level committee on own resources appointed by
the Commission (Monti et al. 2017). Depending on its design, this could provide a tighter
link between EU financed spending and those financing it (Monti et al. 2017). A first
promising option to raise revenues from national taxes is reforming the current VAT-own
resource system. The VAT already finances about 12% of the EU budget by levying a
0.3% rate on member states VAT bases, with member states VAT bases capped based on
their GNIs to make the system less regressive. However, the system is very complex and
non-transparent. National VAT bases are theoretically harmonised through difficult
calculations to offset the impact of diverging rates and structures on national VAT bases.
Moreover, the “rebates” make the system even more complex and non-transparent, as
they imply reductions for some countries in their VAT contributions. Higher revenues
and a less complex system could be achieved by applying a single EU rate to a broader
harmonised VAT base on all goods, services and transactions, as proposed by the high

KEY POLICY INSIGHTS │ 25
OECD ECONOMIC SURVEYS EUROPEAN UNION 2018 © OECD 2018
level committee. The Commission VAT Action Plan, which includes various measures to
improve the operation of the VAT system and to fight fraud, could provide the necessary
momentum for the reform. Further VAT reform could contribute to fight fraud and reduce
cross-border administrative burdens for businesses. Annual estimates of cross-border
VAT fraud account for 50 billion a year. Tackling this cross-border VAT fraud would not
only broaden member states’ VAT base but indirectly also VAT receipts paid to the EU
budget.
Another new source of revenue could be an EU corporate income tax. The Commission
has recently put forward a package to re-launch the common consolidated corporate tax
base (CCCTB). While the initiative aims at developing a consolidated tax base, a share of
the CCCTB could be transferred to the EU budget. Under the Commission current
proposal, a constraint would be that participation is based on the voluntary registering of
companies, except for large companies (Monti et al. 2017), which might reduce the size
of country contributions to the EU budget.
Other alternatives include a carbon-based tax own resource and the proceeds from
auctioning ETS permits (Monti, et al. 2016). At present six EU countries have a carbon
tax in place (Denmark, Ireland, Finland, Sweden, France and Slovenia), however, rates
and coverage differ between countries. A European carbon tax based on a single
minimum rate for CO2 emissions to all sectors not covered by the EU ETS, as the
Commission proposed in the context of the revision of the Energy Taxation Directive,
could be an option to finance the EU budget. Using the proceeds from auctioning ETS
permits to finance the EU budget would be another option; however, as proceeds are
relatively small and unstable over time, they would need to be complemented with other
revenues.
Finally, savings, although insufficient by themselves, could help. The Commission
conducts mid-term spending reviews to assess the efficiency of EU budget programmes.
But these are not comprehensive enough to identify spending inefficiencies. As
recommended by the European Court of Auditors (ECA, 2016), a first step would be to
carry out a comprehensive EU spending review to assess if the allocation of the EU
budget reflects the EU strategic priorities, as well as assess performance and added value
of the various programmes. Moreover, a streamlined, simplified approach to budget
reporting, both ex-ante and ex-post, would help to improve public assurance and trust, as
recommended by the OECD EU budget review (OECD, 2017e).
Regional divides need to be addressed more effectively to foster greater trust in the
EU
Evidence suggests that those who tend to be left behind, such as workers with low levels
of education, are those who are less supportive of the European Union (Dustmann et al.,
2017). This is particularly the case in some regions affected by on-going globalisation
trends. For instance, votes for populist anti-European parties have grown in regions hard
hit by import competition in the EU-15 (Colantone et al. 2016). The continuous
improvement of labour market conditions across Europe should help to improve citizens’
trust in the EU, as economic insecurity is an important source of people’s concerns.
However, the EU can play a better role in supporting those left behind by reforming
cohesion policy to more effectively address regional disparities.

26 │ KEY POLICY INSIGHTS
OECD ECONOMIC SURVEYS EUROPEAN UNION 2018 © OECD 2018
Reforming cohesion policy to make it more effective
The prime goal of cohesion policy is the reduction of regional income per capita
disparities. The record of EU cohesion policy is, however, mixed: in the majority of EU
countries regional GDP per capita disparities have declined over time and there is
convergence both at the country and regional level, as shown in the thematic Chapter.
However, progress on regional convergence came to a halt with the crisis and has not
resumed since 2009 (Figure 14). This suggests there is scope for making cohesion
spending more effective. However, cohesion policy is not a silver bullet. EU efforts to
foster convergence via cohesion policy are only a complement to other factors affecting
regional convergence. A more effective use of the funds must be accompanied by
national policies to develop a favourable environment for investment and for human
capital development.
Figure 14. Convergence in regional GDP per capita came to a halt with the crisis
Population-weighted coefficient of variation1, %
1. The graph shows disparities in GDP per capita (in PPS) between NUTS-2 EU regions.
Source: European Commission (2018), DG for Regional and Urban Policy, calculations based on Eurostat
data.
StatLink 2 http://dx.doi.org/10.1787/888933747793
The next programming period, starting in 2020, is an opportunity to deeply reform
cohesion policy. The goals of cohesion policy seem very ambitious: fostering economic
convergence, facilitating integration, encouraging sustainable development (Figure 15).
So many objectives risk reducing the effectiveness of cohesion policy, scattering
resources and making evaluating its effectiveness very difficult. Cohesion spending
should focus on items that will support higher sustainable growth, including human
capital (education and training), innovation and infrastructure projects with clear
spillovers across borders, such as transport, energy or digital projects.
38
39
40
41
42
43
44
45
46
47
38
39
40
41
42
43
44
45
46
47
2000 2001 2002 2003 2004 2005 2006 2007 2008 2009 2010 2011 2012 2013 2014 2015 2016

KEY POLICY INSIGHTS │ 27
OECD ECONOMIC SURVEYS EUROPEAN UNION 2018 © OECD 2018
Figure 15. What does cohesion policy finance?
2014-2020, in billion EUR
Source: European Commission.
StatLink 2 http://dx.doi.org/10.1787/888933747812
The Commission has introduced stronger focus on performance as of 2014 - including ex-
ante conditions to access funding, performance targets to monitor progress, and tighter
monitoring -, but the new performance tools are cumbersome and as a result member
states are having difficulties to implement them. At the beginning of each programming
period authorities need to set-up a performance framework, select indicators to monitor
progress and establish clear, realistic and measurable milestones. Monitoring has also
been strengthened: every year, countries have to report progress towards targets and
submit detailed progress reports at the end of the funding cycle. The Commission has also
set up a so-called performance reserve to reward projects and priorities that have achieved
their milestones ahead of schedule.
Deeper changes are needed to further improve spending effectiveness. Member states co-
finance cohesion spending to ensure additional investment. The problem is that such
additionality is hard to enforce and verify and evidence suggests that there is crowding
out of national public investment by EU structural funds (CPB, 2012). An additional
problem is that there is too much focus on spending the funds, especially towards the end
of the programming period, for fear of losing European money, and not enough on the
quality of investment (ECA, 2017a). Returns on projects financed by cohesion policy can
also be low as authorities consider the full-benefits of the project, but not the full costs.
Higher co-financing rates are needed to reduce the risk that EU funds are spent on low
value projects.
Reducing the administrative burden is necessary to make cohesion policy more effective.
Merging the different structural funds into one fund, although difficult because it would
require changing the EU treaties, would have important benefits as it would minimise
duplication, reduce the scattering of resources, and facilitate synergies and planning.
Perhaps more politically feasible in the medium-term would be to move towards “a
single-rule book” with a common set of rules and definitions covering the five structural
funds. Even if this would still require difficult coordination across several Commission
0 10 20 30 40 50 60 70
Transport and energy
Research & innovation
Low-carbon economy
Employment
Environment and resource efficiency
Vocational training
SMEs
Social inclusion
Other
ICT
Climate change and risk

28 │ KEY POLICY INSIGHTS
OECD ECONOMIC SURVEYS EUROPEAN UNION 2018 © OECD 2018
directorates, and the need to manage several funds, it could still help simplify
administration and foster synergies.
More efforts are needed to improve control of how structural funds are spent. Cohesion
policy has been marred by the highest implementation errors in the EU budget (ECA,
2014). Some of these errors are minor, but others involve serious breaches such as
absence of fair competition in the awarding of projects or projects not awarded to the best
bidders (ECA, 2017b). There is significant scope to improve public procurement practices
in many countries (Figure 16). This should be coupled with simplification of the rules and
greater use of e-government and e-procurement to help improve efficiency and reduce
opportunities for abuse of power.
Figure 16. Competition in public procurement is weak in many countries
Per cent, 2016
Source: European Commission, Single Market Scoreboard,
http://ec.europa.eu/internal_market/scoreboard/performance_per_policy_area/public_procurement/index_en.h
tm .
StatLink 2 http://dx.doi.org/10.1787/888933747831
Fraud in the use of structural funds also occurs (EC, 2012a), and should be better
addressed. In 2016, the European Court of Auditors estimated that 60% of the fraud
affecting the EU budget was in the area of cohesion and fisheries spending, amounting to
an estimated annual €391 million (ECA, 2017c). This is about 0.5% of total cohesion
spending in 2016; however, given the relatively uncoordinated web of national and
European checks and balances controlling cohesion policy it is hard to quantify how
much fraud is truly going on. The European Parliament has backed the creation of a
European Public Prosecutor Office to strengthen the fight against fraud in the use of EU
funds. All member states should join the jurisdiction of the new European Public
Prosecutor.
Slow starts of projects are a recurrent problem. By end 2017, only 16% of expenditure of
that planned over 2014-2020 had been disbursed (Figure 17). Slow starts are problematic
because they lead to a back-loading of investment and can result in poor project quality
and higher risk of irregularities (OECD, 2016a; OECD, 2014). An earlier start of
spending would allow for a smoother distribution of investment over the period, which
would help create a more stable macroeconomic environment. The experience of Czech
0
10
20
30
40
50
ISL
LUX
NO
RD
NK
NLD IR
LS
WE
FIN
AU
TB
EL
FR
AG
RC
DE
UE
ST
LTU
PR
TE
SP
EU
28G
BR
ITA
SV
KLV
AS
VN
HU
NC
ZE
PO
L
B. Share of contracts awarded with only onebidder
0
5
10
15
20
25
NO
RIR
LLU
XS
WE
PR
TG
RC
ISL
BE
LG
BR
NLD
AU
TF
RA
DE
UP
OL
LTU
FIN
DN
KE
ST
EU
28 ITA
HU
NE
SP
LVA
SV
KS
VN
CZ
EA. Share of procurement procedures with no
call for tender

KEY POLICY INSIGHTS │ 29
OECD ECONOMIC SURVEYS EUROPEAN UNION 2018 © OECD 2018
Republic, Latvia, Lithuania, Slovak Republic, Slovenia and Hungary in 2015-2016 shows
that uneven distribution of significant public investment over time makes macroeconomic
management challenging in countries where the structural funds account for a significant
part of investment (OECD, 2017a; Figure 18).
Figure 17. Slow use of structural funds is common
1. Unweighted average across 25 EU countries.
Source: European Commission (2018), Open Data Portal for the European Structural and Investment Funds
(https://cohesiondata.ec.europa.eu/); European Commission (2014), "Analysis of the Budgetary
Implementation of the Structural and Cohesion Funds in 2013”.
StatLink 2 http://dx.doi.org/10.1787/888933747850
Figure 18. Macroeconomic management is challenging in countries receiving a substantial
share of cohesion funding
Total gross fixed capital formation, annual percentage changes in volume
1. Simple average across the Czech and Slovak Republics, Hungary, Poland and Slovenia.
Source: Eurostat (2018), "GDP and Main Components", Eurostat Database.
StatLink 2 http://dx.doi.org/10.1787/888933747869
0
5
10
15
20
25
30
35
40
ITA
ES
PS
VK
SV
NC
ZE
BE
LP
OL
HU
NG
BR
LVA
GR
CF
RA
EU
28D
NK
ES
TLT
UD
EU
NLD
PR
TS
WE
IRL
AU
TLU
XF
IN
A. Spending of planned investment2014-20 programming period, as of end 2017, per cent
0
10
20
30
40
50
60
70
ES
TLT
UP
RT
FIN
DE
UIR
LG
RC
AU
TB
EL
SW
EP
OL
LUX
LVA
EU
¹N
LDS
VN
ES
PF
RA
HU
NG
BR
DN
KS
VK
CZ
EIT
A
B. Unabsorbed structural and cohesion funds2007-13 programming period, as of end 2013, per cent
-40
-30
-20
-10
0
10
20
30
-40
-30
-20
-10
0
10
20
30
2006 2007 2008 2009 2010 2011 2012 2013 2014 2015 2016 2017
European Union
Central and Eastern European countries ¹
Baltics

30 │ KEY POLICY INSIGHTS
OECD ECONOMIC SURVEYS EUROPEAN UNION 2018 © OECD 2018
Several measures can be taken to reduce slow starts and smooth transitions between the
structural funds financing periods. On the EU side, speeding up the negotiation of the
programming period, which is often very slow and leads to delays in implementation,
would help to reduce slow starts. There is also scope for the Commission to prepare
guidance documents in a timelier manner and to simplify the carrying over of projects
from one period to the next. On the national side, countries should streamline
administrative procedures, strengthen administrative capacities to manage the funds,
harmonise EU and national criteria, and improve the timeliness of project approval,
building on existing country experiences to improve the absorption of structural funds,
discussed in the thematic Chapter.
Deepening the single market to boost long-term growth
As every OECD European Union Survey since 2007 has noted (Table 4), one of the
European Union’s strongest tools to boost the EU’s weak long-term growth (Figure 19) is
the binding instruments that underpin the Single Market Project to dismantle barriers to
the free movement of people, goods, services and capital. The single market is one of
EU’s greatest achievements. It eases intra-EU trade by reducing non-tariff barriers,
facilitates capital flows and trade in services and grants full mobility to EU citizens.
According to Commission estimates it generated a 2.1% increase in EU GDP in its first
15 years (EC, 2012b).
Figure 19. The EU has seen a significant decline in potential output growth¹
1. European Union refers to OECD EU Member countries excluding Estonia, for which data covering
the entire reference period are unavailable.
Source: OECD (2018), OECD Economic Outlook: Statistics and Projections (database).
StatLink 2 http://dx.doi.org/10.1787/888933747888
Yet, the single market remains incomplete, holding back the EU’s economic
performance, as discussed in the thematic Chapter. Goods are rather easily traded across
borders. However, services, energy, transport, finance and digital markets are far from
integrated. Labour mobility is also relatively low: only 3.9% of EU citizens in working
age lived in 2016 in another member state.
0.0
0.5
1.0
1.5
2.0
2.5
3.0
3.5
4.0
0.0
0.5
1.0
1.5
2.0
2.5
3.0
3.5
4.0
2000 2001 2002 2003 2004 2005 2006 2007 2008 2009 2010 2011 2012 2013 2014 2015 2016 2017 2018
Capital per worker Labour inputs TFP Potential output growth
% %

KEY POLICY INSIGHTS │ 31
OECD ECONOMIC SURVEYS EUROPEAN UNION 2018 © OECD 2018
Renewed political commitment is needed to deepen the single market. When the
Commission took office in 2014, it vowed to accelerate integration in energy, digital
services and capital markets, but progress has been slow, despite significant potential
benefits. For instance, fully implementing the current services directive could add 1.7% to
EU GDP (European Commission, 2017b). An integrated digital market could in theory
add about 8 billion Euros a year to EU GDP (European Commission, 2015a).
Table 4. Past OECD recommendations to deepen the Single Market
Recommendations in 2016 Economic Survey Actions taken since 2016
Improve the quality of impact assessment of legislative proposals, notably amendments, and the quality of ex post evaluation of policies.
The Better Regulation Guidelines and the underlying toolbox were updated and strengthened in July 2017.
Prioritise the Trans-European transport and energy network projects to support the completion of the Single Market.
Four bottlenecks on TEN-T core network corridors have been removed in 2016, with additional 11, 25 and 53 expected in 2017, 2018 and 2019.
Harmonise, taking into account the specificities of each member state, national regulations and technical specifications in network sectors, with the target of transferring decision powers in technical matters to a single EU regulator.
The proposal of September 2016 for the European Electronic Communications Code defines how providers of networks and/or services can be regulated by national regulators.
Harmonise the rules for online purchases and reduce unjustified geographical discrimination of consumers.
In 2017, there were political agreements a) new legislation to address unjustified geoblocking and other forms of discrimination on the grounds of nationality, residence or establishment in the internal market and b) a legislative proposal on cross-border parcel delivery services to increase transparency of prices and improve regulatory oversight.
Actions at the EU level to deepen the single market should be accompanied by renewed
national efforts to foster growth-enhancing reforms, in line with country-specific
recommendations in OECD Economic Surveys and in Going for Growth. The reform
momentum in EU countries has declined over time (Figure 20, Panel A), especially in
countries most affected by the crises. The implementation record of the European
Semester country-specific recommendations is also weak, and keeps deteriorating since
the Semester was established in 2011 (Figure 20, Panel B). The momentum for reform is
weakening at a time when renewed efforts are needed to boost productivity and long-term
growth. OECD estimates suggest that reforms to raise productivity could increase GDP
by as much as 0.7% up to 2023 in the EU alone (Figure 21). Reforms that stimulate
innovation and enhance competition in product markets and reforms that improve the
business environment and the quality of institutions could help also to foster economic
resilience in the member states and the euro area as a whole (EC, 2017d).

32 │ KEY POLICY INSIGHTS
OECD ECONOMIC SURVEYS EUROPEAN UNION 2018 © OECD 2018
Figure 20. Implementation of policy recommendations is weak
1. Number of actions taken as a percent of total country-specific policy recommendations.
2. The indicator is the ratio of the sum of scores to the total number divided by the number of
recommendations; each country-specific recommendation is assigned a score ranging from 0 (no or limited
progress) to 1 (full, substantial progress). The series displayed are unweighted averages across 21 EU
countries for which data are available.
Source: OECD (2017), Going for Growth 2017, OECD Publishing, Paris; Bruegel and OECD based on
European Parliament studies.
StatLink 2 http://dx.doi.org/10.1787/888933747907
Figure 21. Gains from reforms raising productivity by 1% over 5 years1
Increase in GDP and wages achieved by 2023
1. The scenario considers the effects of raising labour-augmenting technical progress by 0.2
percentage point per annum in all of the advanced economies for five years, beginning at end-2017, with the
1% higher level of technical progress being maintained permanently thereafter.
Source: Box 1.1. in OECD (2017), OECD Economic Outlook, Volume 2017 Issue 2, OECD Publishing,
Paris; OECD calculations.
StatLink 2 http://dx.doi.org/10.1787/888933747926
0
10
20
30
40
50
60
70
80
90
100
EuropeanUnion
Italy Spain Greece Portugal Ireland
2011-12 2013-14 2015-16
A. Reform responsiveness rate¹Per cent
0.00
0.25
0.50
0.75
1.00
2011 2012 2013 2014 2015 2016
21 EU countries
14 Euro-area countries
7 Non-euro area countries
B. European semester reform implementation index²Country-specific recommendations, per cent
0.0
0.2
0.4
0.6
0.8
1.0
1.2
1.4
0.0
0.2
0.4
0.6
0.8
1.0
1.2
1.4
OECD United States European Union Japan
Real GDP Real wages

KEY POLICY INSIGHTS │ 33
OECD ECONOMIC SURVEYS EUROPEAN UNION 2018 © OECD 2018
Services experience significant administrative and regulatory barriers when
going cross-border
Service sectors are particularly fragmented. Cross-border services make up only 5% of
EU GDP, despite accounting for 70% of EU GDP. This weighs on productivity. The EU
productivity gap, increasing since the 1990s, is particularly wide in service sectors
(Figure 22). At the firm level, there is an increasing productivity gap between leading
frontier firms and the rest in both manufacturing and services as there is insufficient
diffusion of technology and knowledge from frontier to lagging firms (Andrews et al.
2017; 2016). Businesses still experience many administrative and regulatory barriers
when providing services in another member state, including high shareholder
requirements, requirement for professionals to hold 100% of the voting rights in some
countries or compulsory minimum tariffs for some professions (EC, 2017e).
Administrative complexity and costs are also high, including lack of information about
applicable rules, differences in rules and requirements among countries, complexity of
procedures and formalities, lack of electronic procedures, unclear deadlines and multiple
fees. These policy obstacles fall disproportionally on smaller firms.
Figure 22. The productivity gap is particularly large in services
1. The EU and the Euro area aggregates refer solely to Member States that are OECD countries. Non-
OECD is Argentina, Brazil, China, Colombia, India, Indonesia, Latvia, Lithuania, Russia, South Africa and
Saudi Arabia. EU, Euro area, OECD and non-OECD are aggregated using GDP PPP weights. Data for several
countries begin between 1991 and 1995, not in 1990.
2. Productivity is measured as output per employee for Non-OECD countries.
Source: OECD estimations using OECD National Accounts database; OECD Productivity database;
International Labour Organisation database.
StatLink 2 http://dx.doi.org/10.1787/888933747945
0
1
2
3
4
5
6
0
1
2
3
4
5
6
EU Euro area OECD Japan USA Non-OECD
1990-2000 2000-2007 2007-2016
% %A. Productivity growth has declined in the European Union since the 1990s¹Output per hour worked², annualised growth rates
90
100
110
120
130
140
150
160
170
2000 2004 2008 2012 2016
Manufacturing Services
Index 2000 = 100 United States
90
100
110
120
130
140
150
160
170
2000 2004 2008 2012 2016
Manufacturing Services
Index 2000 = 100European Union
B. Productivity in manufacturing and services sectors

34 │ KEY POLICY INSIGHTS
OECD ECONOMIC SURVEYS EUROPEAN UNION 2018 © OECD 2018
To further reduce barriers, the Commission launched a new services package in January
2017 that aims at facilitating the mobility of professionals and streamline cross-border
administrative procedures in construction and business services (e.g. accounting, tax
advice, architecture, engineering, IT) (Table 5). One of the key measures proposed was a
new services e-card to help reducing information asymmetries and eliminate the need for
multiple requests of information to facilitate more firms go abroad. E-cards were intended
to facilitate the temporary provision of services across borders and the set-up of agencies,
branches and offices, where administrative complexity and legal uncertainty is still an
important challenge, as recommended in the 2016 Survey. However, the e-card proposals
in their current form are unlikely to be approved in the EU legislative process. A solution
should be found to reduce barriers in the business services sector by simplifying
procedures for self-employed and companies to complete the administrative formalities to
establish and provide cross-border services.
There is significant scope for improving the functioning of the European retail sector.
Retailers face persisting barriers to market entry including burdensome and complex
authorisation processes, restrictive requirements linked to the size and location of shops,
as well as operational restrictions, including shop opening hours or rules on promotions
and discounts. As a result, evidence by the Commission shows that, as a result, consumer
prices are high, and product innovation and labour productivity growth are low (EC,
2015a). The Commission has launched an initiative in May on April 19th, which consists
of best practices to guide member states’ reforms of the regulatory environment for retail.
Such efforts are welcome. Close monitoring by the Commission of the level of regulatory
restrictiveness in the retail sector and its economic impacts should be used to measure
member states’ reform efforts.
An integrated EU energy market would be good for consumers, energy security
and the environment
Despite progress made in recent years, much remains to be done to achieve a fully-
integrated internal energy market. The European energy market is still too fragmented;
high market concentration and weak competition remain an issue, infrastructure is
outdated in some areas, investment is insufficient and final energy prices are high for
citizens and businesses (IEA, 2014; OECD, 2016b). Trading of electricity across borders
has increased markedly since the 1990s and, in recent years, average prices have fallen
and some of the largest divergences between countries narrowed. But there remain
significant price divergences across countries, in part because of lack of sufficient cross-
border interconnection capacity. The economic losses due to these price divergences are
substantial, amounting to around €1.1 billion annually by some estimates; incumbent
electricity producers benefit particularly from the reduced competition resulting from the
lack of adequate connectivity. A well interconnected grid is also crucial to accommodate
increasing levels of renewables in a cost-effective way and help meet the EU climate
goals. An integrated electricity market would increase the potential for renewables to be
supplied beyond national borders contributing to the shift towards a low-carbon economy
and to fight climate change.
To further integrate energy markets, investment needs are substantial. The Commission
estimates that some EUR 200 billion are needed up to 2020 to build the necessary
infrastructure to adequately interconnect all EU countries, about half of it for electricity
projects alone out of which 35 billion are needed for interconnections (EC, 2015b). As
recommended in the 2016 Survey (Table 4), EU funding, including through the structural
funds and the Investment Plan for Europe (so-called “Juncker plan”), should prioritize

KEY POLICY INSIGHTS │ 35
OECD ECONOMIC SURVEYS EUROPEAN UNION 2018 © OECD 2018
trans-European energy networks to fill some of those investment gaps with a positive
cost-benefit analysis outcome.
But low investment is not the only constraint on cross-border trade in electricity. Security
of supply concerns reduces efficiency and cross-border trade. National operators tend to
keep higher reserve capacity margins on cross-border lines than they do on domestic
ones, as insurance against occasional unexpected losses of power or surges in demand,
reducing cross-border energy supply. The Commission's proposed modification to the
regulatory framework for the internal electricity market would help minimise regulatory
barriers by explicitly requiring national regulators to treat cross-border links in the same
way as the domestic equivalent in market planning. A review of regulations to try to
minimize any inadvertent regulatory barriers to cross-border trade would also be
welcome. Encouraging regional solutions on power system operation and trade would
also help to reduce energy costs and ensure security of supply and the “Clean Energy for
Europe” package should provide solutions and practical guidance to revitalise regional
cooperation. To make best use of developing technologies (which will require investment
in physical infrastructure but also in software), “integrated resource planning” is needed,
where the development of generating capacity, the distribution network and market
design are all considered together. To enhance trade between member countries,
integrated resource planning needs to take place across the whole network, reaching
across national boundaries. The ten year investment plans, updated every two years, by
the European Network of Transmission System Operators employ such methods and
national system operators have to follow up with their own plans.
Deepening the digital single market
The EU is still lagging behind in the uptake and use of digital technologies and this is
holding down Europe’s growth potential. While some countries like Sweden and Finland
are leading on the global stage, the ICT sector value added is significantly smaller in most
European countries, and some large economies are trailing behind the EU average. Less
than 30% of European businesses in important manufacturing sectors like automotive and
mechanical engineering are exploiting digital technologies (EC, 2017f). Business uptake
of digital technologies could be improved in many EU countries, especially among
smaller companies (Figure 23). This implies an untapped potential to allow firms to
capture customers’ demand more accurately and reduce failures in the innovation process.
The EU and member states have made deepening the digital single market a priority,
aiming to establish common rules for online purchases, integrate telecom regulations,
improve postal services and reduce the burden on businesses caused by diverging VAT
regimes, among others. Important achievements have been made including improved
cross-border portability of online content services and the removal of roaming charges
and geo blocking (Table 4). But much remains to be done to create a unified digital
market. Other important legislative measures such as modernisation of copyright rules,
taxation of e-commerce, cyber-security and addressing unfair contractual clauses and
trading practices identified in platform-to-business (P2B) relations are still in the
legislative process (Table 4). Moreover, access to proper funding is a critical barrier to
the development of digital start-ups. Further efforts to develop the Capital Markets
Union, as discussed in the Euro Area Survey would enhance both the domestic and cross-
border supply of capital, especially to small and medium-sized enterprises.
High quality network infrastructure is the backbone of the digital economy. However,
some member states have weak digital infrastructure, as evidenced by slow average
internet connection speed (Figure 24). Digitalisation can facilitate the diffusion of new

36 │ KEY POLICY INSIGHTS
OECD ECONOMIC SURVEYS EUROPEAN UNION 2018 © OECD 2018
technologies and boost productivity by enhancing efficiency in production and
administration.
Figure 23. Business uptake of digital technologies could be improved in many firms,
especially among smaller ones
Enterprises using cloud computing services¹ as a percentage of all enterprises, 2017²
1. Cloud computing refers to ICT services used over the Internet as a set of computing resources to
access software, computing power, storage capacity and so on. Data refer to manufacturing and non-financial
market services enterprises with ten or more persons employed.
2. Or latest available year; 2016 for the EU and the OECD average.
3. Unweighted average across European Union member countries that are also members of the OECD
(22 countries) and Lithuania.
Source: OECD (2018), ICT Access and Usage by Businesses (database).
StatLink 2 http://dx.doi.org/10.1787/888933747964
Figure 24. The internet connection speed is still relatively modest in some countries
Akamai's average peak connection speed in Mbps, Q1 2017
Source: Akamai (2017), "Akamai's state of the Internet report: Q1 2017 report", https://www.akamai.com .
StatLink 2 http://dx.doi.org/10.1787/888933747983
0
20
40
60
80
100
0
20
40
60
80
100
TU
R
ME
X
KO
R
SV
K
CH
E
LVA
PO
L
GR
C
AU
S
DE
U
HU
N
CZ
E
AU
T
ES
T
EU
³
OE
CD
LUX
FR
A
LTU
ITA
ES
P
CA
N
SV
N
PR
T
NL
D
GB
R
JPN
ISL
IRL
DN
K
SW
E
NO
R
BE
L
FIN
Large enterprises (more than 250 employees) Smaller SMEs (10-49 employees)
0
20
40
60
80
100
120
140
0
20
40
60
80
100
120
140
GR
C
ME
X
FR
A
ITA
AU
S
LUX
SV
N
ES
T
AU
T
CH
L
DE
U
PO
L
PR
T
EU
28
SV
K
NZ
L
IRL
OE
CD
CZ
E
DN
K
FIN
HU
N
CA
N
LVA
NLD
ES
P
BE
L
NO
R
US
A
CH
E
JPN
SW
E
KO
R

KEY POLICY INSIGHTS │ 37
OECD ECONOMIC SURVEYS EUROPEAN UNION 2018 © OECD 2018
This situation reflects years of low investment in digital infrastructure, and spending
remains low (EIB, 2017). The EU supports investments in connectivity through the
European Regional Development fund, the Connecting Europe Facility, the Juncker plan
and other tools. Such financing can contribute to alleviate the financing gap by easing
access to credit and leveraging support for high risk projects. The Commission has also
proposed the revision of the regulatory framework for electronic communication markets
to provide, among other aims, greater incentives for infrastructure investments in very
high capacity networks, especially in less viable areas. The Commission proposal requires
national regulators to refrain from imposing regulation on dominant operators regarding
new network elements when they offer a possibility for other operators to invest together
in new high capacity networks and provided that pre-defined conditions for such co-
investment offer are met. However, the body of European regulators for electronic
communications (BEREC, 2017) has warned that such co-investments can lead to anti-
competitive coordinated behaviours among operators and advised that to exempt co-
investment projects from regulation a case-by-case in depth assessment of competitive
dynamics would be advisable. The Council and the European Parliament have provided
amendments to the Commission’s proposal, reflecting their respective views on the rules
under which regulatory incentives should be granted. The legislative process is still on-
going.
Ensuring that everyone has the right skills for an increasingly digital and globalised world
is essential to promote inclusive labour markets and to spur innovation, productivity and
growth. At the moment, a shortage of people with the right digital skills is an important
bottleneck to greater digitalisation. Close to half of the EU population have insufficient
digital skills (Rute, 2017). The Commission is monitoring and forecasting supply and
demand of IT professionals in Europe and supporting the development of new curriculum
guidelines for schools and universities. The EU launched in June 2016 a Skills Agenda
for Europe that also aims at improving digital skills. These efforts are welcome and
should be stepped up by establishing common definitions of digital skill needs. The EU
could also help member states by developing data tools to monitor skills gaps.
Strengthening the labour market through greater labour mobility and a better EU-
level immigration policy
Some central European countries are already facing labour shortages and many
businesses see labour shortages as an important constraint to further investment. Now is
the time to build on national reforms to increase labour force participation of women,
youth and older workers to improve the labour market opportunities of these groups and
help alleviate labour shortages. Moreover Europe is rapidly ageing (Figure 25).
Immigration has played a role in attenuating the effects of ageing and has helped to fill in
labour shortages in the last two decades (EC-OECD, 2014) and it is likely to continue
doing so in the future, but immigration alone cannot compensate for Europe’s rising age
profile. Europe can do better at fostering labour mobility across Europe, attracting high
skilled migrants and integrating refugees (Table 5).

38 │ KEY POLICY INSIGHTS
OECD ECONOMIC SURVEYS EUROPEAN UNION 2018 © OECD 2018
Figure 25. Europe is rapidly ageing
1. Unweighted average.
2. Eastern European Member States, including Bulgaria, Croatia, Hungary, Poland, Romania,
Slovenia and the Czech and Slovak Republics; unweighted average.
3. Refers to Denmark, Finland, Sweden and the Baltic States; unweighted average.
Source: OECD (2018), OECD Health Statistics (database); United Nations (2017), World Population
Prospects, 2017 Revision.
StatLink 2 http://dx.doi.org/10.1787/888933748002
Table 5. Past OECD recommendations on labour market mobility and integration of
migrants
Recommendations in 2016 Economic Survey
Actions taken since 2016
Reduce the administrative burden associated with recognition of professional qualifications by using electronic procedures such as the European Professional Card.
In 2017, the European Commission presented a communication on reform recommendations for regulation in professional services addressed to each member state, a proposal on a proportionality test before adoption of new regulation of professions, and a proposal for a European services e-card simplifying administrative formalities required to provide services in another Member State. The Commission proposed establishing a single digital gateway to provide information, procedures, assistance and problem solving services.
Legislate effective portability of supplementary pension rights.
EU member states have been transposing Directive 2014/50/EU, with a deadline of 21 May 2018.
Simplify the eligibility requirements and procedures of the Blue Card scheme to make it more attractive to non-EU high-skilled labour migrants than existing schemes.
In June 2016, the Commission proposed a revision of the EU Blue Card Directive to harmonise conditions, procedures and rights.
Strengthen joint protection of external borders.
The European Border and Coast Guard was established in October 2016.
Speed up administrative decisions on asylum applications and ease labour market access for recognised refugees.
In July 2016, the Commission presented a second package of legislative proposals to complete the reform of the Common European Asylum System.
Fostering intra-EU mobility whilst respecting fair competition and workers’
rights
While growing steadily, intra-EU mobility is still relatively weak owing to linguistic and
cultural differences as well as policy barriers such as difficulties in having professional
qualifications recognised. Migration between EU countries stood at 3.9% of the EU
1.0
1.5
2.0
2.5
3.0
3.5
1965 1975 1985 1995 2005 2015
Germany FranceItaly SpainUnited Kingdom EU15¹
A. Fertility rateChildren per women aged 15 to 49 years
0
10
20
30
40
50
60
70
80
IRL
CE
E²
NLD EU
¹
BE
L
GB
R
ES
P
Nor
dics
³
FR
A
GR
C
PR
T
DE
U
ITA
2015 2050
B. Old-age dependency ratioPopulation aged 65+ per 100 population 15-64

KEY POLICY INSIGHTS │ 39
OECD ECONOMIC SURVEYS EUROPEAN UNION 2018 © OECD 2018
working age population in 2016 (about 11.8 million people), up from 1.6% in 2004,
though is still below inter-state mobility in the US or other federal systems (OECD,
2016b). Moreover, during the crisis, while labour mobility increased in the EU, its shock-
absorption role remained modest especially in the euro area (Jauer et al. 2014). Migration
flows directed towards the UK and Germany increased, as a result of significant outflows
from many Eastern European countries, while outflows from countries suffering deep
economic stress remained modest compared to their record-high unemployment rates.
The complexity and heterogeneity of the migration and integration patterns of highly
qualified intra-EU immigrants make it difficult to identify brain drain and gain processes
within the EU (Schellinger, 2017). On the one hand, outflows of highly-skilled workers,
if permanent and of large scale, can lead to skilled labour shortages in the sending
countries, weakening productivity and hurting growth. On the other hand, sending
countries may benefit from increased remittances or transnational networks (Chiswick,
2005), citizens’ strengthened incentives to invest in human capital (Beine et al., 2008) or
improved domestic labour allocation (Kaczmarczyk, 2015). Moreover, mobile workers,
especially young ones, may return to their home country later, bringing new experience
and new skills, acquired in the host country.
To mitigate the adverse effects of international mobility on their economies, sending
countries could create an environment that encourages potential mobile workers to stay
and that promotes their return. Beyond increasing investment in education and
innovation to create better jobs, sending countries could facilitate the validation of
experiences and skills acquired abroad and engage more actively with so-called
“diasporas” to advertise domestic business and job opportunities (OECD, 2016c; OECD,
2018e). By taking further steps to deepen the single market and a more effective use of
cohesion funds, the EU can also contribute to foster growth and convergence in sending
countries which could help to attract back mobile workers.
Language seems to be the most important barrier to intra-EU mobility (European
Commission, 2010). Evidence suggests that experiences abroad enhance students’ career
opportunities (Alfranseder et al., 2012), through improved knowledge of foreign
languages, acquisition of soft skills, or increased probability to pursue doctoral studies
(Grotheer et al., 2012). The 2014-2020 Erasmus+ programme has a budget of EUR 14.7
billion (around 1.3% of the EU budget), which can only offer learning mobility
opportunities to less than 4% of young people living in Europe (EC, 2018). Cultural
exchange programmes including the Erasmus + should be expanded to further facilitate
mobility. To make mobility opportunities more inclusive, the successor of the current
Erasmus+ programme could expand in particular its school and VET related parts and
include targeted actions for disadvantaged learners.
Better recognising the qualification of learners and skilled movers would also help to
enhance mobility. Qualification and training requirements to access regulated professions
vary widely across countries and the recognition of qualifications is often made on a case-
by-case basis, favouring uncertainty. Increased harmonisation of professions’ curricula at
the EU level beyond the seven professions currently covered could help make recognition
of qualifications more automatic. The recently introduced electronic European
Professional Card that ensures the recognition of professional qualifications via digitally-
secured information exchanges between authorities should be equally generalised. Further
reducing the high barriers to access regulated professions, whose number remains high, in
many countries (Figure 26), could further support mobility, as well as long-term
productivity growth.

40 │ KEY POLICY INSIGHTS
OECD ECONOMIC SURVEYS EUROPEAN UNION 2018 © OECD 2018
Figure 26. In many EU countries the number of regulated professions is high
Number of regulated professions by main sector, 2016
Source: European Commission (2017), Regulated Professions Database.
StatLink 2 http://dx.doi.org/10.1787/888933748021
Persisting differences in the principles and generosity of national social security systems
still complicate migration (Meyer et al., 2013). Strengthened mobility incentives require
more harmonised social security systems. While the EU has no competence to harmonise
the social security systems, the EU has rules in place to coordinate national systems to
make sure people do not lose their social security rights when moving to another member
state. Improvements in the portability of pension rights as well as the recent Commission
proposal to extend the exportability of unemployment benefits from three to six months
or make the country of last employment responsible for paying cross-border workers’
benefits (instead of the country of residence) have contributed to ease EU-movers’
concerns about their social rights. Moreover, the Electronic Exchange of Social Security
Information (EESSI), a secured digital platform linking EU social security institutions –
at national, regional and local levels – to be implemented by all participating countries by
mid-2019, will allow for a quicker, easier and secure exchange of social security
information throughout the EU, thus facilitating administrative processes. Citizens who
have lived and worked in several of the participating countries will see their social
security benefits calculated quicker and more efficiently. The platform, if backed by
single European social security and business registration numbers, could also effectively
contribute to ease administrative burdens and improve cross-border monitoring and
surveillance (Aussilloux et al., 2017).
Having grown by more than 40% since 2010 (Pacolet and De Wispelaere, 2016), workers
who are employed in one member state and are sent by their employer temporarily to
another member state (posted workers) have become a sensitive political issue, despite
accounting for less than 1% of total EU employment in 2015. Their strong concentration
in labour-intensive sectors (construction, manufacturing as well as health, education and
professional services), coupled with significant wage differences between local and
posted workers of up to 50% in some sectors, have led to growing fears of wage and
0
100
200
300
400
500
600
0
100
200
300
400
500
600
LTU SWE EST LUX BEL FIN NLD DEU GRC DNK ITA ESP IRL GBR AUT PRT FRA SVN LVA SVK POL CZE HUN
Health and social services
Business services
Public services and education
Other sectors
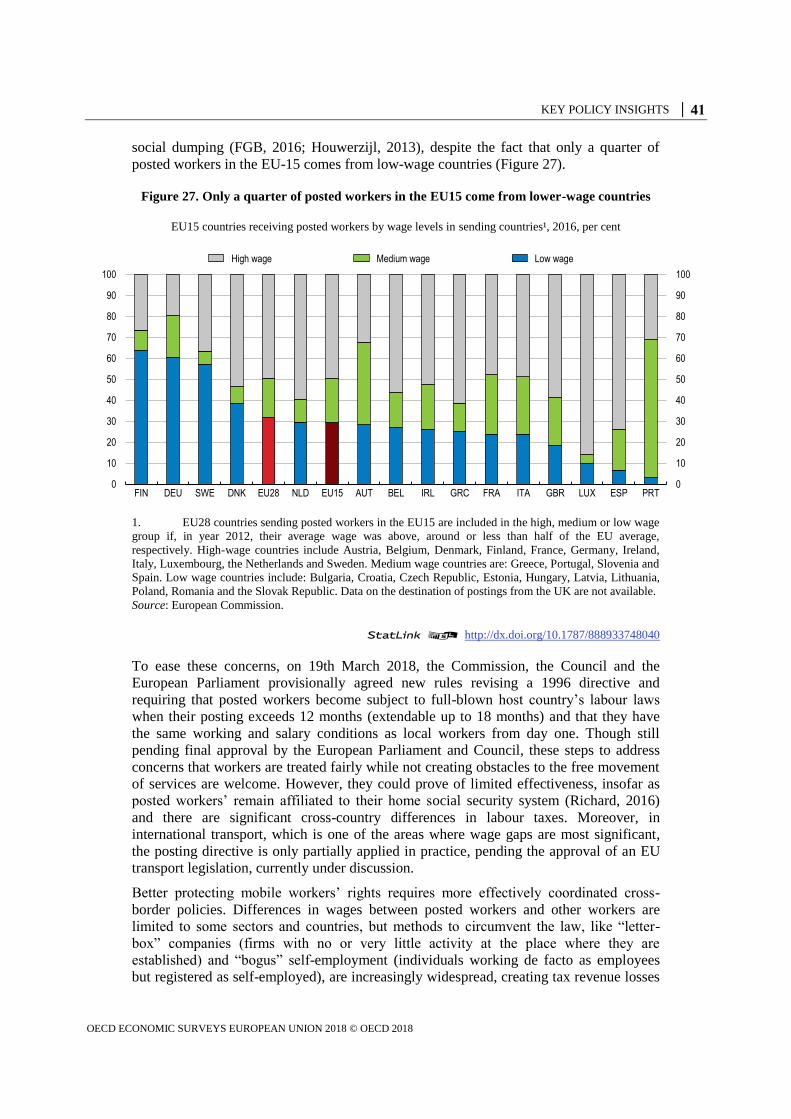
KEY POLICY INSIGHTS │ 41
OECD ECONOMIC SURVEYS EUROPEAN UNION 2018 © OECD 2018
social dumping (FGB, 2016; Houwerzijl, 2013), despite the fact that only a quarter of
posted workers in the EU-15 comes from low-wage countries (Figure 27).
Figure 27. Only a quarter of posted workers in the EU15 come from lower-wage countries
EU15 countries receiving posted workers by wage levels in sending countries¹, 2016, per cent
1. EU28 countries sending posted workers in the EU15 are included in the high, medium or low wage
group if, in year 2012, their average wage was above, around or less than half of the EU average,
respectively. High-wage countries include Austria, Belgium, Denmark, Finland, France, Germany, Ireland,
Italy, Luxembourg, the Netherlands and Sweden. Medium wage countries are: Greece, Portugal, Slovenia and
Spain. Low wage countries include: Bulgaria, Croatia, Czech Republic, Estonia, Hungary, Latvia, Lithuania,
Poland, Romania and the Slovak Republic. Data on the destination of postings from the UK are not available.
Source: European Commission.
StatLink 2 http://dx.doi.org/10.1787/888933748040
To ease these concerns, on 19th March 2018, the Commission, the Council and the
European Parliament provisionally agreed new rules revising a 1996 directive and
requiring that posted workers become subject to full-blown host country’s labour laws
when their posting exceeds 12 months (extendable up to 18 months) and that they have
the same working and salary conditions as local workers from day one. Though still
pending final approval by the European Parliament and Council, these steps to address
concerns that workers are treated fairly while not creating obstacles to the free movement
of services are welcome. However, they could prove of limited effectiveness, insofar as
posted workers’ remain affiliated to their home social security system (Richard, 2016)
and there are significant cross-country differences in labour taxes. Moreover, in
international transport, which is one of the areas where wage gaps are most significant,
the posting directive is only partially applied in practice, pending the approval of an EU
transport legislation, currently under discussion.
Better protecting mobile workers’ rights requires more effectively coordinated cross-
border policies. Differences in wages between posted workers and other workers are
limited to some sectors and countries, but methods to circumvent the law, like “letter-
box” companies (firms with no or very little activity at the place where they are
established) and “bogus” self-employment (individuals working de facto as employees
but registered as self-employed), are increasingly widespread, creating tax revenue losses
0
10
20
30
40
50
60
70
80
90
100
0
10
20
30
40
50
60
70
80
90
100
FIN DEU SWE DNK EU28 NLD EU15 AUT BEL IRL GRC FRA ITA GBR LUX ESP PRT
High wage Medium wage Low wage

42 │ KEY POLICY INSIGHTS
OECD ECONOMIC SURVEYS EUROPEAN UNION 2018 © OECD 2018
and possibly abuses of workers’ rights (Wickham and Bobek, 2016). To strengthen
transnational coordination in the fight against fraud, a 2014 EU directive has clarified and
enhanced administrative cooperation procedures and improved tools for controlling the
lawful nature of postings and hiring businesses (Cremers, 2016). In addition, deadlines to
respond to cross-border requests for information have been significantly shortened.
Although welcome, these measures disregard the impact the likely surge in cross-border
information requests and infringement procedures will have on the already understaffed
national labour inspectorates (Walters, 2016). At the national level, strengthening national
labour inspectorates would help. At the EU level, a recent proposal to set up a European
Labour Authority to better coordinate the design and organisation of joint cross-border
labour, social security and tax control and monitoring activities could boost the
effectiveness of transnational efforts against labour fraud and undeclared work.
A better EU approach to immigration
The EU is underachieving on the global competition for talent (Figure 28, Panel A;
OECD, 2016d). One key problem is that labour market and migration regulations are
different in each member state. The Blue Card, an EU-wide scheme, allowing high skilled
non-EU citizens to work and live in any EU country (excluding Denmark, Ireland and the
UK), was designed to make the EU attractive to skilled migrants by offering common
admission conditions and set of rights for highly skilled foreigners to live and work in the
EU – including provisions for intra-EU mobility and better long-term residence rights.
However, the EU Blue Card has proven to be insufficiently attractive, with only a limited
number of permits issued (Figure 28, Panel B). Restrictive admission conditions and
different rules, conditions and procedures across the EU have limited the use of the
scheme (EC, 2016). As recommended in the 2016 Survey, the scheme should be
modernised and its eligibility requirements and procedures simplified, so it is more often
used (Table 5). In June 2016, the Commission proposed a revision of the EU Blue Card
Directive to harmonise conditions, procedures and rights.
Integrating refugees early is key to improving their wellbeing and labour market
opportunities and to strengthen people’s trust. Europe has experienced the largest inflow
of asylum seekers since World War II, with 3.6 million first-time asylum applications
since early 2013 ( 29, OECD 2017d), and this is an important concern for Europeans, as
shown by the Eurobarometer Surveys. At the EU level a coordinated and comprehensive
policy response is essential to effectively integrate asylum seekers as the 2016 Survey
argued (Table 5). The best way to integrate newcomers is to get them into work quickly.
Boosting early labour market access, further increasing places for integration programmes
and language training (including vocational language training), accurately assessing the
skill levels of immigrants and tying the dispersion of asylum seekers more to areas with
better labour market conditions in the host country could all improve the wellbeing of
migrants and promote more inclusive growth (OECD, 2017g). In a welcome move, the
Commission has developed a skills profile tool to support early identification of the skills
and work experience of refugees, migrants and other third country nationals and to
provide guidance on training, education or employment. The influx of refugees included
many children, and educating them will be crucial for their long-term integration. For
instance Germany, has recruited new teachers and set up one-year “welcome classes” for
newcomers with a focus on language teaching.

KEY POLICY INSIGHTS │ 43
OECD ECONOMIC SURVEYS EUROPEAN UNION 2018 © OECD 2018
Figure 28. The attractiveness of the EU to foreign migrants, especially highly skilled ones, is
still relatively limited
1. 2015 for the United States, 2014 for Australia-New Zealand and 2013 for Canada.
2. Mid-year estimate, excluding intra-EU mobility.
3. Excluding bilateral mobility between Australia and New Zealand themselves.
4. The EU Blue Card offers highly educated and skilled workers of non-EU countries the opportunity
and the right to work and stay in the European Union.
Source: Eurostat (2018), "Population Statistics", Eurostat Database; OECD (2018), International Migration
Statistics (database).
StatLink 2 http://dx.doi.org/10.1787/888933748059
Figure 29. The inflow of refugees is an important challenge
1. Asylum seekers' most favourable waiting periods for labour market access in a selection of EU
countries.
2. Access to labour market is granted under certain conditions.
Source: Eurostat (2018), "Asylum and managed migration", Eurostat Database; OECD (2016), Migration
Policy Debates No. 10.
StatLink 2 http://dx.doi.org/10.1787/888933748078
0
5
10
15
20
25
30
European Union² United States Canada Australia andNew Zealand³
A. Stock of foreign-born populationForeign-born residents in % of total population, 2016¹
0
5
10
15
20
25
2012 2013 2014 2015 2016
B. Number of Blue Cards granted in the EUThousands 4
0
20
40
60
80
100
120
140
160
180
2014 2015 2016 2017
A. First time asylum applications in the EUPer month, thousands
0
2
4
6
8
10
12
GR
C²
SW
E²
ITA
AU
T²
DE
U²
FIN
²
BE
L
NLD
PO
L
ES
P
CZ
E
FR
A²
LUX
SV
N
GB
R
B. Asylum seekers' waiting periods for accessing labour markets¹
Months

44 │ KEY POLICY INSIGHTS
OECD ECONOMIC SURVEYS EUROPEAN UNION 2018 © OECD 2018
Strengthening the drive to fight climate change
According to a recent Eurobarometer, over 90% of Europeans see climate change as a
serious problem (EC, 2017g). Emissions of CO2 per capita and per unit of GDP are higher
than the OECD average but have been steadily declining (Figure 30). In 2007, the EU
pledged to reduce its greenhouse gas emissions by at least 20% from their 1990 levels by
2020. The EU is on track to meet its target to reduce its greenhouse gas emissions by at
least 20% from their 1990 levels by 2020, partly because of the impact of the recession.
Most countries are expected to reach their 2020 targets (EC, 2017h).
Figure 30. C02 intensity and energy intensity have fallen in the EU
Source: OECD (2018), Green Growth Indicators (database).
StatLink 2 http://dx.doi.org/10.1787/888933748097
The main EU-level policy instrument – the EU emissions trading system (ETS) – is
supplemented by a battery of EU legislation mandating various intermediate targets
(Figure 31).Under the Paris agreement, the EU and its member states have collectively
committed to decrease their domestic greenhouse gas emissions by at least 40 % by 2030
from 1990 levels (Figure 31). On current policies, greenhouse gas emissions are projected
to exceed the 2030 target.
Figure 31. Agreed EU headline targets for climate and energy
Source: European Commission (2017), Third Report on the State of the Energy Union.
A. CO2 intensity B. Energy intensity
0.0
0.2
0.4
0.6
0.8
1.0
1990 2014
CO2 per GDP - production based(kg/USD, 2010 PPP prices)
OECD
EU28
0
5
10
15
20
25
1995 2014
CO2 tonnes per capita,demand and production based
OECD
EU28Demand
Demand
Production
Production
0
5
10
15
20
1990 2002 2014
Total primary energy supply per GDP (ktoe/100 USD 2010 PPP)
OECD
EU28
0
2
4
6
8
10
12
14
1990 2002 2014
% of renewables in totalprimary energy supply
OECD
EU28
- 20 %Greenhouse Gas
Emissions
20 %Renewable
energy
20 %Energy
efficiency
10 %Interconnection
≥ - 40 %Greenhouse Gas
Emissions
≥ 27 %Renewable
energy
≥ 30 %Energy
efficiency
15 %Interconnection
2020
2030

KEY POLICY INSIGHTS │ 45
OECD ECONOMIC SURVEYS EUROPEAN UNION 2018 © OECD 2018
The ETS is often regarded as the main tool for cutting emissions, but it has probably had
a limited impact when it comes to driving low-carbon investments: the price of emission
allowances, which has long been under 10 euros per tonne, is too low to drive long-term
low-carbon investments. Estimates suggest that a carbon price of 30 euros would be
needed to make onshore wind investment profitable, while a price of 40 euros would be
required to shift production from coal to gas, according to analysis from the International
Energy Agency and business groups (EIA, 2014). This low ETS price is due to a
combination of low economic growth, extensive promotion of renewable energy and the
large inflow of international credits from the Clean Development Mechanism. The supply
of credits has exceeded emissions, leading to a surplus of unused CO2 emission
allowances.
Some recent measures aim at making the ETS more effective. In November 2017, EU
negotiators agreed to reduce the number of allowances by 2.2% per year from 2021 on
(Table 6). It may take some time for this to have an impact. In addition, the so-called
Market Stability Reserve (“MSR”) agreed in 2015 will start operating as of 1 January
2019 with a view to address the current surplus of allowances. Whenever the surplus
exceeds a predefined threshold of 833 million allowances (equivalent to almost one half
of current annual emissions of installations covered by the ETS), some allowances due to
be auctioned will not be auctioned but will instead be placed in the MSR, thus tightening
the annual supply of allowances further. The amount thus placed in the MSR in a year
will be 24% of the surplus for the first five years of its operation and 12% of the surplus
after that. If the surplus falls below 400 million allowances, allowances from the MSR
will be released for auction.
Also in November 2017, changes to the Market Stability Reserve were agreed, enabling it
to double the speed at which it absorbs the surplus in the first five years of its operation
and introducing the provision that allowances in the MSR above a previous year’s auction
volume will lose their validity as from 2023 onwards, meaning that they cannot be
released back into market. This measure could be a useful tightening. Phasing out of free
permits outside the electricity sector could further strengthen low carbon investment
signals (Flues and Van Dender, 2017).
Table 6. Past OECD recommendations on environmental policy
Recommendations in 2016 Economic Survey
Actions taken since 2016
To ensure a functioning EU carbon market, reform the ETS by reducing the emissions cap and introducing a reserve of allowances to smooth market fluctuations.
The EU has revised the EU ETS and corresponding legislation for the period after 2021. The cap will be reduced by 2.2% per year as of 2021 and the Market stability reserve, to address the surplus and improve the ETS’s resilience to major shocks, will start operating as of 1 January 2019.
The absence of some key emitters from the ETS, notably fuel for transport, commercial
and household heating, means that other policies have to be used to tackle those sectors.
Transport is the EU’s second-biggest greenhouse-gas emitter after energy and is generally
the main cause of air pollution in cities. It represents a rising proportion, currently about
one fifth, of greenhouse gas emissions (Figure 32), with road transport accounting for
some 80% of these (EC, 2017f). EU Member States have the possibility of including the
transport sector – or any other sector – in the ETS.

46 │ KEY POLICY INSIGHTS
OECD ECONOMIC SURVEYS EUROPEAN UNION 2018 © OECD 2018
Figure 32. The rising share of transport in European Union GHG emissions
Emissions of greenhouse gases¹
1. Excluding land use, land-use change and forestry (LULUCF).
Source: Eurostat (2017), "Greenhouse gas emissions by source sector", Eurostat Database; European
Environment Agency.
StatLink 2 http://dx.doi.org/10.1787/888933748116
Widening the ETS to include transport and all other uses of fossil fuels, with a cap to
match the 2030 target, would move the EU towards a simpler, more direct and more cost-
effective policy: the various intermediate targets and sector-specific policies could be
progressively eliminated. Relying fully on the ETS implies some risk of very high
emission allowance prices in some circumstances, but a phased approach, which would
be necessary anyway, would minimise this risk.
While a widened ETS is the best tool to reduce GHG emissions in nearly all sectors, other
policies matter. For example, taxation, public procurement, land-use policies and urban
planning can all be more or less climate friendly; urban planning is especially important
as it constrains choices on transport and heating for long into the future. The OECD
Aligning Policies report (OECD, 2015) surveys a wide range of such policies. Policies in
agriculture and waste, whose emissions are difficult to include in the ETS, may also need
reinforcing; a cost benchmark related to the ETS allowance price (or estimated costs of
other mitigation policies if these continue to dominate) could be applied. Moreover, the
Commission has issued in March 2018 an Action Plan for Financing Sustainable Growth
to be rolled out in 2019, which aims at re-orienting capital flows towards sustainable
investment, to manage financial risks stemming from climate change and to foster
transparency in financial and economic activity (EC, 2018b).
Instead of mandating the inclusion of transport in the ETS, the EU authorities are
planning a battery of measures for the sector: in July 2016 the Commission adopted an
EU Strategy for low emission mobility (EC, 2017f) addressing key levers: efficiency of
the transport system, low – emission alternative energy for transport and low and zero
emission vehicles. The Commission has now proposed legislative initiatives to
implements this strategy, including: 1) revisions of Eurovignette, Clean vehicles and
Energy, excluding transport
62%
Transport15%
Industrial processes
and product use9%
Agriculture10%
Waste4%
Energy, excluding transport
56%
Transport23%
Industrial processes
and product use8%
Agriculture10%
Waste3%
A. 1990 B. 2015

KEY POLICY INSIGHTS │ 47
OECD ECONOMIC SURVEYS EUROPEAN UNION 2018 © OECD 2018
Combined Transport Directives, 2) a recast of the renewable Energy directive with a
blending mandate on fuel suppliers to ensure that by 2030 at least 6.8% of low-carbon
and renewable fuels will enter the EU market, and 3) a proposal for CO2 emission
standards for new cars and vans. The latter proposal also includes incentives for zero and
low-emissions vehicles. The overall level of taxation on emission-creating activity will
need to increase. The EU cannot act directly on taxation, but minimum levels can be
agreed on: the tax on diesel fuel should always be higher than that on petrol, since it emits
at least as much and usually more pollution, including CO2, per litre consumed. Despite
signs of change, diesel taxes per litre remain lower than those on petrol in many countries
(OECD, 2018f).

48 │ KEY POLICY INSIGHTS
OECD ECONOMIC SURVEYS EUROPEAN UNION 2018 © OECD 2018
Bibliography
Alfranseder, E., J. Escrivá, J. Fellinger, A. Haley, A. Nigmonov, and M. Taivere (2012),
“Exchange,employment and added value”, Research report of the ESN Survey 2011, Erasmus Student
Network (ESN) AISBL. Brussels. http://www.esn.org/sites/default/files/esnsurvey2011_web.pdf
Andrews, D., C; Criscuolo, and P. Gal (2017), “The Best vs. the Rest: The Global Productivity
Slowdown Hides an Increasing Performance Gap across Firms”, VoxEU.org, 27 March.
Andrews, D., C. Criscuolo and P. Gal (2016), “The Best versus the Rest: The Global Productivity
Slowdown, Divergence Across Firms And the Role of Public Policy”, OECD Productivity Working
Papers, No. 5, OECD Publishing, Paris. DOI: http://dx.doi.org/10.1787/63629cc9-en
Aussilloux, V., A. Bénassy-Quéré, C. Fuest and G. Wolff (2017), “Making the Best of the European
Single Market”, Policy Contribution, Issue No. 3, Bruegel.
Bachtler, J. J. Oliveira Martins and P. Zuber (2017), Towards Cohesion Policy 4.0 - Structural
Transformation and Inclusive Growth, Regional Studies Association Europe.
Bank of England (2018), “FPC judgement of progress against actions to mitigate the risk of disruption to
end users of financial services as at 12 March 2018”.
Beine, M., F. Docquier and H. Rapoport (2008), “Brain Drain and Human Capital Formation in
Developing Countries: Winners and Losers”, The Economic Journal, 118 (528), 631-652.
BEREC (2017), “BEREC views on Article 74 of the draft Code Co-investment and “very high-capacity
(VHC) networks”, BEREC Press Releases.
Broadbent, B. (2015), “Compositional Shifts in the Labour Market”, speech at Bank of England
conference ‘Understanding the Great Recession: From Micro to Macro’, September.
Chiswick, B. (2005), “High Skilled Immigration in the International Arena”, IZA Discussion Paper No.
1782.
Colantone, I and P Stanig (2016) “Global competition and Brexit”, BAFFI CAREFIN Centre Research
Paper 2016-44, November.
CPB (2012), “Fertile soil for Structural Funds?: A panel data analysis of the conditional effectiveness of
European Cohesion Policy”, CPB Discussion Papers.
Cremers, J., (2017), “Towards a European Labour Authority: Mandate, Main Tasks and Open
Questions”, Friedrich-Ebert-Stiftung Foundation.
Cremers, J., (2016), “Economic Freedoms and Labour Standards in the European Union”, Transfer:
European Review of Labour and Research, Vol 22, Issue 2, pp. 149-162.
Daly, M. and B. Hobijn (2017), “Composition, Selection and Aggregate Real Wage Growth”, American
Economic Review (Papers and Proceedings), 107(5), 349-52.
Dhéret, C., and A. Ghimis (2016), “The Revision of the Posted Workers Directive: Towards a Sufficient
Policy Adjustment?”, EPC Discussion Paper, European Policy Centre.
Dustmann, C, B Eichengreen, S Otten, A Sapir, G Tabellini and G Zoega (2017), Europe’s Trust Deficit:
Causes and Remedies, Monitoring International Integration 1, CEPR Press.
ECB (2017), “Financial Stability Review”, November.
ECB (2016), “The productivity challenge for Europe”, Lectio magistralis by Mario Draghi, President of
the ECB, marking the 100th anniversary of the Deusto Business School.

KEY POLICY INSIGHTS │ 49
OECD ECONOMIC SURVEYS EUROPEAN UNION 2018 © OECD 2018
EIB (2017), “EIB Investment Survey - Tracking investment needs and constraints across Europe”.
European Banking Authority (2017), “Risk assessment of the European Banking System”, November
2017.
European Commission (2018a), “A new modern Multiannual Financial Framework for a European
Union that delivers efficiently on its priorities post-2020”, Communication from the Commission to
the European Parliament, the European Council and the Council.
European Commission (2018b), “Action Plan for Financing Sustainable Growth”, Communication from
the Commission to the European Parliament, the European Council, the Council, the European
Central Bank, the European Economic and Social Committee and the Committee of the Regions.
European Commission (2017a), “Possible Impact of Brexit on the EU Budget, and in particular, CAP
Funding”, Directorate General for Internal Policies.
European Commission (2017b), “LAB-FAB-APP: Investing in the European Future we want” Report of
the independent High Level Group on maximising the impact of EU Research & Innovation
Programmes.
European Commission (2017c), “Reflection Paper on the Future of EU Finances”, COM(2017),
28.06.2017, 358 Final.
European Commission (2017d) “Recommendation for a Council Recommendation on the Economic
Policy of the Euro Area”
European Commission (2017e), “Proposal for a Directive of the European Parliament and of the Council
on the legal and operational framework of the European services e-card introduced by Regulation”,
Commission Staff Working Paper.
European Commission (2017f), “Digital Transformation Scoreboard. Evidence of Positive Outcomes and
Current Opportunities for EU Businesses”. Brussels
European Commission (2017g), “Eurobarometer on Climate Change”, September 2017.
European Commission (2017h), “Two Years After Paris: Progress towards meeting the EU’s climate
commitments”, European Commission, November 2017.
European Commission (2016), “An improved EU Blue Card scheme and the Action Plan on Integration”,
European Commission Fact Sheet.
European Commission (2015a), “A Single Market Strategy for Europe- Analysis and Evidence”,
Commission Staff Working Paper SWD(2015) 202 final, 28 October.
European Commission (2015b), “State of the Energy Union 2015”, Communication COM(2015) 572
final, European Commission, Brussels.
European Commission (2012a), “Deterrence of Fraud with EU Funds through investigative journalism in
EU27”, Directorate General for Internal Policies.
European Commission (2012b), “Single Market Act II, Together for New Growth”, Communication
from the Commission to the European Parliament, the Council, the European Economic and Social
Committee and the Committee of the Regions, COM(2012) 573.
European Commission (2010), “Geographical and Labour Market Mobility”, Special Eurobarometer 337,
Brussels.
European Court of Auditors (2017a) “The Commission Negotiation of 2014-2020 Partnership
Agreements and Programmes in Cohesion”, Special Report No 2/2017.

50│ KEY POLICY INSIGHTS
OECD ECONOMIC SURVEYS EUROPEAN UNION 2018 © OECD 2018
European Court of Auditors (2017b), “Speech by Klaus-Heiner Lehne, President of the European Court
of Auditors, Presentation of the ECA’s 2016 Annual Report”, September 2017.
European Court of Auditors (2017c), “Fighting Fraud in EU Spending”, October 2017.
European Court of Auditors (2016), “EU budget: time to reform”, October 2016.
Fondazione Giacomo Brodolini, FGB (2016), “Study on wage setting systems and minimum rates of pay
applicable to posted workers in accordance with Directive 96/71/EC in a selected number of Member
States and sectors”, Report prepared for the European Commission.
Flues, F. and K. van Dender (2017), "Permit allocation rules and investment incentives in emissions
trading systems", OECD Taxation Working Papers, No. 33, OECD Publishing, Paris,
http://dx.doi.org/10.1787/c3acf05e-en
Grotheer, M., S. Isleib, N. Netz, and K. Briedis (2012), “Hochqualifiziert und gefragt: Ergebnisse der
zweiten HIS-HF Absolventenbefragung des Jahrgangs 2005”, HIS Hochschul-Informations-System.
Hannover.
Hass, J. and E. Rubio “Brexit and the EU Budget: Threat or Opportunity”? Jacques Delors Institute
Policy Paper.
Houwerzijl, M.S. (2013), “The Dutch Understanding of Posting of Workers in the Context of Free
Services Provision and Enlargement: A Neutral Approach?”, in S. Evju, Cross-Border Services,
Posting of Workers, and Multilevel Governance, Vol. 193.
IEA (2014), Energy Policies of IEA Countries: European Union 2014 Review, International Energy
Agency, Paris, http://dx.doi.org/10.1787/9789264190832-en
Jauer, J. et al (2014), “ Migration as an adjustment mechanism in the crisis? A comparison of Europe and
the United States”, OECD Social, Employment and Migration Working Papers, no. 155.
Kaczmarczyk, P. (2015), “Between Brain Drain and Brain Gain: The Case of Poland”, Friedrich Ebert
Foundation, Bonn.
Katz, L. and A. Krueger (2016), “The Rise and Nature of Alternative Work Arrangements in the United
States”, NBER WORKING PAPER SERIES, No. 22667, http://www.nber.org/papers/w22667.pdf
(accessed on 23 November 2017).
Kierzenkowski R. et al. (2016), “The Economic Consequences of Brexit: A Taxing Decision”, OECD
Economic Policy Papers, http://dx.doi.org/10.1787/2226583X
Meyer, T., P. Bridgen and C. Andow (2013),”Free Movement? The Impact of Legislation, Benefit
Generosity and Wages on the Pensions of European Migrants”, Population, Space and Place, Vol. 19,
pp. 714-726.
Monti et al. (2017) “Future Funding of the EU: Final report and recommendations of the high level group
on own resources”, December 2016.
OECD (2018a), Productivity and Jobs in a Globalised World: (How) can all regions benefit?, Center for
Entrepreneurship, SMEs, Local Development and Tourism,
https://one.oecd.org/document/CFE/RDPC(2017)7/en/pdf
OECD (2018b), “Policy considerations in the current economic situation”, Economics Department,
Economic Policy Committee.
OECD (2018c), OECD Economic Surveys – Ireland, OECD Publishing, Paris.
OECD (2018d), OECD Economic Surveys – Germany, OECD Publishing, Paris.
KEY POLICY INSIGHTS │ 51
OECD ECONOMIC SURVEYS EUROPEAN UNION 2018 © OECD 2018
OECD (2018e), OECD Reviews of Labour Market and Social Policies: Lithuania, OECD Publishing,
Paris.
OECD (2018f), Taxing Energy Use 2018: Companion to the Taxing Energy Use Database, OECD
Publishing, Paris. http://dx.doi.org/10.1787/9789264289635-en
OECD (2017a), Economic Policy Reforms 2017: Going for Growth, OECD Publishing, Paris.
http://dx.doi.org/10.1787/growth-2017-en
OECD (2017b), OECD Economic Outlook, Volume 2017, Issue 2, OECD Publishing, Paris. DOI:
http://dx.doi.org/10.1787/eco_outlook-v2017-2-en
OECD (2017c), OECD Economic Surveys – United Kingdom, OECD Publishing, Paris.
http://dx.doi.org/10.1787/eco_surveys-gbr-2017-en
OECD (2017d), “Evaluation of Agricultural Policy Reforms in the European Union: The Common
Agricultural Policy (CAP) 2014-20”, OECD Publishing, Paris.
http://dx.doi.org/10.1787/9789264278783-en
OECD (2017e), “Budgeting and performance in the European Union: A review by the OECD in the
context of EU budget focused results”, OECD Journal of Budgeting, Volume 2017/1.
OECD (2017f), OECD Employment Outlook 2017, OECD Publishing, Paris.
http://dx.doi.org/10.1787/empl_outlook-2017-en
OECD (2017g), OECD Economic Outlook, Volume 2017, Issue 1, OECD Publishing, Paris. DOI:
http://dx.doi.org/10.1787/eco_outlook-v2017-2-en
OECD (2016a), OECD Economic Surveys: Czech Republic 2016, OECD Publishing, Paris.
http://dx.doi.org/10.1787/eco_surveys-cze-2016-en
OECD (2016b), OECD Economic Surveys – European Union, OECD Publishing, Paris.
OECD (2016c), OECD Economic Surveys: Poland 2016, OECD Publishing, Paris.
OECD (2016d), “Recruiting Immigrant Workers: Europe 2016”, OECD Publishing, Paris.
http://dx.doi.org/10.1787/9789264257290-en
OECD/IEA/NEA/ITF (2015), Aligning Policies for a Low-carbon Economy, OECD Publishing, Paris.
http://dx.doi.org/10.1787/9789264233294-en
OECD (2014), OECD Economic Surveys: Slovak Republic 2014, OECD Publishing.
http://dx.doi.org/10.1787/eco_surveys-svk-2014
Pacolet, J. and F. De Wispelaere (2016), “Posting of Workers – Report on A1 Portable Documents
Issued in 2015”, Report prepared for the European Commission.
Richard, S., (2016), “The Implementing Directive on Posted Workers: and What Now?”, European
Issues No. 383, Fondation Robert Schuman.
Schellinger, E. (2017), “Brain Drain – Brain Gain: European Labour Markets in Times of Crisis”,
Friedrich Ebert Foundation, Bonn.
Walters, D., (2016), “Labour Inspection and Health and Safety in the EU”, Hesa-Mag No. 14, Special
Report 3/34, European Trade Union Institute.
Wickham, J. and A. Bobek (2016), “Bogus Self-Employment in the Irish Construction Industry”, Report
submitted to the Irish Department of Finance.

52 │ KEY POLICY INSIGHTS
OECD ECONOMIC SURVEYS EUROPEAN UNION 2018 © OECD 2018

ANNEX – PROGRESS IN STRUCTURAL REFORMS │ 53
OECD ECONOMIC SURVEYS EUROPEAN UNION 2018 © OECD 2018
Annex - Progress in main structural reforms
This annex reviews action taken on recommendations from previous Surveys since the
June 2016 European Union Survey.

54 │ ANNEX – PROGRESS IN MAIN STRUCTURAL REFORMS
OECD ECONOMIC SURVEYS EUROPEAN UNION 2018 © OECD 2018
Main recommendations Action taken since the previous Survey (2016)
A. Developing market-based financing alternatives for firms
Ease the regulatory treatment of simple, transparent and standardised securitisation to unlock lending to small and medium-sized enterprises.
The amended Capital Requirements Regulation, reflecting the adoption of the new securitisation framework, was published in the EU Official Journal on 28 December 2017. Work is ongoing on the adaptation of Solvency II implementing measures, with a view that, like the STS package, they enter into application on 1 January 2019.
Collect and share internationally comparable credit information on smaller firms.
No regulatory action taken. In the context of the Capital Markets Union (CMU), the Commission issued a staff working document with best practices on SME advisory support. In the context of the CMU Mid-term Review, the political conclusions reached in July 2017 agreed that enhancing the cost-effective availability of SMEs' information should be pursued initially by building on voluntary initiatives by the private sector and, should this approach fail to deliver its expected benefits, through other means that would have the potential to be more effective.
Lower capital requirements for long-term and infrastructure investment.
The European Commission has adopted an amendment of the Solvency II Delegated Act lowering capital requirements for investments in qualifying infrastructure corporates. In a previous amendment the capital charges for investments in qualifying infrastructure projects had already been reduced..
As far as banking regulation is concerned, the Commission in its proposal to amend the CRD, adopted in 2016, has included a more risk-sensitive treatment of infrastructure projects fulfilling a set of requirements able to reduce their riskiness.
Lower the regulatory barriers in corporate bond markets by addressing issues in securities ownership and harmonising insolvency proceedings.
With regard to securities ownership, the Commission held a public consultation on third party effects of transactions in securities and claims.
Regarding the harmonisation of insolvency proceedings, the Commission proposed, in November 2016, a Directive for preventive restructuring frameworks, second chance and measures to increase the efficiency of restructuring, insolvency and discharge procedures. The Commission consulted publicly on measures to enhance the protection of secured creditors. The Commission services are undertaking a benchmarking of national loan enforcement and insolvency regimes from a bank creditor perspective.
B. Enhancing labour market mobility and integration
Reduce the administrative burden associated with recognition of professional qualifications by using electronic procedures such as the European Professional Card.
In 2017, the European Commission presented a communication on reform recommendations for regulation in professional services addressed to each Member State, a proposal on a proportionality test before adoption of new regulation of professions, and a proposal for a European services e-card simplifying administrative formalities required to provide services in another Member State.
Legislate effective portability of supplementary pension rights.
Member States have been transposing Directive 2014/50/EU on minimum requirements for enhancing worker mobility between Member States by improving the acquisition and preservation of supplementary pension rights, to meet the deadline of 21st May 2018.
Simplify the eligibility requirements and procedures of the Blue Card scheme to make it more attractive to non-EU high-skilled labour migrants than existing schemes.
In June 2016, the Commission proposed a revision of the Blue Card Directive in order to make it a truly EU-wide scheme with more harmonised conditions, procedures and rights and where parallel national schemes would not be allowed. Moreover rights of Blue Card holders would be reinforced in terms of labour market access, intra-EU mobility, family reunification and access to EU long-term residence status.
Strengthen joint protection of external borders.
The European Border and Coast Guard has been established in October 2016.
Speed up administrative decisions on asylum applications and ease labour market access for recognized refugees.
In July 2016, the Commission presented a second package of legislative proposals to complete the reform of the Common European Asylum System (CEAS). The proposal for an Asylum Procedure Regulation simplifies, streamlines and consolidates procedural arrangements and provides for short but reasonable time limits throughout the procedure to ensure fast but high quality decisions. The proposal for a recast Reception Conditions Directive ensures that asylum seekers are given effective access to the labour market within 6 months from the application for international
ANNEX – PROGRESS IN STRUCTURAL REFORMS │ 55
OECD ECONOMIC SURVEYS EUROPEAN UNION 2018 © OECD 2018
protection was lodged. The proposal for a Qualification Regulation sets uniform standards for recognising persons in need of protection and rights granted to beneficiaries of international protection, and clarifies employment related equal treatment rights.
C. Connecting network sectors would foster internal market and green growth
Improve the quality of impact assessment of legislative proposals, notably amendments, and the quality of ex post evaluation of policies.
An interinstitutional agreement adopted in 2016 expands the commitment to impact assessment also to the legislators where appropriate for their substantive amendments and includes a commitment by all three institutions to appropriate reporting, monitoring and evaluation requirements. The Better Regulation Guidelines and the underlying toolbox were updated and strengthened in July 2017. All the steps undertaken since 2016 in the Better regulation agenda are reported in the Communication "Completing the Better Regulation Agenda: Better solutions for better results" .
Harmonise the rules for online purchases and reduce unjustified geographical discrimination of consumers.
At the end of 2017, political agreements has been reached on a) new legislation to address unjustified geoblocking and other forms of discrimination on the grounds of nationality, residence or establishment in the internal market and b) a legislative proposal on cross-border parcel delivery services to increase the transparency of prices and improve regulatory oversight, respectively.
In May 2016, the Commission presented a legislative proposal to strengthen enforcement of consumer rights and guidance to clarify, among others, what qualifies as an unfair commercial practice in the digital world.
In October 2017, the Commission presented an amended proposal concerning contracts for the online and other distance sales of goods.
Harmonise, taking into account the specificities of each member state, national regulations and technical specifications in network sectors, with the target of transferring decision powers in technical matters to a single EU regulator.
The proposal of September 2016 for the European Electronic Communications Code (EECC) sets EU-wide common rules and objectives on how the telecom industry should be regulated. It applies to providers of networks and/or services and defines how they can be regulated by national regulators. It vests the Body of European Regulators of Electronic Communications (BEREC) with a limited number of decision-making powers. The accompanying proposal for a revised BEREC Regulation aims at making the governance structure of BEREC simpler and more efficient
The role of the European Railway Agency in authorisation of rolling stock for operations was strengthened. The technical pillar of the 4th Railway Package, adopted in April 2016, aims at improving interoperability between national railroad networks and at cutting red tape for operations beyond one single Member State. Political agreement on the opening of domestic railway markets is emerging.
In the inland navigation sector, waterways of European dimension, i.e. serving cross-border traffic needs, are part of the TEN-T core network corridors. The adoption of Directive (EU) 2016/1629) on technical standards of inland navigation vessels strengthens the Single Market, enhancing safety and performance of the inland waterways fleet.
For road transport, the market for intra-EU freight has been entirely opened to competition. The Commission has made proposals to further reduce market access barriers and to harmonise technical and social standards. Political agreement on these proposals is pending.
For energy, the measures proposed by the Commission in the 'Clean Energy for All Europeans' package of 30 November 2016 will constitute a significant step towards the creation of the Energy Union. The package included eight different legislative proposals covering energy efficiency, energy performance in buildings, renewable energy, governance, electricity market design (the Electricity Directive, Electricity Regulation, and Risk-Preparedness Regulation) and rules for the regulatory agency, ACER.
The proposed Renewable Energy Directive, together with the proposals on the new electricity Market Design, will set a regulatory framework that allows a level playing field for all technologies without jeopardising the EU's climate and energy targets. With respect to ACER, the proposal would strengthen its powers for those cross-border issues which require a coordinated regional decision, thereby contributing to faster and more effective decision-making on cross-border issues. National regulators, deciding within ACER on those issues, would remain fully involved in the process.

56 │ ANNEX – PROGRESS IN MAIN STRUCTURAL REFORMS
OECD ECONOMIC SURVEYS EUROPEAN UNION 2018 © OECD 2018
Prioritise the Trans-European transport and energy network projects to support the completion of the Single Market. .
Four bottlenecks on TEN-T core network corridors have been removed in 2016, with additional 11, 25 and 53 expected in 2017, 2018 and 2019.
The EU average for the completion of the TEN-T rail core network is 60% (2014).
The EU average for the completion of the TEN-T road core network is 74% (2014).
In November 2017, the Commission published a Communication on strengthening Europe's energy networks and published the third list of Projects of Community Interest (PCI)'s.
Since 2013, the TEN-E policy framework will have seen approximately 30 energy infrastructure projects of common interest (PCIs) completed or being in operation by the end of 2018. Another 47 important projects are scheduled to be completed around 2020 out of a total of 173.
To ensure a functioning EU carbon market, reform the ETS by reducing the emissions cap and introducing a reserve of allowances to smooth market fluctuations.
The Market Stability Reserve (MSR), established at the end of 2015 by EU legislation to tackle the persisting surplus of allowances on the EU carbon market, will operate as of 1 January 2019.
In addition, the EU has revised the EU ETS and corresponding legislation for the period after 2021 with a view to implementing its commitment of reducing emissions by at least 40% by 2030 in the context of the Paris Agreement. Besides the adjustment of the cap, the revised EU ETS legislation foresees further measures to strengthen the EU carbon market and to enhance support for innovation and the modernisation of energy systems, in particular in lower income EU Member States. With regard to a stronger carbon market, it has in particular been agreed to temporarily double the feeding rate for the MSR (from 12% to 24%) to restore the demand-supply balance on the market at a faster pace and to invalidate a certain amount of allowances held in the MSR as from 2023.