oecd economic surveys austria
TRANSCRIPT

OECD Economic Surveys
Austria
November 2019
OVERVIEW
http://www.oecd.org/economy/austria-economic-snapshot/

This Overview is extracted from the Economic Survey of Austria. The Survey is published on the responsibility of the Economic and Development Review Committee (EDRC) of the OECD, which is charged with the examination of the economic situation of member countries.
This document and any map included herein are without prejudice to the status of or sovereignty over any territory, to the delimitation of international frontiers and boundaries and to the name of any territory, city or area.
OECD Economic Surveys: Austria© OECD 2019
You can copy, download or print OECD content for your own use, and you can include excerpts from OECD publications, databases and multimedia products in your own documents, presentations, blogs, websites and teaching materials, provided that suitable acknowledgment of OECD as source and copyright owner is given. All requests for public or commercial use and translation rights should be submitted to [email protected]. Requests for permission to photocopy portions of this material for public or commercial use shall be addressed directly to the Copyright Clearance Center (CCC) at [email protected] or the Centre français d’exploitation du droit de copie (CFC) at [email protected].

1
OECD ECONOMIC SURVEYS: AUSTRIA 2019 © OECD 2019
Executive summary

2
OECD ECONOMIC SURVEYS: AUSTRIA 2019 © OECD 2019
The generally well-performing
economy has slowed after a long
recovery
Living standards and subjective wellbeing are
among the highest across the OECD. Broad-
based growth on the back of myriad
entrepreneurial firms across all regions, supported
by growth-friendly social partnerships, has
underpinned Austria’s strong well-being and social
cohesion.
Economic conditions have improved in recent
years, driven by domestic and external factors.
Robust employment growth in the private sector
has consolidated household confidence and fed
into wage increases. Austria benefits from its close
integration with globally competitive Germany-
centred international value chains, and with rapidly
growing Central and Eastern European
economies.
More people have moved into work and inward
migration has been strong. Labour demand has
been robust for three years in a row and has helped
to increase women’s and older workers’ labour
force participation. At the same time, a large share
of newly created job positions has been filled by
migrants or cross-border commuting workers.
Amid recruitment difficulties and skill mismatches,
the estimated rate of structural unemployment has
increased. Though the long-term unemployment
rate in the domestic labour market has recently
fallen, it is still on relatively high levels.
Divergences in labour market outcomes raise
social cohesion challenges. Increased skill
differences in the population, combined with
diverging productivity performance across Austrian
firms, generate a higher range of outcomes for
employment, job quality and market wages than in
the past. Developments are also uneven across
regions. This raises challenges for social cohesion.
Traditional social expectations of steady job
creation for all and high income equality augment
claims for higher public spending, including on
support and re-training for the unemployed,
subsidised social housing, and to help those at risk
of relative poverty, notably at old age.
The previous government had important
reform objectives. In place from December 2017
to June 2019, it aimed at implementing several
regulatory reforms to ease market entry and
business conditions, a wide-ranging tax reform to
support business investment and job creation, and
started a restructuring of the education system.
The vocational training system in particular, which
has been a pillar of Austria’s past performance,
was part of the reform program. Catching-up with
the international digitalisation frontier – where
Austria has gaps – was emphasised as an
overarching strategic objective.
The economy faces headwinds in the short
term. The expansion is projected to slow despite
supportive domestic conditions due to the
weakening of external demand, especially from the
key export markets of Germany and Italy
(Figure 1). Skill shortages and recruitment
difficulties are dragging on business investment.
Uncertainties concerning international trade
policies are weighing on business confidence, on
investment and employment growth. The capital
adequacy of banks, which are large for the size of
the national economy and are highly exposed in
Central, Eastern and South-Eastern Europe, is
above regulatory norms but can be further
strengthened.
Figure 1. After a strong improvement, growth is slowing
Source: OECD (2019) OECD Economic Outlook: Statistics and
Projections (database).
StatLink 2 https://doi.org/10.1787/888934024891
-1
0
1
2
3
2010
2011
2012
2013
2014
2015
2016
2017
2018
2019
2020
Real GDP per capita
Employment
Y-o-y % changes

3
OECD ECONOMIC SURVEYS: AUSTRIA 2019 © OECD 2019
Table 1. The economy is projected to slow to below 2% in 2019 and 2020
Annual percentage change
2018 2019 2020
Gross domestic product 2.3 1.4 1.3
Private consumption 1.1 1.7 1.8
Gross fixed capital formation 3.9 2.9 1.5
Exports 5.6 2.1 0.6
Imports 4.4 2.2 1.2
Unemployment rate (%) 4.8 4.6 4.5
Consumer price index 2.1 1.6 1.7
Fiscal balance (% GDP) 0.1 0.1 0.2
Public debt (Maastricht, % of
GDP) 73.8 72.1 70.8
Source: OECD (2019), OECD Economic Outlook: Statistics and
Projections (database).
Public finances have moved into
surplus, but long-run sustainability
and spending efficiency should be
improved
Low interest rates and strong growth have
helped to balance the government accounts.
Further improvements were planned over the
2019-2020 horizon by the government in place
after the 2017 elections. As cyclical conditions
slow, automatic stabilizers should be allowed to
operate and more active measures should be
considered if developments get more severe. The
tax reform of the previous government was
supposed to be fiscally neutral in the long-term but
may have slightly reduced the budget surplus in
the short-term. Additional direct spending in areas
contributing to improve the supply potential of the
economy, social cohesion and environmental
sustainability may help to provide a more rapid and
more easily reversible stimulus.
The long-term impacts of population ageing
call for further attention. Population ageing
weighs heavily on the public finances and on the
supply capacity of the economy. Despite
parametric adjustments in the large public pension
system - implemented through a long transition
period - and the reduction of early retirement
avenues, the average effective retirement age
remains well below comparable countries. Pension
replacement rates are high. Stronger work
incentives, better-adapted life-long learning
programmes, and a more supportive organisation
of work would help older workers to stay longer in
the labour force. Under the prevailing skill
shortages, this would further facilitate the
transmission of older workers’ experiences and
competencies to the new cohorts.
To manage the fiscal pressures and risks of
ageing, Austria has opted for periodic
legislative amendments rather than automatic
adjustments to change the retirement age,
contributions and benefits as needed. If
longevity increases more than expected or there
are other changes, this would require further
adjustments to the pension system, which may
prove politically demanding. Impacts on health and
long-term care services should also be well
anticipated and actively managed. Growing care
needs of old age dependants – the majority of
whom are taken care of by their families in Austria
– should be addressed without restricting the
labour force participation of their relatives. Austrian
experiments with innovative approaches in this
area include intense recourse to mobile and
daytime services. These have the potential to
improve the well-being of beneficiaries and to
reduce the pressures on public finances in the long
term.
More ambitious public sector and federal fiscal
reforms are needed. The multilayer structure of
the government ensures close relations with the
population but raises challenges for cost efficiency,
quality and long-term planning of public services.
High-quality independent public spending reviews
can help improve the design and delivery of
services. The spending and taxing powers of
Federal, Länder and local governments are
currently not harmonised and the average size of
municipalities is small. Revenue raising and
spending responsibilities should be aligned and
economies of scale should be exploited through
shared services or consolidation of government
layers.
The revenue structure of the general
government should be made more growth- and
social inclusion-friendly. The tax reform could
reduce further labour taxes (including social
security contributions) for lower income
households, widen the consumption tax base and
raise environmental taxes. The authorities should

4
OECD ECONOMIC SURVEYS: AUSTRIA 2019 © OECD 2019
also consider increasing recurrent property taxes
and re-introducing inheritance taxes. Widespread
VAT reductions should be replaced with direct
transfers to low-income households – at lower
fiscal costs.
Framework conditions need to be
improved to sustain long-term growth
and facilitate businesses’ digital
transition
Austria is adapting to the global digitalisation
frontier at a slower pace than in comparable
countries. Upskilling the population across all
ages in digital technologies (Figure 2), decreasing
the restrictions on competition in product market
regulations without reducing the quality of services,
further reducing the remaining barriers to digital
trade and investment, and fostering the provision
of private venture and equity capital would
accelerate the adoption of key ICT technologies
(Figure 3). Austria’s international leadership in e-
government can be re-gained by generalising its
use by all social and age groups. A stronger ultra-
high speed internet infrastructure would enable
more user-friendly services and contribute to faster
catching-up.
Product market regulations can be made more
supportive for start-ups and for international
trade and investment. Service sectors are
particularly affected by restrictive regulations and
their productivity and innovation capacity appear to
be hampered. Simplifying the licencing
procedures, in particular for professions, and
liberalising market entries in rail transportation,
road freight and the distribution of pharmaceuticals
would generate significant productivity and
innovation gains. Lower prices, more choice and
better services would benefit consumers and
downstream manufacturing sectors.
Figure 2. Digital skill shortages are high
Shortage of knowledge of computers and
electronics, skills scale between -1 and 1
(strongest), 2015 or latest year
Note: Positive values indicate skill shortage while negative values
point to skill surplus.
Source: OECD (2018), OECD Skills for Jobs Database.
StatLink 2 https://doi.org/10.1787/888934024910
Figure 3. Digitalisation in Austria lags behind
Digital Economy and Society Index (DESI), use of
Internet, composite index
Source: European Commission (2019), Digital scoreboard
(database).
StatLink 2 https://doi.org/10.1787/888934024929
The corporate tax system is biased towards debt-financing and Austrian firms have one of the highest average debt-to-equity ratios among OECD countries. Credit markets are well developed and banks, with their close relations with firms, contribute to the success of the business sector, but equity markets have lagged behind. The planned tax reform could reduce the existing biases towards debt finance (Figure 4). Further identifying and addressing the key constraints to the development of the ecosystem for equity investments in firms of all sizes would help. Private capital sources should complete the
-0.2
0.0
0.2
0.4
0.6
0.8
1.0
GB
RH
UN
CH
EP
OL
FR
A
SV
NB
EL
SW
EG
RC
IRL
DE
UC
ZE
DN
KN
OR
NL
DS
VK
PR
TA
UT
ES
PIT
AF
IN
0
3
6
9
12
15
2014 2015 2016 2017 2018
Austria Denmark
Germany Netherlands

5
OECD ECONOMIC SURVEYS: AUSTRIA 2019 © OECD 2019
already large public financing sources for innovative start-ups. Private venture and growth investors can play a more important role in the development of high-potential ventures.
Figure 4. Debt-to-equity ratio is high Non-financial corporations, 2018
Source: OECD (2019), OECD Financial Dashboard.
StatLink 2 https://doi.org/10.1787/888934024948
The success of ownership transmissions of
family SMEs will be crucial for future economic
performance. Enduring strong performance of
medium-sized family-owned firms (“hidden
champions”) will be key, including through proper
operation of ‘family trusts’ during transitions. The
measures planned by the previous government to
improve the framework conditions for business
transfers, including by deepening the capital
markets, should be taken up again. The
development of both private and listed equity
markets would help to facilitate ownership
transmissions and contribute to SMEs’ further
commercial development, technological
modernisation and international outreach.
Integrating all immigrants and
improving environmental sustainability
are important remaining challenges
Immigration is projected to help offset
population ageing and sustain growth in the
decades ahead. Effective integration of
immigrants improve their contribution to economic
development and social well-being (Figure 5). The
integration of low-skilled foreigners and their
families and children has proven relatively
demanding to date. Their German language
learning opportunities, the adaptation of their
existing skills to labour market needs, and their
participation in the labour force should be
strengthened. The government also intends to
attract more skilled foreigners into “shortage
professions” and to retain a higher proportion of
foreign graduates of local universities in Austria.
Figure 5. Migrants are sustaining higher employment Share of migrants in the total employment, 15-64 year-old employed
Source: Eurostat (2019), LFS detailed annual survey results
(database).
StatLink 2 https://doi.org/10.1787/888934024967
Environmental challenges should be faced
more actively. Austria is endowed with
exceptional natural assets. Strong focus on
employment and GDP growth may have
overshadowed environmental priorities in the past.
Low carbon prices and taxes in international
comparison should be increased to pursue the
National Climate Strategy 2030 in more
economically efficient ways. Low-density
developments around towns and cities have grown
more than in comparable countries, worsening
road congestions and transportation times and
denting air quality. This urban sprawl calls for more
effective and better integrated urban planning,
transportation and housing development policies
across government levels.
0.0
0.2
0.4
0.6
0.8
1.0
1.2
CH
E
SW
E
US
A
FR
A
ES
P
DN
K
NLD FIN
NO
R
BE
L
OE
CD
GB
R
CA
N
DE
U
ITA
AU
T
0
5
10
15
20
25
1999
2000
2001
2002
2003
2004
2005
2006
2007
2008
2009
2010
2011
2012
2013
2014
2015
2016
2017
2018
%
Austria GermanyDenmark Netherlands
6
OECD ECONOMIC SURVEYS: AUSTRIA 2019 © OECD 2019
MAIN POLICY FINDINGS KEY RECOMMENDATIONS
Fiscal and financial policy
Domestic demand has remained robust, but GDP growth has peaked due to weaker
external demand growth.
Continue to reduce the public debt ratio. If cyclical conditions worsen, let automatic stabilisers operate and consider more active measures if growth
disappoints.
While house prices have risen less than in many countries, valuations have
nevertheless reached elevated levels, particularly around Vienna.
Make the existing macro-prudential recommendations on mortgage lending
compulsory.
Banks are large compared to the size of the national economy and highly exposed in the region. Their capital adequacy has improved and is in line with regulatory benchmarks,
but stay somewhat behind the strongest banking systems.
Ensure that banks of all sizes are robustly capitalised.
The average eeffective retirement age is well below comparable countries and well below the official retirement age. Pension benefits are generous. The long-term path of
pensions remains exposed to significant risks.
Ensure the long-term sustainability of the pension system, e.g. by linking retirement age to life expectancy. Closely monitor demographic and other
structural developments and, accordingly, promptly increase the retirement
age, raise contributions or reduce benefits as needed.
The current tax system is not employment friendly and plays a very limited role in
income and wealth re-distribution.
Create room for substantial labour tax cuts for lower income earners by raising
consumption, environmental and inheritance taxes. Consider replacing VAT
rate reductions with targeted transfers.
The misalignment of the taxing and spending powers of federal, Länder and local governments and the very small average size of municipalities hamper the cost-
efficiency and the quality of public services.
More closely align revenue raising and spending responsibilities of government levels. Seek economies of scale in municipal governance through
shared services or consolidation of government.
The efficiency and allocation of public spending could be improved by reforms and
better targeting.
Implement high-quality independent government spending reviews to improve
the quality and cost-efficiency of services.
Business sector dynamism, jobs and skills
Strict product market regulations create barriers to entry and to international trade and investment. Service sectors are particularly affected and their productivity is hampered.
Economic performance is uneven across regions.
Make the licensing system more open to competition without undermining the quality of services and the training and skill standards of workers. Liberalise market entries in rail transportation, road freight and the distribution of
pharmaceuticals.
Banks support the business sector effectively, including at local level, but equity markets
have fallen behind.
Further identify and address the remaining shortages in the ecosystem for equity investments in firms of all sizes. Further draw on the completion of EU
capital market union
The corporate tax system is biased towards debt-financing and Austrian firms have one
of the highest average debt-to-equity ratios across OECD countries.
As intended in the tax reform strategy of the previous government, modify
corporate taxes to reduce disincentive effects and the debt-bias.
Large proportions of SMEs will face ownership transmissions in the near future. The success of these transmissions will be crucial for the future performance of the
economy.
Take up the measures planned by the previous government to facilitate
business transfers.
Improve the evidence base on business transfers. Increase awareness on the
importance of successful transmissions and help disseminate best practices.
The quantity and quality of life-long learning programmes are behind needs, particularly
in digital technologies.
Involve employer organisations more directly in the design and administration
of life-long learning programmes.
Migration and cross-border workers play a major role in economic growth. However,
recruitment difficulties have increased in all regions.
Continue to attract high-skilled foreign workers and retain more foreign graduates of Austrian universities by facilitating their access to red-white-red
cards.
Well-being and social cohesion
Gender gaps in career opportunities and pay remain deeper than in comparable
countries.
Make high quality child care and full-day schooling a legal entitlement in the
entire country.
The integration of low-skilled migrants and refugees and their families and children fall
behind outcomes in other countries facing similar inflows.
Closely monitor the economic and social integration of low-skilled migrants and refugees. Strengthen the German language learning opportunities and
the labour force participation potential of their entire families.
The National Climate Strategy 2030 is welcome. However, its carbon emission reduction
goals for 2030 risk not being met. Phase in additional measures if emission trajectories diverge from targets.
Carbon prices are too low and unequal across economic activities. Raise and harmonise carbon prices across activities, along a predictable path
supported by international co-operation.
Urban sprawl is excessive and is damaging Austria’s natural assets, urban living
conditions and air quality.
Improve co-operation between federal, Länder and municipal governments on
joint urbanisation, housing, transportation and air quality plans.
7
OECD ECONOMIC SURVEYS: AUSTRIA 2019 © OECD 2019
The Austrian economy has performed well over the recent decades. Real
GDP per capita was the 11th highest in the OECD and 6th highest in the EU
in 2018, slightly ahead of Germany, Finland and Belgium. It fell however
behind the most rapidly growing OECD countries in the 2010s and the gap
has widened more rapidly than in comparable countries. Available indicators
of well-being remain nonetheless well above OECD averages, with limited
discrepancy between population groups and regions, witnessing a high
degree of social cohesion.
The statistical data for Israel are supplied by and under the responsibility of the relevant Israeli authorities. The use of
such data by the OECD is without prejudice to the status of the Golan Heights, East Jerusalem and Israeli settlements
in the West Bank under the terms of international law.
1 Key Policy Insights

8
OECD ECONOMIC SURVEYS: AUSTRIA 2019 © OECD 2019
This chapter reviews the macroeconomic developments, the main outcomes in Austrian population’s well-
being, the underlying trends in the supply side of the economy, and the priorities for structural policies and
reforms. The main messages are:
For Austria’s high well-being and social cohesion standards to be preserved and improved, the
supply capacity of the economy should further be strengthened. Risks of increased social inequality
in market outcomes, heightened mobility needs of workers between activities and living places,
and intergenerational equity challenges will be easier to address with a stronger economy. This
can be achieved with faster growth of high-potential firms, stronger productivity gains across the
business sector and higher labour force participation by women and a more rapidly upskilling
working age population.
Small and medium sized firms have a special role to play in this process. They have been the core
engine of Austria’s productivity and competitiveness gains and regional development in the past,
but their digital transition is now relatively slow, their participation in global value chains remains
centred on continental Europe, and they face more severe skill shortages than international
counterparts. Many medium-sized family firms face ownership transmission in the coming years.
More open entry conditions favouring competition in domestic markets, additional risk-sharing
equity capital and upskilling of workers at all levels would help all types of firms to keep pace with
the global frontier.
Long-acknowledged but repeatedly postponed public sector reforms should be pursued. The
public sector contributed successfully to economic growth and social cohesion by narrowing
inequality in the past, but its costs have gone up, its margin of action for new policy measures
has narrowed, and, as a result, it risks falling short of delivering the services and infrastructures
required to sustain high well-being in the face of new megatrends. On the side of revenues, there
is large scope to change the composition of taxes to better support labour force participation,
social inclusion and environmental sustainability.
Domestic demand growth strengthened in recent years, but external conditions
are weakening
After a rapid recovery following the global financial crisis, the Austrian economy had stalled in comparison
to other small open European economies in the 2010s but remarkably improved its performance in 2017
and 2018 (Figure 1.1). Both external and domestic demand strengthened. The vigour of the ‘Central
European manufacturing core’ formed around Germany provided strong external stimulus until late 2018.
Household consumption was backed by the 2016 tax reform, which reduced personal income tax rates for
low and middle income households, and considerable wage increases negotiated in Autumn 2018. A
steady improvement in household confidence supported private consumption. The increase in immigration,
principally from other countries in the region, also supported domestic demand. Total employment has
strongly increased and unemployment fell until early 2019 (Figure 1.1).
Business investment increased strongly in the past two years, more than in comparable countries. A large
proportion of Austrian firms reported until recently that they increased investments in response to highly
supportive external and domestic conditions but mentioned the shortage of skilled personnel as a binding
constraint to further investments (EIB, 2018, link). Business representatives emphasised that the
government programme 2017-2022 of the government in place after the 2017 elections, which included
several growth-friendly reform objectives potentially stimulates investment (Box 1.1).
Euro area monetary policies have long been supportive, even if the recent surge in investments were
financed more by retained earnings than external credit. Fiscal policy was fairly supportive in 2016 but no
additional stimulus was provided in 2017 and 2018 (Figure 1.2). The previous government took a mix of
restrictive and stimulus measures for 2018 and 2019. The net impact is estimated to be broadly neutral.

9
OECD ECONOMIC SURVEYS: AUSTRIA 2019 © OECD 2019
This stance appears adequate but should cyclical conditions worsen in the euro area, automatic stabilisers
should continue to operate and more active measures can be considered if growth disappoints. Additional
adjustments in the composition of spending and revenues may help strengthen this stimulus. The structural
and fiscal policy recommendations of this Survey have been conceived in a fiscally neutral manner and
would be compatible with this stance.
Figure 1.1. The strong recovery has peaked
1. Three-quarter moving average.
2. Export performance is measured as the ratio of actual export volume to the country’s export market size. World market share is measured as
the share of value exports of goods and services in world exports in USD.
Source: OECD (2019), OECD Economic Outlook: Statistics and Projections (database) and OECD Main Economic Indicators: Business
tendency and consumer opinion surveys.
StatLink 2 https://doi.org/10.1787/888934024986

10
OECD ECONOMIC SURVEYS: AUSTRIA 2019 © OECD 2019
Box 1.1. Reform priorities in the previous government programme
The programme of the previous government for 2017-2022 aimed at “enhancing Austria’s competitiveness as a business location, with digitalisation as a major opportunity to position Austria on the international technology frontier”. Several measures were implemented in the first year following the elections, including an increase in maximum daily working time from 10 to 12 hours, and in the maximum weekly working time from 50 to 60 hours. A number of the 5 000 business regulations were amended. From 2019 on longer-term initiatives would have been phased in. Three main orientations were intended to foster a more growth-friendly environment:
“Doing business” conditions were meant to be made more attractive. Austria’s strict product market regulations were acknowledged and the 2017-2022 programme intended to simplify them. An independent ‘regulatory monitoring agency’ was supposed to examine the costs and benefits of all regulations and to streamline proposals. Labour market rules were intended to be made more open to company-level agreements. The deepening of capital markets was intended to support firms in all phases of their lifecycle, including via initial public offerings (IPOs) in the secondary segment of the Vienna Stock Exchange. Further, the telecommunications infrastructure was supposed to be modernised, with the goal of becoming a 5G pilot country by 2021 and a mobile-5G country by 2025.
A large tax reform was a key part of the programme. Its principal targets included: i) cutting the tax ratio towards 40% of GDP by 2022; ii) reducing the labour tax wedge, first for lower incomes and then for higher income groups, including by cutting social security contributions (see Table 1.8 for details), iii) reducing the corporate income tax rate, also in steps. These reductions were planned to be budget neutral thanks to additional revenues from digital taxes and cost reductions across all ministries.
A comprehensive restructuring of the education system was targeted in all its layers. The objective was to maintain separate educational tracks but to boost academic standards in all of them. Schools were supposed to be granted a higher degree of autonomy against closer ex post performance monitoring. Another goal of the programme was to make the teaching profession more attractive to entrants. The adaptation of apprenticeship education (which trains 40% of each student cohort) to the digital revolution was especially emphasised.
These economic objectives were intended to be supported with new approaches in four social policy areas:
Pension system parameters would have been re-visited in the light of international experiences, including concerning the official retirement age. The convergence of actual and official retirement ages was a priority, stressing elderly workers’ staying in the labour force.
Immigration policies were to be re-oriented according to the needs of the labour market. Issues concerning i) skilled immigration, ii) freedom of movement within the EU, and iii) asylum policies will be managed according to different priorities. Language and cultural integration of immigrant groups received a particular emphasise.
A reform of the means-tested minimum income scheme has been adopted by Parliament in May 2019 in the “Sozialhilfegrundgesetz”. This new law sets maximum rather than minimum benefit levels binding for Länder governments which administer these aids. Furthermore, benefit conditions have been made more restrictive, for example regarding the eligibility criteria for receiving the full amount of the benefit like language skills, completion of compulsory education in Austria or, proof of integration efforts years (EC, 2018, link). Further key points of the reform are the prioritisation of benefits in kind, increased incentives to work and a higher protection of assets. The process of implementation by the Länder, however, is still ongoing.
New legislation was adopted to grant women temporarily interrupting their career for family responsibilities notional wage increases matching their peers’ in employer firms and organisations.

11
OECD ECONOMIC SURVEYS: AUSTRIA 2019 © OECD 2019
The fiscal measures in the government programme 2017-2022
The previous government aimed to reduce the Maastricht debt ratio below 60%, to regain its triple-A credit
rating lost after the global financial crisis. The central anchor to achieve this objective is the so-called debt-
brake rule (cyclically-adjusted general government balance ≥ -0.45% of GDP). The partial recovery of the
assets of the government-owned bad banks created after the global financial crisis is expected to help.
General government debt reductions due to asset recoveries amounted to 6% of GDP between 2015-2018
and may further augment in the period ahead.
To attain its fiscal objectives, the government elected in 2017 announced three streams of measures that
were restrictive on the spending side but also cut taxes:
The stimulus measures introduced in early 2017 by the government elected in 2013, and which
had become pro-cyclical amid strong growth in 2018, were discontinued. These encompassed the
“new hiring bonus” and other investment grants offered to enterprises, as well as the subsidies
aimed at integrating the long-term unemployed, the elderly and the persons entitled to asylum
protection in the labour market.
A catalogue of cost-saving measures was announced in the public sector, including reductions in
subsidies, cuts in personnel costs in government-owned entities, the merger of 21 different health,
pension and accident funds to five, and the indexation of family allowances for children living
outside Austria to their local living costs.1
A number of tax cuts were introduced for 2018-19, including the reduction of contributions to
unemployment insurance by low-income earners, the re-introduction of the super-reduced VAT
rate on tourist accommodations, as well as a “Family Bonus plus” (a personal income tax relief per
child in the order of EUR 1.5 billion over 2019 and 2020), while abolishing the deductibility of child
care costs and the existing child allowance. These tax measures were intended to be fiscally
neutral in the long-term but could slightly reduce the budget surplus in 2020 by around 0.3% of
GDP.
While the direct impact of these measures on aggregate demand was estimated to be broadly neutral, they
would have medium-term economic and social implications. The Chamber of Economy estimated that the
government programme 2017-2022 addressed a large part of the proposals it had made to improve
Austria’s business environment, with an aim to raise Austria’s rank in the World Bank Doing Business
Indicators from 26th in 2019 to the top 10 by 2022 (Austria Economic Chamber, 2018, link). However,
OECD evaluations suggest that economic gains from VAT reductions may not justify their high fiscal costs.
Also, the replacement of the tax deductibility of child care costs and of the child care allowance by the
Family Bonus may have a relatively weaker incentive effect for the labour force participation of women with
children. The discontinuation of employment subsidies for the low-skilled may reduce their employment
opportunities.
If the cyclical slowdown in the EU and in Austria takes hold more strongly, additional countercyclical
measures such as temporarily increasing depreciation allowances for business investment would help. Re-
installing well targeted wage subsidies for vulnerable workers may further support growth and social
inclusion. OECD experience suggests that targeted wage subsidy programmes, if well-designed and
monitored, can prove to be effective (Martin, 2017, link).
According to the OECD fall projections, the headline general government fiscal balance should shift from
a surplus of around 0.1% of GDP in 2018 to a deficit of -0.1% in 2021, corresponding to an improvement
of the cyclically-adjusted stance from neutral in 2018 to a surplus of 0.3% in 2021. The general government
debt-to-GDP ratio is projected to decline from 73.8% of GDP in 2018 to 69.2% of GDP in 2021 with asset
recoveries playing an important role. The national medium-term fiscal objective — a structural deficit of
0.5% of GDP was achieved in 2018 and was expected to be met from 2019 onwards.

12
OECD ECONOMIC SURVEYS: AUSTRIA 2019 © OECD 2019
Figure 1.2. Structural fiscal position has improved
1. 2004 revenues include remission of Austrian Federal Railways' (ÖBB's) debt to the federal government. Interest payments exclude swap
transactions.
2. 2004 headline balance includes remission of Austrian Federal Railways' (ÖBB's) debt to the federal government.
Source: Statistics Austria, Austrian Ministry of Finance, Austrian Institute of Economic Research (GDP), European Commission and Fiscal
Advisory Council's fall forecast (2018 and 2019); OECD (2019), OECD Economic Outlook: Statistics and Projections (database).
StatLink 2 https://doi.org/10.1787/888934025005
The fast growth of the past two years has peaked in 2018. The economy is projected to slow over the
2019-21 period, similar to many euro area countries. Following the slowdown, the Austrian economy is
growing roughly at its potential rate. Household demand remains strong but demand through international
trade is decelerating, even if the relative strength of the Central and Eastern European economies offers
some external support to the Austrian economy. Business confidence was nevertheless harmed more than
in countries with similar characteristics (Germany, Switzerland, The Netherlands, Denmark and Sweden
are considered as Austria’s peer countries in this survey). Subsequently business investment has lost
steam, despite abundant cash-flow within firms as well as the availability of low-cost bank credits
(Figure 1.1 and Table 1.1).
47
48
49
50
51
52
53
54
55
2001 2003 2005 2007 2009 2011 2013 2015 2017 2019
A. General government expenditure and revenue are falling as share of GDP¹
% of GDPExpenditure Revenue
-7
-6
-5
-4
-3
-2
-1
0
1
2001 2003 2005 2007 2009 2011 2013 2015 2017 2019
B. General government balance has improved²% of GDP
Headline balance Structural balance (national definition)
20
30
40
50
60
70
80
90
100
20
30
40
50
60
70
80
90
100
2001 2002 2003 2004 2005 2006 2007 2008 2009 2010 2011 2012 2013 2014 2015 2016 2017 2018 2019
C. Public debt is relatively highMaastricht definition, % of GDP
Austria Denmark Germany Sweden Netherlands

13
OECD ECONOMIC SURVEYS: AUSTRIA 2019 © OECD 2019
Table 1.1. Macroeconomic indicators and projections
Annual percentage change, volume (2015 prices)
2015
2016 2017 2018 2019 2020 Current prices (billion EUR)
GDP 344.3 2.1 2.6 2.3 1.4 1.3
Private consumption 181.2 1.7 1.5 1.1 1.7 1.8
Government consumption 68.1 1.7 1.1 0.8 0.8 0.9
Gross fixed capital formation 78.1 4.0 3.9 3.9 2.9 1.5
Housing 14.6 2.3 6.0 1.2 5.5 3.1
Final domestic demand 327.4 2.3 2.0 1.7 1.8 1.6
Stockbuilding¹ 3.8 0.0 0.1 0.1 -0.2 0.0
Total domestic demand 331.2 2.2 2.1 1.8 1.5 1.6
Exports of goods and services 182.9 3.2 5.3 5.6 2.1 0.6
Imports of goods and services 169.9 3.7 4.9 4.4 2.2 1.2
Net exports1 13.0 -0.1 0.4 0.8 0.0 -0.3
Other indicators (growth rates, unless specified)
Employment . . 1.7 1.0 1.4 0.9 0.8
Unemployment rate . . 6.0 5.5 4.8 4.6 4.5
GDP deflator . . 1.7 1.1 1.7 1.7 1.4
Consumer price index (harmonised) . . 1.0 2.2 2.1 1.6 1.7
Core consumer prices (harmonised) . . 1.6 2.1 1.8 1.5 1.4
Household saving ratio, net² . . 7.8 6.8 7.5 7.2 7.2
Current account balance³ . . 2.7 1.5 2.3 1.4 0.7
Government primary balance³ . . 0.1 0.7 1.4 1.2 1.0
General government fiscal balance³ . . -1.5 -0.8 0.1 0.1 0.2
Cyclically-adjusted balance4 -1.0 -0.8 -0.7 -0.5
General government gross debt (Maastricht)³ . . 82.7 78.0 73.8 72.1 70.8
General government net debt³ . . 58.3 54.7 51.6 49.9 48.6
Ten-year government bond yield, average . . 0.4 0.6 0.7 0.1 -0.1
1. Contribution to changes in real GDP.
2. As a percentage of household disposable income.
3. As a percentage of GDP.
4. National definition. As a percentage of GDP.
Source: OECD (2019), OECD Economic Outlook: Statistics and Projections (database), October; Statistics Austria, Austrian Ministry of Finance,
Austrian Institute of Economic Research (GDP), European Commission and Fiscal Advisory Council's fall forecast (2018 and 2019).
Inflation remains moderate and is set to grow by 1.6 and 1.7% in 2019 and 2020. Austria is exposed to
risks including further deteriorations in global trade conditions, which may reduce the demand and prices
for Austria’s exports and dent activity and employment (30% of Austria’s exports go to Germany as
intermediary goods processed and forwarded to global markets). Moreover, additional uncertainties in the
EU – related to the developments in the UK and in Italy – may lead to a weakening in business and
consumer confidence. The lower probability events mentioned in Table 1.2 may also lead to major changes
in the outlook.
Table 1.2. Low probability events that could lead to major changes in the outlook
Vulnerability Possible outcomes
Elevated asset prices and growing credit risks may lead to global
financial tensions.
Austrian banks have reduced their exposure to EM markets but remain exposed to Central, Eastern and South-Eastern Europe. Severe
international financial strains would affect them.
Brexit-related uncertainties and concerns over Italian sovereign debt
may constrain bank lending in Europe.
Austrian firms, which depend heavily on bank loans, could be more
vulnerable.
An acceleration of the technological and structural transformation of the
car industry may impact car value chains in Central Europe.
The significant segments of the Austrian manufacturing connected to global German car firms would face an adjustment shock, with second-
round regional and inter-industrial effects.
14
OECD ECONOMIC SURVEYS: AUSTRIA 2019 © OECD 2019
The financial system remains bank-focused and banks’ balance sheets have improved
Financial stability is a high priority in Austria. The authorities consider that rehabilitation of the banking
sector after the global financial crisis is now largely completed. A part of the related fiscal costs are being
recouped due to ongoing realisation of bad assets, which were transferred to special government
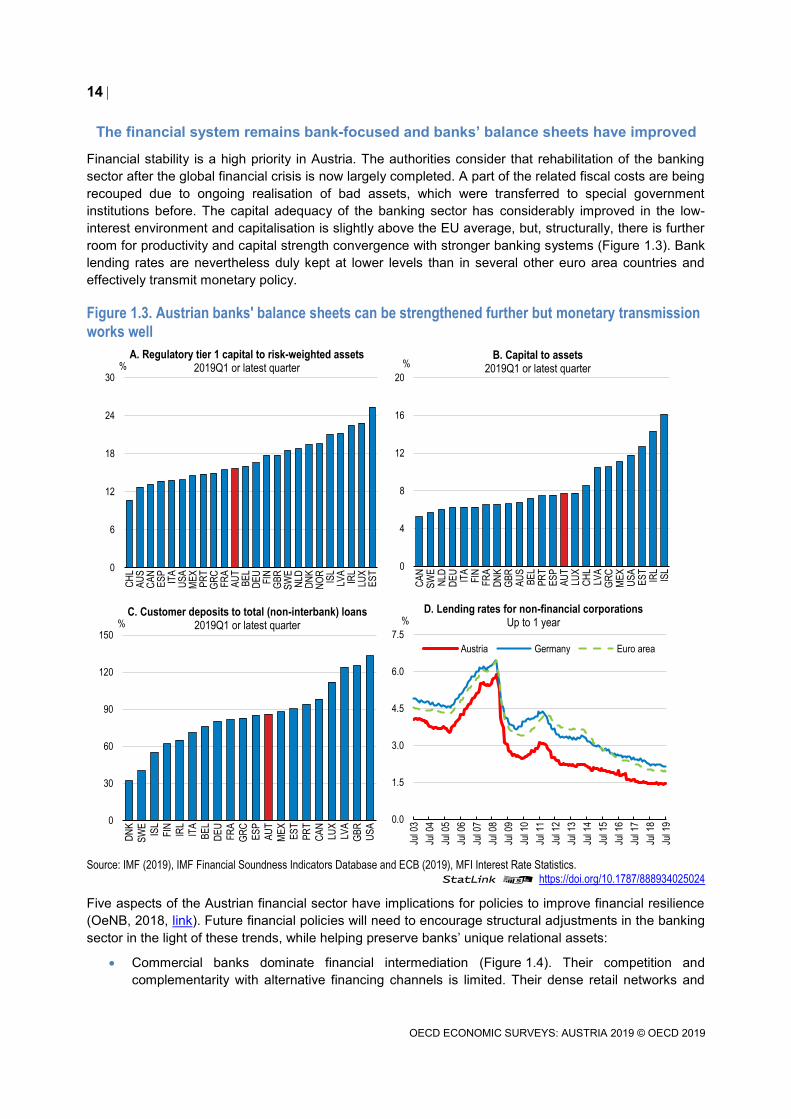
institutions before. The capital adequacy of the banking sector has considerably improved in the low-
interest environment and capitalisation is slightly above the EU average, but, structurally, there is further
room for productivity and capital strength convergence with stronger banking systems (Figure 1.3). Bank
lending rates are nevertheless duly kept at lower levels than in several other euro area countries and
effectively transmit monetary policy.
Figure 1.3. Austrian banks' balance sheets can be strengthened further but monetary transmission
works well
Source: IMF (2019), IMF Financial Soundness Indicators Database and ECB (2019), MFI Interest Rate Statistics.
StatLink 2 https://doi.org/10.1787/888934025024
Five aspects of the Austrian financial sector have implications for policies to improve financial resilience
(OeNB, 2018, link). Future financial policies will need to encourage structural adjustments in the banking
sector in the light of these trends, while helping preserve banks’ unique relational assets:
Commercial banks dominate financial intermediation (Figure 1.4). Their competition and
complementarity with alternative financing channels is limited. Their dense retail networks and
0
6
12
18
24
30
CH
LA
US
CA
NE
SP
ITA
US
AM
EX
PR
TG
RC
FR
AA
UT
BE
LD
EU
FIN
GB
RS
WE
NLD
DN
KN
OR
ISL
LVA
IRL
LUX
ES
T%
A. Regulatory tier 1 capital to risk-weighted assets2019Q1 or latest quarter
0
4
8
12
16
20
CA
NS
WE
NLD
DE
UIT
AF
INF
RA
DN
KG
BR
AU
SB
EL
PR
TE
SP
AU
TLU
XC
HL
LVA
GR
CM
EX
US
AE
ST
IRL
ISL
%B. Capital to assets
2019Q1 or latest quarter
0
30
60
90
120
150
DN
K
SW
E
ISL
FIN IRL
ITA
BE
L
DE
U
FR
A
GR
C
ES
P
AU
T
ME
X
ES
T
PR
T
CA
N
LUX
LVA
GB
R
US
A
%C. Customer deposits to total (non-interbank) loans
2019Q1 or latest quarter
0.0
1.5
3.0
4.5
6.0
7.5
Jul 0
3
Jul 0
4
Jul 0
5
Jul 0
6
Jul 0
7
Jul 0
8
Jul 0
9
Jul 1
0
Jul 1
1
Jul 1
2
Jul 1
3
Jul 1
4
Jul 1
5
Jul 1
6
Jul 1
7
Jul 1
8
Jul 1
9
%D. Lending rates for non-financial corporations
Up to 1 year
Austria Germany Euro area

15
OECD ECONOMIC SURVEYS: AUSTRIA 2019 © OECD 2019
labour-intensive organisations put pressure on financial sector productivity and profitability (OECD
2017, link). They also expose them to a looming re-organisation potential in the future as a result
of digitalisation and competition from fintech service providers. Upgrading their capital base under
these circumstances may constitute a challenge.
Banks have built-up large regional networks, and, even after the consolidations which followed the
global financial crisis, their assets and liabilities remain relatively large in comparison to the size of
the national economy. At the end of June 2019, the consolidated foreign claims of banks in Austrian
majority ownership totalled EUR 357 billion (78% of GDP), with claims on Central and Eastern
European countries accounting for around 60% of this amount. Global financial tensions may
therefore pose additional risks (Kakes and Nijkens, 2018, link).
At the same time, Austrian banks started to face emerging cross-border competition from the banks
of neighbouring countries, some of which bear lower operational costs and lower tax liabilities.
According to Eurostat figures, cross-border deposit and lending transactions with neighbouring
banks, although still at low absolute levels, have increased in the most recent years. Regional and
global competition in fintech services will also likely augment.
The Hausbank (main bank) system, centred around local cooperative banks and their national
associations, boasts massive tacit and informal knowledge on myriad small-and-medium sized
firms and their regional economies. This information base is a source of resilience in the Austrian
financial system, provided that these banks operate under competitive and transparent governance
conditions.
The provision of equity capital and tradable securities to the business sector remains much less
developed than in comparable countries. This concerns both listed equity capital, listed bond, as
well as non-listed private equity, venture and growth capital sources (Figure 1.4). Recent policy
initiatives aimed at stimulating equity investment, with the adoption of a law facilitating
“crowdfunding”, new legal forms for investment firms, and the opening of a secondary market for
smaller firms in the Vienna Stock Exchange. The ecosystem for equity investing is however still
emerging.
Concerning the future of prudential supervision, the planned implementation of the organisational change
of banking supervision (which intended to move 180 staff and a range of supervisory powers from the
Central Bank to the Financial Market Authority (FMA)) was not realized.
The ecosystem for equity investing should be boosted. Measures to improve the markets for risk capital,
apart from initiatives at the European level, should promote financial literacy among Austrian investors and
entrepreneurs. They should also encourage the growth of the services required for the effective operation
of equity markets (information, analysis, corporate governance and financial and legal counselling
services). Addressing the debt bias of the corporate tax system can help to level the playing field between
debt- and equity-financing.

16
OECD ECONOMIC SURVEYS: AUSTRIA 2019 © OECD 2019
Figure 1.4. Financial intermediation remains centred on bank credits
1. The ratio of bank credit to non-financial corporations is expressed as a percentage of the sum of bank credit plus private bond and equity
market capitalisation.
2. Panel C records venture capital according to the location of the managing office and includes both domestic and foreign investments (industry
statistics).
Source: OECD (2018), OECD Financial Dashboard, Invest Europe, European Private Equity Activity Data 2017. World Bank Global Financial
Development Database, BIS Credit Statistics, BIS Debt Securities Statistics, Refinitiv, and OECD calculations.
StatLink 2 https://doi.org/10.1787/888934025043
Housing market risks have been kept under control so far but may increase in the
future
Housing markets are exposed to risks of exuberance in the current low interest-rate environment. However,
only a small share of households is exposed to the fluctuation in housing prices and this restricts financial
vulnerability. Social housing represents more than 25% of the housing stock, second only to Netherlands
in the OECD and reaches much higher levels in certain urban areas such as Vienna where it represents
more than 60% of residential housing. It has specific features, including the involvement of different
government layers and private structures, such as housing associations (co-operatives) funded by the
Länder, and dwellings owned and let by municipalities (most pronounced in Vienna). Rental markets
0.0
0.2
0.4
0.6
0.8
1.0
0.0
0.2
0.4
0.6
0.8
1.0
USA GBR AUS CAN DEU JPN DNK SWE FRA ESP FIN NLD BEL NOR ITA AUT IRL
A. Ratio of bank credit to non-financial corporations to total private sector funding¹
2011-2017 2001-2011
0
50
100
150
200
250
AU
T
ITA
DE
U
NO
R
OE
CD
BE
L
FR
A
ES
P
FIN
GB
R
NLD
DN
K
CA
N
SW
E
US
A
CH
E
% of GDPB. Stock market capitalisation
2017
0.00
0.02
0.04
0.06
0.08
0.10
GR
CIT
AC
ZE
PO
LA
UT
PR
TE
SP
HU
ND
EU
NO
RB
EL
EU
IRL
NLD
CH
EF
RA
GB
RS
WE
FIN
DN
KLU
X
% of GDP
C. Venture capital raised²Average between 2013 and 2017

17
OECD ECONOMIC SURVEYS: AUSTRIA 2019 © OECD 2019
prevail in urban areas, while rural areas (40% of the population live there) are characterised by high
proportions of personal ownership but thin housing transactions and markets.
Social housing has provided affordable high-quality housing for large parts of the population, but it now
faces challenges. When entitlements are based on open-ended non-portable long-term contracts with low
rents, they may impede the geographical mobility of beneficiaries. In other segments, differences with free
market rents are lower than in other OECD countries. Many beneficiaries have also reached middle- and
upper-middle income categories, which may lead to bottlenecks if demand from lower-income and younger
applicant households expands (Mundt, 2018, link; Geymüller and Christl, 2013, link). According to a recent
international estimate, the overall housing supply has a low long-term elasticity to demand conditions
(Geng, 2018 link; IMF, 2018, link). Other recent domestic research has however suggested that such
elasticity is not particularly weak (Schneider, 2019, forthcoming). Mixed findings may reflect uneven
conditions in urban vs. rural housing markets in different regions.
Beyond short-term cyclical developments, the housing market will likely face long-term pressures from
domestic and international migration, changing family patterns and the expansion of the population of low-
income earners, while urban sprawl has already attained harmful levels. This requires more effective land
planning, urban development and public transportation policies through better integrated co-operation
between government levels.
High social expectations in the area of housing and the multi-dimensional character of new policy
challenges invite a comprehensive long-term housing and social housing strategy. The related initiatives
and experiences of other OECD countries such as Sweden (Hansson, 2018, link), which have also tried to
increase the supply elasticity of housing without aggravating social segregation, by means of reforms in
urban planning, building codes and public infrastructure development can be drawn on.
Independently from domestic market conditions, foreign home purchasers have recently exerted upward
pressure on house prices in Vienna and in certain Western Länder (EC 2018, link). This has made existing
residences and constructible land very expensive for average households. There has been an average
40% increase in house prices over the past decade, but price levels remain still below comparable
countries. The mortgage debt stock and related financial vulnerabilities are also lower (Figure 1.5).
Nonetheless, observing that rapid growth of new mortgage lending may raise challenges to financial
stability, the Financial Market Stability Board, drawing on Central Bank analysis, issued a communication
in 2018 on sustainable lending standards to keep systemic risks at bay also in the future.2 These
safeguards should be made compulsory, as in some other OECD economies like Norway (Norwegian
Ministry of Finance, 2018, link).

18
OECD ECONOMIC SURVEYS: AUSTRIA 2019 © OECD 2019
Figure 1.5. Housing market risks have been contained so far but may be increasing
Source: OECD (2019), OECD Economic Outlook: Statistics and Projections (database) and OECD Analytical Housing Prices database.
StatLink 2 https://doi.org/10.1787/888934025062
Table 1.3. Past financial policy recommendations
Past OECD recommendations Actions taken
Rigorously supervise large and small banks.
Facilitate digitalisation, restructuring and cost reduction in the
banking sector.
Continue to support venture capital investment and reduce tax and
other disincentives for equity investments.
A Start-up Package was introduced May in 2019, with i) additional risk-finance through a public Digitalization and Growth Fund (which will co-invest in start-ups together with private venture-capital funds)
and ii) more credit guarantees. It comprises regulatory sandboxes, which shall remove certain administrative burdens from start-ups, and new educational streams to ensure the availability of skilled
workforce.
The Vienna Stock Exchange launched in January 2019 a new
market segment “direct market plus” as an initial and easy access to
the stock market. 8 companies are already listed.
2000 2002 2004 2006 2008 2010 2012 2014 2016 201880
90
100
110
120
130
140
C. Price-to-income and price-to-rent ratiosIndex 2000Q1-2019Q1 average = 100
Price-to-rent ratio Price-to-income ratio
-2
-1
0
1
2
3
4
5
6
ITA
SW
E
FIN
GB
R
CA
N
NO
R
DN
K
ISL
OE
CD
AU
T
IRL
GR
C
DE
U
US
A
NLD
ES
P
%
A. Real house prices (annual change)2019Q1 versus 2018Q1
75
100
125
150
175
200
225
250
275
2000 2002 2004 2006 2008 2010 2012 2014 2016 2018
B. Real house prices (index)
Austria Canada Denmark
Sweden Spain
Index 2000 =100
0
50
100
150
200
250
300
ITA
AU
T
DE
U
GR
C
US
A
ES
P
FR
A
FIN
GB
R
IRL
SW
E
NLD
NO
R
DN
K
D. Gross household debt 2018 or latest year
% of net disposable income

19
OECD ECONOMIC SURVEYS: AUSTRIA 2019 © OECD 2019
Employment performance, well-being and social cohesion are strong but come under
pressures
Broad-based growth on the back of myriad entrepreneurial firms across all regions and supported by
growth-friendly social partnership has underpinned Austria’s strong well-being and social cohesion so far.
It has helped to create well-paid jobs for workers with different education levels, generally well trained
according to labour market demands through a multitude of vocational education streams. The generous
welfare system insures against labour market risks and provides very good retirement incomes. Higher
proportions of children and elderly than in comparable countries are taken care of by their families.
The typical well-being outcomes include (Figure 1.6):
The broad-based growth of employment for prime age men who are generally satisfied with their
working conditions despite long average work hours.
In contrast, full-time labour force participation and career engagement of women carrying out family
responsibilities are restricted, and a high share of low-skilled elderly withdraw from the labour force
as soon as this is legally possible - these issues are addressed in the new OECD Jobs Strategy,
link.
Household incomes have increased regularly at top, median and bottom deciles, with relatively low
inequality and poverty.
A high degree of safety has been achieved in the daily life of citizens, with low levels of crime.
Local social connections are highly appreciated, with strong support networks among friends and
family.
As a result, subjective well-being has attained one of the highest levels in the OECD area, both in
terms of long-term life satisfaction and short-term affect balances (balances of positive and
negative feelings).
However, as basic human capital is transmitted principally within families, intergenerational social
mobility remained particularly low, notably for migrant families.
Social partners and policymakers being focused on employment growth, environmental impacts
have been less prominently integrated in policymaking.
Regional variations in well-being remained smaller than in most other OECD countries. Vienna,
where nearly a quarter of the population lives, is regularly ranked among the most attractive living
places in the world, even if it faces starker tensions on its service infrastructure. The dispersion of
well-being indicators between regions is low (Figure 1.6, Panel C).

20
OECD ECONOMIC SURVEYS: AUSTRIA 2019 © OECD 2019
Figure 1.6. Well-being is high and regionally balanced
1. Each well-being dimension is measured by one to four indicators from the OECD Better Life Index set. Normalised indicators are averaged
with equal weights. Indicators are normalised to range between 10 (best) and 0 (worst) according to the following formula: (indicator value -
minimum value) / (maximum value - minimum value) x 10. The OECD aggregate is population-weighted. It excludes Colombia and Lithuania.
2. Relative ranking of the regions with the best and worst outcomes in the 11 well-being dimensions, with respect to all 395 OECD regions. The
11 dimensions are ranked according to the size of regional disparities in the country. In order to increase the sample size, all the annual waves
of the Gallup survey between 2006 and 2014 are pooled together.
3. Gap between top and bottom regions. Austria’s rank between 34 OECD countries is shown, 34 (highest dispersion), 1 (lowest dispersion).
Source: OECD Better Life Index database, www.oecdbetterlifeindex.org and OECD Regional Well-being database,
www.oecdregionalwellbeing.org.
StatLink 2 https://doi.org/10.1787/888934025081
Austria has indeed long been among the OECD countries with the lowest income distribution inequalities
(Figure 1.7). Collective wage bargaining, founded on a social partnership system that the OECD has
termed “organised decentralisation” and identified as an international good practice has helped reduce
differences in market wages. Collective negotiations have taken into account the interests of the self-
employed and of the farmers. However, against this favourable background, recent market developments
(including increased divergences between more and less well performing employer firms) have negatively
affected income distribution (OECD, 2018, link; World Inequality Database, 2018, link).
0
2
4
6
8
10Income and wealth
Jobs and earnings
Housing
Work-life balance
Health status
Education and skillsSocial connections
Civic engagementand governance
Environmental quality
Personal security
Subjective well-being
A. OECD Better life index¹, 2017Austria
OECD
Civicengagement
Work-lifebalance
Educationandskills
Housing Healthstatus
Environmentalquality
Socialnetwork
Subjectivewell-being
Incomeand
wealth
Joband
earnings
Personalsecurity
B. Country rankings, 2017
20% top performers 60% middle performers 20% bottom performers Austria
Coun
tries
rank
ing
(1 to
35)
Vorarlberg
Tyrol
Tyrol
BurgenlandStyria Salzburg Tyrol
Carinthia
Tyrol
Burgenland
Lower Austria
ViennaCarinthia
Vienna Vorarlberg
Vienna
Carinthia ViennaVorarlberg
Vorarlberg
Vienna
Carinthia
(24) (28) (13) (23) (12) (12) (9) (14) (14) (12) (2)
Jobs Environment Community Civicengagement
Safety Accessto
services
Health Education Lifesatisfaction
Housing Income
C. Relative performance of Austrian regions by well-being dimensions², June 2016Top Region Bottom Region
Rank
ing
of O
ECD
regi
ons (
1 to
395
)
top
20%
botto
m20
%m
iddl
e 60%
OECD rank in inter regional dispersion³

21
OECD ECONOMIC SURVEYS: AUSTRIA 2019 © OECD 2019
Figure 1.7. Income inequalities are relatively low
1. Scale from 0 (perfect equality) to 1 (perfect inequality).
2. The poverty line is 50% of the median household income of the total population. Household income is adjusted to take into account household
size.
3. The ratio of 50% of people with highest earnings to 10% of people with lowest earnings.
Source: OECD (2019), OECD Social and Welfare Statistics (database) and OECD Employment and Labour Market Statistics (database).
StatLink 2 https://doi.org/10.1787/888934025100
The tax and transfer system helped reduce income inequalities, even if redistribution has somewhat
weakened in the face of growing divergences in market incomes (Guger and Rocha-Akis, 2016, link).
Social transfers are large and progressive, while taxation is rather neutral and regressive in certain areas.
The earnings ratio between the 9th and 5th and the 5th and 1st income deciles remain high (Figure 1.7).
A recent study, which took into account all direct and indirect taxes and social security contributions, found
that the households between the 30th and 80th income percentiles face a broadly flat tax rate (Altzinger
et al., 2016, link).
Wealth distribution has long been less equal than income distribution (Figure 1.8). In Gini indicators of
equality Austria comes 7th in income distribution, and 14th in wealth distribution among 35 OECD Member
countries. At the top end of wealth distribution, the 10% wealthiest Austrian households hold the 4th highest
share of national wealth in the OECD area. Yet, the wide coverage of social protection and the availability
of social housing reduce the incentives of low-income households to accumulate family wealth during their
working lives. Home ownership, the most important asset of households in market economies, is less
widespread than in comparable countries. Features of long-term tenure contracts may also be making
housing unattractive as a financial investment.3 Taking into account these factors, actual wealth inequality
was found to be slightly better than its statistically expected level (Pham Dao, 2018, link; see also Fessler
and Schürz, 2018, link).
Intergenerational transmissions of wealth are not taxed, as Austria has de facto abolished inheritance
taxation in 2008 after a legal stalemate between the Constitutional Court and Parliament. It is currently one
of the very few OECD countries without inheritance taxes. Recent studies showed that, in the absence of
inheritance taxation, bequests play a larger role in wealth accumulation than in other EU countries (Leitner,
2016, link). As OECD research identified the taxation of immovable assets as a growth-compatible and
inclusive form of revenue collection (Akgun et al., 2017, link), re-introducing inheritance taxation in Austria
can be expected to help reduce wealth inequalities and improve intergenerational social mobility without
undermining the economy’s growth potential. OECD’s Center for Tax Policy suggested recently that
0.20
0.28
0.36
0.44
0.52
0.60
DNK SWE AUT NLD DEU CHE
After taxes and transfers
Before taxes and transfers
A. Gini coefficients¹Total population, 2016 or latest year
1.0
1.2
1.4
1.6
1.8
2.0
SWE DNK CHE NLD AUT DEU
C. D5/D1 earnings ratio³2017 or latest year
0.00
0.05
0.10
0.15
0.20
0.25
DNK NLD CHE SWE AUT DEU
RatioB. Relative poverty²2016 or latest year
Total
0-17 year-olds
66 year-olds or more

22
OECD ECONOMIC SURVEYS: AUSTRIA 2019 © OECD 2019
“growing wealth inequality may increase the need for well-designed inheritance taxes” and is starting an
internationally comparative investigation of inheritance taxation practices (OECD, 2019). Adverse effects
on the transmission of well-performing family firms can be handled by special provisions, such as those
implemented in Switzerland (Sandbu, 2019, link).
Four new trends are likely to challenge the existing well-being model: i) disruption risks in the labour market
from technological changes and digitalisation, ii) pressures on gender balances from tensions between
improving professional opportunities and continuing family responsibilities of women; iii) the challenges of
integrating increased numbers of migrants, and iv) lower tolerance for environmental harms, also as a
consequence of Austria’s international commitments.
Figure 1.8. The distribution of private wealth is more unequal than the income distribution
Note: Wealth values are expressed in 2011 USD by expressing values in prices of the same year (2011) through consumer price indices and
by converting national values into a common currency using PPPs for household consumption. They do not include discounted pension
entitlements.
Source: C., Balestra and R. Tonkin (2018, link), "Inequalities in household wealth across OECD countries: Evidence from the OECD Wealth
Distribution Database", OECD Statistics Working Papers, No. 2018/01 and OECD Wealth Distribution Database.
StatLink 2 https://doi.org/10.1787/888934025119
0
2
4
6
8
10
0
50
100
150
200
250
NLD
DN
K
CH
L
HU
N
DE
U
US
A
AU
T
IRL
PR
T
FIN
NO
R
SV
N
PO
L
FR
A
OE
CD
KO
R
ITA
NZ
L
CA
N
JPN
ES
P
GB
R
AU
S
BE
L
A. Median net wealth per household and ratio of mean to median2015 or latest year
Median net wealth (LHS) Ratio of mean to median (RHS)
Thousand, USD
-240
-180
-120
-60
0
60
120
180
240
NLD DNK NOR DEU FIN AUT
B. Wealth of poorest 20% of households2014 or latest year
Financial wealth Real-estate wealthOther non-financial wealth Property liabilitiesOther liabilities Net wealth
Thousand, USD
-200
0
200
400
600
800
1000
1200
1400
DNK FIN NLD NOR DEU AUT
C. Wealth of richest 20% of households2014 or latest year
Financial wealth Real-estate wealth
Other non-financial wealth Property liabilities
Other liabilities Net wealth
Thousand, USD
Ratio

23
OECD ECONOMIC SURVEYS: AUSTRIA 2019 © OECD 2019
Changing skills needs in the labour market and digitalisation
Creation of well-paying jobs for the majority of the population has long been the foundation of well-being
and social cohesion in Austria. However, new megatrends, including digital transitions and shifts in global
production networks, started to disrupt this labour market regularity. The shift of the employment structure
from middle to higher skill activities has been one of the largest among OECD countries (Figure 1.9). This
adjustment has unfolded relatively smoothly so far, a majority of workers preserving their long-term
employment contracts and few showing concerns about their job security (Stiglitz et al., 2018, link). This
reflects good employment relations within firms, where large-scale restructurings can be carried out
internally. It may also be due to the more disrupting transformations unfolding with some lag in Austria.
Available indicators suggest indeed that many job restructurings are still pending, partly along skill lines,
but not only. As shown on Figure 1.9, non-routine high and middle skills remain in high demand but demand
for automatable qualifications, irrespective of their educational requirements is contracting rapidly.
Figure 1.9. Structural changes in employment went smoothly so far, but more is to come
1. Based on International Standard Classification of Occupations (ISCO-88). High-skilled occupations include legislators, senior officials, and managers
(group 1), professionals (group 2), and technicians and associate professionals (group 3). Middle-skilled occupations include clerks (group 4), craft and
related trades workers (group 7), and plant and machine operators and assemblers (group 8). Low-skilled occupations include service workers, shop
and market sales workers (group 5), and elementary occupations (group 9).
2. Based on the survey of Adult Skills (PIAAC, 2012). Jobs are at high risk of automation if the likelihood of their job being automated is at least
70%. Jobs are at risk of significant change if the likelihood is between 50 and 70%.
3. The numbers in bubbles indicate the job category based on ISCO-08 and bubble size represents the share of jobs in the occupation with
respect to total employment in the region. Occupations are ranked from low (grey bubbles) to high risk of automation (red bubbles) along the
horizontal axis. Changes in the number of jobs for each occupation are reported along the vertical axis.
Source: OECD (2018), Job Creation and Local Economic Development 2018: Preparing for the Future of Work, OECD (2017), OECD
Employment Outlook 2017, and L., Nedelkoska and G. Quintini (2018), "Automation, skills use and training", OECD Social, Employment and
Migration Working Papers, No. 202.
StatLink 2 https://doi.org/10.1787/888934025138
0
7
14
21
28
35
42
49
56NO
R FIN SWE
USA
GBR
DNK
NLD
AUT
FRA
DEU
JPN
%
B. The share of jobs at high risk of automation and significant change²
Jobs at high risk of automation
Jobs at risk of significant change
11
13
22
23
12
21
24
26
14
3234
35
25
31
33
4244
51
52
41
43
53
54
72
73
74
61
71
7583 93
96 6291
94
-21
-14
-7
0
7
14
21
28
0.2 0.3 0.4 0.5 0.6 0.7
Average risk of automation
Thousand
D. Job creation due to risk of automation by occupation³East Austria, 2011-16
11
13
22
23
12
2124
26
14
32
3435
25
31
33
42
44 5152
41
4353
54
72
73
61
71
75
81
82
83
93
96 62
91
94
-40
-30
-20
-10
0
10
20
30
0.2 0.3 0.4 0.5 0.6 0.7
Thousand
Average risk of automation
C. Job creation due to risk of automation by occupation³West Austria, 2011-16
-20
-15
-10
-5
0
5
10
15
20
AUT
CHE
DNK
FRA
SWE
GBR
NOR
NLD FIN DEU
USA
JPN
% pts
Low skill Middle skill High skill
A. Change in the share in total employment¹Percentage point change between 1995 and 2015

24
OECD ECONOMIC SURVEYS: AUSTRIA 2019 © OECD 2019
A recent development in the labour market is the emergence of severe recruitment difficulties. The
proportion of firms reporting skill shortages, not only in high-technology professions but also for a wider
range of qualifications (spanning from finishing skills in building construction to cooks in restaurants)
reached unprecedented levels in Austrian standards (Figure 1.10). According to an employer survey of the
Federal Ministry of Digital and Economic Affairs and Austrian Federal Economic Chamber, 87% of the
4 500 companies questioned reported a skill shortage, an increase of 12 percentage points compared to
the previous year (Dornmayer and Winkler, 2018). Results from the most recent EIB investment survey
show also that 81% of Austrian companies of all sizes refrain from capacity increasing investment due to
a lack of skilled staff, which is above the EU average and a strong increase compared to the year before
(EIB, 2018). Further, 60% of the Austrian firms experiencing skill shortages reported a drop in sales due
to the shortage (ibw, 2018).
In digital technologies, as many as 90% of human resource managers of Austrian firms report that their
firm have “significant training needs”. In response, the entire apprenticeship system (including more than
200 professional profiles) is being modernised with new focus on digital and green technologies.
Symmetrically, employment opportunities have narrowed for workers in the vulnerable segments of the
labour market. The rate of unemployment for the low-skilled and the elderly increased more than in
comparable countries, despite the strong economic cycle. The corresponding rate for the long-term
unemployed decreased recently to the level of Germany, however is still relatively high compared to peer
countries such as Denmark (Figure 1.11). The rate of structural unemployment increased more rapidly4.
The Beveridge curve which captures labour market mismatches displays a distinct outward shift. These
developments, of an unaccustomed magnitude, form a challenge to Austria’s traditional pattern of well-
being and social cohesion.

25
OECD ECONOMIC SURVEYS: AUSTRIA 2019 © OECD 2019
Figure 1.10. Skills could be improved to ease recruitment challenges
1. Positive values indicate skill shortage while negative values point to skill surplus. The larger the absolute value, the larger the imbalance. The
maximum value +1 reflects the strongest shortage observed across 31 OECD countries and skills dimensions.
2. Based on the ibw company survey conducted in April 2018 on demand for/lack of skilled labour. Companies respond to a question such as
"In case of which (formal) qualifications or educational degrees did you encounter difficulties when looking for suitable staff last year?”
Source: OECD (2018), OECD Skills for Jobs Database and H., Dornmayr and B., Winkler (2018), "Skilled Labour Shortage in Austria", ibw
research brief, issue No. 101, September.
StatLink 2 https://doi.org/10.1787/888934025157
-0.2
0.0
0.2
0.4
0.6
0.8
1.0
-0.2
0.0
0.2
0.4
0.6
0.8
1.0
GBR HUN CHE POL FRA SVN BEL SWE GRC IRL DEU CZE DNK NOR NLD SVK PRT AUT ESP ITA FIN
A. Knowledge of computers and electronics¹Skill shortage scale between -1 and 1 (strongest), 2015 or latest year
0 20 40 60 80 100
0 20 40 60 80 100
Apprenticeship diplomas
People without specific qualifications (except compulsory school) butwith practical job experience
Qualifications from engineering and crafts schools (without thematriculation certificate)
Higher VET qualifications (such as master craftsperson/industrial master,specialist academies)
Qualifications from engineering colleges
Frequently Rarely Never
C. Qualifications or educational degrees where companies encountered difficulties finding suitable candidates²2017
-0.2
0.0
0.2
0.4
0.6
0.8
-0.2
0.0
0.2
0.4
0.6
0.8
HUN POL CHE BEL GBR GRC NLD SWE PRT LUX NOR SVK AUT FRA IRL DEU CZE DNK ITA ESP FIN
B. Mathematics knowledge¹Skill shortage scale between -1 and 1 (strongest), 2015 or latest year

26
OECD ECONOMIC SURVEYS: AUSTRIA 2019 © OECD 2019
Figure 1.11. Increased mismatch in labour supply
Source: Eurostat (2019), "Labour force structure" and "Employment and social policy indicators" in Tables on EU policy (database), OECD
(2019), Labour Force Statistics (database) and Arbeitsmarktservice (AMS).
StatLink 2 https://doi.org/10.1787/888934025176
Education and life-long training need to adapt to this changing world
Against these transformations, the upskilling of the population is key (OECD, 2019, link). It concerns the
full spectrum of working age cohorts as well as the children and youth in education, and is the fundamental
condition for strong and socially inclusive growth in the future. This common challenge to OECD countries
is especially salient in Austria, as the fully publicly funded and vocational training-centred education system
which supported the country’s post-war economic and social development needs to adapt at a large scale.
Better integration and continuity between all education layers from childhood to life-long education, and
more operational articulation between vocational, tertiary and life-long professional training are on the
cards.
These well-known challenges include the adaptation of the numerous apprenticeship streams, the
adjustment of the academic and vocational secondary school curricula to the digital revolution, and a
Job vacancy rate, %
1993
1994
19951996 1997
1998
1999
2000
2001
200220032004
20052006
2007
2008
2009
2010
2011
2012
2013 20142015
2016
2017
2018
0.5
0.8
1.1
1.4
1.7
2.0
5 6 7 8 9 10Unemployment rate, %
D. Beveridge curve
-0.6
-0.4
-0.2
0.0
0.2
0.4
DEU DNK NLD CHE SWE AUT
%
A. Change in the unemployment rate by educational attainment between 2010 and 2018
Below upper-secondary education, 15-74 year-olds
-0.9
-0.6
-0.3
0.0
0.3
0.6
DEU DNK SWE NLD CHE AUT
%
B. Change in the unemployment rate by age cohort between 2010 and 2018
55-64 year-olds
1.0
1.6
2.2
2.8
3.4
4.0
2010 2011 2012 2013 2014 2015 2016 2017 2018
C. Long-term unemployment rate1 year and over, 15-74 year-olds
Austria Denmark Germany
% of labour force

27
OECD ECONOMIC SURVEYS: AUSTRIA 2019 © OECD 2019
stronger focus than in the past on life-long learning capacities of all. Tertiary education should better
respond to the new qualification needs of the economy. The promotion of entrepreneurship education is
also particularly important in Austria, in order to support innovation and improve efficiency in the productive
sector (OECD, 2019, link5). A fundamental facet of the agenda is significantly improving early childhood
education, not only as a form of care but in order bring up children from a large variety of family, cultural
and language backgrounds to the same strong basic education standards. This would help to ensure a
strong workforce, help achieve low inequality and contributes to equality of opportunity.
Education policymakers are addressing these challenges across all school layers and technical
specialisation fields throughout Austria. New classes are being opened for early childhood education and
further resources are engaged in their pedagogical quality. Secondary education is being made less
segmented through “new secondary schools” offering more general educational content. Universities of
Applied Sciences are growing in number, to respond to labour market demands for high-level but
application-oriented professionals. Public apprentice workshops are opened for candidates not finding
apprenticeship positions in enterprises – or who are not sufficiently trained for such positions. Co-ordination
between government layers and government Ministries in charge of different age cohorts and general
versus vocational education is becoming more crucial.
After recognising the earlier efforts for fostering education policy co-operations between government
layers, an OECD review of Austria’s school system in 2016 had recommended to allocate each school
layer to one government level (OECD, 2016, link). A more recent OECD analysis of pedagogical co-
operation and complementarity between pre-school education (municipal government responsibility in
Austria) and school education (managed in co-operation between federal and Länder governments) hinted
at the innovative experiences of several other OECD countries in integrating these policies, with important
benefits for the development of children such as in Norway (OECD, 2017, link and Box 1.2 below).
The government in place after the 2017 elections was initiating a comprehensive reform of the education
system in all its layers (Box 1.1). The reform contained an increase in the autonomy of schools against a
stricter monitoring and management of their performance, while taking into account the socio-economic
and other characteristics of their students. The Ministry of Education started to draw on the experience of
other OECD countries (Bruneforth et al., 2019, link). For example, Denmark has built a data warehouse
on student and school performances (with 35 indicators per student including national test results, school
examination results, student well-being surveys) to analyse the relations between inputs and outputs and
to train a pool of experts capable to advice central and local policymakers on this basis. Austria can draw
on this experience (Nusche et al., 2016, link).
The Ministry for Digital and Economic Affairs launched also 15 new apprenticeship occupational profiles,
enriched with digital content. They include “IT system technicians”, “IT operation technicians”, "e-
commerce professionals" and “application coders”. These new profiles are expected to provide companies
with the technicians they need. Further modernisation of apprenticeship profiles is ongoing, with employer
firms participating in the definition of new needs and in the elaboration of new profiles. These co-operative
projects are completed and implemented rapidly (at most within one year).
Systematically monitoring and reporting the labour market outcomes of existing and new education
streams, on the basis of individual micro data, will be key for evaluating the adequacy of policies to goals.
Policymakers intend to make prominent use of such data resources. PISA and PIAAC type surveillance
exercises can be used systematically and Big Data techniques create new policy evaluation opportunities.
Austria’s national proficiency tests for all young students, put in place with pedagogical adjustment
purposes, are a foremost step in this direction. The rich data generated through these exercises can be
analysed by researchers of various disciplines. All OECD countries have started to build up micro data
based performance evaluation systems, but for these efforts to be fruitful, results should be fully open to
the independent research community (Charbonnier, 2019, link). Austrian reformers are engaged to make
this data fully accessible (privacy protection safeguards notwithstanding).

28
OECD ECONOMIC SURVEYS: AUSTRIA 2019 © OECD 2019
There are some concerns about the labour market relevance of life-long learning programmes for the low-
skilled. The participation rates of Austrian adults to these programmes is above OECD averages, but below
peer countries (Figure 1.12). The participation rate can be increased and the existing concerns on the
quality of part of these programmes should be addressed (OECD, 2014, link). Active participation of
employer organisations to the administration of these programmes may help (Martin, 2018, link). Additional
government support can also be offered for the inclusion of low-skilled and elderly workers, whose
participation is particularly low in Austria. It is possibly subject to market failures arising from firms’
uncertainties on investment returns above certain age thresholds (Dauth and Toomet, 2016, link). Work
organisations in employer firms should be adapted and made compatible with life-long learning activities
(Figure 1.12).
Figure 1.12. Participation in life-long learning can be raised further
1. Includes formal as well as non-formal education and training. The reference period for the participation is the four weeks prior to the interview.
Low education refers to below upper secondary education (ISCED 0-2) and high education refers to tertiary education (ISCED 5-8).
2. Based on the survey of Adult Skills (PIAAC, 2012, 2015). Average of countries participating in PIAAC for the OECD aggregate.
Source: OECD (2019), OECD Adult education and learning (database), and Eurostat (2019), Education and training (database).
StatLink 2 https://doi.org/10.1787/888934025195
0
8
16
24
32
40
EU DEU AUT NLD DNK SWE CHE
%
A. Participation in life-long learning by age group
% of population aged 26-64, 2018
25-34 55-64
0
10
20
30
40
50
DNK EU NLD AUT DEU SWE CHE
%
B. Participation in life-long learning by educational attainement
% of population aged 26-64, 2018
Low High
0
10
20
30
40
50
DEU EU AUT NLD DNK SWE CHE
%
C. Participation in life-long learning by labour force status
% of population aged 26-64, 2018
Employed Unemployed Inactive
0
8
16
24
32
40
Shortage of timework related
Shortage of timefamily related
Inconvenient timeor place
Lack of financialresources
%
D. Barriers to participation in adult learning²% of adults aged 26-64 who wanted to participate
but did not
Austria OECD

29
OECD ECONOMIC SURVEYS: AUSTRIA 2019 © OECD 2019
Table 1.4. Past education policy recommendations
Past OECD recommendations Actions taken Make schools and education tracks more inclusive. Strengthen the early
socialisation of children from disadvantaged backgrounds.
Intermediary apprenticeship qualifications have been created to
facilitate integration and further training opportunities.
Ensure that tertiary and vocational education adjust to changing needs. All education streams and curricula will be screened in 2019 to advance their adaptation to the digital revolution. More than 50 occupational profiles and their vocational curricula will be
modernised in the first year.
Allow universities to re-introduce tuition fees and accompany them with grants and
income-contingent student loans.
Continue to modernise ICT-related curricula and teaching methods in schools. In 2018, the Federal Ministry for Digital and Economic Affairs introduced 13 new 4 year-long apprenticeship streams enriched
with digital content.
Enhance incentives for businesses to offer apprenticeship positions. New funding support has been made available to firms and apprentices to increase the quantity and quality of
apprenticeship places, including via language support,
additional coaching services and internships abroad.
Regional aspects of labour market imbalances
Regional labour market imbalances are relatively new in Austria (Figure 1.13). Skill shortages grew in
particular in Western regions. In contrast, in Vienna where more than 20% of national employment is
concentrated, the rate of unemployment, and the number of applicants per vacancy are well above national
averages. This excess labour supply in Vienna against labour shortages in much of the rest of the country
may be revealing the reluctance of parts of the population to move between regions, but also perceived
risks of inconsistency between short- and long-term employment and career prospects under changing
industrial structures in different regions. The related uncertainties may be particularly high for families with
double earners. Vienna and large cities are in this regard more attractive.
Population ageing compounds regional skill shortages. Most Austrian regions can expect declines in the
working-age population, although Carinthia and Styria will be particularly affected (Dornmayer and Winkler,
2018). The regional heterogeneities in the projected development of 20- to 60-year olds goes hand in hand
with large disparities in skill shortages (Dornmayer and Winkler, 2018).
Public policies should facilitate the geographical mobility of citizens by eliminating all policy-related factors
hindering mobility. Evaluating and addressing the obstacles arising from the non-portability of local housing
benefits, from uneven rent regulations, and from insufficient oversight over and control of social housing
entitlements should be a priority. To stimulate the inter-regional mobility of young workers and reduce
interregional skill mismatches, a new “b.mobile” programme was recently introduced to facilitate cross-
regional apprenticeship placements.

30
OECD ECONOMIC SURVEYS: AUSTRIA 2019 © OECD 2019
Figure 1.13. Regional imbalances in labour market
1. Internal migrations are changes of main residence within Austria. External migrations are cross-border changes of residence. The duration of
residence must not be shorter than 90 days in terms of effective registration of main residence.
Source: Statistik Austria, and WKO Fachkräfteradar, ergebnisse einer untersuchung des ibw.
StatLink 2 https://doi.org/10.1787/888934025214
B. External and internal migration in 9 Länder¹
A. Employment growth, unemployment and vacancies in 9 Länder
Number of persons
85
18
Burgenland
85
11
Carinthia
16
5
13
Lower Austria
16
4
9
Upper Austria
17
10
26
Vienna
14
5
10
Styria
11
3
8
Salzburg
23
3
9
Tyrol
23
4
8
Vorarlberg
1276 613
Burgenland
2598
4172
Lower Austria-520
7273
UpperAustria
-868
1896
Carinthia
-226
4505
Styria
-405
17196
Vienna
-1032
4206
Tyrol
208
1604
Vorarlberg
-1031
3165
Salzburg

31
OECD ECONOMIC SURVEYS: AUSTRIA 2019 © OECD 2019
The new OECD Jobs Strategy provides a comprehensive framework and policy recommendations to help
member countries, including Austria, address these labour market challenges. It goes beyond job quantity
and considers job quality and inclusiveness as central policy priorities. The central message is that
flexibility-enhancing policies in product and labour markets are necessary but not sufficient. Policies and
institutions that protect workers, foster inclusiveness and allow workers and firms to make the most of
ongoing changes are needed to promote good and sustainable outcomes (OECD, 2018, link)
Increased pressures on gender balances
Austria has a long-established “male breadwinner/separate gender roles” model in work, family and life
arrangements (OECD, 2015, link). There is growing consensus in society to shift to a better balance of
opportunities and life choices between genders. Expectations augmented as women caught up with men
in educational enrolment and achievements. The fact that a large share of women with children withdraw
fully or partly from the labour force (irrespective of their educational and professional background) until
their children reach upper secondary school age (OECD, 2015, link) deprives society from existing talent,
higher household incomes and stronger growth and fiscal revenues (Figure 1.14). However, working part-
time can also reflect preferences on work-life-balance. In-depth studies tend to conclude that it often results
from insufficient public service support and tax disincentives (OECD 2015, link). The recent replacement
of the tax deductibility of child care costs and of the child care allowance with a generally available tax
credit per child may provide a weaker incentive for labour force participation of women with children.
Despite several policy initiatives in recent years, including the inclusion of gender budgeting in the federal
constitution and the adoption of a “National Action Plan on Gender Equality in the Labour Market”, actual
progress with gender rebalancing has fallen behind comparable EU countries (EIGE, 2018, link).
Gender pay gaps are high. Divergences between men’s and women’s professional choices go deeper than
in comparable countries, with men prioritising scientific and technical disciplines and women social service
fields leading to less well-paid occupations – reflecting probably their uneven prospects for subsequent
full-time career engagement (OECD, 2018, link). Still, as a result of co-ordinated wage negotiations, gender
pay gaps are not bigger for lower income groups as in other OECD countries (OECD, 2017, link).

32
OECD ECONOMIC SURVEYS: AUSTRIA 2019 © OECD 2019
Figure 1.14. Gender gaps remain large
1. Part-time is defined as less than 30 hours worked per week.
Source: OECD (2018), OECD Employment Outlook 2018.
StatLink 2 https://doi.org/10.1787/888934025233
Limited availability of childcare, full-day schooling and long-term elderly care in much of the country is
recognised as the single biggest constraint on women’s life and professional choices (Buxbaum and
Pilkbauer, 2015, link). More than 90% of 3-5 year old children are now taken care of in pre-school facilities
but the participation of under 3 year-olds, which stands at around 25%, is much lower than in most peer
countries where it reaches 50-80%. Also, only less than half of available services are offered for more than
30 hours a week, which is required for full-time labour force participation by under 3 year-olds’ main carers
(Smidt, 2018, link; EC, 2018, link). Lack of full-day schooling for more than 50% of school children aged
6-15 (Nusche et al., 2016, link) creates an additional need for high-quality options for their care and
education outside school hours. Not only sufficient quantity but also satisfactory quality of childcare
services is a pre-requisite to free-up women’s labour force participation. In this respect, some concerns
about the pedagogical achievements of kindergarten education have started to be addressed through new
educational programmes for kindergarten teachers.
Employed full-time Employed part-time¹ Unpaid workers Retired
0
10
20
30
40
50
60
70
80
90
100
15.1
9
20.2
4
25.2
9
30.3
4
35.3
9
40.4
4
45.4
9
50.5
4
55.5
9
60.6
4
65.6
9
70.7
4
Austria
A. Women's professional careers combine different working lives
0
10
20
30
40
50
60
70
80
90
100
15.1
9
20.2
4
25.2
9
30.3
4
35.3
9
40.4
4
45.4
9
50.5
4
55.5
9
60.6
4
65.6
9
70.7
4
Netherlands
0
10
20
30
40
50
60
70
80
90
100
15.1
9
20.2
4
25.2
9
30.3
4
35.3
9
40.4
4
45.4
9
50.5
4
55.5
9
60.6
4
65.6
9
70.7
4
Sweden
0
10
20
30
40
50
0
10
20
30
40
50
BE
L
HU
N
LUX
SV
N
ITA
NZ
L
NO
R
DN
K
TU
R
ES
P
GR
C
PO
L
SW
E
ISL
FR
A
NLD
SV
K
OE
CD
IRL
AU
S
CZ
E
CH
E
DE
U
GB
R
US
A
AU
T
ME
X
PR
T
CA
N
FIN
CH
L
LVA
ISR
JPN
ES
T
KO
R
%%
B. Gender disparities in earnings of full-time employees Difference in median earnings between men and women, full-time employees, 15 year and over
2014 2005

33
OECD ECONOMIC SURVEYS: AUSTRIA 2019 © OECD 2019
A similar challenge emerges in the area of elderly care (Grossmann, 2017, link). A higher proportion of the
dependant elderly than in peer countries – around 80% of them - are taken care of by their families (OECD,
2015, Survey, link). The welcome lengthening of average life expectancy, together with the rise of more
complex care needs raised by chronic diseases expand the demand for long-term care. These needs have
to be addressed without unduly restricting the labour force participation of relatives. Austria has already a
well-developed public support framework in this area, and is experimenting with innovative approaches,
including growing recourse to mobile services and daytime care assistance. A recent prospective study of
long-term care needs and their financing modalities concluded that under the current care arrangements
the fiscal costs of public support to long-term care will increase by more than 4% per year for several
decades, with an acceleration due to demographic cohort effects after 2025 (Famira-Mühlberger, 2017,
link). More recourse to institutional care would increase these costs, while higher recourse to family-
supported mobile services could reduce them by around 10%. The latter type of services may also be
favoured by a large proportion of beneficiaries. The previous government was working on a long-term care
strategy combining these different modalities with alternative financing options.6
A consequence of the tensions arising between professional and family care responsibilities, concerning
mostly women in practice, are particularly low fertility and child rearing levels. Despite a slight increase in
the last few years, the total rate of fertility is the 4th lowest in the OECD and is lower than in comparable
countries in Europe (OECD, 2019, link). Better educated women have experienced the strongest
retrenchment. This reduces the life choices and the well-being of the current cohorts, and dents the long-
term demographic vigour of society. In its long-term fiscal projections, the Ministry of Finance projected a
gradual recovery in fertility, adding that a stronger increase would be welcome and would underpin more
favourable macroeconomic scenarios (Ministry of Finance, 2016, link).
Table 1.5. Past recommendations to promote gender equality
Past OECD recommendations Actions taken
Transform childcare allowances and parental leaves into a unique childcare account that allows parents to allocate subsidised absence
flexibly over time.
The existing childcare allowance is being evaluated by taking into account the EU Directive on work-life balance. Results will be available
in early 2021.
Reserve a sizeable part of this account, at least 33%, for the exclusive
use of fathers.
Further increase capacity for full-day schooling and childcare.
Introduce legal entitlements for these services.
Develop care capacities for dependent elderly according to a national
plan.
A long-term masterplan for long-term care was adopted by the former government in 2018 and a further study was commissioned to evaluate
the alternative instruments available for its financing.
The challenge of integrating migrants
Austria has become an immigration country following economic and geopolitical developments before and
after the fall of the Berlin wall. More than 15% of the resident population is born abroad and, as of 2018,
16% was of foreign nationality against 10% a decade earlier. If natives with foreign-born parents were
taken into consideration, around one third of the population is of migrant origin (OECD/EU, 2018, link).
Baseline demographic projections posit that the net immigration rate - which was around 0.8% of the total
population in 2016 - is expected to stay about this level in the coming decade, gravitating at around 0.6%
by 2030, before gradually declining in the following decades and stabilising at around 0.2% by 2060. These
projections are subject to upward and downward risks, in particular under EU mobility.
Integration of immigrants raises challenges for some groups, especially for those who arrived in Austria
with low educational capital - in both recent and more distant past. Their integration and well-being depend
primarily on their labour market position, which in turn depends strongly on their education and skills

34
OECD ECONOMIC SURVEYS: AUSTRIA 2019 © OECD 2019
(OECD, 2012, link). The average schooling background of migrants is not lower than in other countries
(Figure 1.16, Panel A), however, their position in the Austrian labour market is generally less favourable.
They are more concentrated in low-skill occupations, are less represented in higher-skilled positions, and
a larger proportion of them are overqualified for their present occupation (Figure 1.16, Panels B and C).
At the same time, migrants are adequately covered by the well-developed pension, health, long-term care
and social protection systems. Even if their comparatively weak labour market position keeps their rate of
relative poverty above peer countries (30% of migrant workers earn less than 60% of the average wage,
against less than 25% in Germany and Switzerland), the national collective bargaining system helps
maintain the earning gaps between skilled and unskilled migrants at the same level as natives (as a
difference from other countries where these gaps are usually larger) (OECD, 2018, link).
The integration of migrants is particularly disappointing when it comes to the advancement of their children
in the education system. As transmission of human capital takes place more within families than through
formal early childhood education in Austria, human capital gaps tend to entrench across generations and
low-skilled migrants are particularly impacted. The share of low performing students and the share of early
school leavers remains too high for the more vulnerable migrant groups (Figure 1.16, Panel D). (OECD,
2017, link). Children’s being oriented to different educational tracks according to their early academic
performance amplifies the challenge. The high concentration of migrant children in certain schools and
their limited mixing with other social groups constitute a further obstacle (75% of migrant pupils are
educated in schools hosting more than 25% of migrant pupils, against less than 60% in Denmark and the
Netherlands), as social mixture is a key driver of convergence in educational development (OECD, 2018,
link; OECD, 2011, link). Policymakers introduced several measures in recent years to improve the
language proficiency and the learning capacity of migrant children (including a further year of compulsory
pre-school education with targeted language assistance, as well as several pedagogical programmes to
better prepare migrant apprentices to their workplaces). The planned education reform of the government
in place after the 2017 elections intended to strengthen these policies with nationally standardised
language tests at pre-school age. Such language tests can help to implement remedies to persisting
language deficiencies, which bear heavily on the subsequent school performance of pupils.
Austria faced a significant inflow of asylum seekers during the 2015-16 international migration crisis
(OECD, 2016, link). The number of applicants attained 200 000 in the 2014-18 period (2.3% of total
population). Not all aspirants have been granted asylum, however, and numbers have declined
considerably since 2016. As of 2017, accepted asylum seekers formed 0.3% of the labour force and the
proportion is projected to reach 0.7% by 2020. Two thirds of refugees came from Syria, Iraq and
Afghanistan and 60% of them have less than upper secondary education (OECD, 2019, link).
The share of university-educated is also significant in migrant communities, at 20%. They represent a
major resource for Austrian economy and society, provided that their skills are well used. There are signs
of delays in this area. In Austria, migrants are currently more likely to be unemployed or over-qualified for
their jobs than in comparable countries (Figure 1.15, Panel A or B). The unemployment rate of highly-
educated migrants stands at 6.4% compared to an unemployment rate of 2.4% of highly educated natives
(Figure 1.15, Panel A). Furthermore, slightly more than 30% of the highly educated native Austrians are
over-qualified, which is above the average of peer countries and the EU but slightly less than the OECD
average of around 31% (OECD, 2018h). In contrast, more than 40% of highly-educated migrants with
foreign degrees are over-qualified for their current occupation, a significantly higher share than the average
of peer countries or the OECD (Figure 1.15, Panel B).

35
OECD ECONOMIC SURVEYS: AUSTRIA 2019 © OECD 2019
Figure 1.15. High-educated migrants are more likely to be unemployed or overqualified for their jobs
Unemployment and overqualification rate of highly educated migrants, 15-64 year-olds, 2017
1. Unweighted average of Denmark, Germany, Netherlands, Sweden and Switzerland.
2. The over-qualification rate is the share of the highly educated (ISCED Levels 5-8), who work in low- or medium-skilled occupations (ISCO
Levels 4-9).
Source: OECD (2019), "Indicators of immigrant integration: Introduction and overview", in Settling In 2018: Indicators of Immigrant Integration.
StatLink 2 https://doi.org/10.1787/888934025252
All in all, the integration of refugees raises similar challenges to the integration of earlier immigrant cohorts.
Austria should draw on its own experience, as well as on the experience of other OECD countries which
hosted large numbers of refugees in the recent past, for their more effective economic and social
integration. In addition to the labour market participation of breadwinners, the educational and social
integration of accompanying and reunifying families is essential (Box 1.2). A recent OECD review of the
integration policies in the city of Vienna suggested also that better co-ordinating integration programmes
between federal, Länder and municipal governments can help7 (OECD, 2018, link).
0.0
1.5
3.0
4.5
6.0
7.5
9.0
Austria Peers¹ OECD
%A. Unemployment rate
Foreign-born Native-born
0
10
20
30
40
50
Austria Peers¹ OECD
%B. Overqualification rate²
Foreign-educated
Host-country educated
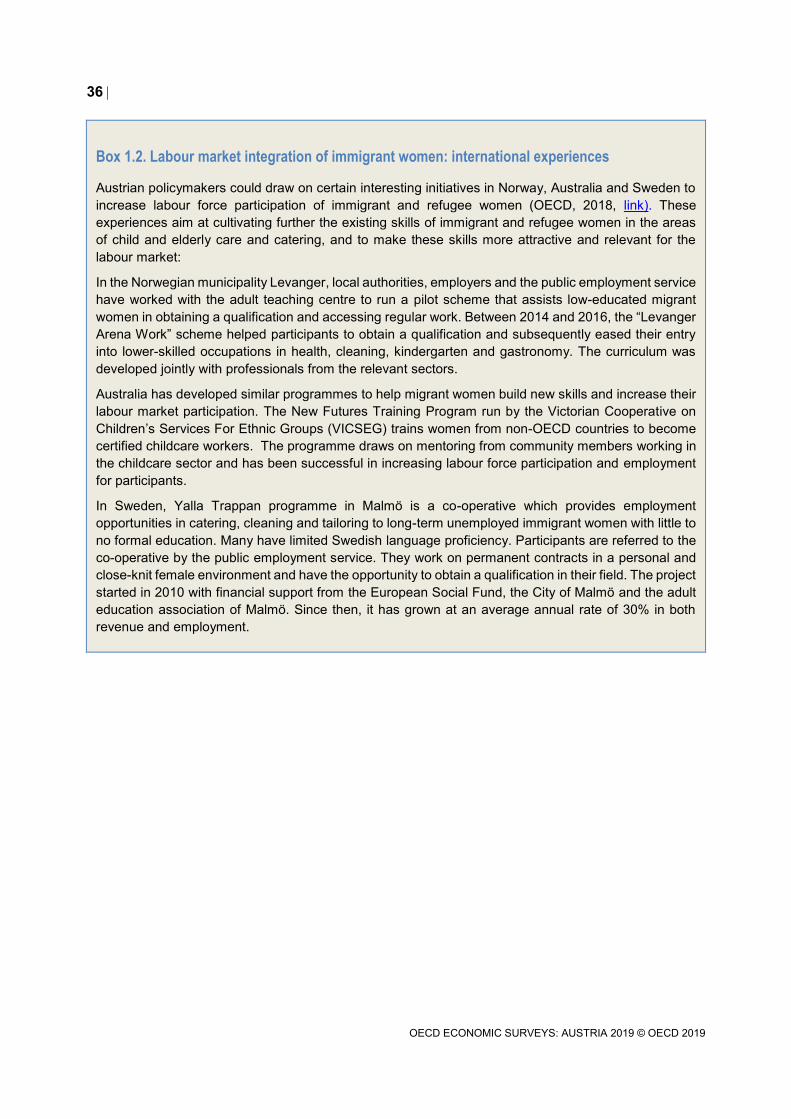
36
OECD ECONOMIC SURVEYS: AUSTRIA 2019 © OECD 2019
Box 1.2. Labour market integration of immigrant women: international experiences
Austrian policymakers could draw on certain interesting initiatives in Norway, Australia and Sweden to
increase labour force participation of immigrant and refugee women (OECD, 2018, link). These
experiences aim at cultivating further the existing skills of immigrant and refugee women in the areas
of child and elderly care and catering, and to make these skills more attractive and relevant for the
labour market:
In the Norwegian municipality Levanger, local authorities, employers and the public employment service
have worked with the adult teaching centre to run a pilot scheme that assists low-educated migrant
women in obtaining a qualification and accessing regular work. Between 2014 and 2016, the “Levanger
Arena Work” scheme helped participants to obtain a qualification and subsequently eased their entry
into lower-skilled occupations in health, cleaning, kindergarten and gastronomy. The curriculum was
developed jointly with professionals from the relevant sectors.
Australia has developed similar programmes to help migrant women build new skills and increase their
labour market participation. The New Futures Training Program run by the Victorian Cooperative on
Children’s Services For Ethnic Groups (VICSEG) trains women from non-OECD countries to become
certified childcare workers. The programme draws on mentoring from community members working in
the childcare sector and has been successful in increasing labour force participation and employment
for participants.
In Sweden, Yalla Trappan programme in Malmö is a co-operative which provides employment
opportunities in catering, cleaning and tailoring to long-term unemployed immigrant women with little to
no formal education. Many have limited Swedish language proficiency. Participants are referred to the
co-operative by the public employment service. They work on permanent contracts in a personal and
close-knit female environment and have the opportunity to obtain a qualification in their field. The project
started in 2010 with financial support from the European Social Fund, the City of Malmö and the adult
education association of Malmö. Since then, it has grown at an average annual rate of 30% in both
revenue and employment.

37
OECD ECONOMIC SURVEYS: AUSTRIA 2019 © OECD 2019
Figure 1.16. Migrants' integration can be improved
Foreign-born, 15-64 year-olds, 2017 (unless specified)
Note: The OECD aggregate covers available countries. The country coverage for OECD varies across the presented panels. See the source for
more details.
1. Low education refers to below upper secondary education (ISCED Levels 0-2) and high education refers to tertiary education (ISCED Levels
5-8).
2. The over-qualification rate is the share of the highly educated (ISCED Levels 5-8), who work in low- or medium-skilled occupations (ISCO
Levels 4-9). See the following footnote for the definition of occupation classification by job skills.
3. Based on International Standard Classification of Occupations (ISCO-88). High-skilled occupations include legislators, senior officials, and
managers (group 1), professionals (group 2), and technicians and associate professionals (group 3). Middle-skilled occupations include clerks
(group 4), craft and related trades workers (group 7), and plant and machine operators and assemblers (group 8). Low-skilled occupations
include service workers, shop and market sales workers (group 5), and elementary occupations (group 9).
4. Pupils who lack basic reading skills at 15 years old are those who score no higher than Level 1 (or 407 points) in PISA assessments of reading
proficiency. The share of early school leavers is the proportion of young people aged 15-24 who are neither in education nor training and have
gone no further than lower-secondary school.
Source: OECD/EU (2018), Settling In 2018: Indicators of Immigrant Integration.
StatLink 2 https://doi.org/10.1787/888934025271
0
9
18
27
36
45
DEU NLD EU AUT OECD DNK SWE
%
Highly-educated Low-educated
A. The basic education level of migrants is average¹% of people not in education aged 15-64
0
8
16
24
32
40
CHE NLD DNK SWE DEU EU OECD AUT
B. But many migrants are over-qualified for their job²% of highly educated%
0
10
20
30
40
50
DEU AUT EU OECD DNK NLD SWE CHE
Highly-skilled Low-skilled
C. Migrants are concentrated in low-skilled occupations³% of 15-64 year-olds in employment
%
0
10
20
30
40
50
DNK OECD CHE EU NLD SWE DEU AUT
Low reading performance at 15-year-old, 2015
Early school leavers for 15-24 year-old native-born with foreign-born parents, around 2016
%
D. Migrant children's integration in schools falls behind4

38
OECD ECONOMIC SURVEYS: AUSTRIA 2019 © OECD 2019
Table 1.6. Past recommendations to facilitate the integration of migrants
Past OECD recommendations Actions taken
Emphasise labour force participation of immigrants and refugees as
their main avenue of social integration.
Immigrants and refugees are invited to take further responsibility for their integration, with additional support from public language and orientation
courses. Different Länder implement different support programmes.
Accelerate the recognition of qualifications of skilled migrants and
refugees.
A new Law on the Recognition of Qualifications facilitated the access of immigrants and refugees to myriad different procedures for certifying their
professional aptitudes and academic degrees in different areas.
Remedy to the educational handicaps of migrant children from low-educated families, by facilitating their catching-up in pre-school and
primary education.
A comprehensive language training support model is specified for low-educated migrant children at their schools as well as in pre-school
education.
Environmental tensions
Austria’s environmental performance is good overall (Figure 1.17). Citizens are satisfied with their
environmental quality of life. Water quality is among the best in the world, a large part of the land is under
some form of nature protection, and the share of organically farmed agricultural area is the highest in the
EU (OECD, 2013, link) However, most of the Austrian population is exposed to more small particle pollution
than the World Health Organisation recommended limit of 10 micrograms per m3 and this share is larger
than the OECD average (Figure 1.17, Panel D). 4 000 Austrians are estimated to die prematurely because
of outdoor air pollution per year. Relative to population, premature mortality from this source is higher than
in many high-income OECD countries and has not fallen over the past 10 years (Roy and Braathen, 2015,
link). Within metropolitan areas, air pollution is likely to affect low-income households the most. Children
are particularly strongly affected by pollution. Air pollution was found to affect education outcomes of young
children markedly and lastingly (Heissel, Persico and Simon, 2019, link).
Austria is part of the EU engagements to meet the Paris Climate Change Agreement (EC, 2018, link) and
engaged to reduce them by 36% compared to their 2005 level. The carbon intensity of the economy is
lower than in the OECD overall, reflecting lower energy intensity and a large share of renewable energy
supply (Figure 1.17, Panels A-C). However, the relative decoupling of CO2 emissions from GDP
experienced over the past decade was mainly due to the slowdown of industrial activities after the global
financial crisis and stalled in the last three years of strong growth. Against this backdrop, Austria adopted
a new national climate strategy in 2018, spelling out how policymakers plan to fulfil their Paris Agreement
commitments (Box 1.3).
Box 1.3. The 2018 National Climate and Energy Strategy
In May 2018, the government issued a new Climate and Energy Strategy as required by the EU from
all member states. The strategy sets out plans to achieve the greenhouse gas emission targets agreed
on in the Paris Accord. The previous coalition had not reached a consensus on the issue.
The main ambition is in the energy sector, with a goal inherited from the previous government: to
achieve 100% electricity generation from renewable sources by 2030. Three quarters of electricity
generation was from renewable sources in 2017, mostly hydroelectric and biomass firing. The share of
wind and solar is small, around 10%. Full decarbonisation of the economy is targeted for 2050, all
energy supply coming then from renewables, compared with 33% in 2017. Achieving this goal will
require additional infrastructure, energy storage and energy efficiency investments.
The second key sector is transportation. Transport emissions rose by about 70% since 1990, and
accounted for about 30% of emissions in 2015. To reduce emissions from transport, the authorities
target alternative fuel vehicles and a shift of freight traffic from road to rail. The potentially effective but

39
OECD ECONOMIC SURVEYS: AUSTRIA 2019 © OECD 2019
politically contested measure of cutting subsidies to long-distance car commuting has not been included
in the strategy. These subsidies should be phased out according to a pre-announced schedule.
The third important sector is buildings. They account for more than 10% of emissions. Although their
emissions have fallen by nearly 40% since 1990, the authorities see room for a further 40% reduction
in building emissions by 2030.
The previous government admitted that actual CO2 emissions may exceed targets. More concrete
measures, for example in transport to roll out an electric charging infrastructure, would help strengthen
prospects. The plan foresees an evaluation, and if necessary adjustments from 2023. It also announces
more specific “integrated plans” to be prepared according to the forthcoming “Energy Union Strategy”
at the EU level.
Economically efficient reductions of carbon emissions require more adequate carbon pricing. Carbon
emissions are generally priced low and unevenly, harming cost-effective emission reduction. Energy tax
revenues as percentage of total tax revenues are well below the OECD average. Most emissions are priced
below EUR 30 per ton of CO2 (Figure 1.17, Panel H), a low-end estimate of the current climate related
external costs of these emissions. Austria is 16th among 28 EU countries in the taxation of diesel and 17th
in the taxation of gasoline. Emissions in the industrial sector are also priced unevenly. Coal use in industry
is substantial but is taxed at low rates (OECD, 2018, link). Some emissions are subject to both the
EU emissions trading scheme (ETS) and are priced by energy taxes, while others are only subject to the
ETS (OECD, 2018, link). Still others are neither covered by the ETS nor by energy taxation. These
differences are generally larger in Austria than in comparable countries (Figure 1.18).
More consistent pricing of carbon emissions would boost environment-related innovation, as evidence from
emissions trading suggests (Calel and Dechezleprêtre, 2016, link). Austria’s lead in environment-related
innovation has diminished in recent years (Panel I). To improve predictability and investment incentives,
carbon pricing should follow a pre-announced path supported by international co-operation.
A recent simulation by the Austrian Institute of Economic Research (WIFO) confirms that there is scope
for increasing carbon prices in Austria (Kettner-Marx et al., 2018, link). Scenarios for an Austrian CO2 tax
were developed on the basis of the carbon taxation experiences of other EU countries, including variants
with tax revenues recycled into labour cost reductions or into lump sum eco-transfers to households.
Obvious gains result for environmental sustainability, but there is also a positive growth effect if the
additional tax revenues are fully recycled into labour tax reductions. Fuller pricing of environmental
externalities, if supported with adequate adjustments in the overall price and tax structure, can be growth-
and employment-friendly (Köppl, 2018, link).
The behaviour of consumers and producers can also be improved through channels other than carbon
pricing. Infrastructure deployment consistent with decarbonisation and optimised land use programmes
help. Austria’s policies in support of organic agriculture play a positive role in this regard, as they incite
producers and consumers to shift to less carbon-intensive products.
Austria’s dispersed settlement patterns, once considered a pillar of national well-being, raise also new
challenges. Built-up areas have considerably grown since 2000 (Figure 1.17, Panel F and Figure 1.19).
More than 40% of the population live outside urban areas (with fewer than 50 000 inhabitants) as against
the OECD average of 30%, and only 47% of national employment is in metropolitan agglomerations (with
more than 500 000 inhabitants) against the OECD average of 60%. Settlements sprawl more strongly than
in other countries (OECD, 2018, link). This fosters car dependency and traffic congestion and worsens
pollution, energy consumption and CO2 emissions.
Cities and municipalities face land planning challenges in areas requiring strong co-ordination. The space
planning and management responsibilities of federal, Länder and municipal layers should be clarified. Little
has been achieved in this area so far, and more ambitious initiatives are needed (Ahrend et al., 2014, link;
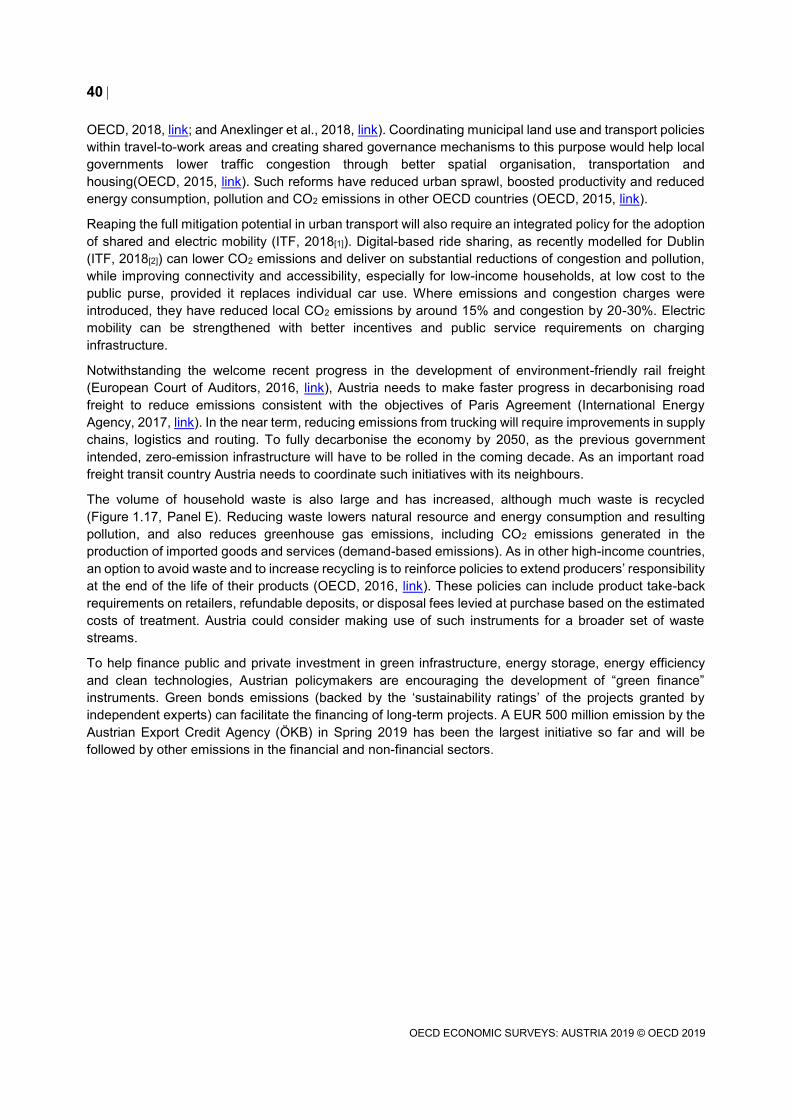
40
OECD ECONOMIC SURVEYS: AUSTRIA 2019 © OECD 2019
OECD, 2018, link; and Anexlinger et al., 2018, link). Coordinating municipal land use and transport policies
within travel-to-work areas and creating shared governance mechanisms to this purpose would help local
governments lower traffic congestion through better spatial organisation, transportation and
housing(OECD, 2015, link). Such reforms have reduced urban sprawl, boosted productivity and reduced
energy consumption, pollution and CO2 emissions in other OECD countries (OECD, 2015, link).
Reaping the full mitigation potential in urban transport will also require an integrated policy for the adoption
of shared and electric mobility (ITF, 2018[1]). Digital-based ride sharing, as recently modelled for Dublin
(ITF, 2018[2]) can lower CO2 emissions and deliver on substantial reductions of congestion and pollution,
while improving connectivity and accessibility, especially for low-income households, at low cost to the
public purse, provided it replaces individual car use. Where emissions and congestion charges were
introduced, they have reduced local CO2 emissions by around 15% and congestion by 20-30%. Electric
mobility can be strengthened with better incentives and public service requirements on charging
infrastructure.
Notwithstanding the welcome recent progress in the development of environment-friendly rail freight
(European Court of Auditors, 2016, link), Austria needs to make faster progress in decarbonising road
freight to reduce emissions consistent with the objectives of Paris Agreement (International Energy
Agency, 2017, link). In the near term, reducing emissions from trucking will require improvements in supply
chains, logistics and routing. To fully decarbonise the economy by 2050, as the previous government
intended, zero-emission infrastructure will have to be rolled in the coming decade. As an important road
freight transit country Austria needs to coordinate such initiatives with its neighbours.
The volume of household waste is also large and has increased, although much waste is recycled
(Figure 1.17, Panel E). Reducing waste lowers natural resource and energy consumption and resulting
pollution, and also reduces greenhouse gas emissions, including CO2 emissions generated in the
production of imported goods and services (demand-based emissions). As in other high-income countries,
an option to avoid waste and to increase recycling is to reinforce policies to extend producers’ responsibility
at the end of the life of their products (OECD, 2016, link). These policies can include product take-back
requirements on retailers, refundable deposits, or disposal fees levied at purchase based on the estimated
costs of treatment. Austria could consider making use of such instruments for a broader set of waste
streams.
To help finance public and private investment in green infrastructure, energy storage, energy efficiency
and clean technologies, Austrian policymakers are encouraging the development of “green finance”
instruments. Green bonds emissions (backed by the ‘sustainability ratings’ of the projects granted by
independent experts) can facilitate the financing of long-term projects. A EUR 500 million emission by the
Austrian Export Credit Agency (ÖKB) in Spring 2019 has been the largest initiative so far and will be
followed by other emissions in the financial and non-financial sectors.
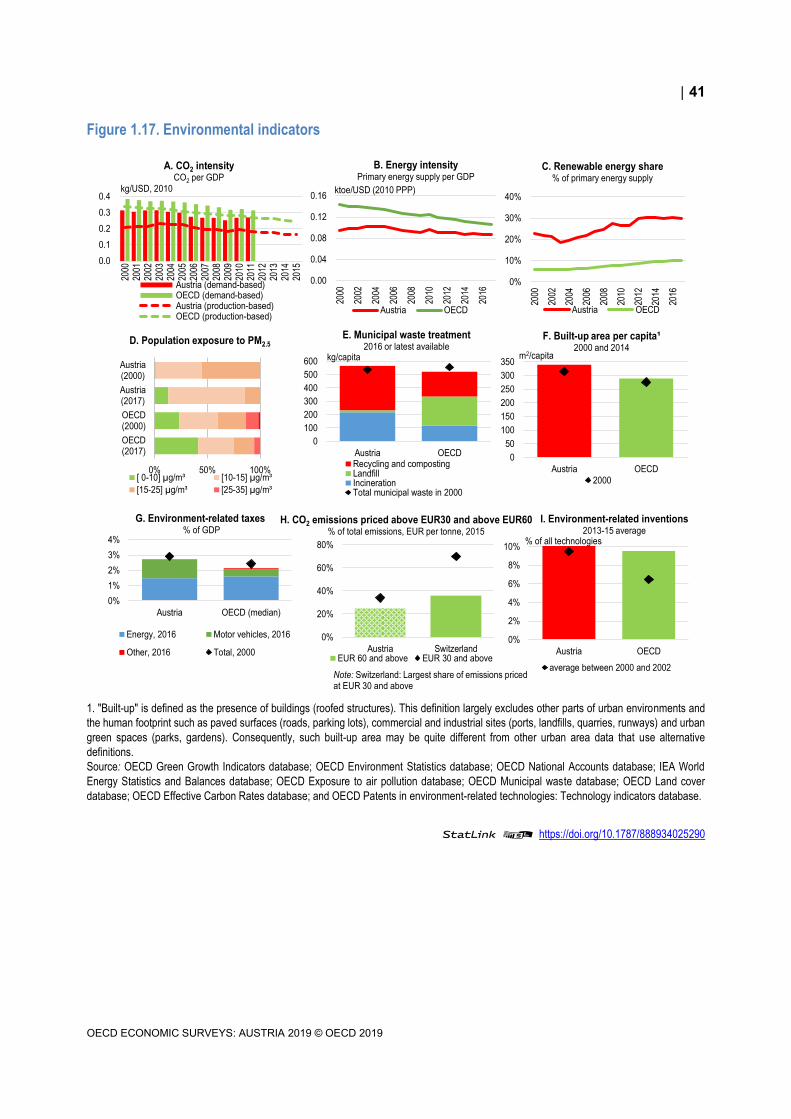
41
OECD ECONOMIC SURVEYS: AUSTRIA 2019 © OECD 2019
Figure 1.17. Environmental indicators
1. "Built-up" is defined as the presence of buildings (roofed structures). This definition largely excludes other parts of urban environments and
the human footprint such as paved surfaces (roads, parking lots), commercial and industrial sites (ports, landfills, quarries, runways) and urban
green spaces (parks, gardens). Consequently, such built-up area may be quite different from other urban area data that use alternative
definitions.
Source: OECD Green Growth Indicators database; OECD Environment Statistics database; OECD National Accounts database; IEA World
Energy Statistics and Balances database; OECD Exposure to air pollution database; OECD Municipal waste database; OECD Land cover
database; OECD Effective Carbon Rates database; and OECD Patents in environment-related technologies: Technology indicators database.
StatLink 2 https://doi.org/10.1787/888934025290
0.00
0.04
0.08
0.12
0.16
2000
2002
2004
2006
2008
2010
2012
2014
2016
Austria OECD
ktoe/USD (2010 PPP)
B. Energy intensityPrimary energy supply per GDP
0.0
0.1
0.2
0.3
0.4
2000
2001
2002
2003
2004
2005
2006
2007
2008
2009
2010
2011
2012
2013
2014
2015
Austria (demand-based)OECD (demand-based)Austria (production-based)OECD (production-based)
kg/USD, 2010
A. CO2 intensityCO2 per GDP
0%
10%
20%
30%
40%
2000
2002
2004
2006
2008
2010
2012
2014
2016
Austria OECD
C. Renewable energy share% of primary energy supply
0
100
200
300
400
500
600
Austria OECDRecycling and compostingLandfillIncinerationTotal municipal waste in 2000
kg/capita
E. Municipal waste treatment2016 or latest available
0
50
100
150
200
250
300
350
Austria OECD
2000
m2/capita
F. Built-up area per capita¹2000 and 2014
0%
1%
2%
3%
4%
Austria OECD (median)
Energy, 2016 Motor vehicles, 2016
Other, 2016 Total, 2000
G. Environment-related taxes % of GDP
0%
20%
40%
60%
80%
Austria SwitzerlandEUR 60 and above EUR 30 and above
H. CO2 emissions priced above EUR30 and above EUR60% of total emissions, EUR per tonne, 2015
0%
2%
4%
6%
8%
10%
Austria OECD
average between 2000 and 2002
% of all technologies
I. Environment-related inventions2013-15 average
D. Population exposure to PM2.5
0% 50% 100%
OECD(2017)
OECD(2000)
Austria(2017)
Austria(2000)
[ 0-10] µg/m³ [10-15] µg/m³
[15-25] µg/m³ [25-35] µg/m³
Note: Switzerland: Largest share of emissions priced at EUR 30 and above

42
OECD ECONOMIC SURVEYS: AUSTRIA 2019 © OECD 2019
Figure 1.18. Effective carbon rates in Austria and selected countries by sector and component
Average effective carbon rates across sectors, 2015
Note: The emissions shown on this figure include biofuels. It should be noted that ETS prices have increased since 2015. The ECRs are
measured separately for six economic sectors: road transport, off-road transport, agriculture and fisheries, residential and commercial energy
use, industry, and electricity generation.
Source: OECD (2019), Supplement to effective carbon rates 2018.
StatLink 2 https://doi.org/10.1787/888934025309

43
OECD ECONOMIC SURVEYS: AUSTRIA 2019 © OECD 2019
Figure 1.19. Urban sprawl and municipal fragmentation
1. Urban footprint is defined as the share of urban land occupied by areas in which population density is between certain thresholds, here 150
and 1 500 inhabitants per km².
2. Unweighted average.
Source: OECD (2018), Rethinking Urban Sprawl: Moving Towards Sustainable Cities, OECD (2019), Regions and Cities Statistics (database),
and OECD (2018), OECD Metropolitan Areas Database (https://measuringurban.oecd.org/#story=0).
StatLink 2 https://doi.org/10.1787/888934025328
Table 1.7. Past environmental policy recommendations
Past recommendations Actions taken
Use environmentally-related taxes in all sectors to provide more
consistent carbon price signals across the economy.
Green taxes will be introduced in the next steps of the tax reform to support the National Climate Strategy 2030, including differentiated taxation of road
vehicles according to their carbon emission intensity.
Phase-out long-distance car commuting subsidies according to a pre-announced schedule.
0
1000
2000
3000
4000
5000
6000
AUT DNK NLD DEU SWE CHE
Maximum Average Minimum
A. Average population density in urban areasNumber of inhabitants per km2, 2014
0.00
0.15
0.30
0.45
0.60
0.75
0.90
DEU CHE SWE NLD DNK AUT
Maximum Average Minimum
B. Share of low urban footprint¹150-1500 people per km2, 2014
0
5
10
15
20
25
IRL
GB
RF
INS
WE
NLD
NO
RG
RC
DN
KP
OL
CA
NIT
AB
EL
US
AD
EU
ES
PH
UN
OE
CD
²A
US
PR
TC
HE
AU
TF
RA
CZ
E
C. Fragmentation of metropolitan areasNumber of local governments per 100 000 inhabitants, 2014
0
40
80
120
160
200
CZ
EF
RA
HU
NC
HE
AU
TE
SP
DE
UIT
AU
SA
CA
NN
OR
PO
LF
INB
EL
GR
CP
RT
SW
EO
EC
D²
AU
SN
LDD
NK
IRL
GB
R
D. Average size of municipalities2016Thousand

44
OECD ECONOMIC SURVEYS: AUSTRIA 2019 © OECD 2019
Achieving and sustaining stronger and broader-based growth
In order to firm up the main pillars of Austrian well-being and social cohesion, the economy’s capacity to
create good quality jobs for the majority of the population, and the public sector’s ability to offer high-quality
social services and protection for all population groups should be strengthened. This requires wider labour
force participation by an upskilled working age population, broader-based entrepreneurial dynamism
throughout the country and higher fiscal resources to push through ambitious structural reforms.
Room for increasing employment
Inward migration is particularly dynamic
The acceleration of immigration contributes significantly to Austria’s supply potential. The proximity of
neighbouring EU populations with suitable education levels makes an important contribution to the Austrian
economy through both immigration and cross-border commuting. The share of migrant workers in
employment, which had stayed around 10% in the 2000s surged after the liberalisation of intra-EU inflows
in 2012 and has now reached 20% - the second highest proportion in the EU (Figure 1.20). Whereas
migrants from former Yugoslavia and Turkey had formed the majority of migrant labour until the 2000s, the
lion’s share is now taken by workers coming from Central and Eastern Europe. Around 103 000 of the
157 000 net new jobs created in Austria between 2016-2018 are estimated to have been filled by immigrant
workers. Migration flows are expected to flatten as Eastern and South Eastern neighbours develop further,
and Austrian authorities may need to increase efforts to attract highly skilled foreigners in the future.
Figure 1.20. Migrants are sustaining higher employment
1. Excludes Slovenia and Croatia.
Source: Eurostat (2019), LFS detailed quarterly and annual survey results (database) and Statistik Austria.
StatLink 2 https://doi.org/10.1787/888934025347
Cross-border commuting is a special feature of the Austrian labour market. The country shares
1 300 kilometres of borders with new EU member states, where four to five million persons (equivalent to
half of total Austrian population) live near the border. Large cities such as Brno, Bratislava and Maribor are
close to the agglomerations of Vienna, Graz, Linz and Klagenfurt. Commuters combine higher earnings in
Austria with lower cost of living at home and are highly attracted to the Austrian labour market. Their
number is estimated to have reached the daily average of 160 000 in 2017 (4% of total employment).
7
10
13
16
19
22
1999
2000
2001
2002
2003
2004
2005
2006
2007
2008
2009
2010
2011
2012
2013
2014
2015
2016
2017
2018
%A. Share of migrants in the total employment
15-64 year-old employed
Austria Germany
Netherlands Sweden
0
3
6
9
12
15
2004
2005
2006
2007
2008
2009
2010
2011
2012
2013
2014
2015
2016
2017
2018
%B. Migrant workers by origin
15 year-old and more employed
EU accession since 2004 Former Yugoslavia¹ Turkey

45
OECD ECONOMIC SURVEYS: AUSTRIA 2019 © OECD 2019
A further form of external labour supply is foreign contracting firms offering services in Austria by
temporarily employing foreign workers, in particular in the construction sector. This form has expanded in
recent years and tended to raise some challenges concerning compliance with minimum wage and
employment rules and causing competition distortions (Pfister, 2018, link). The Court of Justice of the EU
has, in two cases, judged legislation intended to prevent fraud and illegal forms of employment by foreign
contractors as too burdensome (2018, link, and 2019, link) and thus as unduly impeding the EU principle
of freedom to provide services. The Austrian government should address these challenges and amend the
measures and legislation accordingly.
Labour force participation has considerable room to increase
In contrast, labour force participation within Austria is weaker than in comparable countries (Figure 1.21).
The participation of older workers is lower, in particular for women, and the share of part-time work is
particularly high. As a result, despite working hours of full time workers being longer than in comparable
countries, the number of work hours per working age person remains one of the lowest in OECD.
Figure 1.21. Labour force participation is still low
Source: OECD (2019), OECD Labour Force Statistics (database) and OECD Statistics on average effective age of retirement
(http://www.oecd.org/els/emp/average-effective-age-of-retirement.htm).
StatLink 2 https://doi.org/10.1787/888934025366
56
58
60
62
64
66
68
1999
2001
2003
2005
2007
2009
2011
2013
2015
2017
A. Average effective retirement age
Austria Germany Sweden Switzerland OECD
40
48
56
64
72
80
88
96
AUT DNK DEU SWE NLD CHE
%
B. Labour force particpation rate by gender2018
Men Women
15-64 year-olds
Men
56
58
60
62
64
66
68
1999
2001
2003
2005
2007
2009
2011
2013
2015
2017
Women
40
48
56
64
72
80
88
96
AUT DNK DEU NLD CHE SWE
%
55-64 year-olds
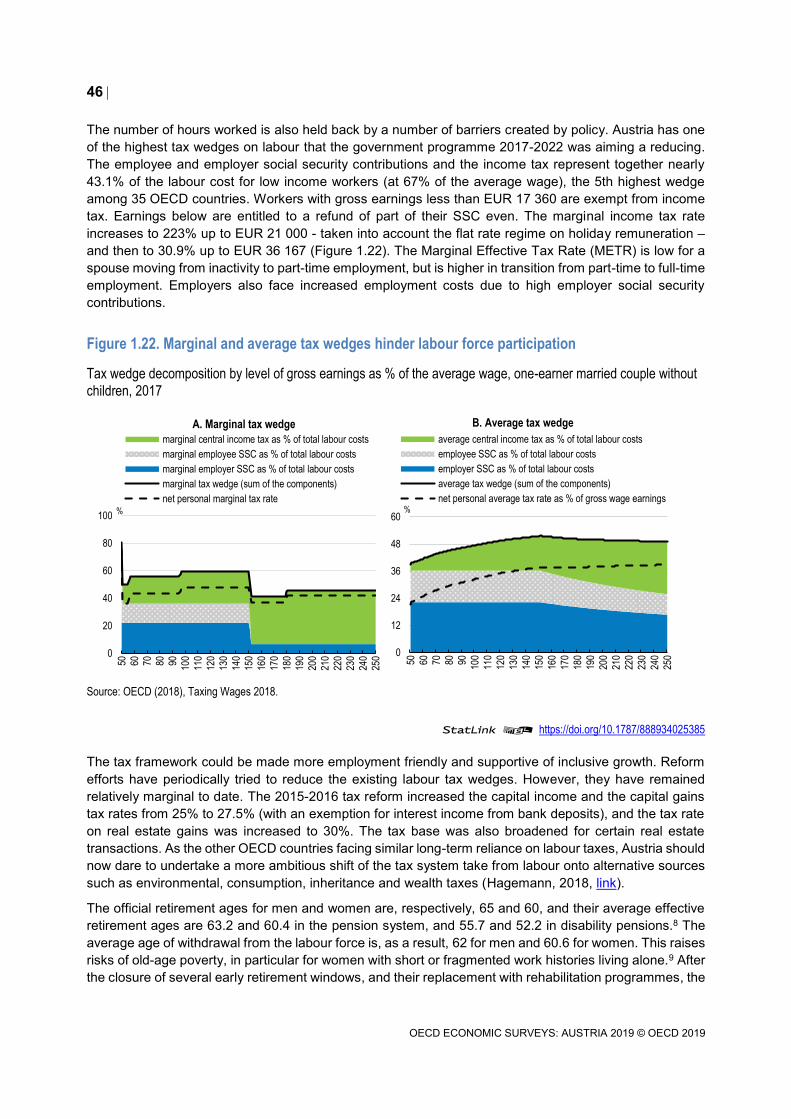
46
OECD ECONOMIC SURVEYS: AUSTRIA 2019 © OECD 2019
The number of hours worked is also held back by a number of barriers created by policy. Austria has one
of the highest tax wedges on labour that the government programme 2017-2022 was aiming a reducing.
The employee and employer social security contributions and the income tax represent together nearly
43.1% of the labour cost for low income workers (at 67% of the average wage), the 5th highest wedge
among 35 OECD countries. Workers with gross earnings less than EUR 17 360 are exempt from income
tax. Earnings below are entitled to a refund of part of their SSC even. The marginal income tax rate
increases to 223% up to EUR 21 000 - taken into account the flat rate regime on holiday remuneration –
and then to 30.9% up to EUR 36 167 (Figure 1.22). The Marginal Effective Tax Rate (METR) is low for a
spouse moving from inactivity to part-time employment, but is higher in transition from part-time to full-time
employment. Employers also face increased employment costs due to high employer social security
contributions.
Figure 1.22. Marginal and average tax wedges hinder labour force participation
Tax wedge decomposition by level of gross earnings as % of the average wage, one-earner married couple without
children, 2017
Source: OECD (2018), Taxing Wages 2018.
StatLink 2 https://doi.org/10.1787/888934025385
The tax framework could be made more employment friendly and supportive of inclusive growth. Reform
efforts have periodically tried to reduce the existing labour tax wedges. However, they have remained
relatively marginal to date. The 2015-2016 tax reform increased the capital income and the capital gains
tax rates from 25% to 27.5% (with an exemption for interest income from bank deposits), and the tax rate
on real estate gains was increased to 30%. The tax base was also broadened for certain real estate
transactions. As the other OECD countries facing similar long-term reliance on labour taxes, Austria should
now dare to undertake a more ambitious shift of the tax system take from labour onto alternative sources
such as environmental, consumption, inheritance and wealth taxes (Hagemann, 2018, link).
The official retirement ages for men and women are, respectively, 65 and 60, and their average effective
retirement ages are 63.2 and 60.4 in the pension system, and 55.7 and 52.2 in disability pensions.8 The
average age of withdrawal from the labour force is, as a result, 62 for men and 60.6 for women. This raises
risks of old-age poverty, in particular for women with short or fragmented work histories living alone.9 After
the closure of several early retirement windows, and their replacement with rehabilitation programmes, the
0
20
40
60
80
100
50 60 70 80 90 100
110
120
130
140
150
160
170
180
190
200
210
220
230
240
250
A. Marginal tax wedge
marginal central income tax as % of total labour costs
marginal employee SSC as % of total labour costs
marginal employer SSC as % of total labour costs
marginal tax wedge (sum of the components)
net personal marginal tax rate%
0
12
24
36
48
60
50 60 70 80 90 100
110
120
130
140
150
160
170
180
190
200
210
220
230
240
250
B. Average tax wedge
average central income tax as % of total labour costs
employee SSC as % of total labour costs
employer SSC as % of total labour costs
average tax wedge (sum of the components)
net personal average tax rate as % of gross wage earnings%

47
OECD ECONOMIC SURVEYS: AUSTRIA 2019 © OECD 2019
effective retirement age increased by about one year in the past five years for both genders, but remains
still low in international comparison.
Income replacement and contribution rates of the pension system are among the highest in OECD (OECD,
2017, link). Parametric reforms adjusted the benefit accrual rate and increased women’s retirement age –
albeit gradually, with convergence with men’s retirement age to be achieved between 2024-2033. High
contribution and benefit rates may be seen as a collective choice favouring high pension contributions
during working life, in order to secure high incomes during long retirement periods. However, the current
design of the system is likely to require future increases in the statutory retirement age, and augmentations
in contributions or reductions in benefits, in order to adapt to changes in life expectancy and to other
demographic changes.
Austria has opted to implement these changes through legislative amendments rather than automatic
adjustments. Workers’ retirement benefits are linked to their life-time contributions by legislation.
Participants are informed of their pension entitlements. Pension entitlements in the last ten years of activity
have been safeguarded in the past. Reform measures affected only the people who were reaching the
statutory retirement age in more than 10 years after the introduction of the reform. The process is
transparent and democratic, but is open to sustainability risks if legislative decisions in Parliament lag
behind needs. The pension system parameters could be automatically adjusted to demographic changes
as in some other OECD countries, for example by linking the retirement age to life expectancy. Otherwise
legislators need to closely and continuously monitor demographic and other structural changes, and
promptly adjust the parameters of the system.
The long-term projections of the previous government, co-ordinated with the European Union’s Working
Group on Ageing, foresaw a limited long-term increase in public pension disbursements as a share of GDP
(from 13.8% in 2016 to 14.9% in 2040 and 14.3% in 2070). There are also risk variants but these cover
only high-probability risks identifiable and quantifiable ex-ante (Figure 1.23) (Ministry of Finance, 2018,
link; EC, 2018, link). The consequences of future demographic developments will have to be closely
monitored and actively managed.
As in all OECD countries, Austria’s public debt trajectory as a whole is exposed to various risks where
population ageing and demographic developments play an important but non-exclusive role. Long-term
public debt sustainability will be affected by developments in three main areas:
1. The long-term growth performance of the economy will bear strongly on debt sustainability,
together with interest rates. The employment and productivity trajectories driving GDP growth will
depend on national policies and international developments.
2. Ageing and demographic dynamics will bear on pension, health and long-term care systems. Their
impact will depend on fertility and migration, average life expectancy, effective retirement ages,
health technologies and costs, and demand for publicly-funded long-term institutional care.
3. Other tensions may arise from societal and ecological developments. If inequality in market
incomes increases at its recent pace, stronger demands may result for public transfers and
supports. If environmental pressures increase, higher mitigation and adaptation investments may
become necessary.
Fiscal projections for this Survey (Figure 1.23) consider a baseline scenario and two alternative paths for
public financial balances and public debt. First, the baseline debt/GDP ratio rests on ongoing trends in
employment and GDP growth, baseline ageing costs and the stability of other government spending and
revenue policies. Second, the ‘accelerated growth’ scenario takes the same assumptions, but more
ambitious structural reforms lift trend employment, GDP growth and public revenues, creating additional
fiscal space. Third, the ‘higher ageing bill’ scenario assumes the baseline growth but retirement, health
and long-term care costs grow more rapidly but still at a pace considered plausible in the EU’s Ageing
Group’s standard risk scenarios. These scenarios highlight the significant fiscal risks associated with

48
OECD ECONOMIC SURVEYS: AUSTRIA 2019 © OECD 2019
ageing. They do not take into account a range of other pressures from social or ecological developments
(Figure 1.23).
Figure 1.23. There are risks on long-term public finance
General government gross debt as % of GDP, Maastricht definition
Note: The baseline corresponds to the base variant 1 based on BMF (2016). The scenario "ageing bill" includes an increase in life expectancy
(for men to 89.6, for women to 92.3) and an increase in spending on public health and caretaking to 9% and 3% of GDP until 2060. The growth
reform package simulates a half-way decrease of the PMR gap to the average of the 5 best performing country, an improvement of government
efficiency to the level of the best-performing country and a decrease in the labour tax wedge for low earnings equivalent to 0.65% of GDP
financed through a 0.4% of GDP reduction in production subsidies and a 0.25% increase in receipts from environmental taxes. The accelerated
growth scenario corresponds to scenario 4 from the reforms scenarios in Table 1.9.The scenario "Ageing bill + accelerated growth" combines
the increase in spending on public health and caretaking due to an increase in life expectancy and the growth reform package.
Source: Calculations based on OECD (2019), OECD Economic Outlook: Statistics and Projections (database).
StatLink 2 https://doi.org/10.1787/888934025404
Table 1.8. Past recommendations to strengthen labour force participation and employment
Past recommendations Actions taken
Further reduce the labour tax wedge for low-income earners by partly or fully waiving social security contributions, financed by a broadening of the tax base and increases in consumption, environmental and
property taxes
The contribution of low-income earners to unemployment insurance was reduced in 2018. The tax reform announced in April 2019 cuts the personal income tax (PIT) rate of the lowest income bracket (annual income between
EUR 11 000-18 000) from 25% to 20% starting from 2021, and the PIT rate of the next two income brackets (EUR 18 000-31 000 and EUR 31 000-
60 000) from 35% and 42% respectively to 30% and 40%, starting from 2022.
Align the official retirement age for women with that for men. Eliminate all remaining subsidised avenues to early retirement. Tighten eligibility to disability pensions also for those above 50 and help
partially-disabled workers to better use their remaining work capacity.
Disability reforms started to apply to persons between 50-55. In 2017, additional vocationally oriented medical rehabilitation measures were
introduced to facilitate the return of the partially disabled to the labour market.
Turning around recent weak productivity growth
Productivity growth has decelerated in Austria over the past decade more markedly than in other OECD
countries taken as a whole. Average labour productivity growth per worker, which was the highest among
peer countries between 1995-2005, decelerated to the lowest between 2005-2016 (Figure 1.24, Panel A).
Weaknesses in resource allocation efficiency, measured on the basis of per hour productivity, appear to
0
20
40
60
80
100
120
140
0
20
40
60
80
100
120
140
2015 2020 2025 2030 2035 2040 2045 2050 2055 2060
Baseline Ageing bill Accelerated growth
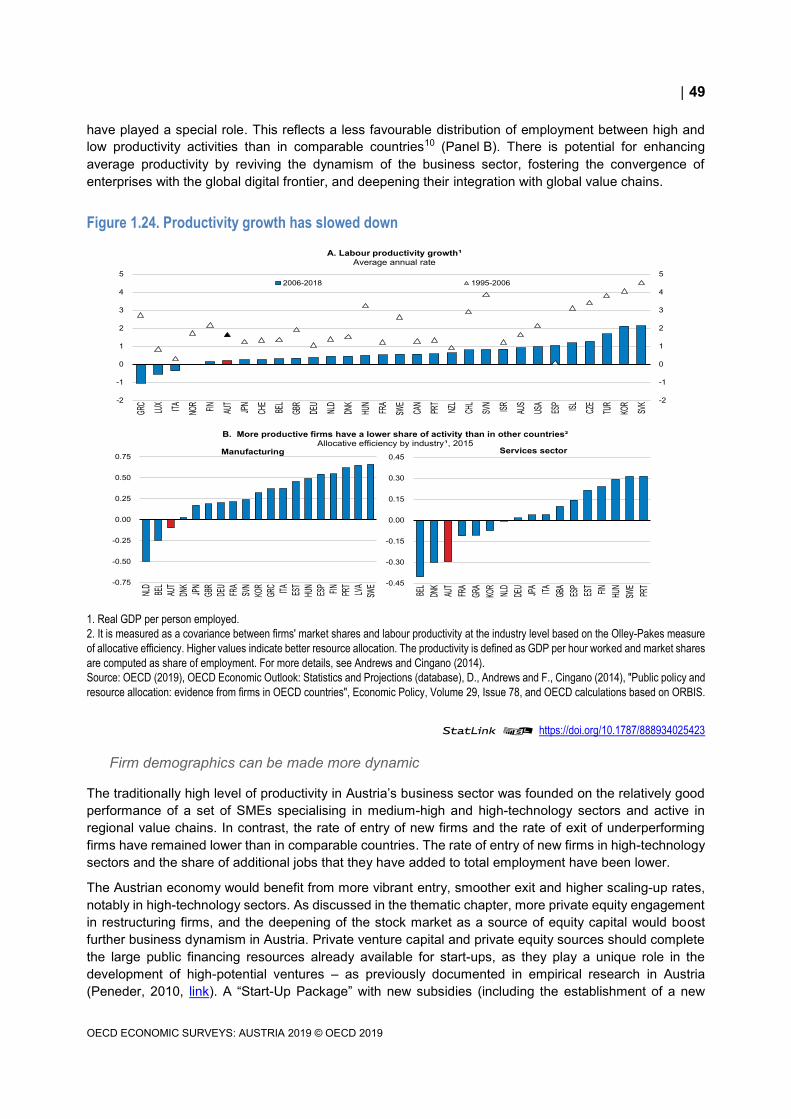
49
OECD ECONOMIC SURVEYS: AUSTRIA 2019 © OECD 2019
have played a special role. This reflects a less favourable distribution of employment between high and
low productivity activities than in comparable countries10 (Panel B). There is potential for enhancing
average productivity by reviving the dynamism of the business sector, fostering the convergence of
enterprises with the global digital frontier, and deepening their integration with global value chains.
Figure 1.24. Productivity growth has slowed down
1. Real GDP per person employed.
2. It is measured as a covariance between firms' market shares and labour productivity at the industry level based on the Olley-Pakes measure
of allocative efficiency. Higher values indicate better resource allocation. The productivity is defined as GDP per hour worked and market shares
are computed as share of employment. For more details, see Andrews and Cingano (2014).
Source: OECD (2019), OECD Economic Outlook: Statistics and Projections (database), D., Andrews and F., Cingano (2014), "Public policy and
resource allocation: evidence from firms in OECD countries", Economic Policy, Volume 29, Issue 78, and OECD calculations based on ORBIS.
StatLink 2 https://doi.org/10.1787/888934025423
Firm demographics can be made more dynamic
The traditionally high level of productivity in Austria’s business sector was founded on the relatively good
performance of a set of SMEs specialising in medium-high and high-technology sectors and active in
regional value chains. In contrast, the rate of entry of new firms and the rate of exit of underperforming
firms have remained lower than in comparable countries. The rate of entry of new firms in high-technology
sectors and the share of additional jobs that they have added to total employment have been lower.
The Austrian economy would benefit from more vibrant entry, smoother exit and higher scaling-up rates,
notably in high-technology sectors. As discussed in the thematic chapter, more private equity engagement
in restructuring firms, and the deepening of the stock market as a source of equity capital would boost
further business dynamism in Austria. Private venture capital and private equity sources should complete
the large public financing resources already available for start-ups, as they play a unique role in the
development of high-potential ventures – as previously documented in empirical research in Austria
(Peneder, 2010, link). A “Start-Up Package” with new subsidies (including the establishment of a new
-0.75
-0.50
-0.25
0.00
0.25
0.50
0.75
NLD
BEL
AUT
DNK
JPN
GBR
DEU
FRA
SVN
KOR
GRC
ITA
EST
HUN
ESP
FIN
PRT
LVA
SWE
Manufacturing
-0.45
-0.30
-0.15
0.00
0.15
0.30
0.45
BEL
DNK
AUT
FRA
GRA
KOR
NLD
DEU
JPA
ITA
GBA
ESP
EST
FIN
HUN
SWE
PRT
Services sector
B. More productive firms have a lower share of activity than in other countries² Allocative efficiency by industry¹, 2015
-2
-1
0
1
2
3
4
5
-2
-1
0
1
2
3
4
5
GRC
LUX
ITA
NOR
FIN
AUT
JPN
CHE
BEL
GBR
DEU
NLD
DNK
HUN
FRA
SWE
CAN
PRT
NZL
CHL
SVN
ISR
AUS
USA
ESP
ISL
CZE
TUR
KOR
SVK
A. Labour productivity growth¹Average annual rate
2006-2018 1995-2006

50
OECD ECONOMIC SURVEYS: AUSTRIA 2019 © OECD 2019
Digitalisation and Growth Fund, and more credit guarantees), regulatory sandboxes and new educational
programmes were introduced in May 2019 - without tax incentives. Tax incentives for such investment can
indeed be an effective way to boost the provision of risk capital. The United Kingdom’s Enterprise
Investment and Seed Enterprise Investment schemes -which provide income tax deductions and reliefs on
taxation of capital gains- are examples which succeeded to stimulate investment and employment in small
firms (EC, 2017, link; Cowling et al., 2008, link).
Austrian SMEs face a special challenge raised by demographic trends: a large proportion of their owner-
managers approach retirement age. Many ownership transitions come on the cards within or outside
current owner families. The preservation of the outstanding business goodwill that these firms have already
built-up, and the social and regional stakes associated with their good performance make successful
transmissions crucial. A stronger eco-system for external investments encompassing the full cycle of
financing of enterprises – from venture capital to private equity, and from growth capital to stock market
listings- is needed, including a supportive set-up of information and legal services. The thematic chapter
recommends that Austria reviews and strengthens the most critical factors in the development of such an
ecosystem.
Digitalisation needs to advance more rapidly
Austria is adapting to the moving global digitalisation frontier in both the business and public sectors.
However, according to available indicators this is occurring at a slower pace than in peer countries
(Figure 1.25). Divergences in the “digitalisation momentum” may be expected to create larger productivity
gaps, income divergences and social cohesion tensions in the future than in the past (Andrews, Nicoletti
and Timiliotis, 2018, link). Austria rightly aims at catching-up in this area on the back of a “Digitalisation
Roadmap” adopted in 2017 and a comprehensive “Digitalisation Strategy” which is being developed under
the auspices of the Federal Ministry of Digital and Economic Affairs (OECD, 2017, link).
The 2017 OECD Economic Survey had found that Austria’s digitalisation gap resulted mainly from adoption
lags in small-and-medium-sized firms. This was due to shortcomings in both their skills (capabilities) and
market expansion and growth opportunities (incentives). The OECD Survey recommended to focus policy
efforts on i) upgrading the entire range of ICT-generic, ICT-specific and ICT-complementary skills of
workers and citizens of all ages, and ii) stimulating business dynamics in ICT-producing and ICT-using
sectors alike, in both manufacturing and services.

51
OECD ECONOMIC SURVEYS: AUSTRIA 2019 © OECD 2019
Figure 1.25. Digitalisation gaps
1. DESI overall index is calculated as the weighted average of the five main DESI dimensions: Connectivity (25%), Human Capital (25%), Use
of Internet (15%), Integration of Digital Technology (20%) and Digital Public Services (15%).
2. Based on the European surveys on ICT usage in enterprises. Data in 2016 are not available.
3. High-speed broadband refer to at least 30 Mbit/sec data transfer speed.
Source: S., Sorbe, et al. (2019), "Digital Dividend: Policies to Harness the Productivity Potential of Digital Technologies", OECD Economic Policy
Papers, No. 26., OECD (2019), Digital Services Trade Restrictiveness Index, European Commission (2019), Digital scoreboard (database), and
Eurostat (2019), Digital economy and society (database).
StatLink 2 https://doi.org/10.1787/888934025442
Recent OECD research suggests that the three most important drivers of digitalisation in Austria are the
quality of technical and managerial skills, the fluidity of resource allocation via product and labour market
reforms and access to long-term risk finance by young innovative firms (Andrews, Timiliotis and et al.,
2018, link). Other policy levers such as e-government services and trade facilitation for digital goods and
services also affect the pace of digitalisation, but to a lesser extent. Upgrading the key framework
conditions promises to deliver particularly sizeable productivity and growth benefits in Austria. Based on
the calculations in Andrews, Timiliotis and et al., 2018 (link), it is estimated that if Austria’s current gap in
product market regulations, digital trade barriers, e-government use and venture and equity capital
4
6
8
10
12
14
2014 2015 2016 2017 2018
A. Digital Economy and Society Index (DESI)¹Use of Internet
Austria Denmark
Germany Netherlands
Index
0
8
16
24
32
40
2008 2009 2010 2012 2014 2015 2017
Austria Denmark
Germany Netherlands
B. Firms whose business processes are automatically linked to the suppliers or customers²
% of firms with at least 10 employees
0
15
30
45
60
75
90
AUT DEU NLD SWE DNK
%
C. Access to high-speed broadband³% of firms with at least 10 employees, 2017
0.00
0.04
0.08
0.12
0.16
0.20
0.24
CHE NLD DNK DEU SWE AUT
D. Digital Services Trade Restrictiveness IndexScale from 0 to 1 (most restrictive), 2018
Other
Electronic transactions
Infrastructure and connectivity

52
OECD ECONOMIC SURVEYS: AUSTRIA 2019 © OECD 2019
investing was reduced by half vis-à-vis best performing OECD countries in each domain, a significant
acceleration may be anticipated in digitalisation and in the resulting productivity gains (Figure 1.26).
A recent comprehensive overview of the digitalisation process (Peneder et al., 2019, link) suggested that
while Austria is well-equipped with a high-speed broadband infrastructure,11 it risks being trapped in this
penultimate technology and is lagging behind in ultra-high speed broadband. While network utilisation data
suggests that only 30% of users subscribe to high-speed services, and that demand may still be too weak
for ultra-high speed services, their limited availability may also be constraining the provision of data-
intensive user-friendly services. Cross-country OECD comparisons confirm Austria’s gap in this area
(Sorbe et al., 2019, link and Figure 1.25, Panel C). This gap may be hindering the global internet
connectivity required for the full development of cross-border digital services (Ferencz, 2019, link and
Panel D).
Figure 1.26. Structural reforms can support productivity through digital adoption
Effect on firm productivity of closing half of the gap with best performing countries
Source: OECD calculations based on S., Sorbe et al. (2019), "Digital Dividend: Policies to Harness the Productivity Potential of Digital
Technologies", OECD Economic Policy Papers, No. 26.
StatLink 2 https://doi.org/10.1787/888934025461
Austria hosts many multinational firm headquarters for Central and Eastern Europe. These units create
high-quality jobs, generate high incomes and stimulate know-how transfers. For Austria to stay attractive
as a location for these corporate headquarters, a stronger environment for digital innovations is needed –
as these headquarters operate as central engines for the digital transformation of their entire groups
(Nell et al., 2019, link). Austria’s having fallen somewhat behind the international frontier in digitalisation
may become a handicap. Current policy efforts to fill this gap can help strengthen Austria’s attractiveness
as a headquarter location.
The Digitalisation Strategy of the previous government, following-up on the Digital Roadmap, aimed at
positioning Austria as a global digital leader. It was being developed under the auspices of the Ministry of
Digital and Economic Affairs and included specific priorities, key indicators, and a timetable of
implementation. It also included a comprehensive networking platform between all stakeholders
(https://www.digitalaustria.gv.at/).
0.0
0.5
1.0
1.5
2.0
2.5
3.0
0.0
0.5
1.0
1.5
2.0
2.5
3.0
Regulatory barriers Easing access to equity and venturecapital
Reducing barriers to digital trade Increasing e-government use
After 3 years After 5 years
Effect on multifactor productivity, %
Effect on multifactor productivity, %

53
OECD ECONOMIC SURVEYS: AUSTRIA 2019 © OECD 2019
International competitiveness and global value chain participation can be strengthened
further
Austria is a successful export economy, with a well-diversified manufacturing base with strong positions in
export markets, notably in Germany-centred value chains in Central Europe. Policymakers and economic
researchers monitor closely Austria’s international competitiveness and global value chain positions. The
country’s world market share declined over the past two decades, due mainly to the slower growth of its
traditional markets in Europe (Figure 1.27, Panel A). However, even when this geographic composition of
markets is taken into account, performance has slightly weakened.
The principal drivers of Austria’s international competitiveness have evolved in different directions. Cost
competitiveness (measured by relative unit labour costs) declined slightly over the past decade, departing
from Austria’s long-established ability to stabilise these costs relative to trade partners. Still, the sensitivity
of exports to labour costs has also diminished, as manufacturers succeeded to preserve the differentiation
and the technological sophistication of their products. The Economic Complexity Index, which measures
the technical sophistication of exports, remains strong (Figure 1.27, Panel E). However, given the massive
government effort engaged in R&D support over the past decade, the additional improvement which could
have been expected in the innovation performance and the further technological sophistication of the
economy has not been fully realised (OECD, 2019, link). In the meantime, some competitors and peer
countries improved their relative positions (Figure 1.27, Panel E).
Austria’s integration in international value chains remains centred on EU trade partners and principally
Germany and other Central European neighbours (Figure 1.27, Panel E). This is expected given Austria’s
size and geographical location (Hanzl-Weiss et al., 2018, link; Heimberger, 2018, link; Ghodsi, 2018, link).
Moreover, given the presence of a substantial migrant population from these countries additional trade and
value chain integration opportunities emerge. Still, too an exclusive confinement in European networks
may deprive the Austrian economy from broader stimuli. Austria’s new External Trade Strategy aims at
supporting exporters’ access to broader overseas markets (Bundesministerium für Digitalisierung und
Wirtschaftsstandort, 2018, link).
Analyses of member countries’ “degree of centrality” in international value chains - defined as a country’s
industrial structure being more or less connected, both directly and indirectly, to global production
networks - suggest that Austria has a more peripheral position than some other small open European
economies (Criscuolo-Timmis, 2018, link). This weakens the productivity spill-overs that domestic firms, in
particular SMEs, derive from external value chains. As low barriers to entrepreneurship (where Austria has
room for progress, as discussed in Section 1.4.3) and effective trade facilitation frameworks (captured by
the complexity of customs procedures, where Austria performs slightly less well than Netherlands,
Switzerland and Sweden) are found to be particularly relevant for SMEs’ performance in value chains.
Austria should ensure that these frameworks are as supportive as possible for these international
interactions.

54
OECD ECONOMIC SURVEYS: AUSTRIA 2019 © OECD 2019
Figure 1.27. Traditionally strong export performance has weakened somewhat
1. Export performance is measured as the ratio of actual export volume to the country’s export market size.
2. Based on the two-digit Harmonized System 2012.
3. Economic complexity is measured by the knowledge intensity of an economy, as reflected in the diversity and ubiquity of its exports.
4. Based on the calculations of export product complexity by the Observatory of Economic Complexity of the MIT.
5. Selected CEE countries cover the Slovak Republic, the Czech Republic, Hungary, Poland and Slovenia. Other Europe covers Austria, the
Netherlands, Belgium, Denmark, France, Italy, Switzerland, Sweden, Spain, Finland, Norway and the United Kingdom. Other Asia covers Japan,
Korea, India and Russia. Other covers 37 other countries whose data are available for this indicator in OECD TiVA database.
6. Business services are included in the "other business services" category which includes research and development services, professional
and management consulting services, technical, trade related and other business services.
Source: OECD (2019), OECD Economic Outlook: Statistics and Projections (database), OECD International Trade by Commodity Statistics
(database), and the Massachusetts Institute of Technology.
StatLink 2 https://doi.org/10.1787/888934025480
0
7
14
21
28
35
42
FIN DNK AUT SWE NLD
%
G. Foreign value-added share of gross exports by country of origin5
2015
Germany Selected CEE Other Europe
USA China Other Asia
Others
0.0
1.5
3.0
4.5
6.0
7.5
9.0
FIN DEU DNK SWE AUT NLD BEL
% of GDP
H. Gross exports of business services and ICT6
2017
Business services
Telecommunications, computer, andinformation services
0.0
0.8
1.6
2.4
3.2
4.0
2010 2011 2012 2013 2014 2015 2016 2017 2018
A. World market shareShare of exports of good and services in world exports
Austria Denmark
Netherlands Switzerland
%
90
94
98
102
106
110
2010 2011 2012 2013 2014 2015 2016 2017 2018
B. Export performance¹
Austria Denmark Germany
Netherlands Sweden
Index 2010 = 100
0.5
1.0
1.5
2.0
2.5
3.0
1991
1993
1995
1997
1999
2001
2003
2005
2007
2009
2011
2013
2015
2017
E. Economic complexity index³
Austria Denmark Germany
Netherlands Switzerland
0
5
10
15
20
25
BEL-LUX DNK NLD SWE AUT DEU CHE
%F. Share of complex goods in export4
2016Top 10 percentile
Top 5 percentile
Germany
USA
Italy
SwitzerlandFranceCzech Rep.
Hungary
Poland
UK
China
Slovak Rep.
Rest of the world
C. Exports of goods, shares by main partners2018, %
Machinery
Vehicles
Electrical machinery, equipment
Pharmaceuticals
Plastics, plastic articlesIron, steel
Articles of iron or steel
Wood
Paper, paper items
Optical, technical, medical apparatus
Aluminium
Other
D. Exports by commodities²2018, %
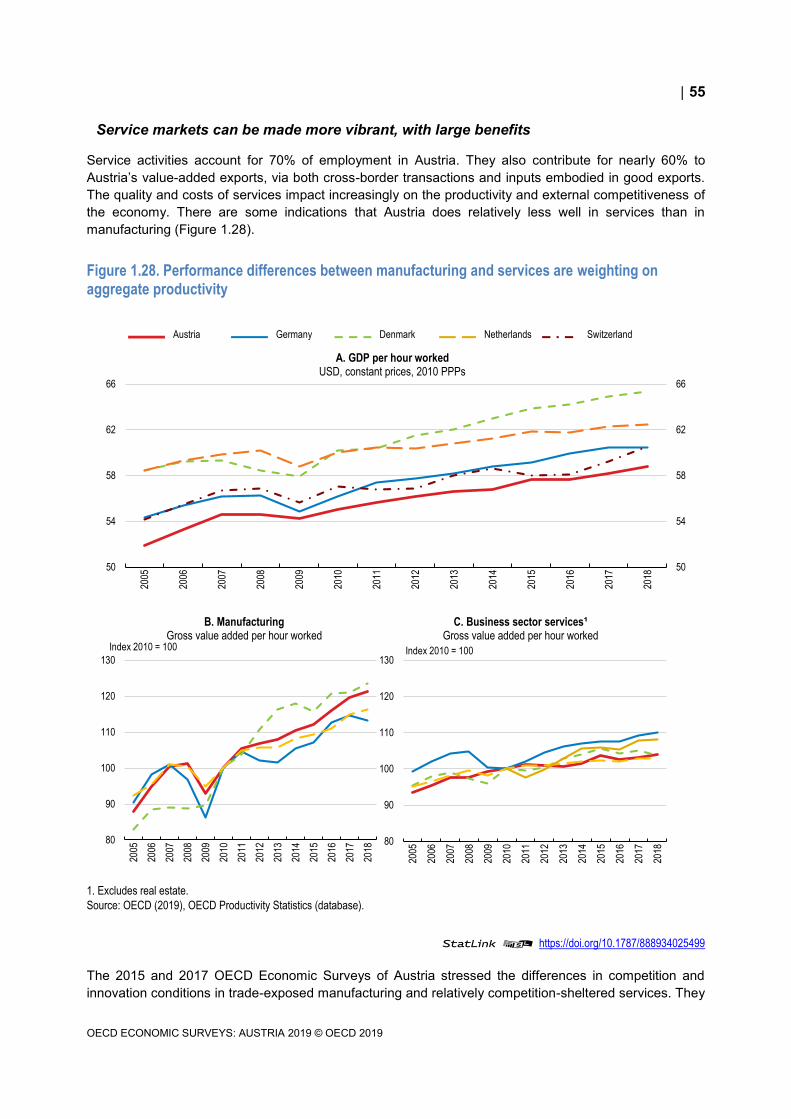
55
OECD ECONOMIC SURVEYS: AUSTRIA 2019 © OECD 2019
Service markets can be made more vibrant, with large benefits
Service activities account for 70% of employment in Austria. They also contribute for nearly 60% to
Austria’s value-added exports, via both cross-border transactions and inputs embodied in good exports.
The quality and costs of services impact increasingly on the productivity and external competitiveness of
the economy. There are some indications that Austria does relatively less well in services than in
manufacturing (Figure 1.28).
Figure 1.28. Performance differences between manufacturing and services are weighting on aggregate productivity
1. Excludes real estate.
Source: OECD (2019), OECD Productivity Statistics (database).
StatLink 2 https://doi.org/10.1787/888934025499
The 2015 and 2017 OECD Economic Surveys of Austria stressed the differences in competition and
innovation conditions in trade-exposed manufacturing and relatively competition-sheltered services. They
50
54
58
62
66
50
54
58
62
66
2005
2006
2007
2008
2009
2010
2011
2012
2013
2014
2015
2016
2017
2018
A. GDP per hour workedUSD, constant prices, 2010 PPPs
80
90
100
110
120
130
2005
2006
2007
2008
2009
2010
2011
2012
2013
2014
2015
2016
2017
2018
B. ManufacturingGross value added per hour worked
Index 2010 = 100
Austria Germany Denmark Netherlands Switzerland
80
90
100
110
120
130
2005
2006
2007
2008
2009
2010
2011
2012
2013
2014
2015
2016
2017
2018
C. Business sector services¹Gross value added per hour worked
Index 2010 = 100

56
OECD ECONOMIC SURVEYS: AUSTRIA 2019 © OECD 2019
highlighted the productivity wedge which seemed to arise from these differences (OECD, 2017, link;
OECD, 2015, link). While entry and competition opportunities are vibrant in services such as tourism and
computer consulting, restrictions to competition persist - as in a number of other OECD countries - in the
majority of professional and business services. These gaps risk denting the performance of the Austrian
economy.
The new comprehensive OECD snapshot of product market regulations in member countries (OECD,
2019, forthcoming) confirms that Austria’s regulatory framework is less open to competition than in peer
countries. Gaps persist even after the welcome amendment of the Trade Act in 2017, which lifted market
access restrictions in 19 “Teilgewerbe”, which became free trades. The authorities estimate that the Trade
Act should maintain high skill and qualification standards in professions, to continue to support service
quality, innovations and young workers’ motivations to engage in high-quality vocational education. The
official registration of new firms in non-regulated activities was simplified, via an on-line digital platform.
The previous government planned to establish a “regulatory monitoring agency” which would review all
existing business regulations, with a view to alleviate regulatory burdens. While earlier reforms in network
sectors (electricity, gas, air transportation and e-communication) had opened them to competition, the
framework remains more restrictive than in many other OECD countries in rail transportation, road freight,
retail trade, distribution of pharmaceuticals, and professional services of lawyers, notaries, accountants,
architects and civil engineers (Figure 1.29). In the last two areas (tax accountants and auditors, and
architects and chartered engineers) professional examinations and minimum periods of practice are being
simplified. Still, some of the aforementioned regulations are based more on command-and-control than
economic incentives, and stakeholders appear to participate less in their design. The treatment of foreign
suppliers in public procurement is also found to be more limiting.
Figure 1.29. Product Market Regulations remain generally restrictive
Index scale from 0 to 6, from least to most restrictive, 2018
Source: OECD (2019), OECD 2018 Product Market Regulation database, July.
StatLink 2 https://doi.org/10.1787/888934025518
The OECD indicators of the openness of service markets to international investment and trade place also
Austria in an intermediary position between open and restrictive countries (Figure 1. 30). In particular,
labour market tests applied to foreign service firms’ workers temporarily assigned to Austria are
constraining. Managers and specialists may obtain work permits for three years, while workers in other
0.0
0.5
1.0
1.5
2.0
2.5
0.0
0.5
1.0
1.5
2.0
2.5
Barriers to Trade andInvestment
Admin. Burden onStart-ups
Involvement inBusiness Operations
Public Ownership Barriers in Service &Network sectors
Simplification andEvaluation ofRegulations
Austria OECD Least regulated

57
OECD ECONOMIC SURVEYS: AUSTRIA 2019 © OECD 2019
categories can stay in the country for up to 12 months. High-skilled labour mobility and migration are
important drivers in attracting foreign direct investment, and bringing in new skills and perspectives to the
economy. Austria should further align the temporary employment conditions of foreign service workers with
international good practices.
Figure 1.30. Service markets can be opened to freer international trade and competition
OECD Services Trade Restrictiveness Index, scale from 0 to 1 (most restrictive), 2018
Note: The index includes regulatory transparency, barriers to competition, other discriminatory measures, restrictions on movement of people
and restrictions on foreign entry. It is calculated on the basis of the Service Trade Restrictions Index (STRI) regulatory database over the
36 OECD Members, Brazil, China, Colombia, Costa Rica India, Indonesia, Malaysia, Russia and South Africa. The STRI database records
measures on a most-favoured-nations basis. Preferential trade agreements are not taken into account. Air transport and road freight cover only
commercial establishment (with accompanying movement of people).
Source: OECD (2019), "Service Trade Restrictions Index by services sector" in OECD Industry and Services Statistics (database).
StatLink 2 https://doi.org/10.1787/888934025537
The less competitive operation of service markets risks affecting price formation in Austria. Comparative
trends in service sector productivity, service sector wages and service sector and headline inflation suggest
that less intense competition, beyond denting productivity growth, may also be fostering a degree of rent-
seeking, putting upward pressure on inflation (Figure 1.31).
Austrian inflation has been modestly but regularly higher than in Germany and Euro area in recent years
(OeNB, 2018, link). In 2018, the consumer price inflation differential between Austria and Germany was
around 0.26 percentage points, originating almost entirely from services. The contribution of service
inflation to headline inflation attained 1.06 percentage points in 2018 (in a headline inflation of 2.12%),
whereas the corresponding figure for the Euro area was 0.66 percentage points (in a headline inflation of
1.75%). Competition reforms and the full opening of services to international trade and investment may
help reduce these inflationary pressures.
Developments in the tourism and restaurants sector have a special impact on inflation. These activities
account for one third of all services included in the consumer basket. Due to large tourist inflows, tourism
generates 7% of GDP and 6% of total employment in full-time equivalents in Austria (Austrian Government,
2018, link). The Central Bank found that a large part of Austria’s inflation differential originate from tourism
services. The sector is exposed to domestic and international competition, but its productivity may be
hindered by its fragmented structure. Around 16 000 hotels (mostly of small size and family-owned) employ
4 employees each on average, against 20-30 employees per hotel in Sweden and the US (OECD, 2018,
0.0
0.1
0.2
0.3
0.4
0.5
0.0
0.1
0.2
0.3
0.4
0.5
Tel
ecom
mun
icat
ion
Dis
trib
utio
n se
rvic
es
Car
go-h
andl
ing
Cou
rier
serv
ices
Roa
d fr
eigh
t tra
nspo
rt
Cus
tom
s br
oker
age
Com
mer
cial
ban
king
Con
stru
ctio
n
Fre
ight
-for
war
ding
Rai
l fre
ight
tran
spor
t
Mot
ion
pict
ures
Insu
ranc
e
Sto
rage
and
war
ehou
se
Com
pute
r se
rvic
es
Sou
nd r
ecor
ding
Arc
hite
ctur
e se
rvic
es
Eng
inee
ring
serv
ices
Acc
ount
ing
serv
ices
Bro
adca
stin
g
Lega
l ser
vice
s
Air
tran
spor
t
Austria OECD minimum OECD average

58
OECD ECONOMIC SURVEYS: AUSTRIA 2019 © OECD 2019
link)). Their service quality and product differentiation is high, but they suffer a gap in digital transitions
(OECD, 2017, link; Austrian Hotel Association, 2016, link). The 2017-2022 programme of the previous
government committed to stimulate the tourism sector by alleviating its regulatory burdens, its seasonal
employment costs and supporting its digital transition (Austrian Government, 2017, link; Moor, 2017, link).
Structural strengthening in the tourism sector may help moderate price pressures.
Figure 1.31. Inflationary pressures in services
Business sector services¹
1. Excludes real estate.
2. Harmonised consumer price index (HICP).
3. Gross value added (in volume terms) per hour worked. -
Source: Eurostat (2019), Prices statistics (database) and Short-term business statistics (database), and OECD (2019), OECD Productivity
Statistics (database).
StatLink 2 https://doi.org/10.1787/888934025556
Policymakers are keen to preserve the high quality standards and consumer safety norms in the service
sectors. They also value the link between strict market entry rules and young cohorts’ incentives to engage
in high-quality vocational training in related trades. The experience of other OECD countries (including
other countries with high service standards such as Sweden) suggests that it is feasible to reconcile freer
competition and high quality and reliability in services. The case of pharmaceutical distribution was recently
investigated by the Austrian Competition Authority. After a detailed investigation, it concluded that, while
this activity has special “confidence good” properties with limited consumer information and high safety
risks, there is a case for opening the market to competition. Skill standards can be enforced without curbing
new entries (Austrian Competition Authority, 2018, link).
Structural reforms can accelerate GDP growth
Taken together, measures recommended in this Survey to reduce barriers to labour force participation and
employment, and boost competition would have a significant effect on Austria’s medium-term growth
prospects. Table 1.9 sets out reform scenarios based on three different combinations of pillars. First, if
existing competition restrictions in market and infrastructure services were cut by reducing the difference
in the stance of regulations to the top five OECD countries by half between 2021 and 2025, GDP per capita
growth may accelerate by around 0.4% percentage points. Second, ambitious but achievable labour tax
reforms, which would reduce the labour tax wedge for low-income earnings by 0.8% of GDP over 2021-
0
6
12
18
24
30
ITA FRA EA19 NLD DNK AUT
%
A. Service inflation²Percentage change between
2010Q1 and 2019Q1
0
6
12
18
24
30
NLD ITA DNK FRA EA19 AUT
%
B. Service wagesPercentage change between
2010Q1 and 2019Q1, Seasonally and calendar adjusted
0.0
2.0
4.0
6.0
8.0
10.0
ITA NLD DNK AUT EA19 FRA
%
C. Service productivity³Percentage change between 2010
and 2018

59
OECD ECONOMIC SURVEYS: AUSTRIA 2019 © OECD 2019
2025, financed by a cut in production subsidies or increases in environmental taxes, could lift GDP
per capita growth by 0.7-0.9 percentage points per year over 15 years (Figure 1.32). Third, public sector
reforms aimed at improving government effectiveness (section 1.5.2), if implemented, would further help
accelerate GDP growth. Combinations of such growth accelerating reforms would contribute to long-term
fiscal sustainability as discussed above (Figure 1.32).
Table 1.9. Reform scenarios
Baseline No reforms
Scenario 1: Pro-competition regulatory reform Close half-way the gap to the average 5 best performing countries.
Scenario 2: Increase in environmental taxes and cut in labor tax wedge
Increasing the receipts from environmentally related taxes by 0.25% of GDP and reducing the labour tax wedge on below-average earnings by the same
size.
Scenario 3: Cut in production subsidies and cut in the labor tax wedge 0.4% of GDP cut in production subsidies to fund a same-sized cut in the
labour tax wedge of low-income earnings
Scenario 4: Full reform package Scenarios 1-3.
Reducing the gap in government effectiveness with Sweden by half.
Figure 1.32. Potential impact of structural reforms on per capita GDP
Note: Model simulations based on the framework of Guillemette, De Mauro and Turner (2018) and Akgun, Cournède and Fournier (2017).
Scenarios depict the effect on the level of GDP per capita as compared to a baseline scenario with no policy changes. Scenario 1 simulates a
PMR reform that closes the gap to the average of the 5-best performing OECD countries half-way. Scenario 2 shows the potential impact of a
decrease in the labour tax wedge of low-income earnings of 0.25% of GDP financed through an increase in receipts from environmental taxes.
Scenario 3 depicts the impact of a decrease in the labour income tax wedge of low earnings of 0.4% of GDP financed through an equivalent cut
in production subsidies. Scenario 4 combines all reforms scenarios and also simulates a half-way increase government effectiveness to level of
the best-performing OECD country.
Source: Calculations based on OECD (2019), OECD Economic Outlook: Statistics and Projections (database).
StatLink 2 https://doi.org/10.1787/888934025575
0
3
6
9
12
15
18
0
3
6
9
12
15
18
2020 2021 2022 2023 2024 2025 2026 2027 2028 2029 2030 2031 2032 2033 2034 2035 2036 2037 2038 2039 2040
%%
Scenario 1 Scenario 2
Scenario 3 Scenario 4

60
OECD ECONOMIC SURVEYS: AUSTRIA 2019 © OECD 2019
Table 1.10. Past recommendations to foster the dynamism of the business sector
Past OECD recommendations Actions taken Reduce barriers to competition in services by easing entry regulations, removing restrictions on capital shares and voting rights of foreign investors and strengthening the investigation power of competition
authorities
Market access restrictions in 19 so-far regulated trades were eliminated in 2017. A “regulatory monitoring agency” will be established to review all remaining regulations and make simplification proposals. The National Competition Authority’s powers of inspection on electronic files (on external
servers, or on cloud) were increased. Its annual budget was also
augmented in 2017.
Set up a transparent monitoring system for the implementation of the
Digital Roadmap, with timelines and quantitative targets
A new “Digitalisation Strategy for Austria” was adopted in 2018 as a follow-up to the 2017 Digital Roadmap. It has specific priorities, a timetable, a
monitoring system and key indicators.
Integrate a Digital Skills Plan in the Roadmap, with timelines and quantitative targets for ICT-generic, ICT-specialist and ICT-
complementary skills
New support programmes “SME Digital” and “Digital Innovation Hubs” were introduced to upskill SMEs in digital technologies. “Pro boot camps” were
launched to jointly train the employees of leading firms and of SMEs in specific digital subject areas. A “Digital Competence Pact” was signed between several public and private sector organisations to foster the digital
skills of different target groups such as “young career starters”, “elderly professionals above 45”, “seniors above 60”, “mobile application
professionals” etc.
Facilitate new entries and stimulate competition in broadband services
in the context of the Broadband Plan 2020.
A “Broadband Strategy 2030” was adopted in February 2019. Austria is the first European country with a commercial 5G mobile network launched in March 2019 in 25 cities and municipalities. A nationwide 5G network is
targeted for 2025.
Ensure that competition policy responds to changing threats to competition in digital markets, including through international co-
operation.
A new merger threshold was defined to improve merger control in the digital sector. Austrian Competition Law’s “relative market power” concept permits to detect market power abuses and is used to foster competition in digital
markets.
Promote more effective data protection, cyber security and consumer protection. Improve public awareness that responsibility for risk
management remains partly with firms and consumers themselves.
An internet portal addressing exclusively security issues was created with the participation of 40 public and private sector organisations. Austria’s electronic identification system (eID and Handy Signatur) comply with high
technical and legal security standards.
Public sector reforms are now more crucial
The large size of the public sector constrains policy innovations
Austria’s relatively large public sector (Figure 1.33 and 1.34) is currently exposed to three pressures:
additional ageing-related spending, re-allocation needs in education spending, and the need to make the
revenue structure more employment-friendly. Fiscal relations between federal, provincial (Länder) and
municipal layers are also complex and hamper the strategic prioritisation and service quality in several
areas. The perceived performance of the public sector is below the expectations of citizens. Public
appreciation is high in certain areas such as judiciary and security services, but the overall trust in the
quality of services is below comparable countries (Figure 1.33, Panel D).

61
OECD ECONOMIC SURVEYS: AUSTRIA 2019 © OECD 2019
Figure 1.33. The public sector is very large and its performance can be improved
Note: Unweighted average of available OECD countries for the OECD aggregate for each panel.
1. It covers benefits with a social purpose in the following nine policy areas: old age, survivors, incapacity-related benefits, health, family, active
labour market policies, unemployment, housing, and other social policy areas.
2. Based on the Gallup World Poll (GWP). % of respondents answering "yes" to a question such as "Do you have confidence in national
government?".
Source: OECD (2019), "National Accounts at a Glance", OECD National Accounts Statistics (database), OECD Social Expenditure Database
(SOCX), and OECD (2017), Government at a Glance 2017.
StatLink 2 https://doi.org/10.1787/888934025594
0
10
20
30
40
50
60
KO
R
CH
E
GB
R
ES
P
PO
L
OE
CD
NLD
LUX
DE
U
PR
T
HU
N
GR
C
AU
T
ITA
NO
R
DN
K
BE
L
FIN
FR
A
% of GDP
A. Total general government spending2018 or latest year
0
10
20
30
40
50
60
KO
R
CH
E
ES
P
GB
R
OE
CD
PO
L
HU
N
PR
T
NLD
NO
R
DE
U
LUX
GR
C
ITA
AU
T
FIN
DN
K
BE
L
FR
A
% of GDP
C. Total taxes and social contributions revenue2018 or latest year
0
6
12
18
24
30
36
KO
R
CH
E
NLD
HU
N
GB
R
PO
L
OE
CD
LUX
PR
T
GR
C
ES
P
NO
R
DE
U
AU
T
ITA
DN
K
FIN
BE
L
FR
A
% of GDP
B. Total public social spending¹2018
0
15
30
45
60
75
90
GR
C
ITA
KO
R
FR
A
ES
P
HU
N
PR
T
PO
L
GB
R
OE
CD
BE
L
AU
T
DN
K
FIN
DE
U
NLD
NO
R
LUX
CH
E
%
D. Confidence in national government²2016

62
OECD ECONOMIC SURVEYS: AUSTRIA 2019 © OECD 2019
Figure 1.34. The structure of general government revenue and spending remained broadly stable over two decades
1. Cyclically-adjusted data.
2. The inner circles refer to 1995, while the outer circles to 2014.
Source: B., Cournède, J., Fournier and P., Hoeller (2018), "Public finance structure and inclusive growth", OECD Economic Policy Papers, No.
25.
StatLink 2 https://doi.org/10.1787/888934025613
The previous government aimed at reducing the tax-to-GDP ratio from 42% in 2018 towards 40% by 2023.
The financing and spending reforms required to attain this goal without undermining long-term fiscal
sustainability would be challenging. In order to attain this objective policies would have to reign in the
“passive” trend increase in spending and regain room for more strategic use of public resources. Sector-
specific spending reviews were planned to detect the potential for savings and quality and efficiency
improvements. According to the experience of other OECD countries, the quality of these reviews vary and
the authorities should ensure that they are carried out at the highest possible level of independence and
technical standards. Their conclusions should also be well publicised and publicly discussed. Among
OECD countries’ experiences with spending reviews Canada’s and The Netherlands’ experiences may be
of interest for Austria. To combine independence of analysis and judgment with deep insider knowledge
9.1
11.0
19.1
26.2
3.7 2.5
6.1
5.0
7.5
9.8
Education(8.4)
Health(13.2)
General government wages and
intermediate consumption
(17.9)Old age and survivors
(28.4)
Sickness and disability
(3.7)
Unemployment(2.6)
Family and children
(4.4)
Subsidies(2.8)
Investment(5.9)
Other primary expenditures
(12.8)
B. Composition of total government spending (%)¹1995 and 2014²
9.1
22.7
21.7
32.7
5.0
3.1
0.6
5.2
Sales of goods and services
(8.6)
Consumption taxes(20.2)
Personal income taxes
(23.7)
Social security
contributions(31.0)
Environmental taxes(6.5)
Corporate income taxes
(4.8)
Recurrent taxes on property and wealth
(0.5)
Other primary revenue(4.8)
C. Composition of government revenue (%)¹1995 and 2014²
15.50 14.99 14.74 15.71 15.85
9.92 8.52 9.48 9.56 8.90
5.706.04 6.30 6.59 6.66
4.744.49 4.21
4.41 4.15
0
10
20
30
40
50
1995 2000 2005 2010 2015
A. Long-term trends in general government spending¹1995-2015
Family and children
Investment
Education
Health
General government wages andintermediate consumption
Old age, survivors, sickness anddisability
% of GDP
63
OECD ECONOMIC SURVEYS: AUSTRIA 2019 © OECD 2019
and practical experience in the policy areas reviewed, the Netherlands has for example created mixed
review teams composed of line Ministry insiders, Ministry of Finance officials, and independent experts,
under the chairmanship of experienced wise persons external to the field (OECD, 2011, link; Institute for
Government, 2018, link).
Federal fiscal arrangements should be adapted
Austria has a multi-layer federal system which is appreciated by the population as a bottom-up governance
model. However, it increases government costs and raises co-ordination challenges in the planning and
implementation of public services. Policy functions, which are not explicitly vested by the constitution with
the federal government, are carried out by the 9 Länder governments. More than 2 000 municipalities are
in charge of various service areas such as early child care and protection against poverty. The average
size of municipalities is one of the lowest in OECD and the number of local governments
per 100 000 inhabitants one of the highest (Figure 1.19 above).
Länder and municipal governments have limited own revenues and are funded mainly by federal
government transfers through a complex system of tax sharing and redistribution.12 Austria is among the
OECD countries with the largest gap between the taxing and spending powers of sub-central governments
(OECD, 2019, link; Allain-Dupré, 2018, link). This misalignment has long been identified as a weakness in
the optimisation and efficiency of public services and spending (Fischer et al., 2011). In several key areas
including the hospital infrastructure, secondary education and social protection, the three layers of
government share the planning, funding and provision responsibilities and are accountable together on the
quality of services. Austria should more closely align revenue raising and spending responsibilities of
government levels, and seek economies of scale in municipal governance through shared services or
consolidation of government. An example, in a crucial domain for long-term social cohesion and economic
growth, is found in the organisation of pre-school and school education. Co-operation between government
levels started with the publication of some common pedagogical documents, and information exchanges
on pupils’ language abilities, but upgrading the pedagogical content of kindergarten services and ensuring
better curricular continuity with school education require higher service quality at respective government
levels and improved co-operation between them (Box 1.4).
Box 1.4. Co-ordination of pre-school and school education between government layers
OECD’s new study on Early Learning and Child Well-Being (OECD, 2018, link) emphasises that “the imperative to give all children a strong early start is more and more pressing. Children’s early experiences have a profound and long-lasting impact on individual children’s well-being and happiness during childhood, as well as their later life outcomes, including education, employment, health, citizenship and life satisfaction. Countries that fail to pay attention to the quality of children’s early years are ignoring the most effective means to assure the well-being and skills of the next generation and to achieve more equitable outcomes across families and communities”. The study found however that “providing more early childhood education and care (ECEC) does not automatically yield positive results for children. In some countries, ECEC has very positive effects on children’s learning outcomes, whereas in other countries it is neutral and even negative in some cases. Equally worrying, in a number of countries ECEC appears to benefit advantaged children more than disadvantaged children”.
Austria has taken several initiatives to improve the coverage and quality of its ECEC infrastructure, introducing notably a compulsory year of pre-school education. While participation of under 3 year-olds to ECEC remains lower than in peer countries, at around 25% (against 50-80% in the Nordic countries and in the Netherlands), attendance by 4 year-olds reached 94.9% in 2016, close to the EU average of 95.3%. For 5 year-olds it has already surpassed the EU average, reaching 97%. Amid these major progresses in coverage, it is recognised however that “quality issues remain” (EC, 2018, link).
The upgrading of early childhood education and care faces three challenges which are partly related to government organisation in this area:
Pre-school education is a responsibility of municipal governments, under a Federal regulatory framework governing the quality of kindergarten infrastructure and the pedagogical

64
OECD ECONOMIC SURVEYS: AUSTRIA 2019 © OECD 2019
qualifications of the educators. A large diversity is observed in the characteristics of these services across Austria, including in terms of opening hours and periods.
The educational background of kindergarten and ECEC personnel is specific to Austria. As a difference from several other OECD countries (where preschool teachers receive university training), the standard professional qualification of the educational staff is a two year-long tertiary programme. University degrees in ECEC (granted by few universities) do not authorize a candidate to work in preschools, because the certified two-yearly vocational programme is required. Austria could consider drawing on Germany’s recent innovative experience in this area.13
Curricular co-ordination between ECEC and primary education is less advanced than in the most innovative OECD countries (OECD, 2019, link). Professional contacts and consultations have long existed between pre-school and school educators, but it is since 2018 that the Federal government has prescribed pedagogical standards for kindergarten to be implemented as part of the education financing contracts with the Länder. Substantial background pedagogical work is deemed necessary for effective curricular integration between early and primary education (Shuey et al., 2019, link).
The previous government announced a series of measures to improve both participation in ECEC and its quality. It planned to establish common educational goals encompassing both pre-school and school education, including strong competences in German language and a definition of common values. The plan included standardised language tests for all children at the age of 4, which, if necessary, would be followed by two years of compulsory pre-school language training. Sanctions against parents were envisaged if compulsory provisions are not complied with. The authorities also envisaged setting standards for pre-school infrastructure, group size, the qualification of staff and initial and life-long training of educators (Austrian Government, 2017, link).
Reinforcing integrity in the public sector and combatting corruption
Austria is ranked 14th among 180 countries in Transparency International’s Corruption Perception Index,
somewhat below its peer countries (Figure 1.35). Scoring displayed variations in the 2000s. The complex
multi-layer structure of the government, the multitude of public procurement authorities and the presence
of many economic entities owned by the Federal government-, Länder and municipalities expose the
country to special governance challenges.
A number of difficulties in fighting transnational corruption have been identified by the OECD Working
Group on Bribery, when monitoring Austria’s implementation of the OECD Anti-Bribery Convention.14
Special conditions include the weight of companies carrying-out cross-border activities in quasi-public
services such as energy and telecommunications in Central, Eastern and South Eastern Europe (OECD,
2012, link). The gambling industry also has strong international ties, and foreigners account for 70% of the
bets in Austria. All of Austria’s top six banks have significant operations throughout the region.
One key matter is the low maximum fine available to companies held liable for bribery abroad. The
maximum fine, of just EUR 1.3 million, does not reflect the size and importance of many Austrian
companies, the location of their international business operations, and the business sectors in which they
are involved (OECD, 2017, DAF/WGB(2017)72). The fine is in fact lower than that which can be imposed
on an individual convicted of the same conduct. Other longstanding issues upon which progress is being
made include elements of bank secrecy, and the length of time it takes for the authorities to obtain bank
account information. Historically, this has proved an obstacle in providing prompt and effective international
cooperation to other countries in corruption cases. Austria has taken steps to address these issues through
the creation, in October 2016, of a national register of bank accounts which can be directly accessed by
Austrian prosecution authorities. Austria has also enacted laws to remove the previous difficulties in
identifying the true “beneficial” owners of companies (OECD, December 2017). Furthermore, Austria
should take steps to improve foreign bribery enforcement. Since ratifying the Convention in 1999, Austria
has sanctioned only one individual for foreign bribery, and no companies have yet been convicted (OECD,
December 2017). Austria’s foreign bribery laws and its enforcement will be comprehensively re-evaluated
by the Working Group in March 2020. Austria has also volunteered in 2018 to be examined by the IMF on

65
OECD ECONOMIC SURVEYS: AUSTRIA 2019 © OECD 2019
the quality of its legal and institutional framework to combat bribery and prevent the laundering of dirty
money.
Figure 1.35. Corruption risks
Note: Panel A: the “Corruption Perceptions Index” by Transparency International is subsumes several sub-indicators. Panel B: the “Control of corruption” indicator in the World Bank Worldwide Governance Indicators (WGI) is also a composite indicator. For details, see Kaufmann et al., (2010); the chart shows both the point estimate and the margin of error. Panel D: the corruption indicator by the Varieties of Democracy Project (“VDEM”) is one of the subcomponents of the World Bank “Control of Corruption” indicator. Panel E: it summarises the overall assessment on the exchange of information in practice from the Phase 2 peer reviews by the Global Forum on Transparency and Exchange of Information for Tax Purposes; peer reviews assess member jurisdictions’ ability to ensure the transparency of their legal entities and arrangements and to cooperate with other tax administrations in accordance with the internationally agreed standard; the panel shows first round results (a second round is ongoing). Panel F: the FATF conducts peer reviews of each member to assess levels of implementation of the FATF Recommendations; the chart refers to the ratings, which reflect the extent to which a country's measures for anti-money laundering and countering the financing of terrorism are effective against the defined 11 immediate outcomes. Source: World Bank; Transparency International; Varieties of Democracy Institute, University of Gothenburg, and University of Notre Dame; OECD Secretariat’s own calculation based on the materials from the Global Forum on Transparency and Exchange of Information for Tax Purposes, OECD; Financial Action Task Force (FATF).
StatLink 2 https://doi.org/10.1787/888934025632
1
2
3
4
Risk, Policy andCoordination
International Co-operation
Supervision
PreventiveMeasures
Legal Persons andArrangements
Authorities'Financial
Intelligence
Investigation andProsecution, Money
Laundering
Confiscation
Investigation andProsecution,
Terrorist Financing
Deprevation ofTerrorist Financing
Financial Sanctionsagainst Proliferation
F. Anti-money laundering measuresscale: 1 (low effectiveness) - 4 (high effectiveness)
AUT OECD average
ES
TF
INF
RA
ISL
IRL
ITA
KO
RLT
UM
EX
NZ
LN
OR
SV
NE
SP
SW
EA
US
AU
TB
EL
CA
NC
HL
CZ
ED
NK
DE
UG
RC
HU
NIS
RJP
NLV
ALU
XN
LD
PO
LP
RT
SV
KC
HE
GB
RU
SA
TU
R
E. Tax Transparency: Exchange of Information
Partially Compliant
Compliant
Non-Compliant
Largely Compliant
-2.5
-1.5
-0.5
0.5
1.5
2.5
NZ
LN
OR
FIN
DN
KS
WE
CH
ELU
XC
AN
NL
DG
BR
DE
UIS
LA
US
IRL
AU
TJP
NB
EL
US
AF
RA
ES
TC
HL
PR
TIS
RS
VN
PO
LC
ZE
LT
ULV
AE
SP
KO
RS
VK
ITA
HU
NG
RC
TU
RM
EX
B. Control of Corruption, 2017Worldwide Governance Indicators (WGI)
Scale: -2.5 (worst) to 2.5 (best)
0
20
40
60
80
100
DN
KN
ZL
CH
EF
INS
WE
NO
RN
LD
CA
NLU
XD
EU
GB
RA
US
AU
TIS
LB
EL
ES
TIR
LJP
NF
RA
US
AC
HL
PR
TIS
RP
OL
SV
NC
ZE
LT
UE
SP
LV
AK
OR
ITA
SV
KH
UN
GR
CT
UR
ME
X
A. Corruption Perceptions Index, 2017Transparency InternationalScale: 0 (worst) to 100 (best)
0.0
0.5
1.0
1.5
2.0
2.5
19
96
19
98
20
00
20
02
20
04
20
06
20
08
20
10
20
12
20
14
20
16
C. Evolution of "Control of Corruption", WGI
AUT OECD average
lowercorruption
higher corruption
0.00
0.25
0.50
0.75
1.00Executive bribery
Executiveembezzlement
Public sectorbribery
Public sectorembezzlement
Legislaturecorruption
Judicial corruption
D. Components of VDEM, Corruption by sectorScale: 0 (worst) to 1 (best)
Best performer Worst performer
AUT OECD average

66
OECD ECONOMIC SURVEYS: AUSTRIA 2019 © OECD 2019
Ambitious public finance reforms should help reallocate resources and rebalance
revenue sources
Austria should make use of the significant room available for rendering its public finance structures more
supportive of employment, growth, social inclusion and public service quality. This requires a new strategic
approach, to both public spending and public revenue patterns.
Public spending has expanded rather passively with the size of both public services and social transfers
having grown along the tracks of established policies, organisations and entitlements. To make spending
more strategic and more responsive to economic and social priorities and needs, Austria can draw on the
experiences of other OECD countries in identifying areas where spending can be reduced with limited loss
for social benefits with the help of in-depth independent spending reviews - as discussed above. The
government programme 2017-2022 planned to use this instrument more actively than in the past.
On the revenue side, there is also room for major reforms. Recent OECD research on the effect of tax mix
on growth and equality suggests that if Austria rebalanced the composition of its tax structure from labour
to environmental and property taxes, sizeable gains can be expected for employment, growth and social
inclusion (OECD, 2017, link), higher environmental taxes would serve both emission-reduction and
revenue-raising objectives. Any regressive effects for income distribution (for instance for low-income
households in remote areas) can be offset with targeted transfers. While consumption taxes have high
standard rates in Austria, widespread rate-reductions15 are fiscally costly and can be reduced (OECD,
2018, link; EC, 2017, link; Zu, 2017, link; IFS, 2017, link). With a VAT revenue ratio of 60% (which means
that 40% of the theoretical revenue potential from VAT is not realised, due mainly to reduced rates and
exemptions), Austria’s policymakers can draw on the experience of other OECD countries such as
New Zealand and Canada which succeeded to enhance their VRR rates (to 95% in the case of
New Zealand). If policymakers could increase Austria’s VAT revenue ratio from 60% to 70%, they could
generate up to 1.1% of GDP of additional tax revenues, which may create space for more productive tax
cuts.
The evaluation by the OECD of the efficiency of VAT reductions and exemptions is indeed mitigated. In
the tourism sector in particular, which received additional VAT concessions in 2018, economic gains from
VAT incentives may not justify their high fiscal costs (OECD, 2014, link). Iceland’s experience deserves
Austrian policymakers’ attention: following a positive experience with increasing the special rate for tourism
from 7% to 11%, Iceland plans to align the rate for most tourism services with the normal VAT rate. This
alignment will help decrease the standard VAT rate from 24% to 22.5%, in line with the objective of
broadening the tax base and reducing the tax rates (OECD, 2017, link). Targeted transfers to low-income
groups can offset any regressive effects from higher VAT rates (Maples and Sawyer, 2017, link).
Property taxation, in turn, may serve both revenue raising and income and wealth redistribution goals. As
discussed above, recent OECD research found that inheritance taxation may be an effective form of
property taxation, with, moreover, a positive estimated net effect on growth (Akgun et al., 2017, link).
Austria announced a digital taxation initiative. A 5% tax rate will, beginning in 2020, apply to online
advertising revenues from companies generating global sales of EUR 750 million with at least
EUR 25 million from Austria. Further, VAT will be applied to certain sales made via digital retail platforms.
The VAT reforms are welcome and should be implemented in a manner consistent with OECD guidance.
The online advertising tax follows several other countries introducing similar initiatives, and the European
Parliament voting to support a similar EU-wide directive (European Parliamentary Research Service, 2018,
link). Many of the enterprises that would be subject to the digital services tax are headquartered in the
United States. A G20/OECD process is developing measures that adapt existing approaches to taxing
firms to the challenges of digital technologies. Members of the G-20/OECD process are committed to
reaching a consensus-based, long-term solution in 2020, and have not reached a consensus about the
need or merit of interim measures (OECD, 2019, link).

67
OECD ECONOMIC SURVEYS: AUSTRIA 2019 © OECD 2019
Box 1.5. OECD research on public finance reforms have important implications for Austria
The findings of the new OECD project on “Public finance structure and inclusive growth” are informative
for Austria. Estimated implications for the revenues of low-income deciles and social cohesion are
particularly remarkable (Cournède et al., 2018, link):
The increase in the size of OECD governments over the past two decades has to a great extent been
passive, reflecting the impact of ageing on public pension and health expenditure, with scant
reallocation across spending or tax areas. This has also been the case in Austria where the share of
general government spending in GDP reached the 6th highest level in OECD at 50%.
There is room for win-win public sector reforms in all OECD countries, that could boost both output and
social inclusion. Austria comes out as one of the countries where potential benefits from such reforms,
both for growth and social inclusion, is the greatest. Available evidence hints at a weakening of the
overall quality (size, efficiency and structure - measured according to the methodology described in
Cournède et al. (2018)) of public spending between 1995-2012, while this quality has improved in peer
countries. Re-orienting the composition of spending and taxes and increasing the quality and credibility
of services would be expected to important major gains.
These OECD insights are congruent with the results of another simulation of the effects of deficit-neutral
reductions of the labour tax wedge in four EU countries including Austria (the others being Germany,
Italy and Belgium). This simulation concluded that the measure with the highest growth and employment
gains is a decrease in labour taxation, financed by an increase in consumption taxes. However, as this
raises the consumption costs of households and reduces their real incomes, financing such a cut via a
reduction in public spending may be more beneficial in terms of social welfare.
Building on the OECD estimation methodology (Cournède et al., 2018, link), some specific reform
scenarios for Austria were investigated for this Survey:
Scenario 1: If environmental taxes are raised by 0.5% of GDP and if this is used to cut the labour
tax wedge on below-average earnings by the same amount, the level of GDP per capita could
increase and the lowest income decile would benefit most (see Table 1.11 on details).
Scenario 2: A reduction of 0.8% of GDP in production subsidies (which would be a sizeable
reduction and would assume supporting reforms at the EU level), if used to fund a same-sized
cut in the labour tax wedge on below-average earnings, could boost GDP per capita. All income
deciles would benefit but the bottom decile would draw the largest gains.
In a Scenario 3: if, through structural reforms, the effectiveness, quality and credibility of the
public sector is increased by reducing the gap with Sweden by half (without changing the
aggregate tax and spending ratios), GDP per capita could increase and the lowest income decile
would benefit most, as in the above scenarios.
Several inquiries, including by the Court of Audit, have shed light on the saving potential available in
specific areas of public administration, education and health spending (EC, 2019, link), including in the
context of transition to performance-based budgeting (OECD, 2018, GOV/PGC/SBO(2018)7). The losses
for GDP growth and social inclusion from the excessive concentration of taxes on labour incomes have
also been well identified (Köppl and Schratzenstaller, 2015, link). Reforms such as rebalancing primary
(preventive) and secondary (curative) health services gave promising results, but their generalisation has
proven difficult under existing financing and supply structures (Hofmarcher, 2014, link). Concerning the
simplification of federal, Länder and municipal responsibilities in the main public services, goals have long
been settled but progress has been slow. The Fiscal Equalisation Act of 2017 settled new objectives in
this area from 2020/2021 (including the utilisation of formal benchmarks to compare the quality of services

68
OECD ECONOMIC SURVEYS: AUSTRIA 2019 © OECD 2019
offered in different jurisdictions) (Federal Chancellery, 2017, link; Federal Chancellery, 2018, link). An
integrated approach to public finance reform, encompassing all government layers and involving all the
main spending items (pensions, health, public administration) and revenue areas (social security, personal
income, consumption, environmental and wealth and inheritance taxes) could help make more systematic
progress.
The fiscal policy recommendations of this Survey have been formulated as fiscally neutral measures, as
highlighted in Table 1.9 and in Box 1.5. Survey recommendation to reduce VAT rate reductions is
quantified in only very broad terms. The Table 1.11 below summarises the first-round likely fiscal impacts
of the proposed measures (Table 1.11).
Table 1.11. Possible Growth and fiscal impacts of the main recommendations of the Survey
Recommendations Fiscal impact GDP impact after 5-15 years Impact on inequality after
5 years
Product market liberalisation reforms. No significant fiscal cost GDP per capita level increases
by 1-6% compared to 2020
Impact on inequality not
modelled
Scenario 1:
Raise environmental taxes by
0.25% of GDP
Cut labour tax wedge on below-average earnings by
0.25% of GDP
Fiscally neutral GDP per capita level increases
by 1.5-8.5% compared to 2020
Lowest income decile would benefit most, with expected real increases in income of
around 2%
Scenario 2:
Reduction of 0.4% of GDP in
production subsidies
Cut labour tax wedge on below-average earnings by
0.4% of GDP
Fiscally neutral GDP per capita level increases
by 2-11% compared to 2020
Lowest income decile would benefit most, with expected
real increases in income of
around 2%
Scenario 3:
Increase effectiveness, quality and credibility of the public sector by reducing
half of the gap with Sweden
Fiscally neutral GDP per capita level increases
by 3-15% compared to 2020
Lowest income deciles would benefit the most, with increases in real income from 0.35% (lowest income
decile) to 0.15% (median)
Table 1.12. Past public finance reform recommendations
Past OECD recommendations Actions taken Undertake in-depth spending reviews in education, health care, long-term care
and public administration.
In total three spending reviews have been completed (public compulsory schools, Disaster Relief Fund, Family Benefit Funds). Further, at the moment, five other reviews are being completed (Austrian Railways, water management services,
health services in schools, international financial institutions and
justice).
Align spending and financing responsibilities at different government levels by
increasing the tax autonomy of sub-central governments.
The housing levy (generating revenues of about EUR 1.1 billion per year) became an exclusive levy of the Länder, which can
freely set rates.
Encourage municipal mergers to exploit economies of scale.
69
OECD ECONOMIC SURVEYS: AUSTRIA 2019 © OECD 2019
References
Ahrend, R., et al. (2014), “What Makes Cities More Productive? Evidence on the Role of Urban
Governance from Five OECD Countries”, OECD Regional Development Working Papers, No.
2014/05, OECD Publishing, Paris.
Akgun, O., B. Cournède and J. Fournier (2017), “The effects of the tax mix on inequality and growth”,
OECD Economics Department Working Papers, No. 1447, OECD Publishing, Paris
Allain-Dupré, D. (2018), “Assigning responsibilities across levels of government: Trends, challenges and
guidelines for policy-makers”, OECD Working Papers on Fiscal Federalism, No. 24, OECD
Publishing, Paris.
Altzinger, W., S. Humer and M. Moser. (2016), “Entwicklung und Verteilung der Einkommen”, in:
Sozialbericht – Sozialpolitische Entwicklungen und Maßnahmen 2015-2016, Sozialpolitische
Analysen, Bundesministerium für Arbeit, Soziales und Konsumentenschutz, 227–268.
Andexlinger, W., P. Nabielek and K. Nabielek (2018), “Comparing recent suburban developments in
Austria and the Netherlands”, In book: The Suburban Land Question: A Global Survey, Publisher:
University of Toronto Press, pp.167-190.
Andrews, D., G. Nicoletti and C. Timiliotis (2018), “Digital technology diffusion: A matter of capabilities,
incentives or both?”, OECD Economics Department Working Papers, No. 1476, OECD Publishing,
Paris.
Attinasi, M., D. et al. (2016), “Budget-neutral labour tax wedge reductions: A simulation-based analysis
for selected euro area countries”, Discussion Papers 26/2016, Deutsche Bundesbank.
Austria Economic Chamber (2018), AGENDA2018 WKÖ Policy Priorities, Vienna,
https://www.wko.at/Content.Node/kampagnen/agenda2018/wko-agenda2018-en.pdf
Austrian Competition Authority (2018), Report Sector Inquiry Health - The Austrian Pharmacy Market,
Vienna,
https://www.bwb.gv.at/fileadmin/user_upload/Downloads/standpunkte/Gesundheitsbranchenuntersuc
hung_Apothekenmarkt_BWB_en_final.pdf
Austrian Government (2017), Zusammen. Für unser Österreich. Regierungsprogramm 2017 - 2022,
Vienna,
https://www.wienerzeitung.at/_em_daten/_wzo/2017/12/16/171216_1614_regierungsprogramm.pdf.
Austrian Government (2018), Tourismus and Freizeitwirtschaft – Österreich 2018, Vienna,
https://www.bmnt.gv.at/service/publikationen/tourismus/bericht-lage-tourismus-frezeitwirtschaft-
oesterreich-2018.html.
Austrian Government (2019), Social mobility and Wealth distribution, Federal Ministry of Labor, Social
Affairs, Health and Consumer Protection (preliminary version), Vienna.
Austrian Hotel Association (2018), “Hotel Industry 4.0 Leveraging digitization to attract guests and
improve efficiency”, Roland Berger, Munich, https://www.rolandberger.com/en/Publications/Hotel-
Industry-4.0.html
Balestra, C. and R. Tonkin (2018), “Inequalities in household wealth across OECD countries: Evidence
from the OECD Wealth Distribution Database”, Statistics and Data Working Paper, No. 2018/01,
OECD, Paris. https://www.oecd-ilibrary.org/economics/inequalities-in-household-wealth-across-oecd-
countries_7e1bf673-en
Bruneforth, M., C. Shewbridge and R. Rouw (2019), “Moving towards more school autonomy in
Austria: Refocusing the role of school supervision”, OECD Education Working Papers, No. 200,

70
OECD ECONOMIC SURVEYS: AUSTRIA 2019 © OECD 2019
OECD Publishing, Paris.
Bundesministerium für Digitalisierung und Wirtschaftsstandort (2018), Außenwirtschaftsstrategie 2018,
Vienna,
https://www.bmdw.gv.at/WirtschaftsstandortInnovationInternationalisierung/Internationalisierung/Aussenwirtsc
haftsstrategie%202018/Documents/Außenwirtschaftsstrategie_barrierefrei_V2.pdf
Calel, R. and A. Dechezleprêtre (2016), “Environmental Policy and Directed Technological Change:
Evidence from the European Carbon Market“, Review of Economics and Statistics, Vol. 98(1).
Charbonnier, É. (2019), “Dans tous les pays de l'OCDE, on mesure la progression des jeunes et des
écoles”, Les Echos, February, https://www.lesechos.fr/politique-societe/societe/un-premier-pas-vers-
une-culture-de-levaluation-de-lecole-en-france-992825
Cournède, B., J. Fournier and P. Hoeller (2018), "Public finance structure and inclusive growth", OECD
Economic Policy Papers, No. 25, OECD Publishing, Paris.
The Court of Justice (2018), Judgment of the Court (Grand Chamber) of 13 November 2018, ECLI identifier:
ECLI:EU:C:2018:896, http://curia.europa.eu/juris/celex.jsf?celex=62017CJ0033.
The Court of Justice (2019), Judgment of the Court (Grand Chamber) of 12 September 2019, ECLI identifier:
ECLI:EU:C:2019:723, http://curia.europa.eu/juris/celex.jsf?celex=62018CJ0064.Cowling, M., P. Bates,
N. Jagger, and G. Murray (2008), “Study of the Impact of Enterprise Investment Scheme (EIS) and
Venture Capital Trusts (VCT) on Company Performance”, Research Report HMRC 44, Institute for
Employment Studies, Brighton, https://www.employment-studies.co.uk/resource/study-impact-
enterprise-investment-scheme-eis-and-venture-capital-trusts-vct-company
Criscuolo, C. and J. Timmis (2018), “GVCs and centrality: Mapping key hubs, spokes and the periphery”,
OECD Productivity Working Papers, No. 12, OECD Publishing, Paris.
Dauth, C. and O. Toomet (2016), “On Government‐Subsidized Training Programs for Older Workers”,
Labour, No. 30.
EC (2017), “Effectiveness of tax incentives for venture capital and business angels to foster the
investment of SMEs and start-ups”, Final Report TAXUD/2015/DE/330,
https://ec.europa.eu/taxation_customs/sites/taxation/files/final_report_2017_taxud_venture-
capital_business-angels.pdf
EC (2017), “VAT rates applied in the Member States of the European Union-Situation at 1st January
2019”, European Commission,
https://ec.europa.eu/taxation_customs/sites/taxation/files/resources/documents/taxation/vat/how_vat_works/rate
s/vat_rates_en.pdf
EC (2018), “2030 Climate and Energy Framework”, European Commission,
https://ec.europa.eu/clima/policies/strategies/2030_en
EC (2018), “Education and Training Monitor 2018 Austria Report”, European Commission,
https://ec.europa.eu/education/sites/education/files/document-library-docs/et-monitor-report-2018-
austria_en.pdf
EC (2018), “The 2018 Ageing Report: Economic and Budgetary Projections for the EU Member States
(2016-2070)”, Economic and Financial Affairs, Institutional Paper 079, European Commission.
EC (2018), Country Report Austria 2018, Commission Staff Working Document, COM(2018) 120,
Brussels.
EC (2018), “Austria: Government Reform Plan for Minimum Income Scheme Causes Ongoing Debates”,
European Social Policy Network Flash Report No. 47, Brussels
https://ec.europa.eu/social/BlobServlet?docId=19975&langId=en.
EC (2019), Country Report Austria 2019, Commission Staff Working Document, COM(2019) 150,
Brussels.
EIB (2018), EIB Investment Report 2018/2019: Retooling Europe’s economy, European Investment

71
OECD ECONOMIC SURVEYS: AUSTRIA 2019 © OECD 2019
Bank.
EIGE (2018), Gender Equality Index 2017: Austria, European Institute for Gender Equality, Vilnius,
https://eige.europa.eu/publications/gender-equality-index-2017-austria
European Court of Auditors (2018), Special report no 08/2016: Rail freight transport in the EU: still not on
the right track, Luxembourg,
https://www.eca.europa.eu/Lists/ECADocuments/SR16_08/SR_RAIL_FREIGHT_EN.pdf
European Parliamentary Research Service (2018), Interim digital services tax on revenues from certain
digital services, European Union,
http://www.europarl.europa.eu/RegData/etudes/BRIE/2018/625132/EPRS_BRI(2018)625132_EN.pdf
Famira-Mühlberger, U., et al. (2017), “Austria 2025-Challenges and Macroeconomic Effects of Long-term
Care Provision”, WIFO Monatsberichte (monthly reports), WIFO, vol. 90(8), August.
Federal Chancellery (2017), National Reform Programme 2017, Vienna,
https://ec.europa.eu/info/sites/info/files/2017-european-semester-national-reform-programme-austria-
en.pdf
Federal Chancellery (2018), National Reform Programme 2018, Vienna,
https://ec.europa.eu/info/sites/info/files/2018-european-semester-national-reform-programme-country-
austria-en.pdf
Ferencz, J. (2019), “The OECD Digital Services Trade Restrictiveness Index”, OECD Trade Policy
Papers, No. 221, OECD Publishing, Paris.
Fessler, P. and M. Schuerz, (2015), “Private Wealth Across European Countries: The Role of Income,
Inheritance and the Welfare State”, ECB Working Paper, No. 1847.
Geng, N. (2018), “Fundamental Drivers of House Prices in Advanced Economies”, IMF Working Paper,
WP/18/164, IMF.
Geymüller, P. and M. Christl (2013), “The high cost of housing: How politics and tenancy law are
distorting the market, and three proposals for affordable housing”, Agenda Austria, Vienna,
https://www.agenda-austria.at/wp-content/uploads/2013/12/aa-study-1.pdf
Ghodsi, M. (2018), “Is Austria’s Economy Locked-in in the CESEE Region? Austria’s Competitiveness at
the Micro-level”, Research Report 151, The Vienna Institute for International Economic Studies.
Grossmann, S. (2017), “Growth projections for public spending on long-term care exceed agreed cost
containment targets”, FISKALRAT Staff Papers, Austrian Fiscal Advisory Council, Vienna,
https://www.fiskalrat.at/dam/jcr:bbf1733d-1254-4ac6-9a50-4f2caa4ad6e7/haftungen-uebersetzung-
kurzfassung_tcm164-257012.pdf
Guger, A. and S. Rocha-Akis (2016), “Redistribution by the State in Austria”, Wifo Bulletin, 21(11).
Hagemann, R. (2018), “Tax Policies for Inclusive Growth: Prescription versus Practice”, OECD Economic
Policy Papers, No. 24, OECD Publishing, Paris.
Hansson, A. G. (2018), “Combatting the housing shortage through institutional reform: The parallel cases
of Germany and Sweden”, ZFV- Zeitschrift fur Geodasie, Geoinformation und Landmanagement, 143.
Hanzl-Weiss, D., et al. (2018), “Is Austria‘s Economy Locked-in to the CESEE Region? A
Mesoeconomic Analysis”, Research Report 433, The Vienna Institute for International Economic
Studies.
Heimberger, P. (2018), “How Much Do Trading Partners Matter for Austria’s Competitiveness and Export
Performance?”, Research Report 435, The Vienna Institute for International Economic Studies.
Heissel, J., C. Persico, and D. Simon (2019),”Does PollutioN Drive Achievement? The Effect of Traffic
Pollution on Academic Performance”, NBER Working Paper, No. 25489.
Hofmarcher, M. (2014), “The Austrian health reform 2013 is promising but requires continuous political
ambition”, Health Policy, Vol. 118(1).
72
OECD ECONOMIC SURVEYS: AUSTRIA 2019 © OECD 2019
IFS (2017), “Redistribution, efficiency and the design of VAT: a review of the theory and literature”, IFS
Briefing Note BN212 (Abramovsky, L., D. Phillips and R. Warwick), The Institute for Fiscal Studies,
https://www.ifs.org.uk/uploads/publications/bns/BN212.pdf
IMF (2018), 2018 Article IV Consultation- Press Release; Staff Report; and Statement by the Executive
Director for Austria, Country Report No. 18/272, Washington, DC.
Institute for Government (2018), “The 2019 Spending Review How to Run it Well” (Wheatley, M., B.
Maddox and T. K. Bishop), London,
https://www.instituteforgovernment.org.uk/sites/default/files/publications/IfG_2019_%20spending_revi
ew_web.pdf
International Energy Agency (2017), Energy Technology Perspectives 2017, Paris.
ITF (2018), The Shared-Use City: Managing the Curb, International Transport Forum, https://www.itf-
oecd.org/sites/default/files/docs/shared-use-city-managing-curb_5.pdf
ITF (2018), Shared Mobility Simulations for Dublin, International Transport Forum, https://www.itf-
oecd.org/sites/default/files/docs/shared-mobility-simulations-dublin.pdf
Kakes, J., and R. Nijskens (2018), “Size of the banking sector: implications for financial stability”, DNB
Occasional Studies, Volume 16-6, De Nederlandsche Bank, Amsterdam.
Kettner-Marx, C., et al. (2018), “CATs - Carbon Taxes in Austria. Implementation Issues and Impacts”,
WIFO Studies, number 61185, WIFO
Köppl, A. and S. Stagl (2018), “A plea for a paradigm shift in financial decision-making in the age of
climate change and disruptive technologies”, SUERF Policy Note, Issue No 45.
Köppl, A. and M. Schratzenstaller (2015), “The Austrian Tax System-Reform Perspectives”, WIFO
Monatsberichte (monthly reports), 88 (2).
Leitner, S. (2018), “Factors Driving Wealth Inequality in European Countries”, The Vienna Institute for
International Economic Studies, Working Paper 155, Vienna.
Maples, A. and A. Sawyer (2017), “The New Zealand GST and its Global Impact: 30 Years On”, New
Zealand Journal of Taxation Law and Policy, Vol. 23.
Martin, J. P. (2017), “Policies to Expand Digital Skills for the Machine Age”, IZA Policy Paper, No. 123,
Institute of Labor Economics (IZA), Bonn.
Martin, J. (2018), “Skills for the 21st century: Findings and policy lessons from the OECD survey of adult
skills”, OECD Education Working Papers, No. 166, OECD Publishing, Paris.
Ministry of Finance (2016), Langfristige Budgetprognose, Bericht der Bundesregierung gemäß § 15 (2)
BHG 2013, Vienna, https://www.bmf.gv.at/budget/das-
budget/Langfr_Budgetprognose_Bericht_der_Bundesreg_April_2016.pdf?67run8
Moor, R. (2017), “Austrian Tourism Industry Needs Changes Despite Recent Successes”, Tourism
Review, https://www.tourism-review.com/austrian-tourism-is-outdated-news10300
Mundt, A. (2018), “Privileged but Challenged: The State of Social Housing in Austria in 2018”, Critical
Housing Analysis, Vol. 5(1).
Nell, P. C., J. Schmitt, V. Preveden and L. Hauska (2019), “Headquarters of the future: The impact of
digitalization on headquarters structures and value added”, Study Report 2019, Vienna University of
Economics and Business, http://epub.wu.ac.at/6787/1/Study_HQ_Digitalization_FINAL.pdf
Nusche, D., et al. (2016), “Governance of school resource use in Denmark”, in OECD Reviews of School
Resources: Denmark 2016, OECD Reviews of School Resources, OECD Publishing, Paris.
Nusche, D. et al. (2016), “OECD Reviews of School Resources: Austria 2016”, OECD Reviews of
School Resources, OECD Publishing, Paris.
OECD (2011), Starting Strong III: A Quality Toolbox for Early Childhood Education and Care, Starting
Strong, OECD Publishing, Paris.
73
OECD ECONOMIC SURVEYS: AUSTRIA 2019 © OECD 2019
OECD (2011), “Typology and Implementation of Spending Reviews”, OECD Discussion Paper, OECD
Publishing, Paris.
OECD (2012), “Phase One: Implementing the OECD Anti-Bribery Convention in Austria” Report of the
OECD Anti-Bribery Convention, OECD Publishing, Paris.
OECD (2012), “Phase 3 Report on Implementing the OECD Anti-Bribery Convention in Austria”, Report
of the OECD Anti-Bribery Convention, OECD Publishing, Paris.
OECD (2012), “The labour market integration of immigrants and their children in Austria”, in Jobs for
Immigrants (Vol. 3): Labour Market Integration in Austria, Norway and Switzerland, OECD Publishing,
Paris.
OECD (2013), Environmental Performance Review Austria. https://www.oecd-
ilibrary.org/environment/oecd-environmental-performance-reviews-austria-2013_9789264202924-en
OECD (2014), OECD Skills Strategy Diagnostic Report: Austria, OECD Publishing, Paris.
OECD (2014), “Taxation and tourism”, in OECD Tourism Trends and Policies 2014, OECD Publishing,
Paris.
OECD (2015), OECD Economic Surveys: Austria 2015, OECD Publishing, Paris.
OECD (2015), The Metropolitan Century: Understanding Urbanisation and its Consequences, OECD
Publishing, Paris, http://dx.doi.org/10.1787/9789264228733-en.
OECD (2016), Making Integration Work: Refugees and others in need of protection, Making Integration
Work, OECD Publishing, Paris.
OECD (2016), “Funding and governance of school education in Austria”, in OECD Reviews of School
Resources: Austria 2016, OECD Publishing, Paris.
OECD (2016), Extended Producer Responsibility: Updated Guidance for Efficient Waste Management,
OECD Publishing, Paris, https://dx.doi.org/10.1787/9789264256385-en
OECD (2017), Starting Strong V: Transitions from Early Childhood Education and Care to Primary
Education, Starting Strong, OECD Publishing, Paris.
OECD (2017), The Pursuit of Gender Equality: An Uphill Battle, OECD Publishing, Paris.
OECD (2017), Making Integration Work: Family Migrants, Making Integration Work, OECD Publishing,
Paris.
OECD (2017), “Phase 3 follow-up: Additional written report by Austria”, Working Group on Bribery in
International Business Transactions, Directorate for Financial and Enterprise Affairs, Paris 12-15
December 2017.
OECD (2017), Pensions at a Glance 2017: Country Profiles-Austria, Pensions at a Glance 2017: OECD
and G20 Indicators, OECD Publishing, Paris.
OECD (2017), OECD Economic Surveys: Austria 2017, OECD Publishing, Paris.
OECD (2017), OECD Economic Surveys: Iceland 2017, OECD Publishing, Paris.
OECD (2018), “Starting close, growing apart: Why the gender gap in labour income widens over the
working life”, in OECD Employment Outlook 2018, OECD Publishing, Paris.
OECD (2018), “Early Learning Matters”, The International Early Learning and Child Well-being Study,
OECD Publishing, Paris, http://www.oecd.org/education/school/Early-Learning-Matters-Project-
Brochure.pdf
OECD (2018), Good Jobs for All in a Changing World of Work: The OECD Jobs Strategy, OECD
Publishing, Paris.
OECD (2018), Working Together for Local Integration of Migrants and Refugees in Vienna, OECD
Publishing, Paris.
OECD (2018), The new OECD Jobs Strategy: Good jobs for all in a changing world of work, OECD

74
OECD ECONOMIC SURVEYS: AUSTRIA 2019 © OECD 2019
Publishing, Paris.
OECD (2018), Income Distribution and Poverty by Country,
https://stats.oecd.org/index.aspx?queryid=66670
OECD (2018), Rethinking Urban Sprawl: Moving Towards Sustainable Cities, OECD Publishing, Paris.
OECD (2018), OECD Tourism Trends and Policies 2018, OECD Publishing, Paris.
OECD (2018), OECD Best Practices for Performance Budgeting, OECD Publishing, Paris.
OECD (2018), OECD Reviews of Innovation Policy: Austria 2018, OECD Reviews of Innovation Policy,
OECD Publishing, Paris.
OECD (2018), Effective Carbon Rates 2018: Pricing Carbon Emissions Through Taxes and Emissions
Trading, OECD Publishing, Paris, https://dx.doi.org/10.1787/9789264305304-en.
OECD (2018), Taxing Energy Use 2018: Companion to the Taxing Energy Use Database, OECD
Publishing, Paris, https://dx.doi.org/10.1787/9789264289635-en.
OECD (2018), Consumption Tax Trends 2018: VAT/GST and Excise Rates, Trends and Policy Issues,
Consumption Tax Trends, OECD Publishing, Paris.
OECD (2019), Fertility rates, https://data.oecd.org/pop/fertility-rates.htm
OECD (2019), Ready to Help?: Improving Resilience of Integration Systems for Refugees and other
Vulnerable Migrants, OECD Publishing, Paris.
OECD (2019), Supporting Entrepreneurship and Innovation in Higher Education in Austria, forthcoming.
OECD (2019), Trends Shaping Education 2019, OECD Publishing, Paris.
OECD (2019), Making Decentralisation Work: A Handbook for Policy-Makers, OECD Multi-level
Governance Studies, OECD Publishing, Paris.
OECD (2019), “Inheritance Taxation in OECD Countries”, Note by the Secretariat for the Working Party
No. 2 on Tax Policy Analysis and Tax Statistics, Paris.
OECD (2019), “Addressing the Tax Challenges of the Digitalisation of the Economy – Policy Note”,
OECD/G20 Base Erosion and Profit Shifting Project.
OECD (2019), Indicators of Product Market Regulations, 2019 (forthcoming).
OECD/EU (2018), Settling In 2018: Indicators of Immigrant Integration, OECD Publishing, Paris/EU,
Brussels.
OeNB (2018), Facts on Austria and Its Banks (October 2018), Austrian National Bank, Vienna.
Peneder, M. (2010), “The impact of venture capital on innovation behaviour and firm growth”, Venture
Capital, Vol. 12(2).
Peneder, M., M. Firgo and G. Streicher (2019), “Stand der Digitalisierung in Österreich”, Austrian Institute
of Economic Research, Vienna,
https://www.wifo.ac.at/jart/prj3/wifo/resources/person_dokument/person_dokument.jart?publikationsid
=61654&mime_type=application/pdf
Pfister, A. (2018), “Migration: A Win-Win Situation?”, 45th Economics Conference: Economic and
Monetary Union (EMU)-Deepening and Convergence, Austrian National Bank, Vienna.
Pham-Dao, L. (2016), “Public Insurance and Wealth Inequality - A Euro Area Analysis”, Annual
Conference 2016 (Augsburg): Demographic Change 145942, Verein für Socialpolitik / German
Economic Association.
Roy, R. and N. Braathen (2017), “The Rising Cost of Ambient Air Pollution thus far in the 21st
Century: Results from the BRIICS and the OECD Countries”, OECD Environment Working Papers,
No. 124, OECD Publishing, Paris, https://dx.doi.org/10.1787/d1b2b844-en.
Sandbu, M. (2019), “Swiss solutions to wealth tax conundrums”, Financial Times (February)
https://www.ft.com/content/01e3e348-2ebc-11e9-ba00-0251022932c8

75
OECD ECONOMIC SURVEYS: AUSTRIA 2019 © OECD 2019
Schneider, M. (2019), “Housing supply and demand in Austria”, forthcoming in Monetary Policy and the
Economy, Austrian National Bank, Vienna.
Shuey, E., et al. (2019), “Curriculum alignment and progression between early childhood education and
care and primary school: A brief review and case studies”, OECD Education Working Papers, No.
193, OECD Publishing, Paris.
Smidt, W. (2018), “Early childhood education and care in Austria: challenges and education policies”,
Early Child Development and Care, 188:5.
Sorbe, S., et al. (2019), “Digital Dividend: Policies to Harness the Productivity Potential of Digital
Technologies”, OECD Economic Policy Papers, No. 26, OECD Publishing, Paris.
Stiglitz, J., J. Fitoussi and M. Durand (eds.) (2018), For Good Measure: Advancing Research on Well-
being Metrics Beyond GDP, OECD Publishing, Paris.
World Inequality Database (2018), Income inequality, Austria, 1987-2016,
https://wid.world/country/austria/
Zu, Y. (2017), “Reforming VAT Concessions: A Tax Expenditure Analysis”, British Tax Review, Vol. 4.

76
OECD ECONOMIC SURVEYS: AUSTRIA 2019 © OECD 2019
Notes
1. These changes, approved by the Austrian Parliament, mean that the level of child benefits will now
be calculated according to living costs in the child’s living place and not those in Austria. The European
Commission questioned the legality of this reform against EU law. The Austrian government admitted that
it could be blocked by the European Court of Justice.
2. The Financial Market Stability Board recommended in 2018 that i) down payments for real estate
credits should amount to at least 20% of the face value of loans, ii) the maturity of mortgage loans should
be capped at 35 years, iii) debt service costs should not exceed 40% of the net income of borrowers, and
iv) the creditworthiness of borrowers should be evaluated by using all available data sources.
3. Less than 20% of households in Vienna and less than 50% of households in Austria own a house,
against the OECD average of 60%.
4. OECD calculations suggest that the structural unemployment rate (NAIRU) increased from above
4% to around 5½ per cent between 2000 and 2018, while, after an initial increase, it tended to decline in
comparable countries.
5. OECD, Supporting Entrepreneurship and Innovation in Higher Education in Austria, 2019
(forthcoming).
6. Public support to long-term care is currently provided through three channels: i) cash benefits
(proportional to the degree of dependence of beneficiaries on a scale of seven and ranging from monthly
EUR 158 to EUR 1 689); ii) support to primary caregivers (to ease their part-time working and leave
arrangements), and iii) in-kind services in care institutions. The first two components are provided by the
Federal government and the third is under the responsibility of Länder governments. As dependant elderly
prefer generally to stay in a private environment, the lion’s share of public aid is provided through cash-
allowances. This, however, risks perpetuating the labour force participation difficulties of primary
caregivers. Länder governments are now providing new in-kind, notably mobile, services to support the
primary caregivers. A masterplan on long-term care was adopted in December 2018, and the former
government commissioned a study to the Institute for Advanced Studies (IHS) on alternative financing
arrangements.
7. Mixed responsibilities are typical for many policy areas: 1) in health, responsibility is shared
between the federal government, the provincial governments, and local governments; 2) in housing, the
provincial and local governments make the decisions; 3) in education, responsibilities are split. The local
governments share responsibility with the provincial governments with regard to preschool and primary
education; the responsibility for secondary education lies with the provincial governments and the federal
government; post-secondary and tertiary education is the sole responsibility of the federal government.
8. Source: Main Association of Austrian Social Security Institutions.
9. Die Österreichische Sozialversicherung in Zahlen, March 2019.
10. The results presented in Panel B utilised micro-level data on Austrian firms from the Orbis
database. While the coverage of Austrian firms in Orbis may differ from a representative sample of the
Austrian firm universe, it is the only firm-level database currently available for listed and non-listed Austrian
firms. In this respect, the ongoing discussion about changes to the Statistikgesetz to make Austrian micro-

77
OECD ECONOMIC SURVEYS: AUSTRIA 2019 © OECD 2019
level data similar accessible to external researchers like in Germany, Denmark or Netherlands may help
improve the accessibility and availability of Austrian firm-level data.
11. High-speed broadband secures the transmission of 30 to 100 megabits of data per second, ultra-
high speed infrastructures transfer at least 100 megabits per second via direct fibre optic connections to
buildings and homes.
12. The system of transfers includes unconditional block grants, earmarked grants and ad hoc
transfers. There are also cost compensations for the tasks delegated from the Federal government to the
Länder, and from the Länder to the municipalities. An Intergovernmental Fiscal Relations Act governs
these relations. It is renewed every four to six years. The latest Act was adopted in 2017 for the period
2017-2021.
13. In Germany, like in Austria, the training of preschool teachers has traditionally been located in
upper-secondary vocational schools. Since 2004 however, more than 100 ECEC study courses opened in
the universities of applied sciences, pedagogical universities and classical universities across the country,
and are now training pre-school educators.
14. The information contained herein does not prejudice the Working Group’s monitoring of the
implementation of the OECD Anti-Bribery Convention.
15. In addition to the standard 20% VAT rate, there are three reduced rates of respectively 13%
(applying to hotel accommodations, cultural and sport events, domestic flights and some agricultural
supplies); 10% (applicable notably to foodstuffs, restaurants, pharmaceutical products, printed books and
other agricultural supplies; and a zero rate applied to international air transportation.