odisha hmis analysis report - nrhmorissa.gov.in · apr – oct 2013 3 odisha hmis analysis report...
TRANSCRIPT
Apr – Oct 2013
1 Odisha HMIS Analysis Report 2013
2013
Report on Districts Performance for Service delivery, Health Facilities Performance and Access to HealthCare
DHIS2 ODISHA HMIS ANALYSIS REPORT

Apr – Oct 2013
2 Odisha HMIS Analysis Report 2013
TABLE OF CONTENTS
Introduction ................................................................................................................................................................. 3
Conceptual Framework .............................................................................................................................................. 4
Methodology ............................................................................................................................................................... 7
Indicators ..................................................................................................................................................................... 8
Key Findings ............................................................................................................................................................... 11
Key Flags ..................................................................................................................................................................... 12
Service Delivery Perfomance .................................................................................................................................. 14
Scoring of Districts for Service Delivery (16 Key Indicators) ................................................................... 34
Ranking of Districts for Service Delivery (16 key indicators) ................................................................... 35
GIS visualisation of ranking of districts of odisha .................................................................................... 36
Health Facilities Perfomance .................................................................................................................................. 37
Sub-Centres (SC) ...................................................................................................................................... 37
Primary Health Centres (PHC) ................................................................................................................. 38
Community Health Centres (CHC) ........................................................................................................... 40
Scoring of Districts for Health Facilities Performance ............................................................................. 42
Ranking of Districts for Health Facilities Performance ............................................................................ 43
GIS Visualisation for Health Facilities Performance ................................................................................ 44
Access to Health Care ............................................................................................................................................... 48
Scoring of Districts for Access to Health Care ......................................................................................... 49
Ranking of Districts for Access to Health Care ........................................................................................ 50
GIS Visualisation For Access to Health Care ............................................................................................ 51
Overall Scoring For Districts .................................................................................................................................... 52
Overall Ranking For Districts ................................................................................................................................... 53
GIS Visualization For Overall Ranking .................................................................................................................... 54
Discussion .................................................................................................................................................................. 55
Recommended Action .............................................................................................................................................. 57

Apr – Oct 2013
3 Odisha HMIS Analysis Report 2013
INTRODUCTION
The state Odisha has made rapid and significant improvements in their HMIS, including strengthening the extent and quality of data coverage. This report firstly seeks to summarize key findings and key flags for service delivery performance, and also identify key areas for further strengthening. It provides information for strengthening evidence based decision making, and supporting practical action based on the information. The state has a database of all facility wise data, which allows analyzing for more detailed information and drilling down to health facilities. This report is a step in this direction of strengthening and institutionalizing analysis and feedback processes among the districts of Odisha. It has three main sections namely service delivery performance, health facilities performance and access to health care among the districts of Odisha.
Service delivery performance looks into continuum of care across life stages from pregnancy care, child birth, PNC & Newborn care and Reproductive age group and in specific district wise percentage of service delivery compared with state’s average for scoring and ranking of districts based on the performance. Districts are looked for institutional deliveries also home deliveries by trained birth attendants, timely antenatal services etc and drilled down to health facility level (CHC, PHC, SC) wherever needed.
The report aims at more intensive utilization of existing rural health infrastructure and seeks to identify the facilities which are not provided services based on reported facility wise data from Apr to Oct 2013 for each district of Odisha. The number of SCs, PHCs and CHCs which are not provided ANC, delivery, PNC, Newborn, Child Immunisation and FP services district wise for Odisha are listed and scored.
To identify gaps and dropouts among the districts of Odisha and a step forward to overcome social or geographical barriers to access, the report has assessed the districts health care access based on 7 key indicators which are referred from HMIS resource person’s manual. The identified districts needs intervention for improving access to health care and the state can act upon so as to deliver full package of services to these areas which is much needed.
The service delivery performance of districts is assessed based on 16 Key indicators from HMIS based dashboard monitoring system. The health facilities performance is scored based on 41 indicators to identify the % of facilities not providing services like ANC, delivery, PNC, Newborn etc for SCs, PHCs and CHs for all districts of Odisha. The districts are scored for access to health care based on 7 key indicators. Each section has scored and ranking of districts has done based on Z-score.
Apr – Oct 2013
4 Odisha HMIS Analysis Report 2013
CONCEPTUAL FRAMEWORK
ANALYSIS REQUIREMENTS FROM STATE
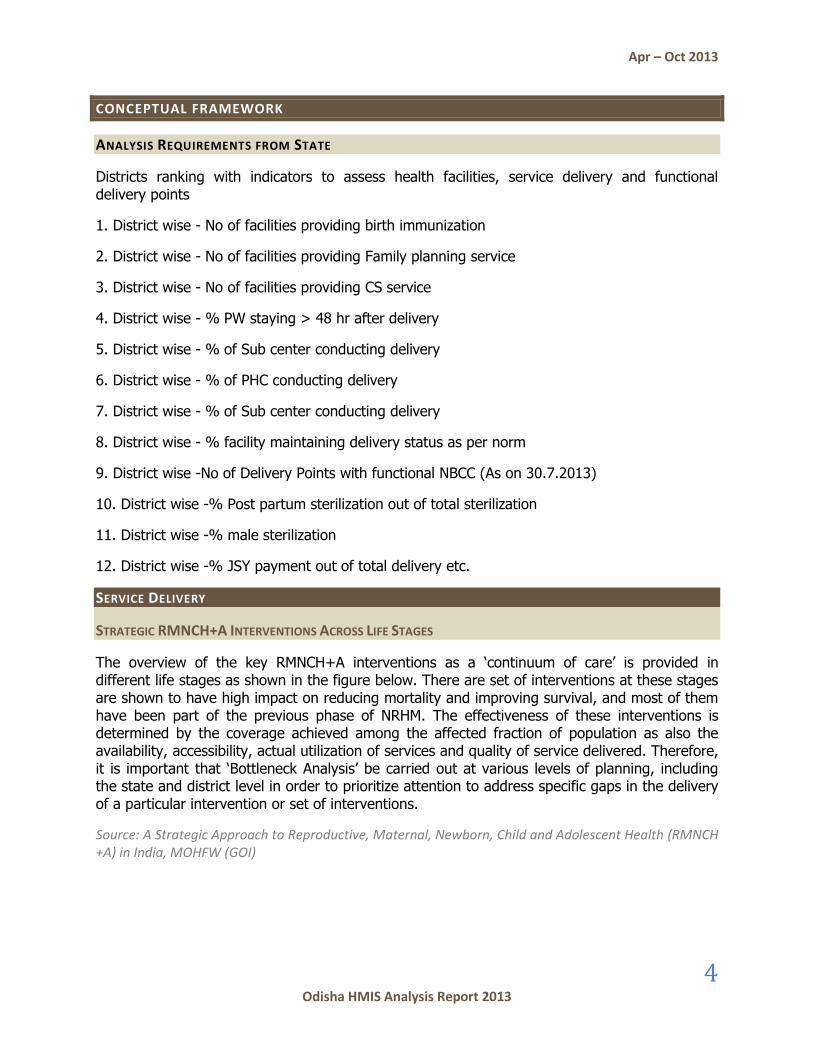
Districts ranking with indicators to assess health facilities, service delivery and functional delivery points
1. District wise - No of facilities providing birth immunization
2. District wise - No of facilities providing Family planning service
3. District wise - No of facilities providing CS service
4. District wise - % PW staying > 48 hr after delivery
5. District wise - % of Sub center conducting delivery
6. District wise - % of PHC conducting delivery
7. District wise - % of Sub center conducting delivery
8. District wise - % facility maintaining delivery status as per norm
9. District wise -No of Delivery Points with functional NBCC (As on 30.7.2013)
10. District wise -% Post partum sterilization out of total sterilization
11. District wise -% male sterilization
12. District wise -% JSY payment out of total delivery etc.
SERVICE DELIVERY
STRATEGIC RMNCH+A INTERVENTIONS ACROSS LIFE STAGES
The overview of the key RMNCH+A interventions as a ‘continuum of care’ is provided in different life stages as shown in the figure below. There are set of interventions at these stages are shown to have high impact on reducing mortality and improving survival, and most of them have been part of the previous phase of NRHM. The effectiveness of these interventions is determined by the coverage achieved among the affected fraction of population as also the availability, accessibility, actual utilization of services and quality of service delivered. Therefore, it is important that ‘Bottleneck Analysis’ be carried out at various levels of planning, including the state and district level in order to prioritize attention to address specific gaps in the delivery of a particular intervention or set of interventions.
Source: A Strategic Approach to Reproductive, Maternal, Newborn, Child and Adolescent Health (RMNCH +A) in India, MOHFW (GOI)
Apr – Oct 2013
5 Odisha HMIS Analysis Report 2013
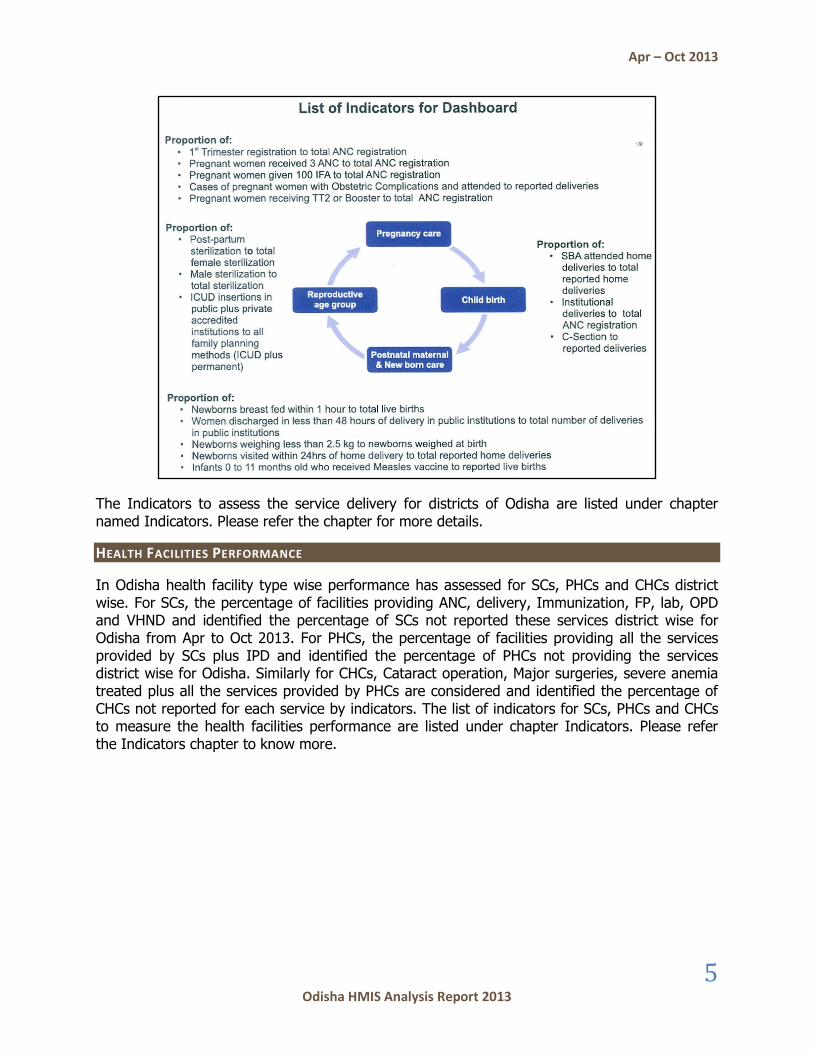
The Indicators to assess the service delivery for districts of Odisha are listed under chapter named Indicators. Please refer the chapter for more details.
HEALTH FACILITIES PERFORMANCE
In Odisha health facility type wise performance has assessed for SCs, PHCs and CHCs district wise. For SCs, the percentage of facilities providing ANC, delivery, Immunization, FP, lab, OPD and VHND and identified the percentage of SCs not reported these services district wise for Odisha from Apr to Oct 2013. For PHCs, the percentage of facilities providing all the services provided by SCs plus IPD and identified the percentage of PHCs not providing the services district wise for Odisha. Similarly for CHCs, Cataract operation, Major surgeries, severe anemia treated plus all the services provided by PHCs are considered and identified the percentage of CHCs not reported for each service by indicators. The list of indicators for SCs, PHCs and CHCs to measure the health facilities performance are listed under chapter Indicators. Please refer the Indicators chapter to know more.
Apr – Oct 2013
6 Odisha HMIS Analysis Report 2013
Facilities not reported for providing services can be any of the following
1. Beneficiaries/ Patients (no case during the month)
2. Infrastructure (facilities/amenities not available or not working condition)
3. Human Resources (Health provider/ MO not available/ Lack of staff)
4. Inadequate training
ACCESS TO HEALTH CARE
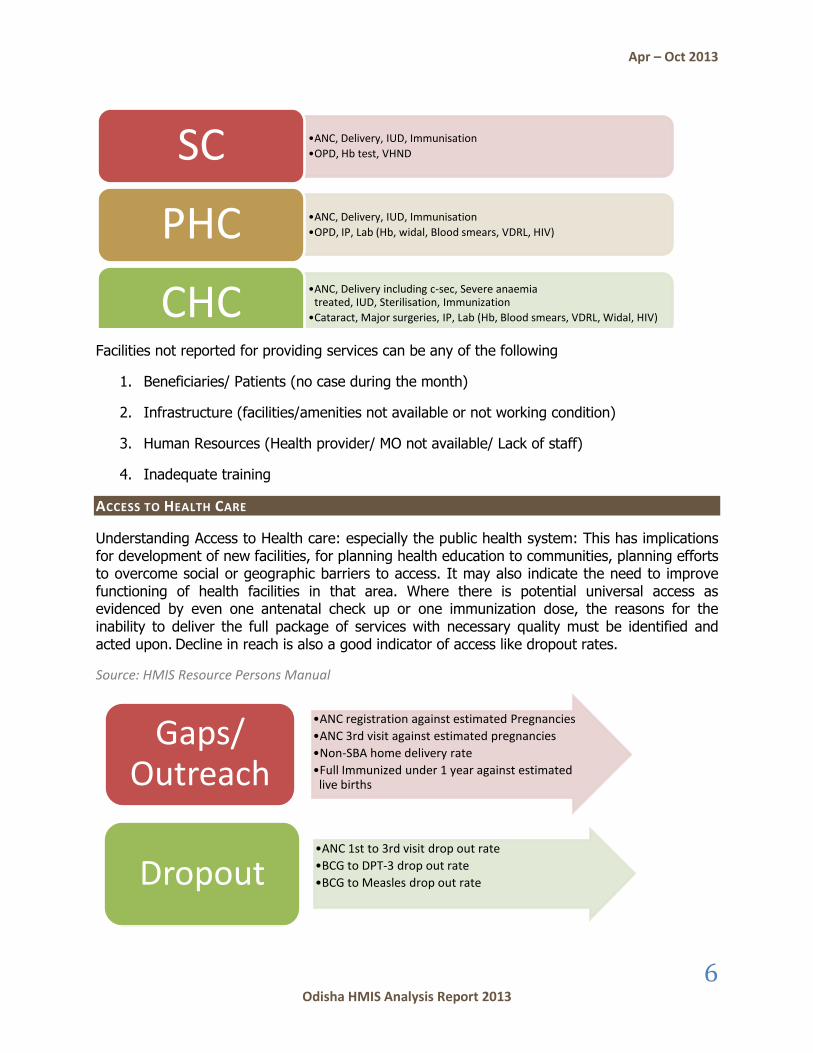
Understanding Access to Health care: especially the public health system: This has implications for development of new facilities, for planning health education to communities, planning efforts to overcome social or geographic barriers to access. It may also indicate the need to improve functioning of health facilities in that area. Where there is potential universal access as evidenced by even one antenatal check up or one immunization dose, the reasons for the inability to deliver the full package of services with necessary quality must be identified and acted upon. Decline in reach is also a good indicator of access like dropout rates.
Source: HMIS Resource Persons Manual
•ANC, Delivery, IUD, Immunisation
•OPD, Hb test, VHNDSC
•ANC, Delivery, IUD, Immunisation
•OPD, IP, Lab (Hb, widal, Blood smears, VDRL, HIV)PHC•ANC, Delivery including c-sec, Severe anaemia
treated, IUD, Sterilisation, Immunization
•Cataract, Major surgeries, IP, Lab (Hb, Blood smears, VDRL, Widal, HIV)CHC
•ANC registration against estimated Pregnancies
•ANC 3rd visit against estimated pregnancies
•Non-SBA home delivery rate
•Full Immunized under 1 year against estimated live births
Gaps/ Outreach
•ANC 1st to 3rd visit drop out rate
•BCG to DPT-3 drop out rate
•BCG to Measles drop out rateDropout

Apr – Oct 2013
7 Odisha HMIS Analysis Report 2013
METHODOLOGY
HMIS BASED DASHBOARD MONITORING SYSTEM
Score card for 16 Indicators to assess service delivery based on life cycle approach.
Source: A Strategic Approach to Reproductive, Maternal, Newborn, Child and Adolescent Health (RMNCH +A) in India, MOHFW (GOI)
Odisha state’s average for each indicator for each district is taken as the reference point.
Districts score is determined based on the state’s average.
All the indicator scores for each district will be consolidated as district score.
All indicators have the same weightage.
Districts have been classified into four categories based on the indicator scores (based on four quartiles).
Positive scores from 1 to 4 for those above the State’s average (for positive indicators) and for those below the State’s average (for negative indicators).
Negative scores -1 to -4 for those below State’s average (for positive indicators) and for those above State’s average (for negative indicators).
Each district has to be looked for aggregated score for each indicator group.
Z-score is calculated from the total score for each district.
Based on the Z-score, each district will have rank from 30 to 1.
As a result, districts ranking for service delivery, health facilities performance and health care access are calculated for each domain. Also overall scoring and ranking of districts based on 16 indicators for service delivery, 41 indicators for health facilities performance and 7 indicators for health care access.
Data source: DHIS2 NRHM Odisha
Period of Analysis: Apr to Oct 2013
Tools used: DHIS2 (Data Analyser, Data Visualizer, Pivot table, GIS) Version 2.12

Apr – Oct 2013
8 Odisha HMIS Analysis Report 2013
INDICATORS & SCORING
Domains Indicators Max Score Min Score
Service Delivery 16 +4 -4
Health Facilities Performance 41 +4 -4
SCs 8
PHCs 15
CHCs 18
Health Care Access 7 +4 -4
Total 64
INDICATORS
TO ASSESS SERVICE DELIVERY
16 KEY INDICATORS TO ASSESS SERVICE DELIVERY
A PREGNANCY CARE C POSTNATAL MATERNAL & NEWBORN CARE
1 ANC Registration in 1st Trimester Rate 9 % Women Discharged under 48 hours Rate
2 ANC 3rd Visit Coverage Rate 10 % Home Delivery Newborn Visit Rate
3 ANC 100 IFA Coverage Rate 11 % Newborn Weight Less than 2500 gms
4 ANC TT2/ Booster Coverage Rate 12 % Newborn Breastfed within 1 hour Rate
5 Complicated Pregnancies Attended Rate 13 % Full Immunized under 1 year against live birth
B CHILD BIRTH D REPRODUCTIVE AGE GROUP
6 % SBA Delivery to Total Home Delivery 14 % Post-partum Sterilization to Total Female Sterilization
7 % Institutional Delivery to Total ANC Registration
15 % Male Sterilization to Total Sterilization
8 % Caesarean section to Total Institutional Deliveries
16 % IUCD against Total FP (Sterilization + IUCD)
Source: A Strategic Approach to Reproductive, Maternal, Newborn, Child and Adolescent Health (RMNCH +A) in India, MOHFW (GOI)

Apr – Oct 2013
9 Odisha HMIS Analysis Report 2013
TO ASSESS HEALTH FACILITIES PERFORMANCE
8 KEY INDICATORS TO ASSESS HEALTH FACILITY PERFOMANCE (SC)
A ANTENATAL NATAL CARE (ANC) E LAB
1 % Sub-Centres not reported ANC Registration
6 % Sub-Centres not reported Hb tested
2 % Sub-Centres not reported ANC Hypertension new case
F OPD
B DELIVERY 7 % Sub-Centres not reported OPD attendance
3 % Sub-Centres not conducting deliveries G VHND
C IMMUNIZATION 8 % Sub-Centres not reported VHND
4 % Sub-Centres not reported DPT-3 dose given under 1 year
D FAMILY PLANNING
5 % Sub-Centres not reported IUD insertion
15 KEY INDICATORS TO ASSESS HEALTH FACILITY PERFOMANCE (PHC)
A ANTENATAL NATAL CARE (ANC) E LAB
1 % PHCs not reported ANC Registration 9 % PHCs not reported Hb tested
2 % PHCs not reported ANC Hypertension new case
10 % PHCs not reported blood smears examined
B DELIVERY 11 % PHCs not reported widal tests conducted
3 % PHCs not conducting deliveries 12 % PHCs not reported VDRL tests conducted
4 % PHCs not attended complicated pregnancies
13 % PHCs not reported HIV tests conducted
C IMMUNIZATION F OPD
5 % PHCs not reported DPT-3 dose given under 1 year
14 % PHCs not reported OPD attendance
6 % PHCs not reported live births weighing G IP
D FAMILY PLANNING 15 % PHCs not reported IP admissions
7 % PHCs not reported IUD insertion
8 % PHCs not reported sterilization
Apr – Oct 2013
10 Odisha HMIS Analysis Report 2013
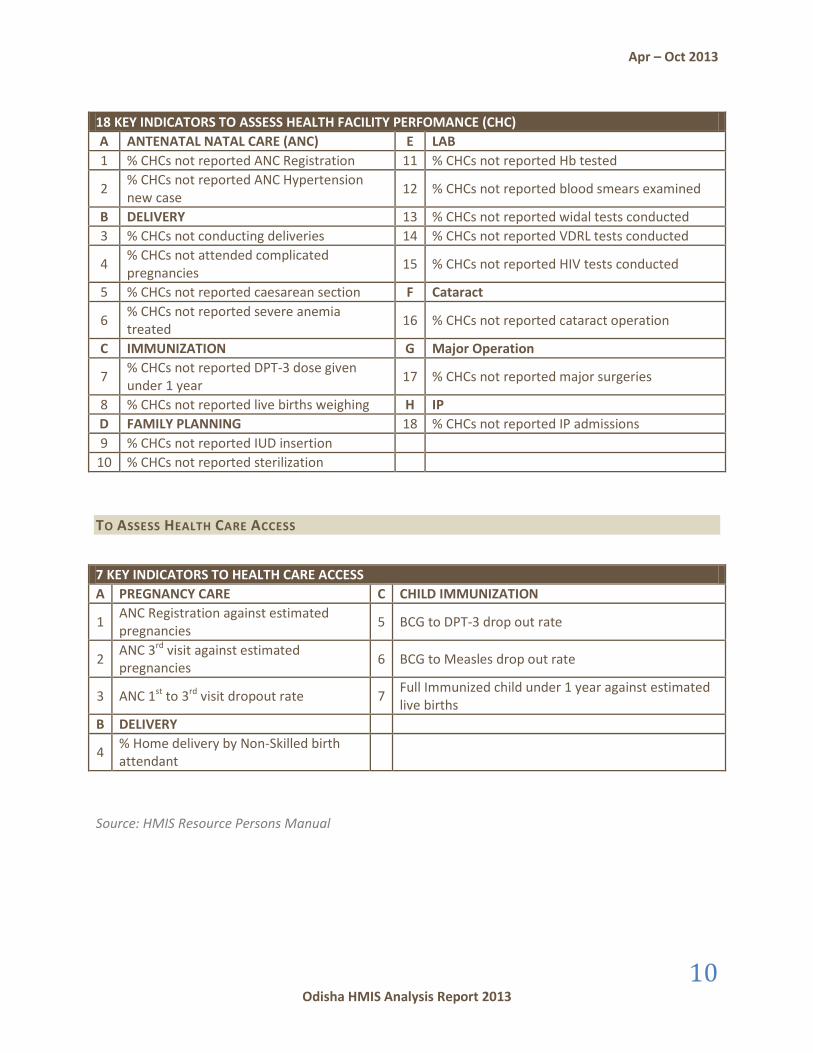
18 KEY INDICATORS TO ASSESS HEALTH FACILITY PERFOMANCE (CHC)
A ANTENATAL NATAL CARE (ANC) E LAB
1 % CHCs not reported ANC Registration 11 % CHCs not reported Hb tested
2 % CHCs not reported ANC Hypertension new case
12 % CHCs not reported blood smears examined
B DELIVERY 13 % CHCs not reported widal tests conducted
3 % CHCs not conducting deliveries 14 % CHCs not reported VDRL tests conducted
4 % CHCs not attended complicated pregnancies
15 % CHCs not reported HIV tests conducted
5 % CHCs not reported caesarean section F Cataract
6 % CHCs not reported severe anemia treated
16 % CHCs not reported cataract operation
C IMMUNIZATION G Major Operation
7 % CHCs not reported DPT-3 dose given under 1 year
17 % CHCs not reported major surgeries
8 % CHCs not reported live births weighing H IP
D FAMILY PLANNING 18 % CHCs not reported IP admissions
9 % CHCs not reported IUD insertion
10 % CHCs not reported sterilization
TO ASSESS HEALTH CARE ACCESS
7 KEY INDICATORS TO HEALTH CARE ACCESS
A PREGNANCY CARE C CHILD IMMUNIZATION
1 ANC Registration against estimated pregnancies
5 BCG to DPT-3 drop out rate
2 ANC 3rd visit against estimated pregnancies
6 BCG to Measles drop out rate
3 ANC 1st to 3rd visit dropout rate 7 Full Immunized child under 1 year against estimated live births
B DELIVERY
4 % Home delivery by Non-Skilled birth attendant
Source: HMIS Resource Persons Manual

Apr – Oct 2013
11 Odisha HMIS Analysis Report 2013
KEY FINDINGS
ANTE-NATAL CARE SERVICES
The Percentage of women registered for Ante-Natal Care services is 84% for Odisha.
The percentage of pregnant women registered within 1st trimester for Odisha is 51%.
The percentage of pregnant women received 100 IFA tablets for Odisha is 76% against reported ANC registrations and 64% against estimated pregnancies.
Boudh, Sonapur, Khordha and Cuttack districts are showing very less % for ANC coverage services.
Boudh, Sonapur, Cuttack and Khordha districts show 58, 65, 70, 71 % respectively for ANC registration against estimated pregnancies. This shows high pregnancies missed out in these districts.
Boudh, Khordha, Sonapur and Cuttack districts show 52, 56, 62 and 64 % respectively for ANC third visit coverage rate from Apr to Oct 2013.
The percentage of pregnant women received 3 ANC is estimated as 74 for Odisha.
The percentage of pregnant women received ANC TT2/ Booster dose is estimated as 77 for Odisha.
Boudh and Sonapur districts show 37% and 40% for ANC 100 IFA coverage rate against estimated pregnancies.
10% of all deliveries are reported as complicated pregnancies in Odisha.
DELIVERY CARE
10% of home deliveries are reported as delivery conducted by Skilled Birth Attendants (SBA)
10% of Institutional deliveries are reported as caesarean section in Odisha.
The percentage of institutional deliveries against total ANC registration for Odisha is 77.
The percentage of deliveries discharged less than 48 hrs for Odisha is 63.
In Sambalpur district, only 13% of deliveries are discharged within 48 hrs and it shows good practice.
POST-NATAL CARE & NEWBORN CARE
The percentage of newborns breastfed within 1 hr rate for Odisha is 94%.

Apr – Oct 2013
12 Odisha HMIS Analysis Report 2013
Kendrapara district shows 72% for Newborns breastfed within 1 hr rate and this is
because Kendrapara DHH shows very less percentage. This may be either reporting issues or actual less % are breastfed.
70% of home deliveries are reported to have newborn visited within 24 hours for Odisha.
The percentage of babies weighed less than 2.5 kgs for Odisha is 17.
The Percentage of full immunized child under 1 year against estimated live births for Odisha is 80.
FAMILY PLANNING SERVICES
The Percentage of Post-partum sterilization against total female sterilization is 11 for Odisha.
2% of total sterilization is conducted on males for Odisha.
The percentage of IUCD against all FP methods including permanent plus IUCD for Odisha is 64.
KEY FLAGS
ANTE-NATAL CARE SERVICES
Nearly 16% of pregnant women are estimated to not have availed Ante-Natal Care services in Odisha.
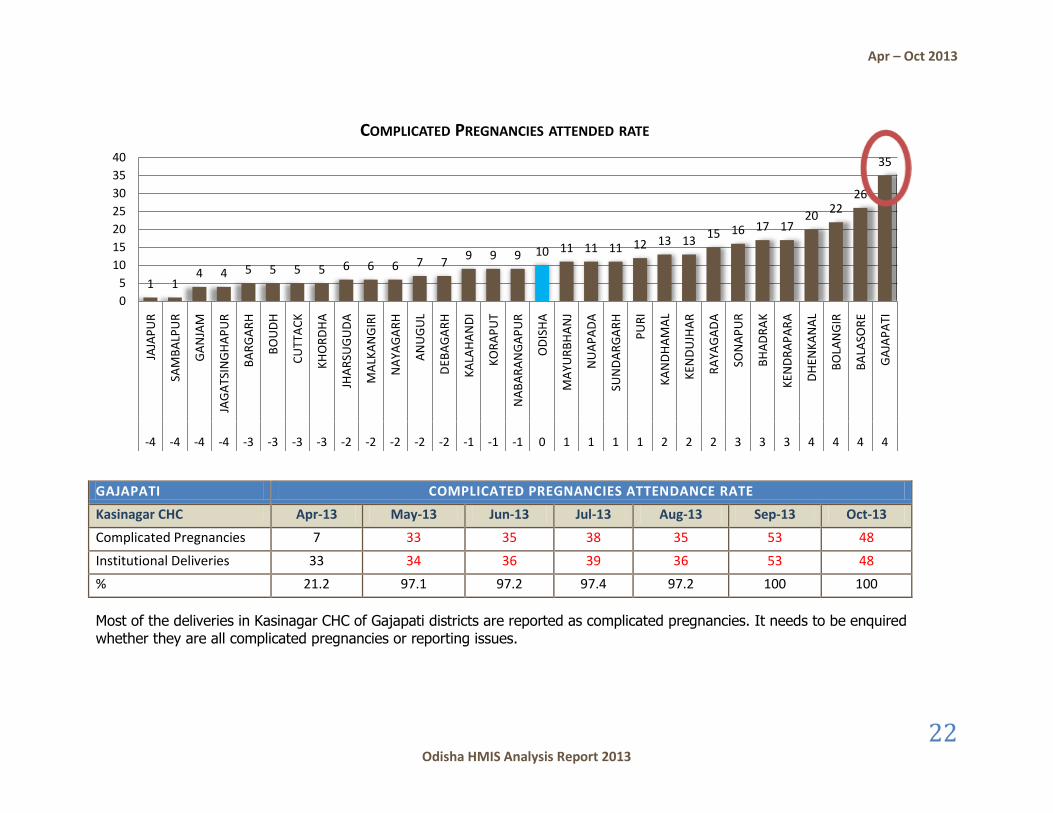
Most of the deliveries in Kasinagar CHC of Gajapati districts are reported as complicated pregnancies. It needs to be enquired whether they are all complicated pregnancies or reporting issues.
VSSMC Burla of Sambalpur districts has not reported any complicated pregnancies attended from Apr to Oct 2013.
DELIVERY CARE
Jajapur, Kendujhar, Mayurbhanj, Nabarangapur and Sambalpur districts shows less % for SBA delivery to total home delivery.
Gajapati district shows 52% institutional deliveries against total ANC registered and when we refer ANC registration against estimated pregnancies, it shows 104 % and it implies that there is more % of unreported deliveries in Gajapati.
Apr – Oct 2013
13 Odisha HMIS Analysis Report 2013
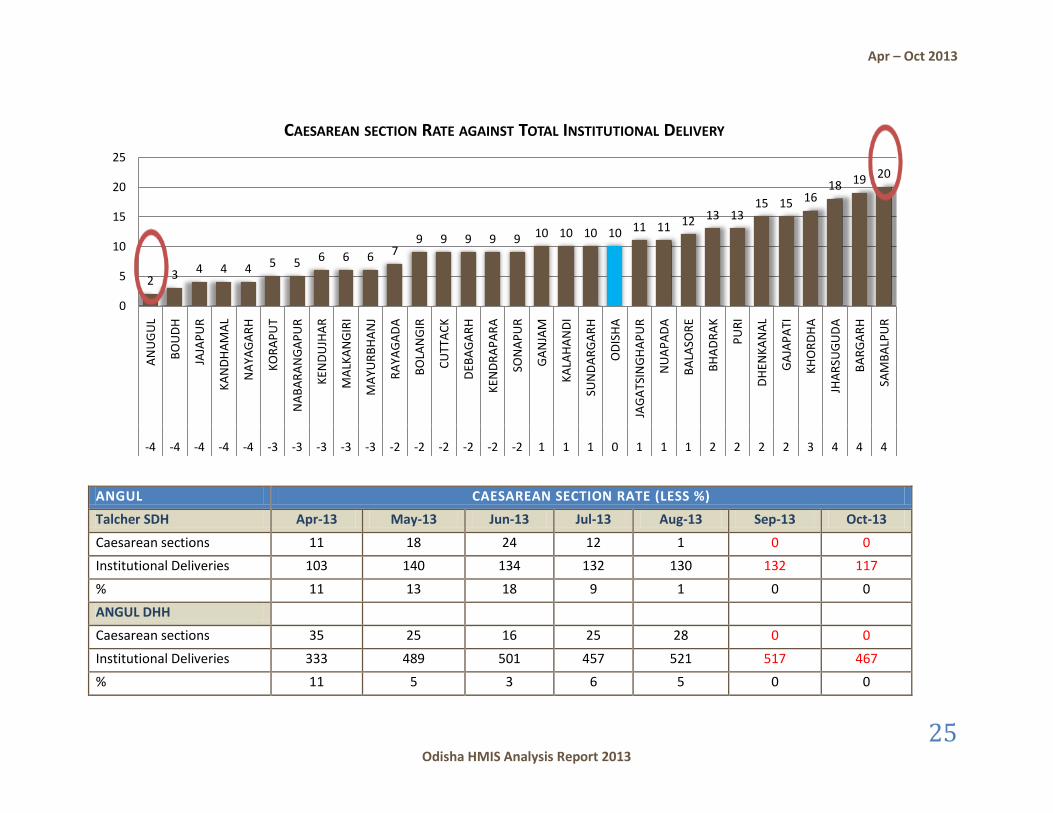
Angul district shows only 2% for caesarean section delivery rate and the state’s average is 10%.
Sambalpur district shows 20% for caesarean section delivery rate and state’s average is only 10%.
92% of institutional deliveries are discharged under 48 hrs of delivery in Boudh district.
POST-NATAL CARE & NEWBORN CARE
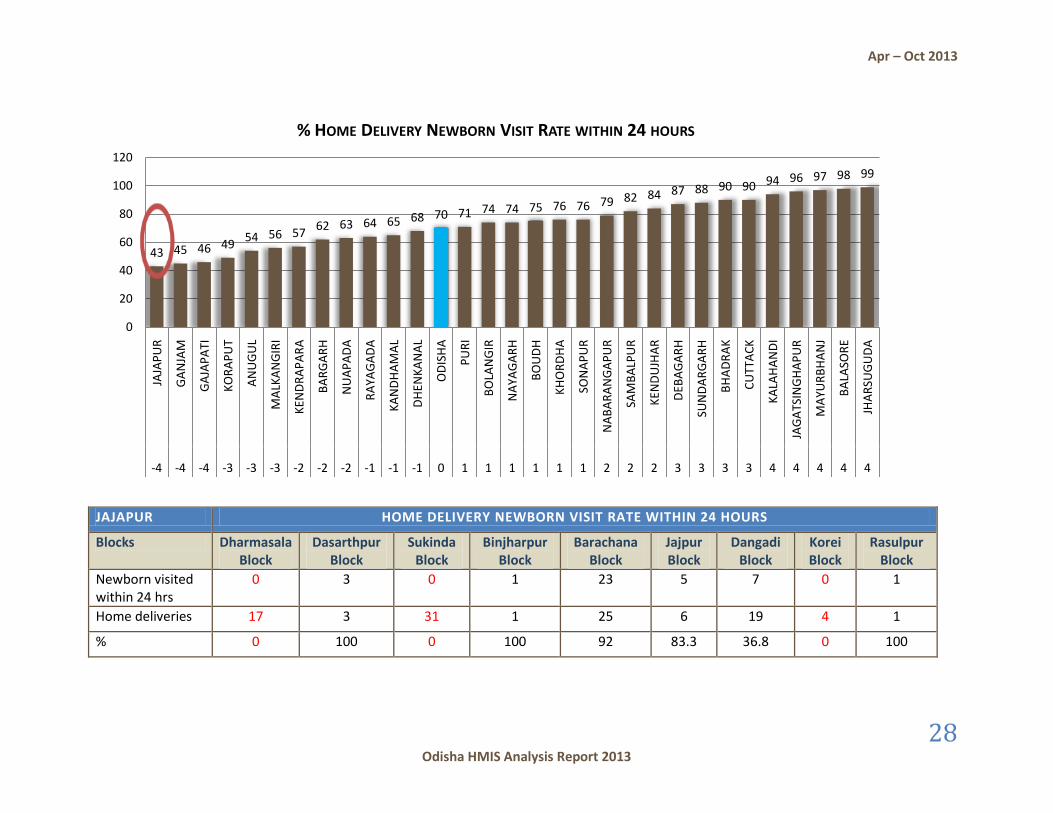
30% of Home deliveries in Odisha have not reported to have newborn visited within 24 hours of delivery.
Jajapur district shows only 43% of home deliveries where newborn visited within 24 hours. Blocks of Jajapur districts shows very less percentage for home delivery newborn visited within 24 hrs rates.
Khandamal district shows 26% for low birth weight babies (less than 2.5 kgs) and SCs of Daringibadi Block has reported more LBW babies and this may be due to reporting issues.
Boudh, Sonapur, Koraput, Khordha and Cuttack districts shows 63, 67, 70, 71 and 72 % respectively for full immunized child less than 1 year against estimated live births.
FAMILY PLANNING SERVICES
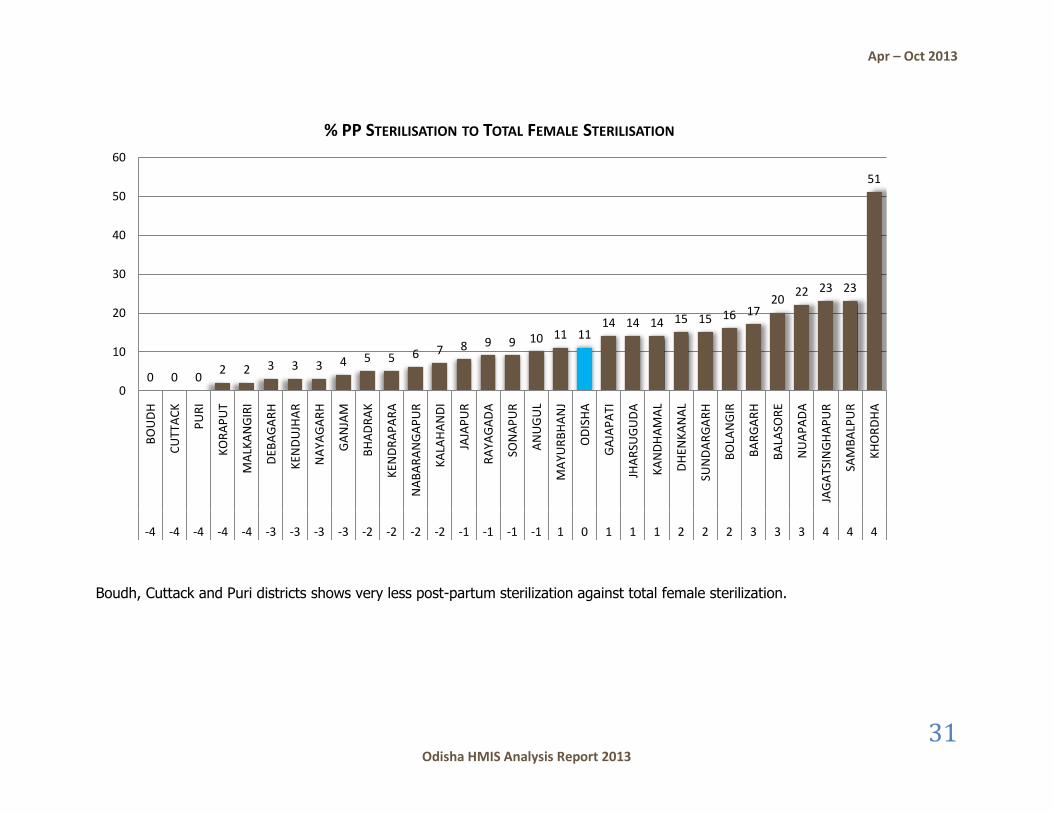
Boudh, Cuttack and Puri districts shows very less post-partum sterilization against total female sterilization.
18 districts showing less than 1% for Male sterilization against total sterilization.
Malkangiri, Gajapati, Sonapur and Rayagada districts show only 41, 44, 45 and 49% respectively for IUCD against total FP methods including permanent plus IUCD.

Apr – Oct 2013
14 Odisha HMIS Analysis Report 2013
SERVICE DELIVERY PERFOMANCE
The State shows 51% for ANC registration within 1st trimester rate for 2013. Sonapur, Debagarh, Jharsuguda and Ganjam districts show 19, 28, 28 and 30 and when we drill down to Sonapur districts, Dunguripalli Block shows very less % for ANC registration in 1st trimester rate.
1928 28 30 34 34 35 35 35
42 42 43 45 48 50 51 51 52 53 53 54 56 58 60 62 63 64 66
77 8186
0102030405060708090
100
SON
AP
UR
DEB
AG
AR
H
JHA
RSU
GU
DA
GA
NJA
M
BO
UD
H
KO
RA
PU
T
DH
ENK
AN
AL
JAG
ATS
ING
HA
PU
R
NA
BA
RA
NG
AP
UR
BO
LAN
GIR
RA
YAG
AD
A
KA
ND
HA
MA
L
SUN
DA
RG
AR
H
NU
AP
AD
A
GA
JAP
ATI
JAJA
PU
R
OD
ISH
A
KEN
DU
JHA
R
AN
UG
UL
CU
TTA
CK
BA
LASO
RE
MA
LKA
NG
IRI
BA
RG
AR
H
KEN
DR
AP
AR
A
PU
RI
MA
YUR
BH
AN
J
KA
LAH
AN
DI
KH
OR
DH
A
NA
YAG
AR
H
BH
AD
RA
K
SAM
BA
LPU
R
-4 -4 -4 -4 -3 -3 -3 -3 -3 -2 -2 -1 -1 -1 -1 1 0 1 1 1 1 2 2 2 3 3 3 4 4 4 4
ANC REGISTRATION WITHIN 1ST TRIMESTER RATE

Apr – Oct 2013
15 Odisha HMIS Analysis Report 2013
DRILL DOWN TO HEALTH FACILITIES OF SONAPUR DISTRICT
Sub-Centres reported zero ANC registered within 1st trimester (Apr – Oct 2013)
2013 Apr May Jun Jul Aug Sep Oct
SCs of Dunguripalli Block
ANC Reg
ANC 1st
trim
ANC Reg
ANC 1st
trim
ANC Reg
ANC 1st
trim
ANC Reg
ANC 1st
trim
ANC Reg
ANC 1st
trim
ANC Reg
ANC 1st
trim
ANC Reg
ANC 1st
trim
Bankipalli SC 7 0 9 0 8 0 11 0 5 0 4 0 8 0
Beheramal SC
11 0 8 0 10 1 4 0 6 0 6 0 4 0
Cherupalli SC
11 0 6 0 8 0 13 0 11 0 9 0 5 0
Chinajuri SC 4 0 5 0 7 0 6 0 2 0 3 0 3 0
Digsira SC 6 0 7 0 15 0 7 0 9 0 9 0 6 0
Gajbandh SC 19 0 7 0 10 0 8 0 4 0 12 0 7 0
Karlajuri SC 10 0 10 0 7 0 12 0 7 0 1 0 5 0
Lingmarni SC
5 0 4 0 3 0 3 0 3 0 1 0 4 0
Sahala SC 9 0 9 0 13 0 7 0 9 0 4 0 10 0
Salepali1 SC 9 0 5 0 10 0 4 0 12 0 5 0 8 0
Sukha SC 10 0 6 0 12 0 10 0 11 0 2 0 1 0
Tamamura SC
13 0 11 0 11 0 12 0 12 0 6 0 10 0
Rampur SC 9 0 13 0 7 0 9 0 10 0 5 0 14 0
Dunguripalli Block
185 12 149 5 192 7 177 23 150 7 112 3 144 7

Apr – Oct 2013
16 Odisha HMIS Analysis Report 2013
Bolingir, Sonapur, Boudh districts show 56, 61 and 64 % respectively for ANC 100 IFA coverage rate from Apr to Oct 2013.
5661 64 65 66 66
70 71 71 73 74 75 76 78 78 79 79 80 80 80 81 81 82 83 83 85 86 88 88 8997
0
20
40
60
80
100
120B
OLA
NG
IR
SON
AP
UR
BO
UD
H
MA
YUR
BH
AN
J
BA
LASO
RE
RA
YAG
AD
A
GA
JAP
ATI
KH
OR
DH
A
NA
BA
RA
NG
AP
UR
KEN
DU
JHA
R
SUN
DA
RG
AR
H
BA
RG
AR
H
OD
ISH
A
AN
UG
UL
NU
AP
AD
A
KEN
DR
AP
AR
A
KO
RA
PU
T
JAG
ATS
ING
HA
PU
R
KA
LAH
AN
DI
SAM
BA
LPU
R
JAJA
PU
R
NA
YAG
AR
H
PU
RI
JHA
RSU
GU
DA
MA
LKA
NG
IRI
GA
NJA
M
CU
TTA
CK
BH
AD
RA
K
DH
ENK
AN
AL
KA
ND
HA
MA
L
DEB
AG
AR
H
-4 -4 -4 -3 -3 -3 -2 -2 -2 -1 -1 -1 0 1 1 1 1 1 1 1 2 2 3 3 3 3 4 4 4 4 4
ANC 100 IFA COVERAGE RATE
Apr – Oct 2013
17 Odisha HMIS Analysis Report 2013
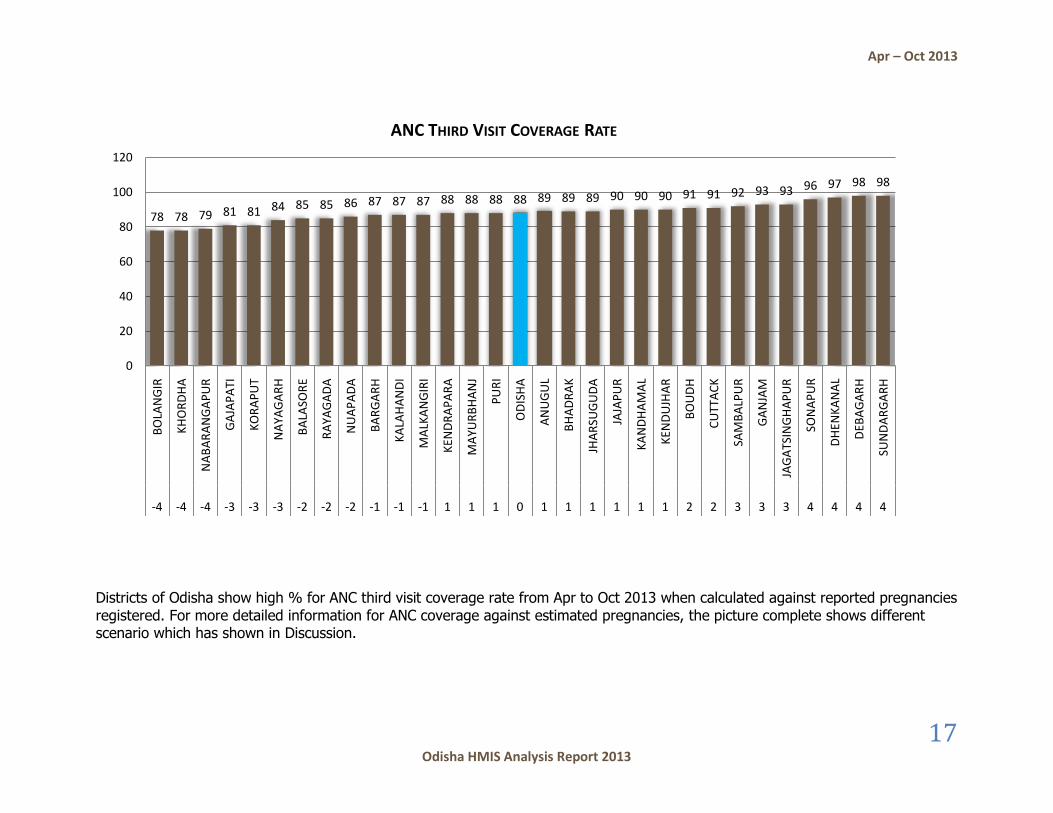
Districts of Odisha show high % for ANC third visit coverage rate from Apr to Oct 2013 when calculated against reported pregnancies registered. For more detailed information for ANC coverage against estimated pregnancies, the picture complete shows different scenario which has shown in Discussion.
78 78 79 81 81 84 85 85 86 87 87 87 88 88 88 88 89 89 89 90 90 90 91 91 92 93 93 96 97 98 98
0
20
40
60
80
100
120B
OLA
NG
IR
KH
OR
DH
A
NA
BA
RA
NG
AP
UR
GA
JAP
ATI
KO
RA
PU
T
NA
YAG
AR
H
BA
LASO
RE
RA
YAG
AD
A
NU
AP
AD
A
BA
RG
AR
H
KA
LAH
AN
DI
MA
LKA
NG
IRI
KEN
DR
AP
AR
A
MA
YUR
BH
AN
J
PU
RI
OD
ISH
A
AN
UG
UL
BH
AD
RA
K
JHA
RSU
GU
DA
JAJA
PU
R
KA
ND
HA
MA
L
KEN
DU
JHA
R
BO
UD
H
CU
TTA
CK
SAM
BA
LPU
R
GA
NJA
M
JAG
ATS
ING
HA
PU
R
SON
AP
UR
DH
ENK
AN
AL
DEB
AG
AR
H
SUN
DA
RG
AR
H
-4 -4 -4 -3 -3 -3 -2 -2 -2 -1 -1 -1 1 1 1 0 1 1 1 1 1 1 2 2 3 3 3 4 4 4 4
ANC THIRD VISIT COVERAGE RATE

Apr – Oct 2013
18 Odisha HMIS Analysis Report 2013
All the districts of Odisha shows high % for ANC third visit coverage rate, ANC TT2/ Booster coverage rate when against reported pregnancies registered. To look into more detailed for these coverage rates, the indicator denominator reference has changed for estimated pregnancies from Apr to Oct for all the districts and the information gives us clear picture of ANC coverage rate which is completely different from above as shown below under discussion.
84 87 87 87 88 88 89 89 89 89 90 90 91 91 91 92 92 92 93 93 93 93 94 94 94 94 95 95 95 95 97
0
20
40
60
80
100
120G
AJA
PA
TI
KEN
DU
JHA
R
KH
OR
DH
A
RA
YAG
AD
A
BO
LAN
GIR
NU
AP
AD
A
BA
LASO
RE
DH
ENK
AN
AL
GA
NJA
M
KO
RA
PU
T
KA
LAH
AN
DI
MA
YUR
BH
AN
J
BH
AD
RA
K
NA
BA
RA
NG
AP
UR
OD
ISH
A
JAJA
PU
R
KA
ND
HA
MA
L
SAM
BA
LPU
R
AN
UG
UL
JHA
RSU
GU
DA
KEN
DR
AP
AR
A
NA
YAG
AR
H
DEB
AG
AR
H
PU
RI
SON
AP
UR
SUN
DA
RG
AR
H
BA
RG
AR
H
BO
UD
H
JAG
ATS
ING
HA
PU
R
MA
LKA
NG
IRI
CU
TTA
CK
-4 -4 -4 -4 -3 -3 -2 -2 -2 -2 -1 -1 1 1 0 1 1 1 1 1 1 1 2 2 2 2 3 3 3 3 4
ANC TT2/ BOOSTER COVERAGE RATE

Apr – Oct 2013
19 Odisha HMIS Analysis Report 2013
DISCUSSION ON ANC COVERAGE
1. ANC REGISTRATION RATE AGAINST ESTIMATED PREGNANCIES
Boudh, Sonapur, Cuttack and Khordha districts show 58, 65, 70 and 71 % respectively for ANC registration against estimated pregnancies. This shows high pregnancies missed out in these districts.
5865
70 7177 79 79 79 80 81 82 82 83 84 84 85 85 85 88 89 91 92 92 93 94 94 96 97 98 99
104
0
20
40
60
80
100
120
BO
UD
H
SON
AP
UR
CU
TTA
CK
KH
OR
DH
A
PU
RI
DH
ENK
AN
AL
JAG
ATS
ING
HA
PU
R
NA
YAG
AR
H
KO
RA
PU
T
SUN
DA
RG
AR
H
BA
RG
AR
H
SAM
BA
LPU
R
JHA
RSU
GU
DA
BH
AD
RA
K
OD
ISH
A
BA
LASO
RE
BO
LAN
GIR
KEN
DR
AP
AR
A
GA
NJA
M
MA
YUR
BH
AN
J
KEN
DU
JHA
R
JAJA
PU
R
KA
LAH
AN
DI
KA
ND
HA
MA
L
DEB
AG
AR
H
RA
YAG
AD
A
NA
BA
RA
NG
AP
UR
MA
LKA
NG
IRI
AN
UG
UL
NU
AP
AD
A
GA
JAP
ATI
ANC Registration Rate Against Estimated Pregnancies

Apr – Oct 2013
20 Odisha HMIS Analysis Report 2013
DISCUSSION ON ANC COVERAGE
2. ANC 3RD VISIT COVERAGE RATE AGAINST ESTIMATED PREGNANCIES
This above chart shows again the same picture as state above. Boudh, Khordha, Sonapur and Cuttack districts show 52, 56, 62 and 64 respectively for ANC third visit coverage rate from Apr to Oct 2013. These four districts are also showing poor % for ANC TT2/ Booster coverage rate and these districts needs to be focused to improve coverage of ANC services for better reach of ANC so as to improve maternal health in these districts.
5256
62 64 64 66 67 6872 72 73 74 74 75 75 75 76 76 79 79 80 80 81 82 83 84 84 85 85 87
92
0
10
20
30
40
50
60
70
80
90
100
BO
UD
H
KH
OR
DH
A
SON
AP
UR
CU
TTA
CK
KO
RA
PU
T
BO
LAN
GIR
NA
YAG
AR
H
PU
RI
BA
LASO
RE
BA
RG
AR
H
JHA
RSU
GU
DA
JAG
ATS
ING
HA
PU
R
OD
ISH
A
BH
AD
RA
K
KEN
DR
AP
AR
A
SAM
BA
LPU
R
DH
ENK
AN
AL
NA
BA
RA
NG
AP
UR
MA
YUR
BH
AN
J
SUN
DA
RG
AR
H
KA
LAH
AN
DI
RA
YAG
AD
A
GA
NJA
M
KEN
DU
JHA
R
JAJA
PU
R
GA
JAP
ATI
KA
ND
HA
MA
L
MA
LKA
NG
IRI
NU
AP
AD
A
AN
UG
UL
DEB
AG
AR
H
ANC 3rd Visit Coverage Rate Against Estimated Pregnancies

Apr – Oct 2013
21 Odisha HMIS Analysis Report 2013
DISCUSSION ON ANC COVERAGE
3. ANC TT2/ BOOSTER COVERAGE RATE AGAINST ESTIMATED PREGNANCIES
4. ANC 100 IFA COVERAGE RATE AGAINST ESTIMATED PREGNANCIES
55 61 62 67 70 71 73 74 75 75 75 75 76 76 77 77 78 78 79 79 80 81 82 85 85 87 88 88 88 91 92
020406080
100
BO
UD
H
SON
AP
UR
KH
OR
DH
A
CU
TTA
CK
DH
ENK
AN
AL
KO
RA
PU
T
PU
RI
NA
YAG
AR
H
BO
LAN
GIR
BA
LASO
RE
SAM
BA
LPU
R
JAG
ATS
ING
H…
SUN
DA
RG
AR
H
BH
AD
RA
K
OD
ISH
A
JHA
RSU
GU
DA
BA
RG
AR
H
GA
NJA
M
KEN
DR
AP
AR
A
KEN
DU
JHA
R
MA
YUR
BH
AN
J
RA
YAG
AD
A
KA
LAH
AN
DI
JAJA
PU
R
KA
ND
HA
MA
L
GA
JAP
ATI
NU
AP
AD
A
NA
BA
RA
NG
A…
DEB
AG
AR
H
AN
UG
UL
MA
LKA
NG
IRI
ANC TT2/Booster Dose Coverage Rate Against Estimated Pregnancies
37 40 47 51 56 58 60 60 61 62 63 63 64 64 64 66 66 67 68 69 69 73 73 74 74 75 76 77 80 82 91
020406080
100
BO
UD
H
SON
AP
UR
BO
LAN
GIR
KH
OR
DH
A
BA
LASO
RE
MA
YUR
BH
A…
SUN
DA
RG
A…
CU
TTA
CK
BA
RG
AR
H
RA
YAG
AD
A
JAG
ATS
ING…
PU
RI
KO
RA
PU
T
NA
YAG
AR
H
OD
ISH
A
SAM
BA
LPU
R
KEN
DU
JHA
R
KEN
DR
AP
AR
A
NA
BA
RA
NG…
JHA
RSU
GU
DA
DH
ENK
AN
AL
GA
JAP
ATI
KA
LAH
AN
DI
BH
AD
RA
K
GA
NJA
M
JAJA
PU
R
AN
UG
UL
NU
AP
AD
A
MA
LKA
NG
IRI
KA
ND
HA
MA
L
DEB
AG
AR
H
ANC 100 IFA Coverage Rate Against Estimated Pregnancies
Apr – Oct 2013
22 Odisha HMIS Analysis Report 2013
GAJAPATI COMPLICATED PREGNANCIES ATTENDANCE RATE
Kasinagar CHC Apr-13 May-13 Jun-13 Jul-13 Aug-13 Sep-13 Oct-13
Complicated Pregnancies 7 33 35 38 35 53 48
Institutional Deliveries 33 34 36 39 36 53 48
% 21.2 97.1 97.2 97.4 97.2 100 100
Most of the deliveries in Kasinagar CHC of Gajapati districts are reported as complicated pregnancies. It needs to be enquired whether they are all complicated pregnancies or reporting issues.
1 14 4 5 5 5 5 6 6 6 7 7
9 9 9 10 11 11 11 12 13 1315 16 17 17
2022
26
35
0
5
10
15
20
25
30
35
40JA
JAP
UR
SAM
BA
LPU
R
GA
NJA
M
JAG
ATS
ING
HA
PU
R
BA
RG
AR
H
BO
UD
H
CU
TTA
CK
KH
OR
DH
A
JHA
RSU
GU
DA
MA
LKA
NG
IRI
NA
YAG
AR
H
AN
UG
UL
DEB
AG
AR
H
KA
LAH
AN
DI
KO
RA
PU
T
NA
BA
RA
NG
AP
UR
OD
ISH
A
MA
YUR
BH
AN
J
NU
AP
AD
A
SUN
DA
RG
AR
H
PU
RI
KA
ND
HA
MA
L
KEN
DU
JHA
R
RA
YAG
AD
A
SON
AP
UR
BH
AD
RA
K
KEN
DR
AP
AR
A
DH
ENK
AN
AL
BO
LAN
GIR
BA
LASO
RE
GA
JAP
ATI
-4 -4 -4 -4 -3 -3 -3 -3 -2 -2 -2 -2 -2 -1 -1 -1 0 1 1 1 1 2 2 2 3 3 3 4 4 4 4
COMPLICATED PREGNANCIES ATTENDED RATE

Apr – Oct 2013
23 Odisha HMIS Analysis Report 2013
SAMBALPUR COMPLICATED PREGNANCIES ATTENDANCE RATE
VSSMC-Burla Apr-13 May-13 Jun-13 Jul-13 Aug-13 Sep-13 Oct-13
Complicated Pregnancies 0 0 0 0 0 0 0
Institutional Deliveries 404 489 509 453 503 496 464
% 0 0 0 0 0 0 0
VSSMC Burla of Sambalpur districts has not reported any complicated pregnancies attended from Apr to Oct 2013.
Jajapur, Kendujhar, Mayurbhanj, Nabarangapur and Sambalpur districts shows less % for SBA delivery to total home delivery.
14 4 4 4 5 6 6 7 7 7 7 8 8 9 10 10 10 11 12 12
15 15 15 17 1720
30
44
53
59
0
10
20
30
40
50
60
70
JAJA
PU
R
KEN
DU
JHA
R
MA
YUR
BH
AN
J
NA
BA
RA
NG
AP
UR
SAM
BA
LPU
R
MA
LKA
NG
IRI
BO
UD
H
CU
TTA
CK
BA
LASO
RE
KEN
DR
AP
AR
A
KH
OR
DH
A
KO
RA
PU
T
DEB
AG
AR
H
RA
YAG
AD
A
SUN
DA
RG
AR
H
BA
RG
AR
H
GA
JAP
ATI
OD
ISH
A
BO
LAN
GIR
JHA
RSU
GU
DA
NU
AP
AD
A
GA
NJA
M
NA
YAG
AR
H
SON
AP
UR
AN
UG
UL
KA
LAH
AN
DI
KA
ND
HA
MA
L
JAG
ATS
ING
HA
PU
R
DH
ENK
AN
AL
BH
AD
RA
K
PU
RI
-4 -4 -4 -4 -4 -3 -3 -3 -2 -2 -2 -2 -1 -1 -1 1 1 0 1 1 1 1 1 1 2 2 3 3 4 4 4
% SBA DELIVERY TO TOTAL HOME DELIVERY

Apr – Oct 2013
24 Odisha HMIS Analysis Report 2013
Gajapati district shows 52% institutional deliveries against total ANC registered and when we refer ANC registration against estimated pregnancies, it shows 104 % and it implies that there is more % of unreported deliveries in Gajapati. In Cuttack district, the % of institutional deliveries against total ANC registration is 147 which is higher because there are increased number of private deliveries are reported in May 2013 which is 2,815.
51 52 52 56 56 57 58 60 62 64 67 68 72 73 74 74 75 75 77 78 80 80 80 82 82 83 8388 89
99
147
0
20
40
60
80
100
120
140
160K
OR
AP
UT
GA
JAP
ATI
MA
LKA
NG
IRI
KA
LAH
AN
DI
NA
BA
RA
NG
AP
UR
DEB
AG
AR
H
RA
YAG
AD
A
PU
RI
BO
UD
H
NU
AP
AD
A
NA
YAG
AR
H
KEN
DU
JHA
R
DH
ENK
AN
AL
KA
ND
HA
MA
L
AN
UG
UL
BH
AD
RA
K
JAJA
PU
R
KEN
DR
AP
AR
A
OD
ISH
A
BA
RG
AR
H
BA
LASO
RE
JAG
ATS
ING
HA
PU
R
SON
AP
UR
JHA
RSU
GU
DA
SUN
DA
RG
AR
H
BO
LAN
GIR
GA
NJA
M
MA
YUR
BH
AN
J
KH
OR
DH
A
SAM
BA
LPU
R
CU
TTA
CK
-4 -4 -4 -4 -4 -3 -3 -3 -3 -2 -2 -2 -2 -1 -1 -1 -1 -1 0 1 1 1 1 2 2 3 3 3 4 4 4
% INSTITUTIONAL DELIVERY AGAINST TOTAL ANC REGISTRATION
Apr – Oct 2013
25 Odisha HMIS Analysis Report 2013
ANGUL CAESAREAN SECTION RATE (LESS %)
Talcher SDH Apr-13 May-13 Jun-13 Jul-13 Aug-13 Sep-13 Oct-13
Caesarean sections 11 18 24 12 1 0 0
Institutional Deliveries 103 140 134 132 130 132 117
% 11 13 18 9 1 0 0
ANGUL DHH
Caesarean sections 35 25 16 25 28 0 0
Institutional Deliveries 333 489 501 457 521 517 467
% 11 5 3 6 5 0 0
2 3 4 4 4 5 5 6 6 6 79 9 9 9 9 10 10 10 10 11 11 12 13 13
15 15 1618 19 20
0
5
10
15
20
25A
NU
GU
L
BO
UD
H
JAJA
PU
R
KA
ND
HA
MA
L
NA
YAG
AR
H
KO
RA
PU
T
NA
BA
RA
NG
AP
UR
KEN
DU
JHA
R
MA
LKA
NG
IRI
MA
YUR
BH
AN
J
RA
YAG
AD
A
BO
LAN
GIR
CU
TTA
CK
DEB
AG
AR
H
KEN
DR
AP
AR
A
SON
AP
UR
GA
NJA
M
KA
LAH
AN
DI
SUN
DA
RG
AR
H
OD
ISH
A
JAG
ATS
ING
HA
PU
R
NU
AP
AD
A
BA
LASO
RE
BH
AD
RA
K
PU
RI
DH
ENK
AN
AL
GA
JAP
ATI
KH
OR
DH
A
JHA
RSU
GU
DA
BA
RG
AR
H
SAM
BA
LPU
R
-4 -4 -4 -4 -4 -3 -3 -3 -3 -3 -2 -2 -2 -2 -2 -2 1 1 1 0 1 1 1 2 2 2 2 3 4 4 4
CAESAREAN SECTION RATE AGAINST TOTAL INSTITUTIONAL DELIVERY

Apr – Oct 2013
26 Odisha HMIS Analysis Report 2013
SAMBALPUR CAESAREAN SECTION RATE (HIGH %)
VSSMC-Burla Apr-13 May-13 Jun-13 Jul-13 Aug-13 Sep-13 Oct-13
Caesarean sections 159 196 214 197 231 191 215
Institutional Deliveries 404 489 509 453 503 496 464
% 39.4 40.1 42 43.5 45.9 38.5 46.3
BOUDH DELIVERIES DISCHARGED UNDER 48 HRS RATE
BOUDH DHH Apr-13 May-13 Jun-13 Jul-13 Aug-13 Sep-13 Oct-13
Deliveries discharged <48hrs 48 67 64 70 101 107 78
Total Ins deliveries 48 67 73 70 101 107 78
% 100 100 87.7 100 100 100 100
92 88 87 86 86 86 84 83 81 78 75 73 72 70 70 70 70 67 63 63 59 59 57 57 51 49 4535 30 27
13
0102030405060708090
100
BO
UD
H
AN
UG
UL
NA
BA
RA
NG
AP
UR
NA
YAG
AR
H
NU
AP
AD
A
SUN
DA
RG
AR
H
JAG
ATS
ING
HA
PU
R
KEN
DU
JHA
R
DH
ENK
AN
AL
BA
RG
AR
H
BO
LAN
GIR
JAJA
PU
R
PU
RI
BA
LASO
RE
BH
AD
RA
K
KA
LAH
AN
DI
KA
ND
HA
MA
L
DEB
AG
AR
H
GA
NJA
M
OD
ISH
A
JHA
RSU
GU
DA
KO
RA
PU
T
KEN
DR
AP
AR
A
RA
YAG
AD
A
SON
AP
UR
MA
YUR
BH
AN
J
KH
OR
DH
A
CU
TTA
CK
GA
JAP
ATI
MA
LKA
NG
IRI
SAM
BA
LPU
R
-4 -4 -4 -3 -3 -3 -3 -3 -3 -2 -2 -2 -2 -1 -1 -1 -1 -1 -1 0 1 1 2 2 2 3 3 3 4 4 4
% DELIVERIES DISCHARGED UNDER 48 HOURS RATE

Apr – Oct 2013
27 Odisha HMIS Analysis Report 2013
KENDRAPARA NEWBORN BREASTFED WITHIN 1 HR RATE
Kendrapara DHH Apr-13 May-13 Jun-13 Jul-13 Aug-13 Sep-13 Oct-13
Newborn breastfed within1 hr 390 48 56 509 37 40 0
Live births 475 615 592 516 589 583 594
% 82.1 7.8 9.5 98.6 6.3 6.9 0
7281 87 90 90 90 92 92 92 93 94 94 94 94 94 95 96 96 97 97 97 98 98 98 98 99 99 99 99 100 100
0
20
40
60
80
100
120K
END
RA
PA
RA
NA
YAG
AR
H
BO
LAN
GIR
BA
RG
AR
H
KH
OR
DH
A
SON
AP
UR
BH
AD
RA
K
NU
AP
AD
A
RA
YAG
AD
A
DEB
AG
AR
H
BA
LASO
RE
GA
NJA
M
KO
RA
PU
T
SAM
BA
LPU
R
OD
ISH
A
PU
RI
JAJA
PU
R
KA
LAH
AN
DI
BO
UD
H
DH
ENK
AN
AL
SUN
DA
RG
AR
H
AN
UG
UL
KA
ND
HA
MA
L
KEN
DU
JHA
R
MA
LKA
NG
IRI
CU
TTA
CK
GA
JAP
ATI
MA
YUR
BH
AN
J
NA
BA
RA
NG
AP
UR
JAG
ATS
ING
HA
PU
R
JHA
RSU
GU
DA
-4 -4 -4 -3 -3 -3 -2 -2 -2 -1 1 1 1 1 0 1 1 1 1 1 1 2 2 2 2 3 3 3 3 4 4
% NEWBORN BREASTFED WITHIN 1 HOUR RATE
Apr – Oct 2013
28 Odisha HMIS Analysis Report 2013
JAJAPUR HOME DELIVERY NEWBORN VISIT RATE WITHIN 24 HOURS
Blocks Dharmasala Block
Dasarthpur Block
Sukinda Block
Binjharpur Block
Barachana Block
Jajpur Block
Dangadi Block
Korei Block
Rasulpur Block
Newborn visited within 24 hrs
0 3 0 1 23 5 7 0 1
Home deliveries 17 3 31 1 25 6 19 4 1
% 0 100 0 100 92 83.3 36.8 0 100
43 45 46 4954 56 57
62 63 64 65 68 70 71 74 74 75 76 76 79 82 84 87 88 90 90 94 96 97 98 99
0
20
40
60
80
100
120JA
JAP
UR
GA
NJA
M
GA
JAP
ATI
KO
RA
PU
T
AN
UG
UL
MA
LKA
NG
IRI
KEN
DR
AP
AR
A
BA
RG
AR
H
NU
AP
AD
A
RA
YAG
AD
A
KA
ND
HA
MA
L
DH
ENK
AN
AL
OD
ISH
A
PU
RI
BO
LAN
GIR
NA
YAG
AR
H
BO
UD
H
KH
OR
DH
A
SON
AP
UR
NA
BA
RA
NG
AP
UR
SAM
BA
LPU
R
KEN
DU
JHA
R
DEB
AG
AR
H
SUN
DA
RG
AR
H
BH
AD
RA
K
CU
TTA
CK
KA
LAH
AN
DI
JAG
ATS
ING
HA
PU
R
MA
YUR
BH
AN
J
BA
LASO
RE
JHA
RSU
GU
DA
-4 -4 -4 -3 -3 -3 -2 -2 -2 -1 -1 -1 0 1 1 1 1 1 1 2 2 2 3 3 3 3 4 4 4 4 4
% HOME DELIVERY NEWBORN VISIT RATE WITHIN 24 HOURS

Apr – Oct 2013
29 Odisha HMIS Analysis Report 2013
KANDHAMAL LOW BIRTH WEIGHT RATE (DATA ENTRY ERRORS?)
SCs of Daringibadi Block
Budaguda SC
Bamunigaon SC
Bhramarbadi SC
Saramauli SC
Danekbadi SC
Sraniketa SC
Jhinjiriguda SC
Badabanga SC
Daringibadi_Mc SC
Live births Weight < 2.5 kg
16 2 8 3 7 1 3 4 1
Live births weighed 16 2 8 3 7 1 3 4 1
% 100 100 100 100 100 100 100 100 100
26 2523 23 22 21 21 20 20 20 19 19 19 19 18 18 17 17 17 16 15 15 14 14
12 1210 10 9 9
7
0
5
10
15
20
25
30K
AN
DH
AM
AL
NA
BA
RA
NG
AP
UR
BO
LAN
GIR
MA
LKA
NG
IRI
KO
RA
PU
T
BA
RG
AR
H
KA
LAH
AN
DI
BO
UD
H
RA
YAG
AD
A
SAM
BA
LPU
R
DH
ENK
AN
AL
JAJA
PU
R
MA
YUR
BH
AN
J
SON
AP
UR
JHA
RSU
GU
DA
SUN
DA
RG
AR
H
KH
OR
DH
A
NU
AP
AD
A
OD
ISH
A
GA
NJA
M
AN
UG
UL
KEN
DU
JHA
R
DEB
AG
AR
H
KEN
DR
AP
AR
A
BA
LASO
RE
CU
TTA
CK
BH
AD
RA
K
NA
YAG
AR
H
GA
JAP
ATI
JAG
ATS
ING
HA
PU
R
PU
RI
-4 -4 -4 -4 -3 -3 -3 -2 -2 -2 -1 -1 -1 -1 -1 -1 -1 -1 0 1 1 1 2 2 3 3 3 3 4 4 4
LOW BIRTH WEIGHT RATE

Apr – Oct 2013
30 Odisha HMIS Analysis Report 2013
6382 85 88 89 93 94 94 94 97 100 101 101 103 105 105 108 110 110 111 111 114 116 117 119 120 121 125 127 129
152
020406080
100120140160
CU
TTA
CK
KA
ND
HA
MA
L
RA
YAG
AD
A
MA
LKA
NG
IRI
MA
YUR
BH
AN
J
NA
BA
RA
NG
AP
UR
BO
LAN
GIR
GA
JAP
ATI
SAM
BA
LPU
R
KO
RA
PU
T
GA
NJA
M
KH
OR
DH
A
OD
ISH
A
NU
AP
AD
A
BA
LASO
RE
KEN
DU
JHA
R
SUN
DA
RG
AR
H
JHA
RSU
GU
DA
KA
LAH
AN
DI
BH
AD
RA
K
SON
AP
UR
JAJA
PU
R
BA
RG
AR
H
DH
ENK
AN
AL
KEN
DR
AP
AR
A
AN
UG
UL
JAG
ATS
ING
HA
PU
R
NA
YAG
AR
H
DEB
AG
AR
H
BO
UD
H
PU
RI
-4 -4 -4 -3 -3 -3 -2 -2 -2 -1 -1 1 0 1 1 1 1 1 1 2 2 2 3 3 3 3 4 4 4 4 4
FULL IMMUNISATION RATE UNDER 12 MONTHS
63 67 70 71 72 76 76 77 77 79 79 80 80 80 81 81 82 83 84 84 84 85 85 85 85 86 88 88 89 90 100
020406080
100120
BO
UD
H
SON
AP
UR
KO
RA
PU
T
KH
OR
DH
A
CU
TTA
CK
DH
ENK
AN
AL
NA
YAG
AR
H
NA
BA
RA
NG…
RA
YAG
AD
A
BO
LAN
GIR
KA
ND
HA
MA
L
BH
AD
RA
K
MA
YUR
BH
AN
J
OD
ISH
A
BA
LASO
RE
PU
RI
GA
NJA
M
KEN
DU
JHA
R
BA
RG
AR
H
KEN
DR
AP
AR
A
MA
LKA
NG
IRI
JAG
ATS
ING
H…
JHA
RSU
GU
DA
KA
LAH
AN
DI
SAM
BA
LPU
R
SUN
DA
RG
AR
H
DEB
AG
AR
H
GA
JAP
ATI
JAJA
PU
R
NU
AP
AD
A
AN
UG
UL
Full Immunization Under 1 year Against Estimated Livebirths
Apr – Oct 2013
31 Odisha HMIS Analysis Report 2013
Boudh, Cuttack and Puri districts shows very less post-partum sterilization against total female sterilization.
0 0 02 2 3 3 3 4 5 5 6 7 8 9 9 10 11 11
14 14 14 15 15 16 1720
22 23 23
51
0
10
20
30
40
50
60B
OU
DH
CU
TTA
CK
PU
RI
KO
RA
PU
T
MA
LKA
NG
IRI
DEB
AG
AR
H
KEN
DU
JHA
R
NA
YAG
AR
H
GA
NJA
M
BH
AD
RA
K
KEN
DR
AP
AR
A
NA
BA
RA
NG
AP
UR
KA
LAH
AN
DI
JAJA
PU
R
RA
YAG
AD
A
SON
AP
UR
AN
UG
UL
MA
YUR
BH
AN
J
OD
ISH
A
GA
JAP
ATI
JHA
RSU
GU
DA
KA
ND
HA
MA
L
DH
ENK
AN
AL
SUN
DA
RG
AR
H
BO
LAN
GIR
BA
RG
AR
H
BA
LASO
RE
NU
AP
AD
A
JAG
ATS
ING
HA
PU
R
SAM
BA
LPU
R
KH
OR
DH
A
-4 -4 -4 -4 -4 -3 -3 -3 -3 -2 -2 -2 -2 -1 -1 -1 -1 1 0 1 1 1 2 2 2 3 3 3 4 4 4
% PP STERILISATION TO TOTAL FEMALE STERILISATION

Apr – Oct 2013
32 Odisha HMIS Analysis Report 2013
18 districts showing less than 1% for Male sterilization against total sterilization
0 0 0 0 0 0 0 0 0 0 0 0 0 0 0 0 0 0
1 1
2 2 2 2
3 3 3
4
7 7
8
0
1
2
3
4
5
6
7
8
9
AN
UG
UL
BA
LASO
RE
BA
RG
AR
H
BH
AD
RA
K
BO
LAN
GIR
CU
TTA
CK
DEB
AG
AR
H
DH
ENK
AN
AL
JAG
ATS
ING
HA
PU
R
JAJA
PU
R
JHA
RSU
GU
DA
KEN
DR
AP
AR
A
KH
OR
DH
A
NA
YAG
AR
H
NU
AP
AD
A
PU
RI
SAM
BA
LPU
R
SON
AP
UR
GA
JAP
ATI
GA
NJA
M
KA
ND
HA
MA
L
MA
LKA
NG
IRI
NA
BA
RA
NG
AP
UR
OD
ISH
A
KA
LAH
AN
DI
KEN
DU
JHA
R
MA
YUR
BH
AN
J
SUN
DA
RG
AR
H
BO
UD
H
RA
YAG
AD
A
KO
RA
PU
T
-4 -4 -4 -4 -4 -4 -4 -4 -4 -4 -4 -4 -4 -4 -4 -4 -4 -4 -1 -1 1 1 1 0 1 1 1 2 3 3 4
% MALE STERILISATION TO TOTAL STERILISATION

Apr – Oct 2013
33 Odisha HMIS Analysis Report 2013
Malkangiri, Gajapati, Sonapur and Rayagada districts show only 41, 44, 45 and 49% respectively for IUCD against total FP methods including permanent plus IUCD.
41 44 4549 50 51 52 55 56 56 59 60 62 64 64 64 64 66 66 67 69 69 70 71 71 72 73 74
78 8187
0
10
20
30
40
50
60
70
80
90
100
MA
LKA
NG
IRI
GA
JAP
ATI
SON
AP
UR
RA
YAG
AD
A
BA
RG
AR
H
GA
NJA
M
KO
RA
PU
T
BH
AD
RA
K
BO
LAN
GIR
NU
AP
AD
A
KA
LAH
AN
DI
NA
BA
RA
NG
AP
UR
SAM
BA
LPU
R
KA
ND
HA
MA
L
KH
OR
DH
A
MA
YUR
BH
AN
J
OD
ISH
A
JAJA
PU
R
KEN
DU
JHA
R
JHA
RSU
GU
DA
CU
TTA
CK
KEN
DR
AP
AR
A
BA
LASO
RE
AN
UG
UL
JAG
ATS
ING
HA
PU
R
DEB
AG
AR
H
DH
ENK
AN
AL
SUN
DA
RG
AR
H
NA
YAG
AR
H
PU
RI
BO
UD
H
-4 -4 -4 -4 -3 -3 -3 -2 -2 -2 -1 -1 -1 1 1 1 0 1 1 1 1 1 2 2 2 3 3 4 4 4 4
% IUCD AGANIST TOTAL FP + IUCD

Apr – Oct 2013
34 Odisha HMIS Analysis Report 2013
SCORING OF DISTRICTS FOR SERVICE DELIVERY (16 KEY INDICATORS)
Each district has scored for each life stage based on 16 key service delivery indicators. It will be appropriate to look into the scoring of each district for each life stage so as to do interventions which are information based.
The following districts showing poor score for pregnancy care, Child birth, Post Natal & Newborn care and Reproductive age group
DISTRICTS OF ODISHA WITH POOR SCORING FOR 16 KEY INDICATORS
PREGNANCY CARE (5 INDICATORS)
CHILD BIRTH (3 INDICATORS)
PNC & NEWBORN CARE (5 INDICATORS)
REPRODUCTIVE AGE GROUP (3 INDICATORS)
OVERALL (16 INDICATORS)
BOLANGIR NABARANGAPUR GAJAPATI SONAPUR RAYAGADA
KHORDHA BOUDH KENDRAPARA BHADRAK GAJAPATI
NABARANGAPUR MALKANGIRI RAYAGADA CUTTACK KORAPUT
RAYAGADA JAJAPUR CUTTACK GANJAM MALKANGIRI
KORAPUT KENDUJHAR GANJAM MALKANGIRI NABARANGAPUR
GAJAPATI KORAPUT MALKANGIRI KENDRAPARA BOLANGIR
BOUDH DEBAGARH KHORDHA BARGARH GANJAM
GANJAM RAYAGADA KORAPUT BOLANGIR JAJAPUR
NUAPADA KENDRAPARA SAMBALPUR DEBAGARH KENDRAPARA
BALASORE NAYAGARH SONAPUR GAJAPATI SONAPUR
The Districts listed for Pregnancy care, Child birth, PNC & Newborn care and Reproductive age group need intervention for their respective focus life stage. When the scores for each life stage has aggregated for each indicator and based on overall scoring, the districts shown poor scoring in all the life stages is listed under overall (column 5) of Table above. The table shows the shows poor scoring districts from above downwards.

Apr – Oct 2013
35 Odisha HMIS Analysis Report 2013
RANKING OF DISTRICTS FOR SERVICE DELIVERY (16 KEY INDICATORS)
RANKING OF DISTRICTS OF ODISHA BASED ON 16 KEY INDICATORS 2013
DISTRICTS PREGNANCY
CARE CHILD BIRTH
PNC & NEWBORN
CARE
REPRODUCTIVE AGE
GROUP
TOTAL SCORE
Z SCORE
RANKING
RAYAGADA -9 -6 -7 -2 -24 -1.85 RANK 30
GAJAPATI -6 -1 -11 -4 -22 -1.69 RANK 29
KORAPUT -8 -9 -1 -3 -21 -1.61 RANK 28
MALKANGIRI 5 -10 -4 -7 -16 -1.20 RANK 27
NABARANGAPUR -9 -11 10 -2 -12 -0.88 RANK 26
BOLANGIR -9 2 1 -4 -10 -0.72 RANK 25
GANJAM -4 5 -4 -7 -10 -0.72 RANK 24
JAJAPUR 1 -9 2 -4 -10 -0.72 RANK 23
KENDRAPARA 8 -5 -7 -5 -9 -0.63 RANK 22
SONAPUR 1 0 -1 -9 -9 -0.63 RANK 21
KHORDHA -9 5 -3 1 -6 -0.39 RANK 20
NUAPADA -4 0 1 -3 -6 -0.39 RANK 19
NAYAGARH 2 -5 1 -3 -5 -0.31 RANK 18
CUTTACK 8 -1 -4 -7 -4 -0.23 RANK 17
KENDUJHAR -1 -9 7 -1 -4 -0.23 RANK 16
DEBAGARH 4 -6 5 -4 -1 0.01 RANK 15
BOUDH -5 -10 12 3 0 0.09 RANK 14
ANUGUL 2 -3 5 -3 1 0.18 RANK 13
MAYURBHANJ 1 -4 2 3 2 0.26 RANK 12
BALASORE -2 0 4 1 3 0.34 RANK 11
BARGARH 0 6 3 -4 5 0.50 RANK 10
SAMBALPUR 5 4 -1 -1 7 0.66 RANK 9
KALAHANDI 1 -1 10 -2 8 0.74 RANK 8
KANDHAMAL 7 -2 2 3 10 0.90 RANK 7
BHADRAK 13 5 1 -8 11 0.99 RANK 6
JHARSUGUDA -1 7 9 -2 13 1.15 RANK 5
PURI 10 3 4 -4 13 1.15 RANK 4
JAGATSINGHAPUR
0 5 11 2 18 1.55 RANK 3
DHENKANAL 7 4 7 1 19 1.63 RANK 2
SUNDARGARH 5 2 9 8 24 2.04 RANK 1
POOR
AVERAGE
GOOD

Apr – Oct 2013
36 Odisha HMIS Analysis Report 2013
GIS VISUALISATION OF RANKING OF DISTRICTS OF ODISHA
DDHHIISS22 GGIISS

Apr – Oct 2013
37 Odisha HMIS Analysis Report 2013
HEALTH FACILITIES PERFOMANCE
SUB-CENTRES (SC)
Number of SCs not reported for ANC, Delivery, Immunization, FP, Lab, OPD & VHND Services
DISTRICTS TOTAL
SCS
ANC DELIVERY IMM FP LAB OPD VHND
ANC REG
ANC HTN
DELV DPT3 IUD HB OPD VHND
ANUGUL 175 0 154 161 0 33 4 0 1
BALASORE 275 0 201 266 0 1 92 1 1
BARGARH 205 1 190 170 1 43 18 1 2
BHADRAK 177 0 171 171 0 14 10 0 3
BOLANGIR 226 1 169 219 1 63 81 0 1
BOUDH 67 0 49 67 0 17 26 0 1
CUTTACK 333 10 269 332 10 24 155 10 10
DEBAGARH 42 0 37 37 0 0 5 0 0
DHENKANAL 167 0 138 161 0 4 5 0 0
GAJAPATI 136 1 112 135 1 35 23 1 1
GANJAM 460 0 396 457 0 96 51 2 22
JAGATSINGHAPUR 189 5 174 189 2 11 28 2 9
JAJAPUR 260 0 237 260 0 37 142 3 3
JHARSUGUDA 66 0 56 59 0 17 0 0 0
KALAHANDI 242 1 181 235 1 46 53 2 3
KANDHAMAL 172 2 128 165 2 66 62 2 2
KENDRAPARA 227 0 207 224 0 4 79 0 0
KENDUJHAR 351 0 270 322 0 43 3 0 0
KHORDHA 202 0 171 200 0 5 41 0 1
KORAPUT 307 2 220 307 0 93 123 9 6
MALKANGIRI 158 0 134 158 0 39 11 0 0
MAYURBHANJ 589 0 376 588 0 286 7 6 2
NABARANGAPUR 289 1 243 280 1 53 76 3 3
NAYAGARH 166 0 153 165 0 4 7 0 1
NUAPADA 96 0 64 90 0 16 20 0 3
PURI 244 3 192 244 3 4 106 3 11
RAYAGADA 236 0 172 232 0 128 15 1 1
SAMBALPUR 172 2 133 170 2 26 21 2 2
SONAPUR 89 0 75 87 0 7 10 0 2
SUNDARGARH 390 0 308 335 0 26 77 0 1
ODISHA 6708 29 5380 6486 24 1241 1351 48 92
% OF SCS NOT REPORTED
% 0.4 80 97 0.4 19 20 0.7 1.4

Apr – Oct 2013
38 Odisha HMIS Analysis Report 2013
PRIMARY HEALTH CENTRES (PHC)
Number of PHCs not reported for ANC, Delivery, Child Immunization, FP Services
DISTRICTS TOTAL
PHC (N)
ANC DELIVERY CHILD
IMMUNIZATION FP
ANC REG
ANC HTN
DELV COMP PREG
LIVE BIRTHS WEIGH
DPT 3 IUD STER
ANUGUL 31 31 31 16 0 16 31 25 31
BALASORE 68 68 68 52 48 52 68 67 67
BARGARH 46 46 46 32 46 32 45 41 46
BHADRAK 50 50 50 35 50 35 50 41 50
BOLANGIR 42 42 41 30 42 30 42 41 42
BOUDH 12 12 12 9 12 9 12 11 12
CUTTACK 58 56 58 51 58 51 55 55 54
DEBAGARH 7 7 7 3 7 3 7 6 7
DHENKANAL 32 30 32 22 32 22 31 21 32
GAJAPATI 20 20 20 13 20 13 20 19 20
GANJAM 89 84 88 67 89 67 86 84 89
JAGATSINGHAPUR 37 37 37 36 37 36 36 36 37
JAJAPUR 56 51 56 44 56 44 48 46 52
JHARSUGUDA 15 13 15 5 15 5 13 10 15
KALAHANDI 43 42 43 28 43 28 43 43 43
KANDHAMAL 37 37 36 24 37 24 37 33 37
KENDRAPARA 45 45 45 30 45 30 45 41 44
KENDUJHAR 60 58 60 45 60 45 59 56 58
KHORDHA 46 45 46 39 46 39 45 45 44
KORAPUT 49 46 48 40 49 40 47 42 49
MALKANGIRI 26 24 26 13 26 13 26 26 26
MAYURBHANJ 82 82 82 67 82 67 82 60 78
NABARANGAPUR 39 39 38 20 39 20 39 37 28
NAYAGARH 37 37 37 28 37 28 37 34 36
NUAPADA 17 17 16 8 17 8 17 16 17
PURI 46 45 45 43 46 43 45 45 46
RAYAGADA 36 35 35 30 36 31 36 32 36
SAMBALPUR 32 31 32 20 32 20 31 30 28
SONAPUR 18 18 18 16 18 17 18 17 18
SUNDARGARH 58 57 57 32 58 32 57 53 56
ODISHA 1234 1205 1225 898 1183 900 1208 1113 1198
% OF PHCS NOT REPORTED
% 98 99 73 96 73 98 90 97

Apr – Oct 2013
39 Odisha HMIS Analysis Report 2013
Number of PHCs not reported for OPD, IP, Lab services
DISTRICTS TOTAL
PHC (N)
OPD IP LAB
OPD IP HB BLOOD
SMEARS WIDAL VDRL HIV
ANUGUL 31 0 17 28 11 31 31 31
BALASORE 68 1 52 67 61 68 68 68
BARGARH 46 0 32 46 44 46 46 46
BHADRAK 50 0 36 50 47 50 50 49
BOLANGIR 42 0 29 40 25 42 42 42
BOUDH 12 3 9 12 12 12 12 12
CUTTACK 58 4 50 56 55 58 58 58
DEBAGARH 7 0 3 7 5 7 7 7
DHENKANAL 32 0 21 30 12 30 29 32
GAJAPATI 20 0 14 19 10 20 20 20
GANJAM 89 3 68 80 57 87 88 89
JAGATSINGHAPUR 37 2 36 37 31 37 37 37
JAJAPUR 56 1 45 55 41 56 56 56
JHARSUGUDA 15 1 5 14 6 15 15 15
KALAHANDI 43 0 25 38 18 42 42 43
KANDHAMAL 37 4 21 29 16 37 37 37
KENDRAPARA 45 1 25 41 44 44 44 45
KENDUJHAR 60 2 36 57 34 59 59 60
KHORDHA 46 3 39 46 43 46 46 46
KORAPUT 49 3 38 49 33 49 49 48
MALKANGIRI 26 2 12 24 13 25 26 26
MAYURBHANJ 82 2 68 81 50 82 82 81
NABARANGAPUR 39 1 19 39 14 39 39 39
NAYAGARH 37 0 29 37 31 37 37 37
NUAPADA 17 1 8 16 9 17 17 17
PURI 46 4 43 46 46 46 46 46
RAYAGADA 36 6 29 35 8 36 36 36
SAMBALPUR 32 0 21 32 16 32 31 32
SONAPUR 18 0 17 17 14 18 18 18
SUNDARGARH 58 4 27 53 27 57 56 58
ODISHA 1234 48 874 1181 833 1225 1224 1231
% OF PHCS NOT REPORTED
% 4 71 96 68 99 99 100
Apr – Oct 2013
40 Odisha HMIS Analysis Report 2013
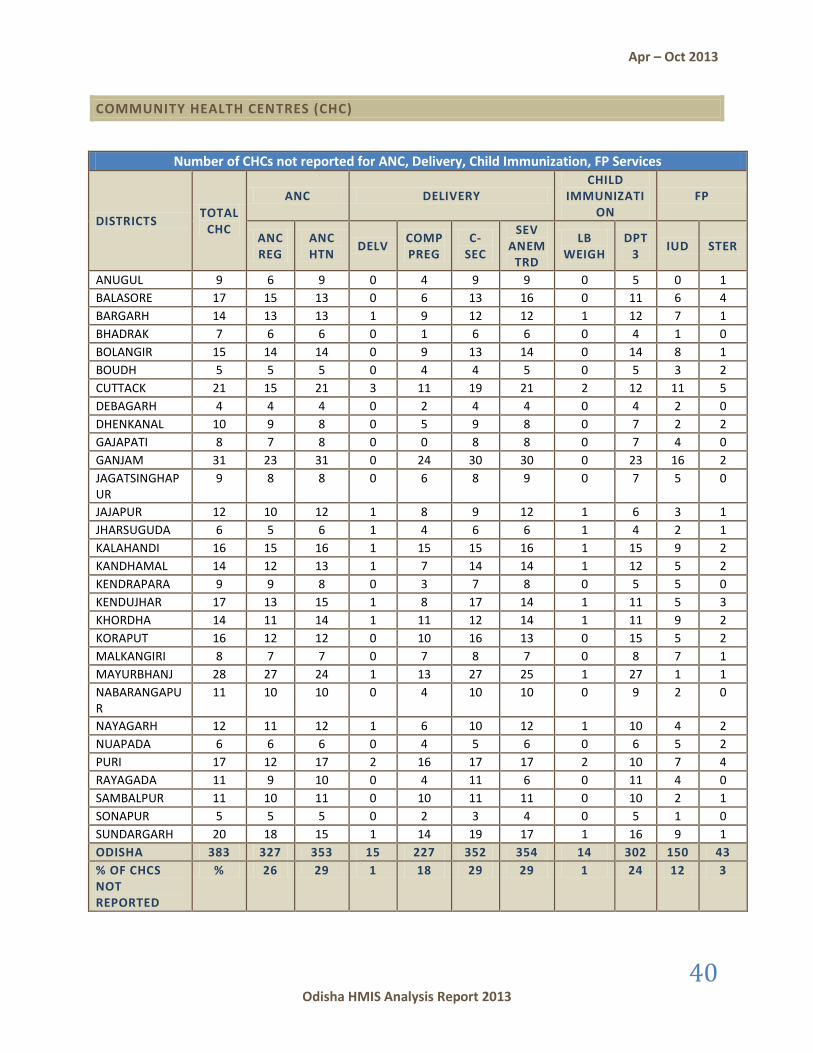
COMMUNITY HEALTH CENTRES (CHC)
Number of CHCs not reported for ANC, Delivery, Child Immunization, FP Services
DISTRICTS TOTAL
CHC
ANC DELIVERY CHILD
IMMUNIZATION
FP
ANC REG
ANC HTN
DELV COMP PREG
C-SEC
SEV ANEM
TRD
LB WEIGH
DPT 3
IUD STER
ANUGUL 9 6 9 0 4 9 9 0 5 0 1
BALASORE 17 15 13 0 6 13 16 0 11 6 4
BARGARH 14 13 13 1 9 12 12 1 12 7 1
BHADRAK 7 6 6 0 1 6 6 0 4 1 0
BOLANGIR 15 14 14 0 9 13 14 0 14 8 1
BOUDH 5 5 5 0 4 4 5 0 5 3 2
CUTTACK 21 15 21 3 11 19 21 2 12 11 5
DEBAGARH 4 4 4 0 2 4 4 0 4 2 0
DHENKANAL 10 9 8 0 5 9 8 0 7 2 2
GAJAPATI 8 7 8 0 0 8 8 0 7 4 0
GANJAM 31 23 31 0 24 30 30 0 23 16 2
JAGATSINGHAPUR
9 8 8 0 6 8 9 0 7 5 0
JAJAPUR 12 10 12 1 8 9 12 1 6 3 1
JHARSUGUDA 6 5 6 1 4 6 6 1 4 2 1
KALAHANDI 16 15 16 1 15 15 16 1 15 9 2
KANDHAMAL 14 12 13 1 7 14 14 1 12 5 2
KENDRAPARA 9 9 8 0 3 7 8 0 5 5 0
KENDUJHAR 17 13 15 1 8 17 14 1 11 5 3
KHORDHA 14 11 14 1 11 12 14 1 11 9 2
KORAPUT 16 12 12 0 10 16 13 0 15 5 2
MALKANGIRI 8 7 7 0 7 8 7 0 8 7 1
MAYURBHANJ 28 27 24 1 13 27 25 1 27 1 1
NABARANGAPUR
11 10 10 0 4 10 10 0 9 2 0
NAYAGARH 12 11 12 1 6 10 12 1 10 4 2
NUAPADA 6 6 6 0 4 5 6 0 6 5 2
PURI 17 12 17 2 16 17 17 2 10 7 4
RAYAGADA 11 9 10 0 4 11 6 0 11 4 0
SAMBALPUR 11 10 11 0 10 11 11 0 10 2 1
SONAPUR 5 5 5 0 2 3 4 0 5 1 0
SUNDARGARH 20 18 15 1 14 19 17 1 16 9 1
ODISHA 383 327 353 15 227 352 354 14 302 150 43
% OF CHCS NOT REPORTED
% 26 29 1 18 29 29 1 24 12 3
Apr – Oct 2013
41 Odisha HMIS Analysis Report 2013
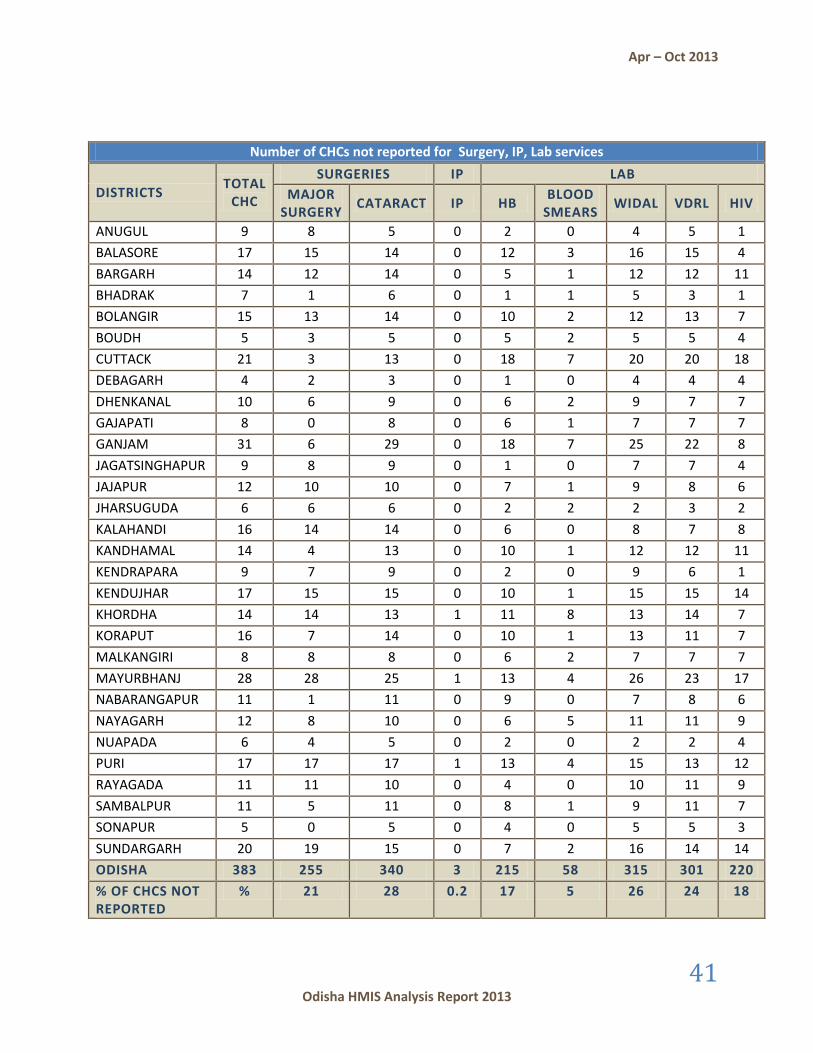
Number of CHCs not reported for Surgery, IP, Lab services
DISTRICTS TOTAL
CHC
SURGERIES IP LAB
MAJOR SURGERY
CATARACT IP HB BLOOD
SMEARS WIDAL VDRL HIV
ANUGUL 9 8 5 0 2 0 4 5 1
BALASORE 17 15 14 0 12 3 16 15 4
BARGARH 14 12 14 0 5 1 12 12 11
BHADRAK 7 1 6 0 1 1 5 3 1
BOLANGIR 15 13 14 0 10 2 12 13 7
BOUDH 5 3 5 0 5 2 5 5 4
CUTTACK 21 3 13 0 18 7 20 20 18
DEBAGARH 4 2 3 0 1 0 4 4 4
DHENKANAL 10 6 9 0 6 2 9 7 7
GAJAPATI 8 0 8 0 6 1 7 7 7
GANJAM 31 6 29 0 18 7 25 22 8
JAGATSINGHAPUR 9 8 9 0 1 0 7 7 4
JAJAPUR 12 10 10 0 7 1 9 8 6
JHARSUGUDA 6 6 6 0 2 2 2 3 2
KALAHANDI 16 14 14 0 6 0 8 7 8
KANDHAMAL 14 4 13 0 10 1 12 12 11
KENDRAPARA 9 7 9 0 2 0 9 6 1
KENDUJHAR 17 15 15 0 10 1 15 15 14
KHORDHA 14 14 13 1 11 8 13 14 7
KORAPUT 16 7 14 0 10 1 13 11 7
MALKANGIRI 8 8 8 0 6 2 7 7 7
MAYURBHANJ 28 28 25 1 13 4 26 23 17
NABARANGAPUR 11 1 11 0 9 0 7 8 6
NAYAGARH 12 8 10 0 6 5 11 11 9
NUAPADA 6 4 5 0 2 0 2 2 4
PURI 17 17 17 1 13 4 15 13 12
RAYAGADA 11 11 10 0 4 0 10 11 9
SAMBALPUR 11 5 11 0 8 1 9 11 7
SONAPUR 5 0 5 0 4 0 5 5 3
SUNDARGARH 20 19 15 0 7 2 16 14 14
ODISHA 383 255 340 3 215 58 315 301 220
% OF CHCS NOT REPORTED
% 21 28 0.2 17 5 26 24 18

Apr – Oct 2013
42 Odisha HMIS Analysis Report 2013
SCORING OF DISTRICTS FOR HEALTH FACILITIES PERFORMANCE
Each district has scored for each health facility type based on 41 key indicators. It will be appropriate to look into the scoring of each district for each health facility type so as to do interventions which are information based.
The following districts showing poor score for SCs, PHCs and CHCs
DISTRICTS OF ODISHA WITH POOR SCORING FOR HEALTH FACILITIES PERFORMANCE
SC (8 INDICATORS)
PHC (15 INDICATORS)
CHC (18 INDICATORS)
OVERALL (41 INDICATORS)
CUTTACK PURI KHORDHA PURI
JAGATSINGHAPUR JAGATSINGHAPUR PURI KHORDHA
PURI KHORDHA BOUDH BOUDH
GAJAPATI BOUDH MALKANGIRI CUTTACK
KANDHAMAL SONAPUR CUTTACK JAGATSINGHAPUR
KORAPUT BALASORE NAYAGARH NAYAGARH
JAJAPUR CUTTACK KANDHAMAL SONAPUR
SAMBALPUR NAYAGARH MAYURBHANJ BARGARH
NABARANGAPUR BARGARH BARGARH MAYURBHANJ
KALAHANDI MAYURBHANJ KALAHANDI GAJAPATI
The Districts listed for Performance of health facilities for SCs, PHCs and CHCs need intervention for their facility type. When the scores for each facility type has aggregated for each indicator and based on overall scoring, the districts shown poor scoring in all the health facility type is listed under overall (column 5) of Table above. The table shows the shows poor scoring districts from above downwards.

Apr – Oct 2013
43 Odisha HMIS Analysis Report 2013
RANKING OF DISTRICTS FOR HEALTH FACILITIES PERFORMANCE
HEALTH FACILITIES PERFORMANCE
DISTRICT SC
SCORE PHC
SCORE CHC
SCORE TOTAL SCORE
Z SCORE
RANKING
PURI -8 -49 -27 -84 -2.38 RANK 30
KHORDHA 16 -41 -29 -54 -1.67 RANK 29
BOUDH 8 -37 -24 -53 -1.64 RANK 28
CUTTACK -10 -27 -12 -49 -1.55 RANK 27
JAGATSINGHAPUR -9 -41 23 -27 -1.02 RANK 26
NAYAGARH 13 -24 -11 -22 -0.90 RANK 25
SONAPUR 13 -36 16 -7 -0.55 RANK 24
BARGARH 12 -13 -4 -5 -0.50 RANK 23
MAYURBHANJ 12 -12 -5 -5 -0.50 RANK 22
GAJAPATI -7 0 5 -2 -0.43 RANK 21
KANDHAMAL -6 12 -7 -1 -0.40 RANK 20
BOLANGIR 12 -4 5 13 -0.07 RANK 19
BALASORE 21 -28 21 14 -0.05 RANK 18
KALAHANDI 5 14 -1 18 0.05 RANK 17
MALKANGIRI 12 22 -16 18 0.05 RANK 16
JAJAPUR -3 7 18 22 0.14 RANK 15
RAYAGADA 18 -10 15 23 0.17 RANK 14
GANJAM 7 4 14 25 0.22 RANK 13
SAMBALPUR -1 34 0 33 0.41 RANK 12
KORAPUT -4 9 29 34 0.43 RANK 11
DEBAGARH 22 8 7 37 0.50 RANK 10
KENDUJHAR 27 6 5 38 0.53 RANK 9
NUAPADA 16 15 13 44 0.67 RANK 8
KENDRAPARA 14 4 32 50 0.81 RANK 7
NABARANGAPUR 4 22 30 56 0.95 RANK 6
JHARSUGUDA 19 40 0 59 1.03 RANK 5
SUNDARGARH 23 29 11 63 1.12 RANK 4
BHADRAK 11 -1 55 65 1.17 RANK 3
DHENKANAL 23 46 18 87 1.69 RANK 2
ANUGUL 14 31 43 88 1.72 RANK 1

Apr – Oct 2013
44 Odisha HMIS Analysis Report 2013
GIS VISUALISATION FOR HEALTH FACILITIES PERFORMANCE
HEALTH FACILITIES RANKING - SC

Apr – Oct 2013
45 Odisha HMIS Analysis Report 2013
HEALTH FACILITIES RANKING - PHC

Apr – Oct 2013
46 Odisha HMIS Analysis Report 2013
HEALTH FACILITIES RANKING - CHC

Apr – Oct 2013
47 Odisha HMIS Analysis Report 2013
HEALTH FACILITIES RANKING - OVERALL
Apr – Oct 2013
48 Odisha HMIS Analysis Report 2013
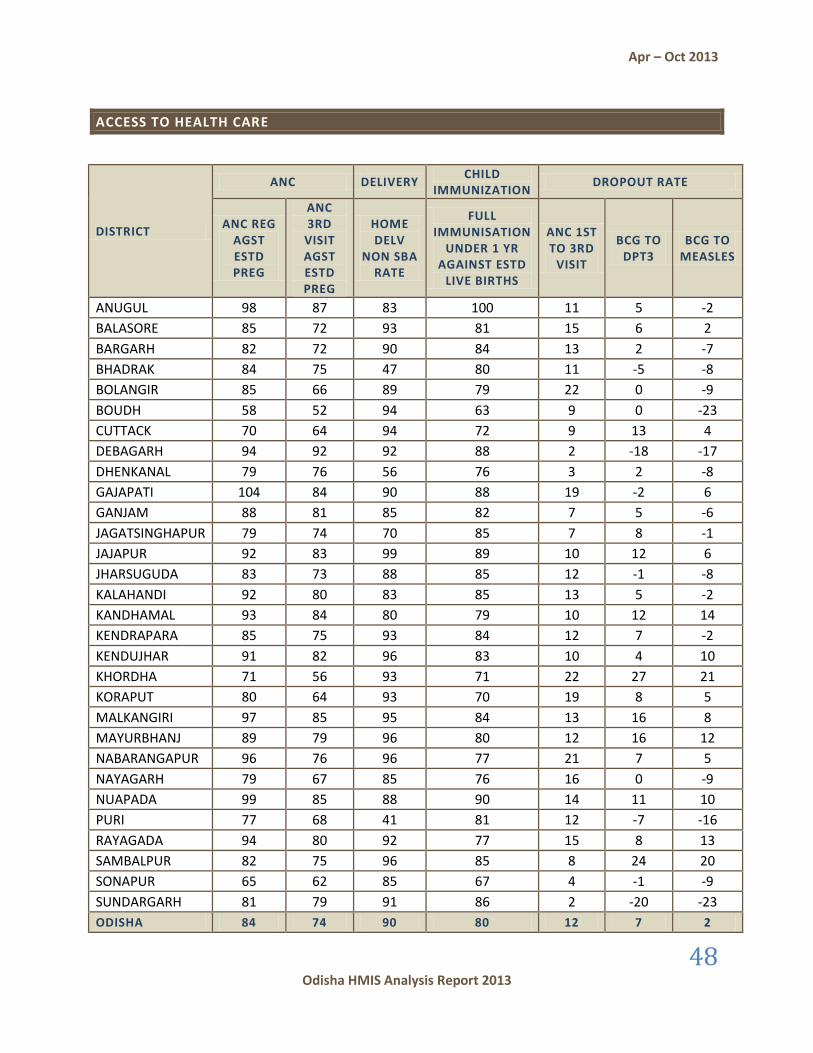
ACCESS TO HEALTH CARE
DISTRICT
ANC DELIVERY CHILD
IMMUNIZATION DROPOUT RATE
ANC REG AGST ESTD PREG
ANC 3RD
VISIT AGST ESTD PREG
HOME DELV
NON SBA RATE
FULL IMMUNISATION
UNDER 1 YR AGAINST ESTD
LIVE BIRTHS
ANC 1ST TO 3RD
VISIT
BCG TO DPT3
BCG TO MEASLES
ANUGUL 98 87 83 100 11 5 -2
BALASORE 85 72 93 81 15 6 2
BARGARH 82 72 90 84 13 2 -7
BHADRAK 84 75 47 80 11 -5 -8
BOLANGIR 85 66 89 79 22 0 -9
BOUDH 58 52 94 63 9 0 -23
CUTTACK 70 64 94 72 9 13 4
DEBAGARH 94 92 92 88 2 -18 -17
DHENKANAL 79 76 56 76 3 2 -8
GAJAPATI 104 84 90 88 19 -2 6
GANJAM 88 81 85 82 7 5 -6
JAGATSINGHAPUR 79 74 70 85 7 8 -1
JAJAPUR 92 83 99 89 10 12 6
JHARSUGUDA 83 73 88 85 12 -1 -8
KALAHANDI 92 80 83 85 13 5 -2
KANDHAMAL 93 84 80 79 10 12 14
KENDRAPARA 85 75 93 84 12 7 -2
KENDUJHAR 91 82 96 83 10 4 10
KHORDHA 71 56 93 71 22 27 21
KORAPUT 80 64 93 70 19 8 5
MALKANGIRI 97 85 95 84 13 16 8
MAYURBHANJ 89 79 96 80 12 16 12
NABARANGAPUR 96 76 96 77 21 7 5
NAYAGARH 79 67 85 76 16 0 -9
NUAPADA 99 85 88 90 14 11 10
PURI 77 68 41 81 12 -7 -16
RAYAGADA 94 80 92 77 15 8 13
SAMBALPUR 82 75 96 85 8 24 20
SONAPUR 65 62 85 67 4 -1 -9
SUNDARGARH 81 79 91 86 2 -20 -23
ODISHA 84 74 90 80 12 7 2
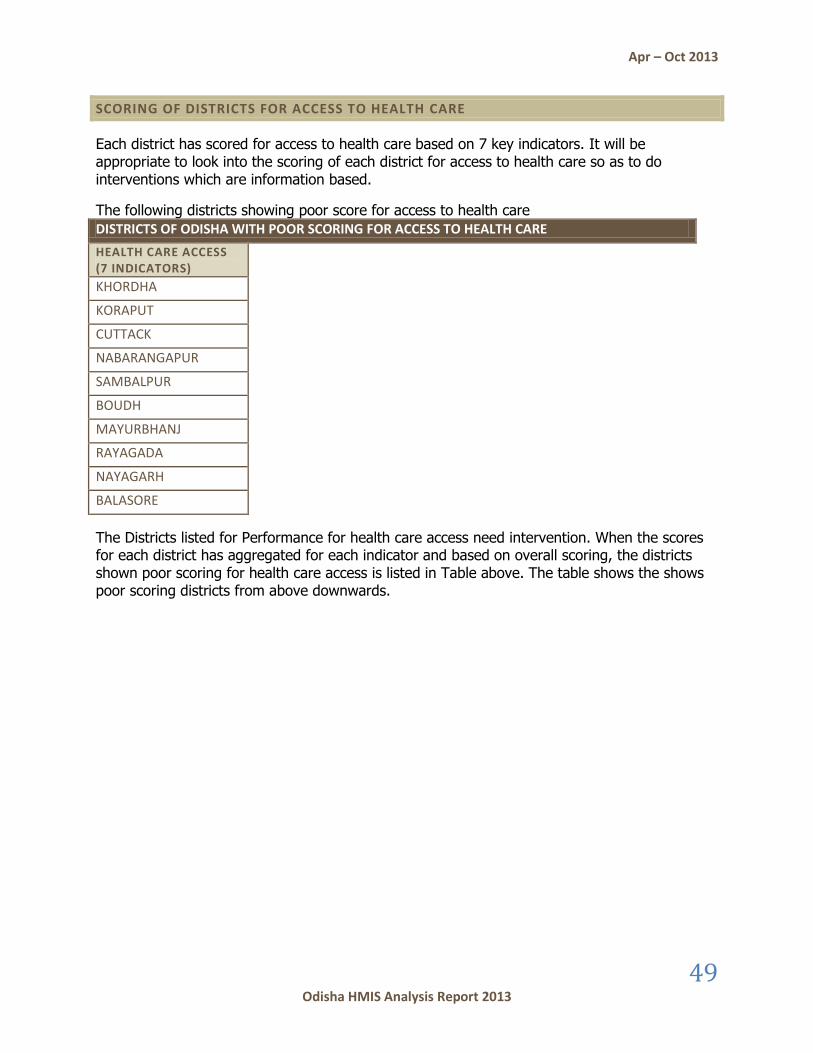
Apr – Oct 2013
49 Odisha HMIS Analysis Report 2013
SCORING OF DISTRICTS FOR ACCESS TO HEALTH CARE
Each district has scored for access to health care based on 7 key indicators. It will be appropriate to look into the scoring of each district for access to health care so as to do interventions which are information based.
The following districts showing poor score for access to health care
DISTRICTS OF ODISHA WITH POOR SCORING FOR ACCESS TO HEALTH CARE
HEALTH CARE ACCESS (7 INDICATORS)
KHORDHA
KORAPUT
CUTTACK
NABARANGAPUR
SAMBALPUR
BOUDH
MAYURBHANJ
RAYAGADA
NAYAGARH
BALASORE
The Districts listed for Performance for health care access need intervention. When the scores for each district has aggregated for each indicator and based on overall scoring, the districts shown poor scoring for health care access is listed in Table above. The table shows the shows poor scoring districts from above downwards.

Apr – Oct 2013
50 Odisha HMIS Analysis Report 2013
RANKING OF DISTRICTS FOR ACCESS TO HEALTH CARE
ACCESS TO HEALTH CARE (7 INDICATORS)
DISTRICT TOTAL SCORE
Z SCORE RANKING
KHORDHA -24 -2.61 RANK 30
KORAPUT -15 -1.70 RANK 29
CUTTACK -14 -1.60 RANK 28
NABARANGAPUR -7 -0.89 RANK 27
SAMBALPUR -6 -0.79 RANK 26
BOUDH -5 -0.69 RANK 25
MAYURBHANJ -5 -0.69 RANK 24
RAYAGADA -4 -0.58 RANK 23
NAYAGARH -3 -0.48 RANK 22
BALASORE -2 -0.38 RANK 21
BOLANGIR 0 -0.18 RANK 20
MALKANGIRI 0 -0.18 RANK 19
SONAPUR 0 -0.18 RANK 18
BARGARH 1 -0.08 RANK 17
KENDRAPARA 1 -0.08 RANK 16
JAJAPUR 4 0.23 RANK 15
KANDHAMAL 4 0.23 RANK 14
KENDUJHAR 5 0.33 RANK 13
JHARSUGUDA 6 0.43 RANK 12
JAGATSINGHAPUR 7 0.53 RANK 11
NUAPADA 7 0.53 RANK 10
PURI 7 0.53 RANK 9
DHENKANAL 8 0.63 RANK 8
GAJAPATI 9 0.74 RANK 7
KALAHANDI 10 0.84 RANK 6
GANJAM 13 1.14 RANK 5
SUNDARGARH 14 1.24 RANK 4
BHADRAK 15 1.34 RANK 3
ANUGUL 18 1.65 RANK 2
DEBAGARH 21 1.95 RANK 1
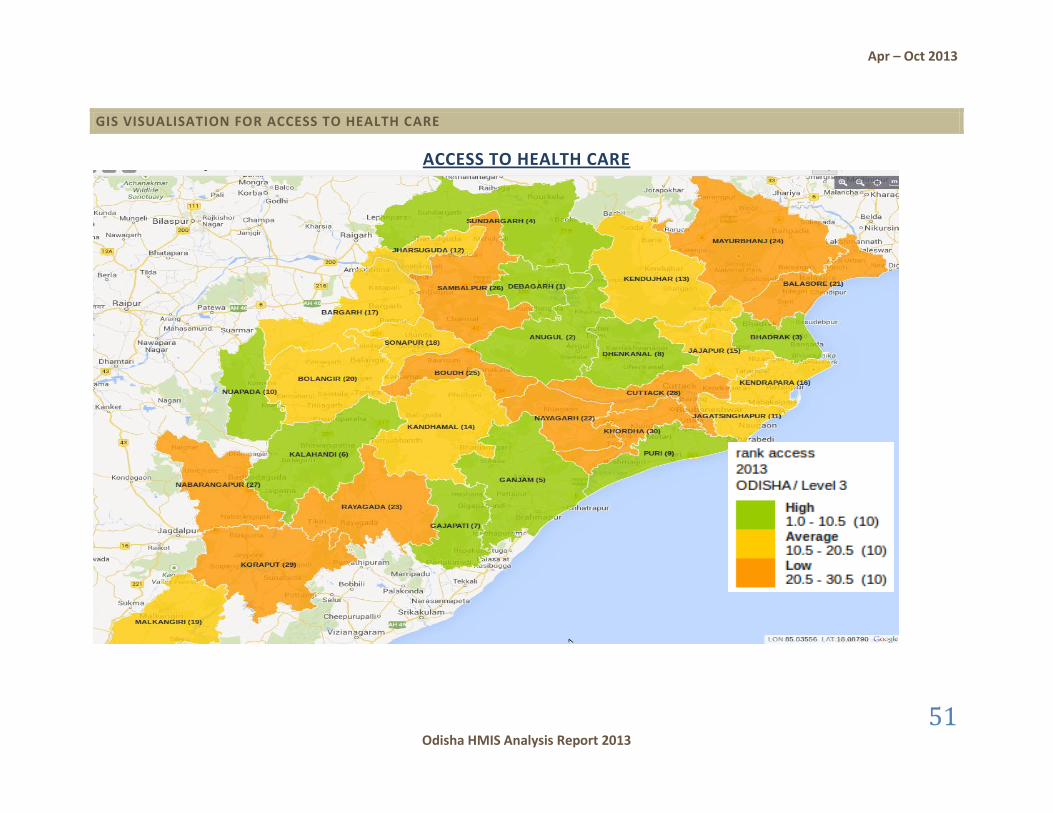
Apr – Oct 2013
51 Odisha HMIS Analysis Report 2013
GIS VISUALISATION FOR ACCESS TO HEALTH CARE
ACCESS TO HEALTH CARE

Apr – Oct 2013
52 Odisha HMIS Analysis Report 2013
OVERALL SCORING FOR DISTRICTS
Total scoring has done for all the districts based on the service delivery (life cycle approach), health facilities performance and access to health care.
DISTRICTS OF ODISHA WITH POOR SCORING (OVERALL SCORING)
SERVICE DELIVERY (16 INDICATORS)
HEALTH FACILITIES PERFORMANCE (41 INDICATORS)
ACCESS TO HEALTH CARE (7 INDICATORS)
OVERALL (64 INDICATORS)
RAYAGADA PURI KHORDHA KHORDHA
GAJAPATI KHORDHA KORAPUT CUTTACK
KORAPUT BOUDH CUTTACK PURI
MALKANGIRI CUTTACK NABARANGAPUR BOUDH
NABARANGAPUR JAGATSINGHAPUR SAMBALPUR NAYAGARH
BOLANGIR NAYAGARH BOUDH SONAPUR
GANJAM SONAPUR MAYURBHANJ GAJAPATI
JAJAPUR BARGARH RAYAGADA MAYURBHANJ
KENDRAPARA MAYURBHANJ NAYAGARH RAYAGADA
SONAPUR GAJAPATI BALASORE JAGATSINGHAPUR
The table shows the shows poor scoring districts from above downwards.
SERVICE DELIVERY
•Pregnancy care
•Child birth
•PNC & Newborn care
•Reproductive age group
HEALTH FACILITIESPERFORMANCE
•SCs
•PHCs
•CHCs
ACCESS TO
HEALTH CARE
•Gaps/ Outreach
•Dropout

Apr – Oct 2013
53 Odisha HMIS Analysis Report 2013
OVERALL RANKING FOR DISTRICTS
OVERALL RANKING FOR DISTRICTS
DISTRICT SERVICE DELIVERY SCORE
ACCESS TO HEALTH
CARE SCORE
HEALTH FACILITIES
PERFORMANCE SCORE
TOTAL SCORE
Z SCORE
RANKING
KHORDHA -6 -24 -54 -84 -1.99 RANK 30
CUTTACK -4 -14 -49 -67 -1.65 RANK 29
PURI 13 7 -84 -64 -1.59 RANK 28
BOUDH 0 -5 -53 -58 -1.48 RANK 27
NAYAGARH -5 -3 -22 -30 -0.92 RANK 26
SONAPUR -9 0 -7 -16 -0.65 RANK 25
GAJAPATI -22 9 -2 -15 -0.63 RANK 24
MAYURBHANJ 2 -5 -5 -8 -0.49 RANK 23
RAYAGADA -24 -4 23 -5 -0.43 RANK 22
JAGATSINGHAPUR 18 7 -27 -2 -0.37 RANK 21
KORAPUT -21 -15 34 -2 -0.37 RANK 20
BARGARH 5 1 -5 1 -0.31 RANK 19
MALKANGIRI -16 0 18 2 -0.29 RANK 18
BOLANGIR -10 0 13 3 -0.27 RANK 17
KANDHAMAL 10 4 -1 13 -0.08 RANK 16
BALASORE 3 -2 14 15 -0.04 RANK 15
JAJAPUR -10 4 22 16 -0.02 RANK 14
GANJAM -10 13 25 28 0.22 RANK 13
SAMBALPUR 7 -6 33 34 0.34 RANK 12
KALAHANDI 8 10 18 36 0.38 RANK 11
NABARANGAPUR -12 -7 56 37 0.40 RANK 10
KENDUJHAR -4 5 38 39 0.43 RANK 9
KENDRAPARA -9 1 50 42 0.49 RANK 8
NUAPADA -6 7 44 45 0.55 RANK 7
DEBAGARH -1 21 37 57 0.79 RANK 6
JHARSUGUDA 13 6 59 78 1.20 RANK 5
BHADRAK 11 15 65 91 1.46 RANK 4
SUNDARGARH 24 14 63 101 1.66 RANK 3
ANUGUL 1 18 88 107 1.77 RANK 2
DHENKANAL 19 8 87 114 1.91 RANK 1

Apr – Oct 2013
54 Odisha HMIS Analysis Report 2013
GIS VISUALIZATION FOR OVERALL RANKING
OVERALL RANKING FOR DISTRICTS

Apr – Oct 2013
55 Odisha HMIS Analysis Report 2013
DISCUSSION
The Odisha state has shown overall progress in Health Management Information Systems in terms of reporting, data completeness, data timeliness and service delivery. The coverage and quality of service delivery has been shown improvement in 2013. In Odisha, facility wise data entry has been processed since Oct 2010 and there is significant increase in data reporting of health facilities since Apr 2011.
About service delivery, there is significant increase in access to antenatal care services and delivery services in 2013. The indicators for coverage and quality of antenatal care services have shown improvement when compared with previous year.
The percentage of pregnant women registered for Ante-Natal care services are increased by 9% from 42% in 2012 to 51% in 2013 which shows the awareness among the population and increased access to ante-natal care services. Sonapur, Debagarh, Jharsuguda and Ganjam districts show 19, 28, 28 and 30 and when we drill down to Sonapur districts, Dunguripalli Block shows very less % for ANC registration in 1st trimester rate.
In case of mortality, the infant mortality rate for Odisha is 18 per 1000 live births. The reporting of infant deaths has improved in the state. In 2012, the districts of Odisha have reported less than 10 infant deaths per 1000 live births.
DISTRICT IMR PERINATAL
MORTALITY RATE
NUAPADA 54 85
NABARANGAPUR 48 74
MALKANGIRI 42 59
KALAHANDI 38 57
BOUDH 35 53
BOLANGIR 33 49
KORAPUT 32 46
In case of maternal mortality ratio (MMR), Odisha shows 108 Maternal deaths per 100,000 live births and there are 16 districts reported more than 100 maternal deaths per 100,000 live births and these districts need to be focused for further improvement in pregnancy and delivery care services.

Apr – Oct 2013
56 Odisha HMIS Analysis Report 2013
DISTRICTS INFANT
MORTALITY RATE
MATERNAL MORTALITY
RATIO
DEBAGARH 22 536
BOUDH 35 395
BARGARH 30 294
NUAPADA 54 235
MALKANGIRI 42 227
NABARANGAPUR 48 222
KANDHAMAL 28 200
SONAPUR 25 196
KALAHANDI 38 189
BOLANGIR 33 186
SUNDARGARH 22 172
MAYURBHANJ 23 122
GAJAPATI 10 121
KORAPUT 32 119
KENDUJHAR 21 119
BALASORE 19 118

Apr – Oct 2013
57 Odisha HMIS Analysis Report 2013
RECOMMENDED ACTION
Ante-Natal Care
Improved access to Ante-Natal care services is a good sign of improvement and there should be improvisation of quality of Ante-Natal care services in terms of identifying high risk pregnancies at the earliest and treat or refer to higher facilities. The State should ensure that every pregnant woman should have received quality in ANC check up like examination, blood pressure, blood test for hb. The report has provided the number of health facilities district-wise who are not reported any case of ANC hypertension new case, Hb tested and ANC registration from Apr to Oct 2013 and we recommend the state have to act upon these facilities which are not reported above mentioned services to pregnant women. The percentage of pregnant not availed any services is estimated as 16% for Odisha in 2013. Boudh, Sonepur, Cuttack and Khorda shows 42%, 35%, 30% and 29% pregnant women not availed any ante-natal care services which can further enquired for social or geographical barriers for access to ANC.
Reporting Issues in ANC coverage
The state needs to check if there are any reporting issues for ANC TT2/ Booster coverage and ANC third visit. We have observed similar figures for both of the data elements by some of the health facilities and also when checked with reported figures it shows quite high % for Boudh, Sonepur and Cuttack districts. When the same districts are checked with estimated pregnancies it shows very less % for coverage of ANC services.
Delivery Care
The State has shown improvement in % of institutional delivery which is 88% in 2013 and it has increased by 1% from 87% in 2012. The percentage of delivery by SBA has also increased by 1% and the home delivery has decreased from 18% in 2011, 16% in 2012 and 12% in 2013. The percentage of unreported delivery for Odisha is estimated as 21%. Boudh, Puri, Nayagarh, Sonepur and Khorda districts shows high % for unreported deliveries which is 52%, 49%, 41%, 40% and 31% respectively. Gajapati district shows 52% institutional deliveries against total ANC registered and when we refer ANC registration against estimated pregnancies, it shows 104 % and it implies that there is more % of unreported deliveries in Gajapati. Most of the deliveries in Kasinagar CHC of Gajapati districts are reported as complicated pregnancies. It needs to be enquired whether they are all complicated pregnancies or reporting issues. VSSMC. Burla of Sambalpur districts has not reported any complicated pregnancies attended from Apr to Oct 2013. Angul district shows only 2% for caesarean section delivery rate and the state’s average is 10% and it should be enquired for very less % c-sec reported. 92% of institutional deliveries are discharged under 48 hrs of delivery in Boudh district and it needs serious attention, if most of the institutional deliveries are discharged under 48 hours when GOI says it is mandatory for women should stay atleast 48 hrs after delivery for normal as well as c-sec delivery.

Apr – Oct 2013
58 Odisha HMIS Analysis Report 2013
Post-Natal & Newborn Care
The state shows 94% for Newborn breastfed within 1 hr and it has increased by 1% when compared with previous year. About 30% of Home deliveries in Odisha have not reported to have newborn visited within 24 hours of delivery. Jajapur district shows only 43% of home deliveries where newborn visited within 24 hours. Blocks of Jajapur districts shows very less percentage for home delivery newborn visited within 24 hrs rate and it needs to further enquired why it is not happening. Boudh, Sonapur, Koraput, Khordha and Cuttack districts shows 63, 67, 70, 71 and 72 % respectively for full immunized child less than 1 year against estimated live births.
Reporting Issues for Low birth weight babies
Khandamal district shows 26% for low birth weight babies (less than 2.5 kgs) and SCs of Daringibadi Block has reported more LBW babies and this may be due to reporting issues.
Family Planning Services
Boudh, Cuttack and Puri districts shows very less post-partum sterilization against total female sterilization. In Odisha, 18 districts showing less than 1% for Male sterilization against total sterilization. Malkangiri, Gajapati, Sonapur and Rayagada districts show only 41, 44, 45 and 49% respectively for IUCD against total FP methods including permanent plus IUCD.