october 27, 2005 - city of homer alaska official website · october 27, 2005 1993 to 2003 aadt...
TRANSCRIPT

October 27, 2005
Appendix A
Current AADT and Intersection
Turning Movements

Homer Intersections Planning Study Page A-1 Appendix A October 27, 2005
1993 to 2003 AADT (From Central Region Annual Traffic Annual Traffic Volume Report(s))
Begin End 1993 1994 1995 1996 1997 1998 1999 2000 2001 2002 2003
1993 to 2002
AverageAADT
Sterling Highway
Southwest Marine Highway FAA Road 4,222 4,199 4,268 4,219 4,245 4,022 4,009 4,011 4,023 4,107 4,055 4,133
FAA Road Lake Street 6,900 6,900 7,419 7,600 7,700 8,050 6,263 6,240 5,889 6,111 6,250 6,907
Lake Street Main Street 6,804 6,800 7,122 7,331 7,420 7,759 8,286 8,535 8,587 8,873 9,393 7,752
Main Street Pioneer Avenue 4,800 5,218 5,400 5,500 5,857 6,120 6,230 6,080 6,290 6,490 8,838 5,799
Pioneer Avenue Crittenden Drive 6,500 6,500 6,811 7,000 7,100 7,440 6,962 7,050 7,742 8,957 9,370 7,206
Crittenden Drive West Hill Road 4,400 4,400 6,157 6,300 6,400 6,707 6,830 6,920 6,384 6,590 6,890 6,109
West Hill Road Rogers Loop 3,478 3,500 3,800 4,443 4,672 5,580 4,230 4,210 3,890 4,773 4,960 4,258
Pioneer Avenue
Lake Street Main Street 7,200 7,119 7,400 7,500 6,839 7,080 7,300 7,249 6,534 6,450 6,871 7,067
Main Street Sterling Highway 3,696 3,700 3,800 3,800 5,569 5,730 5,890 6,050 6,020 4,513 4,580 4,877
Lake Street
Sterling Highway Pioneer Avenue 5,500 5,500 5,074 5,100 5,200 5,382 5,550 5,700 6,075 6,000 6,110 5,508
Kachemak Bay Drive
Sterling Highway Lou's Storage 1,828 1,880 1,840 1,578 1,600 1,670 1,720 1,770 1,760 2,100 2,130 1,775
East End Road
Lake Street East Hill Road 6,661 6,879 7,153 7,264 7,416 7,405 7,705 8,001 7,943 7,574 7,776 7,400
East Hill Road Kachemak Bay Drive 4,353 4,450 4,600 4,600 4,700 4,680 4,870 5,060 5,020 4,522 4,650 4,686
East Hill Road
East End Road Mission Road 1,100 1,100 1,458 1,460 1,600 1,732 1,800 1,870 1,789 1,550 1,590 1,546
Bartlett Street
Pioneer Avenue Fairview Avenue 1,490 1,389 1,400 1,400 1,156 1,225 1,270 2,002 2,061 1,518 1,913 1,491
Main Street
Bunnell Avenue Sterling Highway 1,700 1,700 2,000 1,506 1,859 1,850 1,930 2,000 1,933 1,840 1,898 1,832
Sterling Highway Pioneer Avenue 2,000 2,000 2,587 2,500 2,800 2,666 2,770 2,880 2,698 2,570 2,640 2,547
West Hill Road
Sterling Highway Miller Loop 1,197 1,230 1,260 1,300 1,514 1,800 1,404 1,460 1,832 1,810 2,075 1,481

Homer Intersections Planning Study Page A-2 Appendix A October 27, 2005
Estimated 2003/2004 AADT for Additional Locations (From Traffic Counts)
Street Begin End
2003 / 2004AADT
Heath Street Fairview Avenue Pioneer Avenue 475
Heath Street Pioneer Avenue Grubstake 2,300
Heath Street Grubstake Sterling Hwy (Homer Bypass) 4,650
Heath Street Sterling Hwy Homer Public Works 300
Fairview Avenue Homer High School East End Road 500
Main Street Pioneer Avenue Fairview 1,900

Homer Intersections Planning Study Page A-3 Appendix A October 27, 2005
Sterling Highway and West Hill Road
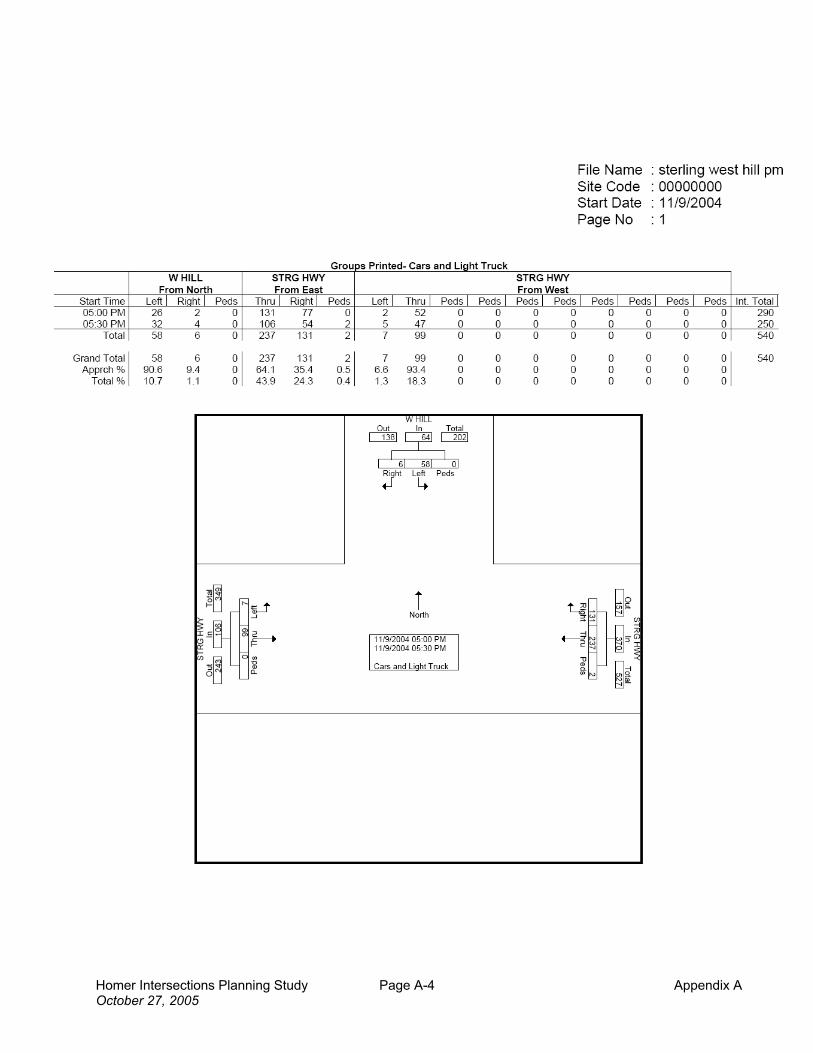
Homer Intersections Planning Study Page A-4 Appendix A October 27, 2005
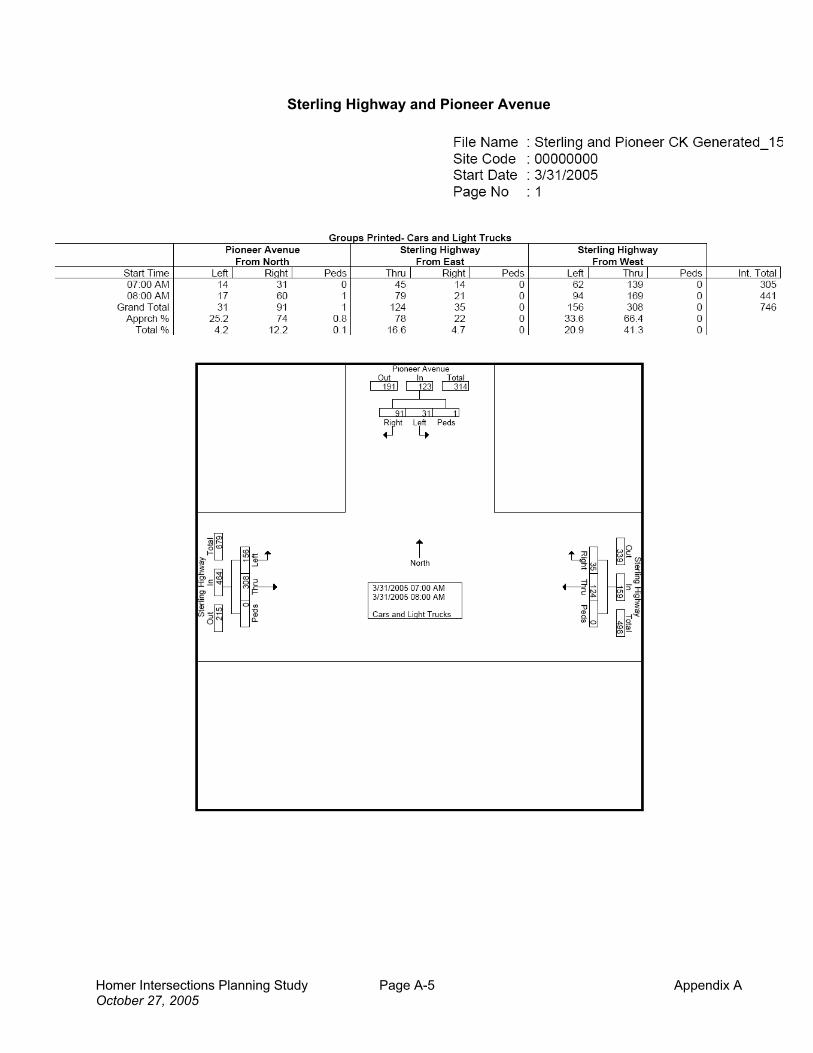
Homer Intersections Planning Study Page A-5 Appendix A October 27, 2005
Sterling Highway and Pioneer Avenue

Homer Intersections Planning Study Page A-6 Appendix A October 27, 2005

Homer Intersections Planning Study Page A-7 Appendix A October 27, 2005
Sterling Highway and Main Street
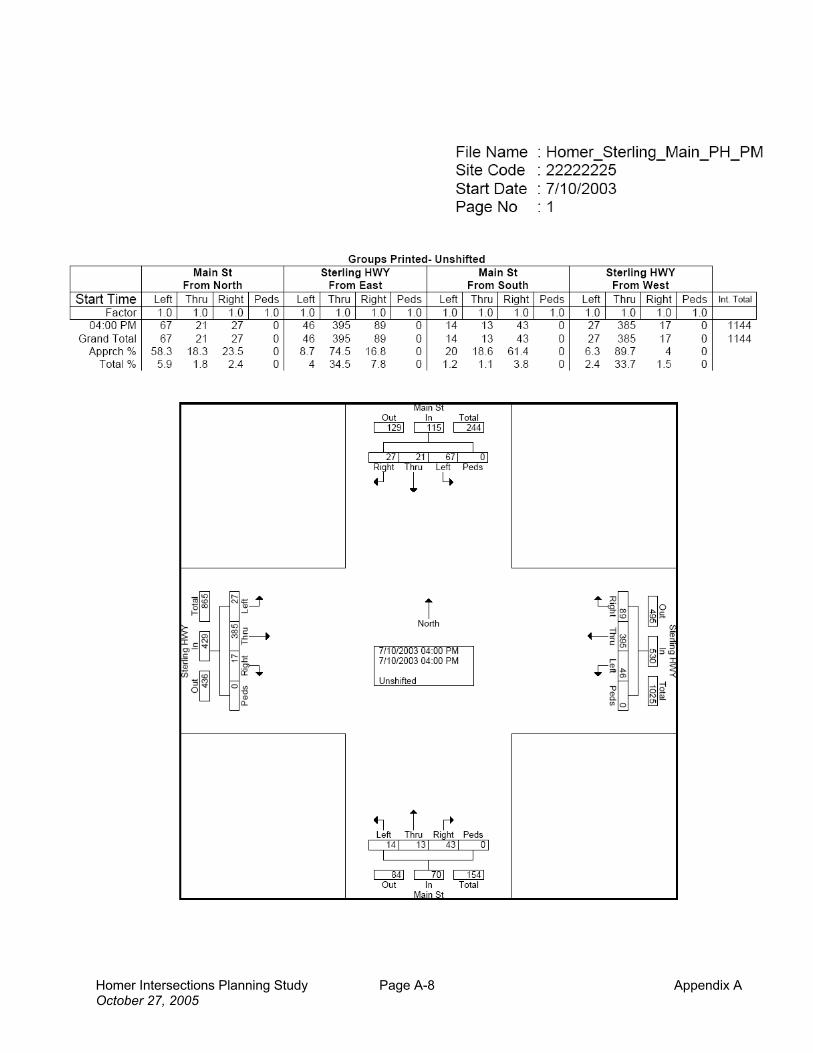
Homer Intersections Planning Study Page A-8 Appendix A October 27, 2005

Homer Intersections Planning Study Page A-9 Appendix A October 27, 2005
Sterling Highway and Heath Street
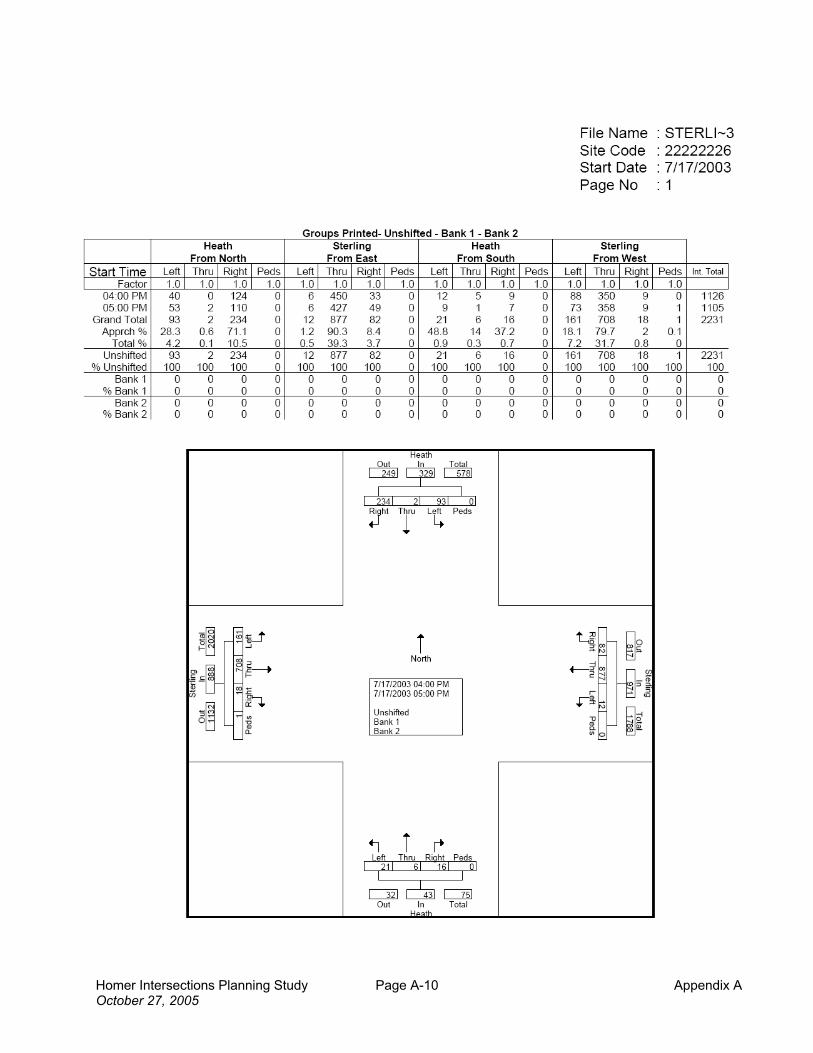
Homer Intersections Planning Study Page A-10 Appendix A October 27, 2005

Homer Intersections Planning Study Page A-11 Appendix A October 27, 2005
Sterling Highway and Lake Street

Homer Intersections Planning Study Page A-12 Appendix A October 27, 2005

Homer Intersections Planning Study Page A-13 Appendix A October 27, 2005
Sterling Highway and Kachemak Bay Drive

Homer Intersections Planning Study Page A-14 Appendix A October 27, 2005

Homer Intersections Planning Study Page A-15 Appendix A October 27, 2005
Pioneer Avenue and Bartlett Street
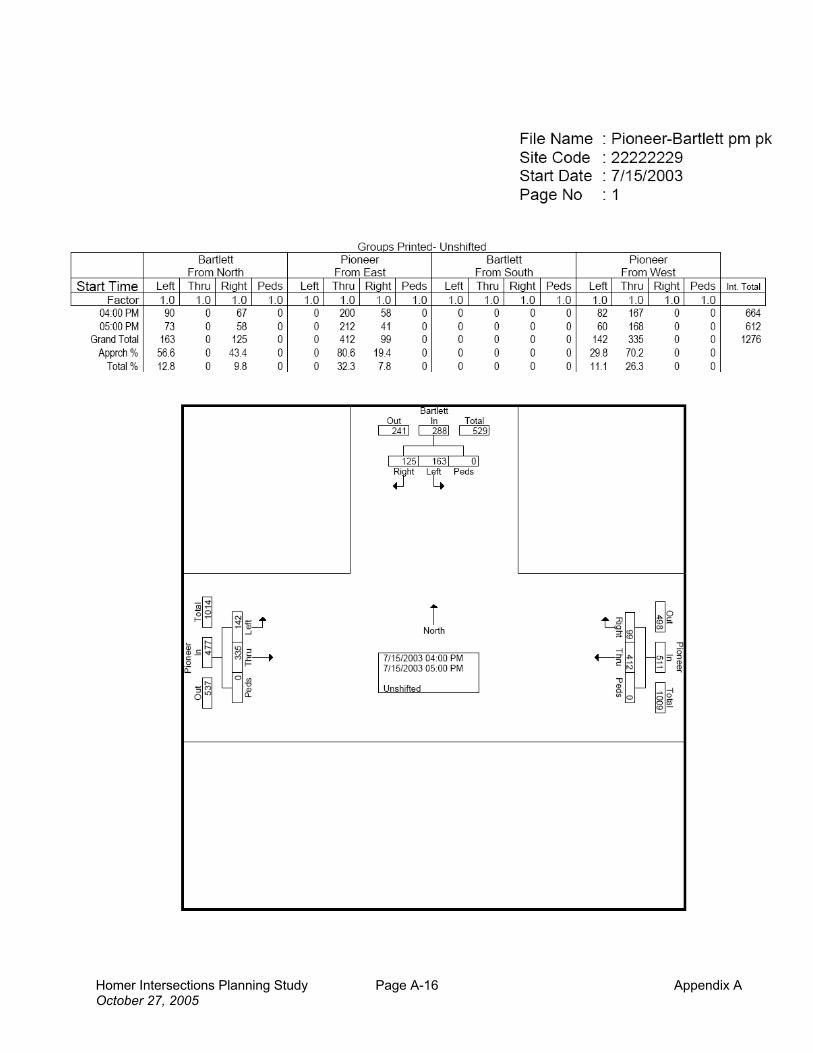
Homer Intersections Planning Study Page A-16 Appendix A October 27, 2005

Homer Intersections Planning Study Page A-17 Appendix A October 27, 2005
Pioneer Avenue and Main Street

Homer Intersections Planning Study Page A-18 Appendix A October 27, 2005

Homer Intersections Planning Study Page A-19 Appendix A October 27, 2005
Pioneer Avenue and Heath Street

Homer Intersections Planning Study Page A-20 Appendix A October 27, 2005

Homer Intersections Planning Study Page A-21 Appendix A October 27, 2005
Pioneer Avenue/ East End Road and Lake Street

Homer Intersections Planning Study Page A-22 Appendix A October 27, 2005

Homer Intersections Planning Study Page A-23 Appendix A October 27, 2005
East End Road and East Hill Road

Homer Intersections Planning Study Page A-24 Appendix A October 27, 2005

Homer Intersections Planning Study Page A-25 Appendix A October 27, 2005
Pioneer Avenue and Heath Street-School Year

Homer Intersections Planning Study Page A-26 Appendix A October 27, 2005

Homer Intersections Planning Study Page A-27 Appendix A October 27, 2005
Pioneer Avenue/ East End Road and Lake Street-School Year
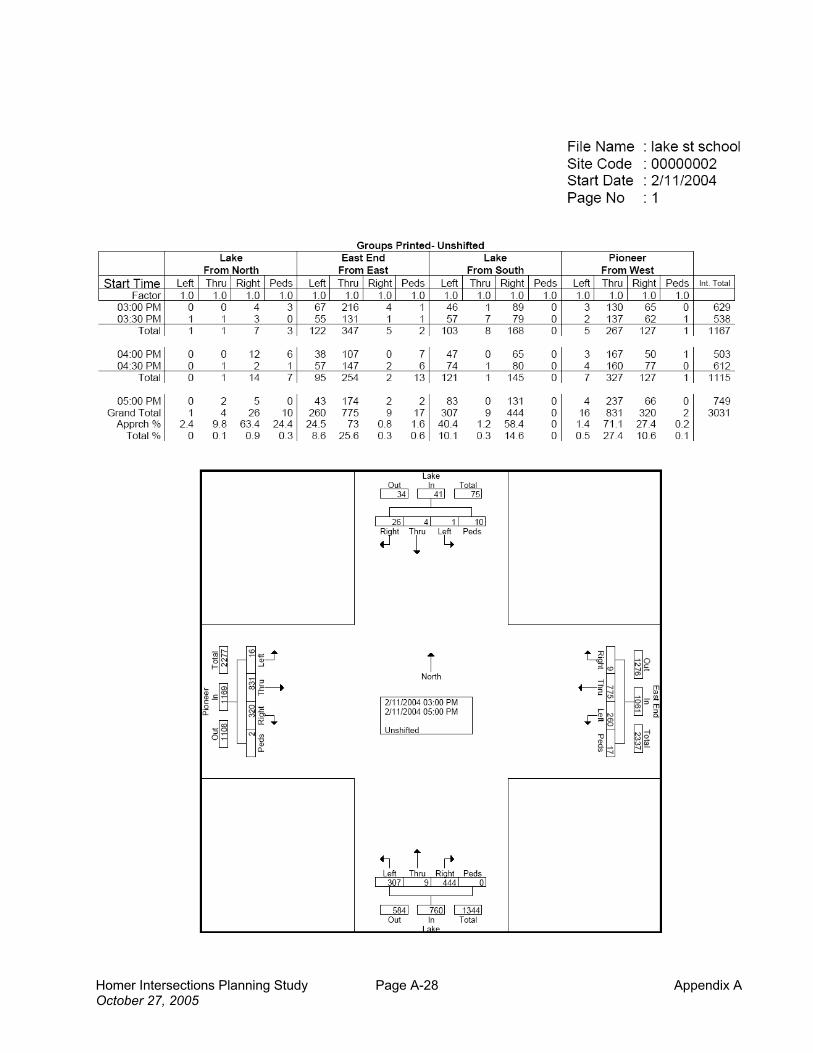
Homer Intersections Planning Study Page A-28 Appendix A October 27, 2005

Homer Intersections Planning Study Page A-29 Appendix A October 27, 2005
East End Road and East Hill Road

Homer Intersections Planning Study Page A-30 Appendix A October 27, 2005
Appendix B
Future AADT (2011 and 2021) and
Intersection Turning Movements (2004 and 2021

Homer Intersections Planning Study Page B-1 Appendix B October 27, 2005
Homer Streets Forecasts (Except Heath Street, see below)
Begin End
CentralRegionAADT's
2003
2003Summer
ConversionFactor
Summer2003
By Linear
Extapol-ation2011
By Avg AnnualGrowth
2011
Est.FutureADT2021
‘03 to '21 Avg
AnnualGrowth
Rate
‘03 to '21 SegmentWeightedGrowth
Growth Factor2003-2021
Sterling Highway CDS Route 110000
SouthwestMarine Hwy
FAA Road 4,055 2.15 8,714 10,373 10,210 12,446 2.00% 1.43
FAA Road Lake Street 6,250 1.38 8,638 10,281 10,120 12,336 2.00% 1.43
Lake Street Main Street 9,393 1.38 12,981 15,452 15,209 18,540 2.00% 1.43
Main StreetPioneerAvenue
8,838 1.38 12,214 14,539 14,311 17,445 2.00% 1.43
PioneerAvenue
CrittendenDrive
9,370 1.38 12,949 15,414 15,172 18,495 2.00% 1.43
CrittendenDrive
West Hill Rd.
6,890 1.38 9,522 11,334 11,157 13,600 2.00% 1.43
West Hill Road RogersLoop
4,960 1.38 6,855 8,159 8,031 9,790 2.00%
2.00%
1.43
Pioneer Avenue CDS Route 110100
Lake Street Main Street 6,871 1.16 7,977 9,496 9,347 11393 2.00% 1.43
Main StreetSterlingHighway
4,580 1.16 5,317 6,329 6,230 7595 2.00% 2.00%
1.43
Lake Street CDS Route 110150
SterlingHighway
PioneerAvenue
6,110 1.16 7,094 7,768 7,732 8612 1.08% 1.08% 1.21
Kachemak Bay Drive CDS Route 110200
SterlingHighway
Lou'sStorage
2,130 1.38 2,944 3,504 3,449 4204 2.00% 2.00% 1.43

Homer Intersections Planning Study Page B-2 Appendix B October 27, 2005
Begin End
CentralRegionAADT's
2003
2003Summer
ConversionFactor
Summer2003
By Linear
Extapol-ation2011
By Avg AnnualGrowth
2011
Est.FutureADT2021
‘03 to '21 Avg
AnnualGrowth
Rate
‘03 to '21 SegmentWeightedGrowth
Growth Factor2003-2021
East End Road CDS Route 110300
Lake StreetEast Hill Road
7,776 1.16 9,028 10,746 10,578 12894 2.00% 1.43
East Hill RoadKachemakBay Drive
4,650 1.16 5,399 6,426 6,325 7711 2.00%
2.00%
1.43
East Hill Road CDS Route 110305
East End Road
Mission Road
1,590 1.16 1,846 2,197 2,163 2637 2.00% 2.00% 1.43
Bartlett Street CDS Route 110500
PioneerAvenue
FairviewAvenue
1,913 1.16 2,221 2,644 2,602 3172 2.00% 2.00% 1.4
Olson Lane CDS Route 110615
SterlingHighway
BunnellAvenue
680 1.38 940 1,119 1,101 1342 2.00% 2.00% 1.43
Main Street CDS Route 110625
BunnellAvenue
SterlingHighway
1,898 1.16 2,204 2,623 2,582 3147 2.00% 1.43
SterlingHighway
PioneerAvenue
2,640 1.16 3,065 3,648 3,591 4378 2.00%
2.00%
1.43
West Hill Road CDS Route 110800
SterlingHighway
Miller Loop 2,075 1.38 2,868 3,412 3,360 4092 2.00% 2.00% 1.43
Heath Street AADT Forecasts

Homer Intersections Planning Study Page B-3 Appendix B October 27, 2005
Heath Street Location
SummerPeak
Hour Link Volume
(vph)
Day to week factor
AADTPeakHour
FactorEstimated
2003
By LinearExtr.2011
By Avg AnnualGrowth
2011
Est.FutureADT2021
AvgAnnualGrowth
Rate
Growth Factor '03-'21
North of Pioneer Ave 70 104.6% 8.8% 761 1,468 1,256 2,353 6.48% 3.09
South of Pioneer Ave 278 104.6% 8.8% 3,020 4,277 4,051 5,848 3.74% 1.94
North of Sterling Hwy 291 109.6% 8.8% 3,017 4,273 4,047 5,842 3.74% 1.94

Homer Intersections Planning Study Page B-4 Appendix B October 27, 2005
2004 (existing) Summer PM Peak Turning Movements
Intersection NBL NBT NBR SBL SBT SBR EBL EBT EBR WBL WBT WBR
Sterling & West Hill Rd 0 0 0 85 0 9 10 145 0 0 348 192
Sterling & Pioneer Ave 0 1 4 77 4 187 109 252 0 1 394 92
Sterling & Main St 14 13 48 75 19 32 27 363 16 46 416 92
Sterling & Heath St. 10 4 8 38 2 129 82 366 10 5 455 36
Sterling & Lake St. 0 0 0 178 0 210 209 330 2 2 327 185
Sterling & Kachemak 0 326 42 144 231 7 5 6 1 57 1 138
Pioneer & Bartlett 0 0 0 90 0 67 82 167 0 0 200 58
Pioneer & Main St. 21 48 73 39 38 31 29 206 30 56 252 45
Pioneer & Heath St. 33 3 93 13 17 17 15 356 75 57 354 5
Pioneer & Lake St. 133 3 202 7 6 15 10 300 123 100 294 2
East End Rd & E Fairview 0 0 0 54 1 29 76 466 0 4 411 24
East End Rd & E Hill Rd 0 0 0 15 0 76 171 516 0 0 279 28

Homer Intersections Planning Study Page B-5 Appendix B October 27, 2005
2004 (existing) Summer AM Peak Turning Movements
Intersection NBL NBT NBR SBL SBT SBR EBL EBT EBR WBL WBT WBR
Sterling & West Hill Rd 0 0 0 175 0 6 1 389 0 0 151 54
Sterling & Pioneer Ave 0 0 0 18 0 84 142 221 1 0 125 32
Sterling & Main St 4 8 20 54 11 2 6 217 17 15 136 34
Sterling & Heath St. 5 3 10 35 1 58 38 223 6 8 179 27
Sterling & Lake St. 0 0 0 103 0 96 140 199 0 0 137 88
Sterling & Kachemak 0 113 24 129 81 0 0 0 0 42 0 117
Pioneer & Bartlett 0 0 0 33 0 22 43 101 1 0 123 38
Pioneer & Main St. 7 25 30 31 39 13 23 149 16 28 163 28
Pioneer & Heath St. 17 9 47 3 7 11 22 203 49 64 228 10
Pioneer & Lake St. 69 1 69 3 3 8 6 140 72 95 263 3
East End Rd & E Fairview 0 0 0 23 0 24 64 335 1 0 488 87
East End Rd & E Hill Rd 2 0 0 56 0 166 53 396 0 2 655 33
Homer Intersections Planning Study Page B-6 Appendix B October 27, 2005
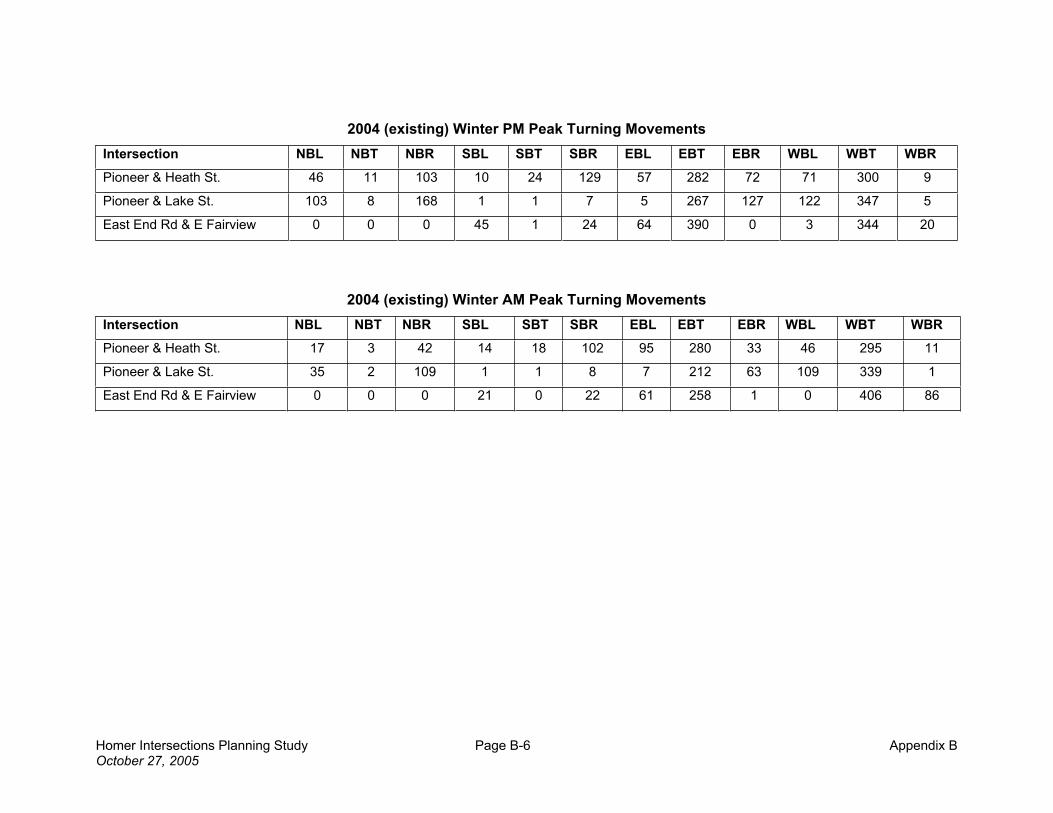
2004 (existing) Winter PM Peak Turning Movements
Intersection NBL NBT NBR SBL SBT SBR EBL EBT EBR WBL WBT WBR
Pioneer & Heath St. 46 11 103 10 24 129 57 282 72 71 300 9
Pioneer & Lake St. 103 8 168 1 1 7 5 267 127 122 347 5
East End Rd & E Fairview 0 0 0 45 1 24 64 390 0 3 344 20
2004 (existing) Winter AM Peak Turning Movements
Intersection NBL NBT NBR SBL SBT SBR EBL EBT EBR WBL WBT WBR
Pioneer & Heath St. 17 3 42 14 18 102 95 280 33 46 295 11
Pioneer & Lake St. 35 2 109 1 1 8 7 212 63 109 339 1
East End Rd & E Fairview 0 0 0 21 0 22 61 258 1 0 406 86

Homer Intersections Planning Study Page B-7 Appendix B October 27, 2005
2021 Summer PM Peak
Intersection NBL NBT NBR SBL SBT SBR EBL EBT EBR WBL WBT WBR
Sterling & West Hill Rd 0 0 0 122 0 13 15 207 0 0 497 275
Sterling & Pioneer Ave 0 2 6 109 6 267 155 360 0 2 563 131
Sterling & Main St 20 19 69 107 27 46 39 518 23 66 594 131
Sterling & Heath St. 14 12 5 96 3 210 170 470 14 7 610 92
Sterling & Lake St. 0 0 0 216 0 255 254 516 3 3 507 225
Sterling & Kachemak 0 465 61 205 330 10 7 8 2 81 2 197
Pioneer & Bartlett 14 17 26 123 11 90 117 239 5 5 286 83
Pioneer & Main St. 30 69 104 56 54 44 41 294 43 80 360 64
Pioneer & Heath St. 47 117 70 18 105 41 21 508 107 73 506 7
Pioneer & Lake St. 160 4 243 10 9 21 14 428 151 123 420 3
East End Rd & E Fairview 0 0 0 77 2 41 109 665 0 5 586 34
East End Rd & E Hill Rd 2 0 0 21 0 109 244 736 0 0 398 40

Homer Intersections Planning Study Page B-8 Appendix B October 27, 2005
2021 Summer AM Peak
Intersection NBL NBT NBR SBL SBT SBR EBL EBT EBR WBL WBT WBR
Sterling & West Hill Rd
0 0 0 250 0 8 2 555 0 0 216 77
Sterling & Pioneer Ave
0 0 0 26 0 119 203 316 2 0 179 46
Sterling & Main St
6 11 29 77 16 3 9 310 24 21 194 49
Sterling & Heath St.
7 12 7 69 2 116 70 302 9 11 256 53
Sterling & Lake St.
0 0 0 125 0 117 170 314 0 0 215 107
Sterling & Kachemak
0 162 34 184 115 0 0 0 0 61 0 168
Pioneer & Bartlett
14 17 26 43 4 31 61 144 5 5 176 54
Pioneer & Main St.
10 36 43 44 56 19 33 213 23 40 233 40
Pioneer & Heath St.
26 65 39 9 55 28 31 290 70 87 326 14
Pioneer & Lake St.
84 1 84 4 4 11 9 200 87 115 376 4
East End Rd & E Fairview
0 0 0 32 0 34 92 479 2 0 697 124
East End Rd & E Hill Rd
2 0 0 81 0 237 76 566 0 2 935 47
Homer Intersections Planning Study Page B-9 Appendix B October 27, 2005
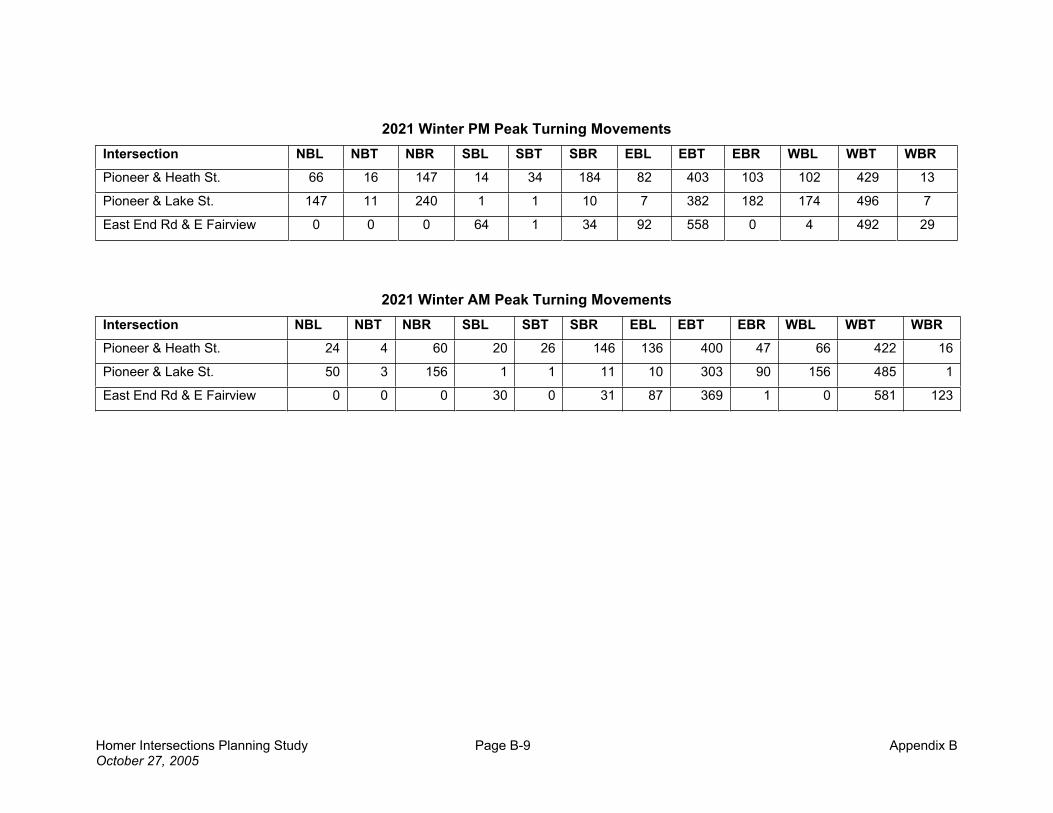
2021 Winter PM Peak Turning Movements
Intersection NBL NBT NBR SBL SBT SBR EBL EBT EBR WBL WBT WBR
Pioneer & Heath St. 66 16 147 14 34 184 82 403 103 102 429 13
Pioneer & Lake St. 147 11 240 1 1 10 7 382 182 174 496 7
East End Rd & E Fairview 0 0 0 64 1 34 92 558 0 4 492 29
2021 Winter AM Peak Turning Movements
Intersection NBL NBT NBR SBL SBT SBR EBL EBT EBR WBL WBT WBR
Pioneer & Heath St. 24 4 60 20 26 146 136 400 47 66 422 16
Pioneer & Lake St. 50 3 156 1 1 11 10 303 90 156 485 1
East End Rd & E Fairview 0 0 0 30 0 31 87 369 1 0 581 123