october 2014 fertilizer s agriculture - ifa-international ... rock urea map dap sulphur tsp potash...
TRANSCRIPT

f e r t i l i z e r s& a g r i c u l t u r e
October 2014
www.fertilizer.org
African farms are getting smaller while Asian farms are merging 5
The nitrogen fertilizer sectorFeedstock issues and capacity developments 9
Nutrient managementIssues and strategies
3
cont’d on page 7
2014 is the United Nations International Year of Family Farming. It is also the Af-rican Union’s Year of Agriculture and Food Security. Therefore, IFA and seven partners (AFAP, AGRA, CNFA, IFDC, IITA, IPNI and One Acre Fund) have embarked on a mission to advocate for smallhold-ers’ access to quality inputs – including fertilizers – on the African continent. A communications campaign was launched at the African Union Summit on Agriculture and Food Security held on 20-27 June in Malabo, Equatorial Guin-ea. IFA and its partners recognized that the summit presented a momentous op-portunity for African government lead-ers to catalyze action towards improving farmers’ productivity and livelihoods. To this end, an issue brief was prepared and a letter (translated into five languages) was sent to the heads of all African del-egations.The issue brief centred on the fact that despite the commitment by African Heads of State to sharply increase fer-tilizer use, application rates are still too low. In the Abuja Declaration of 2006 a commitment was made to increase fertilizer use to an average of at least 50 kg/ha by 2015. However, the current average is still close to 10 kg/ha while the global average is over 100 kg/ha. Because of high transaction costs (es-pecially transport costs), retail fertilizer prices in Africa are significantly higher than in the rest of the world and beyond the reach of the majority of smallholder farmers.The letter to heads of delegations high-lighted the fact that in order to become
more productive and profitable, farmers need access to farm inputs and services, such as financing to purchase inputs, quality seeds of improved varieties, soil nutrients/fertilizers, crop protection products, irrigation and crop insurance.The issue brief and the letter also put forward solutions to better inform the decisions and action plans of African po-litical leaders.
Why does global trade policy matter for the fertilizer industry?By Michel Prud'homme, IFA
Calling on African leaders to facilitate smallholders’ access to fertilizerBy Maria Antip, IFA
“The WTO lowered its forecast for global trade growth in 2014 to 3.1%, following a sub-par trade growth in the first half of 2014, in response to weaker than expected GDP growth and muted import demand in the first half of 2014” – WTO news, 23 September 2014
After four decades of sustained growth in global merchandise trade, the finan-cial crisis of 2008 put a halt to this period of accelerated growth and resulted in a massive 20% collapse in volume. After a sharp rebound in 2009, global trade slowed again in 2010 and has not picked
up strong momentum since then. 2008 was also the year expansive protection-ism emerged in a wide range of sectors and countries.A more open trade framework and sys-tematic tariff removal have been suc-cessful in increasing world trade over the past four decades. Sustained reduc-tions in applied Most Favoured Nation (MFN) tariffs have been implemented, but there are opportunities for trade growth, especially by reducing border administration and improving trade and distribution infrastructure. Howev-er, looming protectionism has emerged as a significant threat to global growth and welfare;
cont’d on page 2

2 fertilizers & agriculture
cont’d from page 1
Why does global trade policy matter for the fertilizer industry?
since 2008 more countries, including most G20 members, have implemented new trade restrictions measures with the potential to restrict trade. The most fre-quent measures have included border measures, followed by measures applied behind the border and stimulus/export support measures.
Trade policy effects on the fertilizer sectorThe fertilizer sector has not been im-mune to this trend. The sector saw a drop of about 25% in its global ex-ports between 2007 and 2009. Global trade matters for the fertilizer industry, as close to one-quarter of global sales are geared towards export markets. For some fertilizers this share exceeds 50%. Fertilizer trade is also expanding: currently about 30 countries have a national fertilizer sector that is heavily export-centric. Similarly to the global trade environment, however, the fertil-izer sector has been affected by growing trade protectionism since 2008, with a
wide range of measures introduced in numerous countries. These measures, which have included new export restric-tions and adjustments to import tariffs, have led to rising uncertainty, specula-tions and volatility in fertilizer markets, and shifts in trade patterns.In early 2014, the Gulf Petrochemicals and Chemicals Association (GPCA) and IFA agreed to initiate a broad overview of trade measures and their effects on the fertilizer sector. The main conclu-sions point to a generally favourable import environment in regard to ap-plied tariffs for most fertilizers and raw materials, but with significant regional variations; the emergence of higher temporary import tariffs, but still way below binding tariffs; lack of transpar-ency on export measures applied to fer-tilizers, with prominence given to export licensing and export tariffs; and a shift in trade patterns due to tariff seasonality and the effects of supply restrictions in key exporting countries.
Topical trade policy issues are currently heavily debated in national and multi-stakeholder fora, with more emphasis on matters related to the global value chain, protectionism and plurilateral agreements. To what extent will these debates and ensuing trade policies im-pact the fertilizer sector? And to what extent are the fertilizer sector’s views on promoting a freer, less burdensome and fairer global trade framework being expressed?GPCA and IFA are keen to continue to in-form our respective members and raise their awareness of key debates and out-comes on trade policy aspects and pos-sible effects on the fertilizer sector.Michel Prud’homme, Senior Director of Production and International Trade at IFA, presented the main conclusions of this overview at the 5th GPCA Fertilizer Convention (Dubai, Sept. 2014) and at the 35th IFA Production and Interna-tional Trade Conference (Beijing, Sept. 2014).
0
10
20
30
40
50
Share of global sales in 2013
(Adapted from WTO, 2012)
0% 20% 40% 60% 80%
Phosphoric acid
Ammonia
Phosphate rock
Urea
MAP
DAP
Sulphur
TSP
Potash
Export taxes
Export licensing
Market obligations
Million tonnes nutrients
0
50
100
150
200
201320102000
TradeHome
Global nutrient deliveries
Key exports measures in the fertilizer sector by type
26%40%
34%
Applied import tariffs on urea
% a
d va
lore
m
11611110696918681767166615651464136312621161161 121
Number of countries
Weighted AVG, 4%

October 2014 3
The biggest challenge for Indian ag-riculture is to meet the growing de-
mand for food in a sustainable manner. Increased food production must come largely from increased productivity, as there is very limited scope for increasing cropped area. Declining soil fertility and poor adoption of fertilizer best manage-ment practices have made the task of increasing crop productivity more diffi-cult. It is high time due attention is paid to balanced plant nutrition to improve soil health and crop productivity. India has witnessed good growth in fer-tilizer consumption in the last ten years. Total fertilizer (NPK) consumption ex-ceeded 28 million tonnes in 2010-11. However, at 141 kg per hectare, fertil-izer use was still lower than in a num-ber of developed and developing coun-tries. Per hectare use of phosphorous (P) and potash (K) has declined in the last three years, resulting in a distortion of the NPK consumption ratio, which was 4.7:2.3:1 in 2010-11, 6.7:3.1:1 in 2011-12 and 8.2:3.2:1 in 2012-13. A discrimina-tory pricing policy is largely responsible for such distortion in the consumption of the three primary nutrients. The arti-ficially low price of urea encourages its use. Reduced subsidisation of P and K, resulting in higher prices, discourages use of these fertilizers in comparison to urea. The current imbalance in nutrient use poses a threat to soil health, crop yields and farmers’ profitability. In addition to improper use of primary nutrients, India faces a number of other
problems related to nutrient manage-ment. The organic carbon status of the country’s soils is low, mainly due to the tropical and sub-tropical climate. The decreasing availability of traditional sources of plant nutrients – namely farm yard manure (FYM), compost, crop resi-due and green manure – coupled with inadequate and imbalanced fertilizer use has aggravated the problem of low soil organic carbon. Depletion of soil nutrients due to continuous nutrient mining has also emerged as a serious constraint on in-creasing crop productivity. Against an estimated annual depletion of 36 million tonnes of nutrients (NPK), replenishment through fertilizers is about 26 million tonnes, leaving a net annual deficit of 10 million tonnes. This deficit is accumulating year after year, affecting the soil’s capacity to sustain high crop yields. For secondary nutrients and micronutrients the situation is even worse, as application rates are very low. Inadequate and ineffective soil testing services are a major nutrient manage-ment issue. Adoption of soil testing is very poor at field level. The majority of farmers (70-80%) use fertilizer based on their own perception or as advised by their progressive peers. This has re-sulted in fertilizer overuse or underuse, leading to imbalanced and inefficient
application of nutrients. Declining nutri-ent use efficiency/fertilizer response and farm profitability are clear indicators of imbalanced use of farm nutrients. There is widespread deficiency of six nutrients (nitrogen, phosphorous, po-tassium, sulphur, zinc and boron) in particular. Increasing deficiency of sec-ondary and micronutrients has become a limiting factor and has started to af-fect crop response to the application
of even primary nutri-ents (NPK). The aver-age crop response to fertilizer applications (kg grain/kg NPK) has
declined from 12:1 in the 1960s to 8:1 in the 1980s and 6:1 currently. Fertilizer use efficiency (FUE) in general is low in India. In the case of nitrogen, 30-40% of applied nitrogen is utilized by crops and the balance is lost through leaching and volatilization. Low FUE not only affects crop yields and farmers’ profitability, but is also emerging as an environmen-tal issue. All this points to an inefficient use of fertilizers, which are precious and expensive natural resources.In the late 1970s, the government in-troduced a fertilizer pricing and subsidy scheme to promote increased and bal-anced use of fertilizers. However, two fertilizer pricing policy decisions – selec-tive decontrol of P and K fertilizers in Au-gust 1992, and selective introduction of a Nutrient Based Subsidy (NBS) scheme for P and K fertilizers in 2010 – negated all the promotional, educational and ex-tension efforts of decades to encourage balanced use of primary nutrients. The huge subsidies provided by the gov-ernment of India should be aimed at promoting balanced fertilization. How-ever, the current pricing of urea at a very low level results in imbalanced fertilizer use and adversely impacts productiv-ity levels. In addition, current policies have become a financial burden on the government. A severe liquidity crunch for the industry has also been created by inadequate provision for fertilizer subsidies in annual budgets year after year, unrealistic determination of the
cont’d on page 4
Nutrient management: Issues and strategiesby Satish Chander, FAI
© iS
tock
phot
o/ad
amka
z©
iSto
ckph
oto
natb
its
India has entered an era of multi- nutrient deficiency.

4 fertilizers & agriculture
fertilizer subsidisies for different units, and delays in payment of subsidies. This is seriously eroding the viability of the Indian fertilizer industry. There is increasing momentum glob-ally to improve nutrient use efficiency. The nutrient management challenge is being addressed proactively by IFA and its members through Nutrient Steward-ship initiatives, with an emphasis on the development of special products with built-in enhanced efficiency. Various in-stitutions and organizations in India and other countries have already done com-mendable work in develop-ing nutrient management practices which improve fer-tilizer use efficiency (FUE). The Indian fertilizer indus-try, with its limited resourc-es, is making efforts to de-velop value added/efficient fertilizer products. The de-velopment and use of neem coated urea (NCU) has been a great success. The pro-duction and use of crop and area specific customized fertilizers, including liquid fertilizers, is being attempted to coun-teract the problem of expanding multi-nutrient deficiencies in Indian soils. To improve nutrient use efficiency, the in-dustry is promoting the use of some best management tools such as the laser land leveller, the leaf colour chart (LCC) and water soluble fertilizers. Farmers are be-ing advised to make full use of organic/biological sources of plant nutrients to improve soil health. They are also being advised to follow a complete package of farm practices to achieve the maximum benefits from applied nutrients. Current fertilizer pricing policies in India provide little incentive to manufacturers to develop value added/innovative fer-tilizer products catering to the require-ments of specific crops and areas. The industry’s very narrow or negative mar-gins do not allow it to carry out desired work in R&D and agricultural extension, although it has the professional man-power for doing such work. The industry can serve as an effective extension arm to promote best farm practices among farmers. It can supplement the efforts of the state governments if allowed to work in a liberalized and competitive environment. Correcting fertilizer pricing policy is the
first and most important step in address-ing the problem of imbalanced fertilizer use in India. The Fertilizer Association of
India (FAI) has been working with the government of India to provide balance in nutrient prices by bringing urea under the ambit of NBS. The subsidy levels under NBS may be
adjusted so as to promote balanced fer-tilization, including application of mi-cronutrients.Products and practices that bring about higher nutrient use efficiency need to be encouraged. Soil testing facilities should be strengthened, and farmers should be encouraged to use fertilizer accord-ing to soil test-based recommendations. Unlike in the past, the Indian Council of Agricultural Research (ICAR) should be part of the consultation process for for-mulating fertilizer sector policies. FAI is committed to popularizing the balanced and efficient use of plant nu-trients by strengthening 4R Nutrient Stewardship (i.e. the right source, right time, right place and right rate). This is the cornerstone of efficient nutrient management. The Association is encour-aging its member companies to develop and promote the use of more efficient innovative fertilizer products that have better nutrient use efficiency. Through its Agriculture Promotional Projects (APP), FAI has been encouraging best farm management practices. APP in-cludes activities such as soil testing, field demonstrations, farmers’ education and the training of fertilizer dealers. ContactSatish Chander, Director GeneralThe Fertiliser Association of [email protected] www.faidelhi.org
cont’d from page 3
Nutrient management...IFA news
©IR
RI
The leaf colour chart
IFA joins the UN Global CompactIFA joins 14 of its members and endorses the Compact’s 10 principles on responsible business. In addition, IFA is also endorsing the newly released Food and Agriculture Business Principles. www.unglobalcompact.org/index.html
International Year of Soils2015 will celebrate through the United Nations system the International Year of Soils and December 5 has also been named World Soil Day. IFA has joined the Global Soil Partnership at the FAO and its steering committee in charge of the celebrations. www.fao.org/globalsoilpartnership/en/
IFA’s new Communications and Public Affairs CommitteeIf you are interested in playing an active role in following global affairs and repre-senting the industry at the UN, don’t miss the call to join the new committee that will be launched in January 2015, chaired by Chuck Magro, CEO of Agrium. Contact: [email protected]
Future fertilizer industry leadersIFA is implementing discount registration fees for up and coming leaders to attend its events. You can join this new community on Yammer and at the Strategic Forum in Marrakech. Contact: [email protected]
IFA delegation to the UN Committee on World Food SecurityIFA will be coordinating a delegation of 10 IFA members from 13 to 18 October at the FAO in Rome. The delegation will meet with key diplomats and other UN agencies. To register, contact [email protected]
The huge subsidies provided by the govern-ment of India should be aimed at promoting balanced fertilization.

October 2014 5
A new Working Paper* from the UN Food and Agriculture Organisation (FAO) finds that there are at least 570 million farms worldwide, of which more than 500 million can be considered family farms.Furthermore, the study by development economists Lowder, Skoet and Singh says that the vast majority of the world’s farms are very small, with more than 475 million farms being less than two hectares in size, and over 410 million of these less than 1 ha in area.The most interesting aspect is the geo-graphical spread. Of the 570 million farms, 74% are located in East Asia and the Pacific or South Asia, however de-fined. China alone represents 35% and India a further 24% of the total. Just 9% of global farms are located in sub-Saharan Africa and 7% in Europe and Central Asia. Only 4% are situated in Lat-in America and the Caribbean. A further 3% of the world’s farms can be found in the Middle East and North Africa.Those countries with the largest share of the world’s agricultural area in 2010 were China, followed by Australia, the US, Brazil, and Russia, where average farm size data is unavailable.
Data limitationsThe UN has declared 2014 as the Interna-tional Year of Family Farming. However, the authors admit that there are serious limitations with the existing available data, which is mainly derived from the
lengthy World Census of Agriculture (WCA), which commenced in 1930, and has been conducted at least once every decade by the FAO since 1950. To improve data collection, the latest WCA round, for 2006 to 2015, recom-mends that countries, whenever possi-ble, coordinate their population census with the agri-culture census. Clearly, in some d e v e l o p i n g countries, this is easier said than done.Although the agricultural holding measure is largely standardised, it does nevertheless vary from one country to another. For exam-ple, most countries establish a threshold farm size above which farms are includ-ed in the census.In both India and China, the countries
reporting the largest number of farms, very small farms are in-cluded in the census. In China in 2006, farms as small as 0.007 ha were included in the census, and slightly more than 200 million agricultural holdings were reported for the entire country. In India in 2011, no minimum farm size was established, and about 137 million
holdings were counted. This contrasts with neighbouring Bangladesh, where farms were only included if they were larger than 0.2 ha. Rwanda also counts agricultural households, rather than holdings, which makes cross-comparison more complex still.So any such study would inevitably be a very rough estimate of the total num-ber of very diverse entities, including quite small operations which are little more than ‘hobby’ farms, to family sub-sistence farms, and large-scale industrial businesses.The authors of this particular FAO paper used six different FAO rounds dating back to 1960, based upon farm census from some 167 countries, 157 FAO mem-bers, and 10 non-members. In fact, they conclude that the 570 million figure for total farms worldwide is most likely an under-estimate, as no reliable data was
available for a remaining 37 FAO member states.For example, the last agricultural census for three of the countries, Brunei Darussalam, Nigeria, and Zimbabwe, was conducted in 1960, a serious data series omis-sion, especially for the latter two
large African countries.“Farm sizes and the total number of farms change greatly over time as a re-sult of population growth, agricultural development, land policies and other factors. We might expect that in some countries the number of farms in past decades has little bearing on the current number of farms in these countries”, the paper notes.Nevertheless, the study concludes that 84% of the world’s farms recorded are smaller than 2 hectares and they oper-ate about 12% of global farmland. Con-versely, 16% of the world’s farms are larger than 2 hectares and they repre-sent 88% of total farmland. These are in fact mostly family-run farms for self-sufficiency, and some-times a small surplus for sale. The data suggests that more than 90% of the world’s farms are family-run, and that they control about 70% of the world’s
84% of the world’s farms recorded are smaller than 2 hectares and they operate about 12% of global farmland.
African farms are getting smaller, while Asian farmers are merging landholdingsBy Alan Bullion
© O
ne A
cre
Fund
© O
ne A
cre
Fund
/Kel
vin
Ow
ino
Family farm in Tanzania
Farmer group in Kenya plants maize
cont’d on page 6
6 fertilizers & agriculture
farmland. Non-family farms comprise the remainder, and are generally larger in size and scale. Average farm sizes and the number of farms worldwide has also increased from 1961 to 2000, largely due to increases in the total number of farms in low- and middle-income countries, which represent the vast majority of farms worldwide. Australia is a particu-lar example that would skew the data due to the large number of farms cover-ing thousands of hectares.
UrbanisationBut the FAO conclusion is that smaller farms remain the norm in low and low-er-middle-income countries. In contrast, average farm size in the high-income country group has increased.However, more recent demographic data from Masters et al suggests that the trend towards decreased farm sizes con-tinues in Africa, but that consolidation has already started in Asia, where aver-age family sizes are contracting. They conclude that while most Asian farmers seek labour-saving innovations, most African farmers seek to increase labour power per hectare.Urbanisation is of course another key trend to consider here. In 1900, world-wide, there were 6.7 rural dwellers to each urban dweller; now there is less than one and some projections suggest close to three urban dwellers to two ru-ral dwellers by 2025.Much has also been made that there are now more ‘urban’ than ‘rural’ dwellers in China, and the implications this will have for future food security. But from the end of July, Chinese citizens will now be classified simply as ‘residents’ rather than as ‘agricultural’ or ‘non-agricultur-al’ workers. This is a significant change in the traditional household registration system, known as hukou.
No doubt Chinese farming will have to become more efficient and competitive in turn, adopting more Westernised standards for safety.
‘Quiet revolution’Masters et al. have suggested that glob-al agriculture is increasingly diverse, operating along two main axes – com-mercialisation, and resource ownership, based on farm size. They contend there has been a ‘quiet revolution’ in China and other countries from lower trans-port costs to ports and cities, even as many farmers remain in hinterland re-gions.Crucially, they also argue that agricul-tural research to improve nutrition and health should be tailored to diversity and change in farm size, and commer-cialisation factors, as well as the impacts of climate change.In ‘dynamic’ zones along transport routes, for example, research should aim to accelerate agricultural growth using innovative technologies adapted to lo-cal farmer requirements.Here also the increased use of ‘big data’ by seed and agricultural companies is crucial, to measure commercialisa-tion and resource ownership, as well as agro-environmental conditions. Also to capture the rapid expansion of dynamic zones, technological innovation, and cli-mate change.
* What do we really know about the number and distribution of farms and family farms in the world? Background paper for The State of Food and Agriculture 2014. www.fao.org/docrep/019/i3729e/i3729e.pdf
ContactAlan BullionPrincipal Analyst and Special Reports Publisher at Informa AgraRe-published from Agra Europewww.agra-net.net/agra/agra-europe/
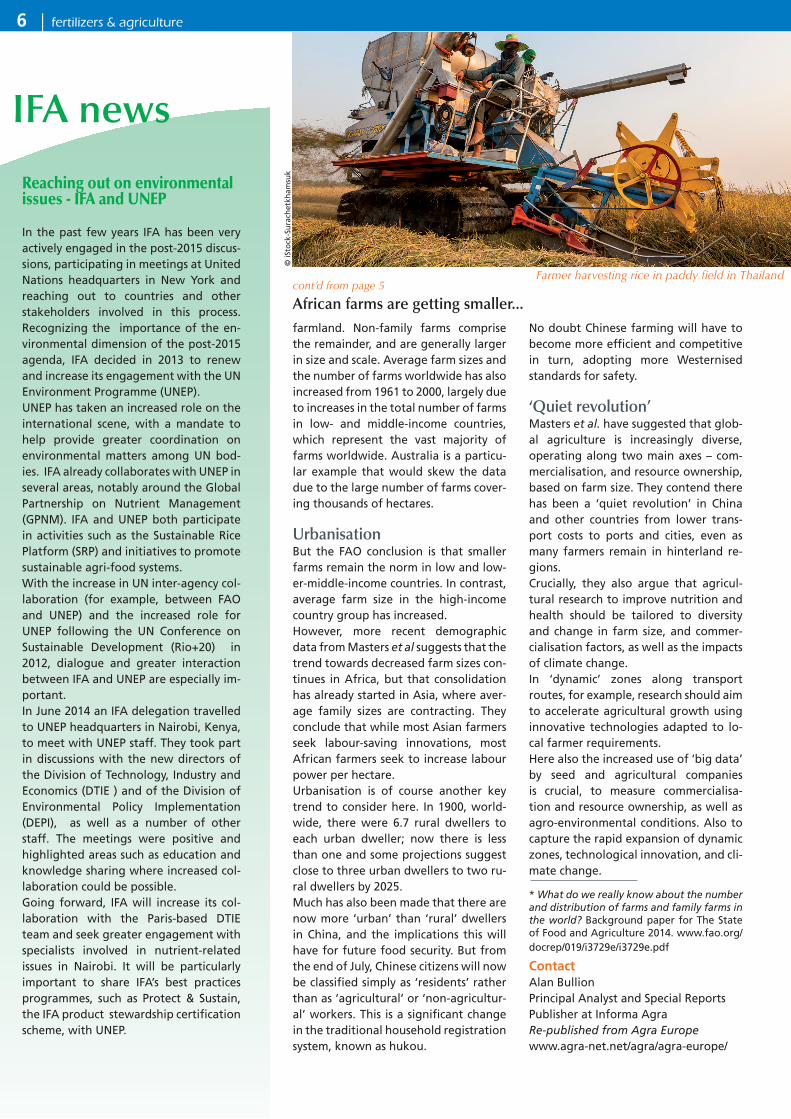
IFA news
© iS
tock
-Sur
ache
tkha
msu
kFarmer harvesting rice in paddy field in Thailand
Reaching out on environmental issues - IFA and UNEP
In the past few years IFA has been very actively engaged in the post-2015 discus-sions, participating in meetings at United Nations headquarters in New York and reaching out to countries and other stakeholders involved in this process. Recognizing the importance of the en-vironmental dimension of the post-2015 agenda, IFA decided in 2013 to renew and increase its engagement with the UN Environment Programme (UNEP). UNEP has taken an increased role on the international scene, with a mandate to help provide greater coordination on environmental matters among UN bod-ies. IFA already collaborates with UNEP in several areas, notably around the Global Partnership on Nutrient Management (GPNM). IFA and UNEP both participate in activities such as the Sustainable Rice Platform (SRP) and initiatives to promote sustainable agri-food systems. With the increase in UN inter-agency col-laboration (for example, between FAO and UNEP) and the increased role for UNEP following the UN Conference on Sustainable Development (Rio+20) in 2012, dialogue and greater interaction between IFA and UNEP are especially im-portant. In June 2014 an IFA delegation travelled to UNEP headquarters in Nairobi, Kenya, to meet with UNEP staff. They took part in discussions with the new directors of the Division of Technology, Industry and Economics (DTIE ) and of the Division of Environmental Policy Implementation (DEPI), as well as a number of other staff. The meetings were positive and highlighted areas such as education and knowledge sharing where increased col-laboration could be possible.Going forward, IFA will increase its col-laboration with the Paris-based DTIE team and seek greater engagement with specialists involved in nutrient-related issues in Nairobi. It will be particularly important to share IFA’s best practices programmes, such as Protect & Sustain, the IFA product stewardship certification scheme, with UNEP.
cont’d from page 5
African farms are getting smaller...

October 2014 7
Under the motto “Good policies can change the destiny of family farmers in Africa” IFA and its partners invited Af-rican leaders to work with the private sector, researchers and civil society in the following areas:
• provide access to credit, finance and insurance by retailers and farmers;
• facilitate local production and imports and the distribution of diverse fertil-izer products;
• invest in infrastructure (transport, handling, storage, and blending facili-ties);
• develop mobile technologies to pro-vide information on markets, exten-sion services and prices;
• train extension workers to help farm-ers organize themselves;
• disseminate best practices based on the integration of organic and min-eral nutrients and balanced fertiliza-tion.
The campaign has not fallen on deaf ears. At the conclusion of the summit, the Heads of State of the African Union issued a bold declaration (the Malabo Declaration) on accelerated agricultural growth and transformation for shared prosperity and improved livelihoods. Clause 3 of the Malabo Declaration is relevant to agribusiness at large and the fertilizer industry in particular. It reflects the advocacy work IFA has been carrying out with African policy-makers. There is a commitment in Clause 3 to end hunger in Africa by 2025 by accelerating agricul-tural growth through at least doubling current agricultural productivity levels. In doing this, African leaders pledge to set up appropriate policy and institu-
tional conditions and support sys-tems to facilitate sustainable and reliable production and access to quality and affordable inputs and to supply appropriate knowledge, information and skills to users. This is an extremely important point, as it will be translated into national policies to gen-erate an enabling environment for agri-businesses to supply the inputs required for productivity in-creases. In addition, Clause 3 contains a com-mitment to improve nutritional status and, in particular, to eliminate child under-nutrition in Africa with a view to bringing down stunting to 10% and underweight to 5% by 2025. This provides an important opportunity for our industry through provision of mi-cronutrient fertilization, especially in the case of zinc. It is therefore important for IFA to continue to disseminate success stories and advancements made in the area of agronomic biofortification, as it did last year through its campaign on Fer-tilizing Crops to Improve Human Health.
AGRF campaign promotes access to fertilizers for African farmersThe campaign continued with the launch of a video animation at the African Union headquarters on 3 September, followed by side events at the African Green Revo-lution Forum (AGRF) and the Commit-tee on World Food Security with distin-guished panelists such as Rhoda Peace Tumusiime, AU Commissioner for Rural Economy and Agriculture; Prof. Richard
cont’d from page 1
Calling on African leaders to facilitate smallholders' access to fertilizer
www.fertilizer.org/SmallholdersAccessFertilizers
Mkandawire, AFAP; Dr. Jeroen Huis-ing from IITA; Stephanie Hanson, One Acre Fund; Rutger Bonsel, IFA member Stamicarbon; and Vanessa Adams, US-
AID Ethiopia. Dur-ing the session Prof. Mkandawire said, “Radical interven-tions in support of smallholder farmers in African are well overdue, more par-ticularly in catalyz-ing wealth creation among millions of
smallholder farmers that are seemingly forgotten“. He added that increased fertilizer use, in this regard, is key.
IFA-IPNI project in EthiopiaFurthermore IFA’s presence in Ethiopia also celebrated the launch, in partner-ship with the International Plant Nu-trition Institute (IPNI), of a four-year research project to scale up 4R Nutrient Stewardship and Integrated Soil Fertil-ity Management knowledge to sup-port crop production intensification in Ethiopia. The project aims to support government-led initiatives to increase sustainably fertilizer use and develop crop- and site-specific fertilizer blends. “We welcome IFA as a partner on this important project,” said Dr. Terry Rob-erts, President of IPNI. “Successful im-plementation of nutrient stewardship programs with smallholders in Ethiopia will help them reduce their yield gaps and also enhance nutrient manage-ment knowledge in support of IFA’s ef-forts in promoting access to fertilizers in Africa.” This project will be imple-mented in collaboration with the Ethio-pian Institute of Agricultural Research (EIAR), Agricultural Transformation Agency (ATA), the Ministry of Agricul-ture, CIMMYT and IFDC to demonstrate the impact of various 4R techniques on crop productivity and profits.
If 2014 is truly to be Africa’s Year of Agriculture and Food Security, the African fertilizer gap needs to be addressed and IFA should continue to play a role through strategic partnerships.

8 fertilizers & agriculture
Agrium: nutrient stewardship, extension and last-mile delivery in North Americaby Ray Dowbenko
Farmer outreachThis article is the fourth in the series of “innovative ideas on effective last-mile delivery” undertaken by IFA members.
Agrium is one of the world’s larg-est fertilizer manufacturers and
distributors, marketing approximately 10.4 million tonnes of nitrogen, potash, phosphates, sulphates, controlled re-lease nitrogen and micronutrients. We provide crop nutrients for agricultural and industrial customers around the world. Agrium is a major retail supplier of agricultural products and services in North and South America and Australia. Agrium’s retail group, Crop Production Services (CPS), operates over 1400 facili-ties in seven countries, servicing over 50 different crop types. Sales in 2013 were approximately US$12 billion. On staff at CPS are over 5200 professionally cer-tified crop advisors with some type of professional certification, including cer-tified crop advisors (CCA’s), certified ag-ricultural consultants (CAC’s), certified professional agronomists (CPAg’s) and professional agrologists (PAg’s).Our advisors work directly with farm-ers and growers to provide advice on all aspects of crop production and harvest-ing. Many of our North American retail facilities are actively involved in dissemi-nating knowledge related to the fertil-izer industry’s 4R Nutrient Stewardship programme. 4R Nutrient Stewardship is recognized by the industry as an essen-tial conduit ensuring the sustainability
of agricultural systems.In many locations our advisors are imple-menting nutrient stewardship planning that reduces our environmental foot-print and integrates economic and so-cial concerns. 4R Nutrient Stewardship in North America could still be considered to be in its infancy, but its adoption rate is phenomenally strong.Agribusiness people tend to be the last point of contact with farmers before input decisions are made. This highly influential position is one that should be associated with knowledge and in-tegrity, as well as some level of profes-sional certification and training. In our last-mile delivery efforts we incorporate the concept and practices of 4R Nutri-
ent Stewardship, regionally specific best management practices, and the recog-nition that sustainable economic, social and environmental goals will vary re-gionally and from farm to farm.It is implicit in agricultural extension and last-mile delivery that the basis for transferring knowledge and teaching is an understanding of how learning takes place. We make sense of information through integration and learning by experience; and we build upon existing knowledge by breaking complex learn-ings or new ideas into pieces of essential information. Learning occurs in differ-ent ways with different people – educa-tion, culture and varied demographics dictate how an audience may learn best. Therefore, we take varied pathways to learning and information delivery.Extension and last-mile delivery require learning reinforcement opportunities and the provision of positive experi-ences and active learning situations, as well as moving from teacher-student re-lationships to teacher-group and even-tually student-to-student teaching and learning. A measure of our successful delivery is that farmers have been able to teach and to extend new information to other farmers.It has been useful to organize learning environments so as to present informa-tion, provide a bridge between existing and new information, discuss the ben-efits of (and barriers to) adoption, and demonstrate practical field implementa-tion of new information. When farmers share their adoption success with other farmers, this leads to discussions of bar-riers, and of keys to implementation, and demonstrates the practicality and benefits of a practice and its adoption.Success has been achieved though fur-ninishing information that is relevant to farmers, and through a last-mile delivery partnership involving agribusiness, gov-ernment, universities and farm groups.
© A
griu
m

October2014 9
This includes agribusiness-hosted farm training sessions in classroom and field settings, field demonstrations of new technologies, farmer-led discussions on the adoption of new practices, and off-site visits that have successfully imple-mented new products, technologies or practices. Together with face-to-face interactions, we enable direct access to information providers and furnish extension support and information reinforcement in the form of both printed and social media conduits. These include poster boards, field cards, fact sheets and crop manu-als – all varying in length and format to accommodate differential learning.While we focus primarily on large farms,
the concepts presented here also ap-ply to smallholder farms. A difficulty with last-mile delivery to smallholders tends to be geographic dispersion and the number of farmers that need to be reached in order to have an impact on significant amounts of land and crop production. Even though for smallholders the same learning concepts apply, the delivery methodology may change. Mobile tele-phone technology, text messaging, ra-dio and the training of local leaders are options to consider. In addition, train-ing videos can be provided for viewing on-site or, if possible, on-line. Decision support tools such as the International Plant Nutrition Institute’s (IPNI) Nutri-
ent Expert are excellent ways to deliver nutrient management information to smallholder farmers.Important learnings for our last-mile delivery have involved partnerships and risk sharing for the adoption of new products, technology and practices; continuous messaging and support; and the evaluation of progress, benefits and opportunities to adapt and change in regard to information delivery. The ben-efits may be economic, social or environ-mental. How to measure the success of last-mile delivery will vary with individu-als.ContactRay Dowbenko, [email protected]
Feedstock issues and capacity developments in the nitrogen fertilizer sectorBy José de Souza, IFA
Nitrogen makes up close to 80% of the ambient atmo-sphere. Any operator can capture this basic element, de-
pending on the adequacy of the feedstock and access to tech-nology to fix nitrogen into ammonia – as such and for further upgrading. Building on the now well-established Haber-Bosch technology that allows controlling the reaction of nitrogen from the atmosphere with hydrogen gas to generate synthetic ammonia, engineering companies have been investing in the development of state-of-the-art technologies and processes to produce this basic feedstock for the nitrogen industry. These technologies are widely available commercially and are cur-rently adopted in all greenfield facilities across the globe.There are no constraints per se on the production of nitrog-enous products; indeed, this resource is widely available in the ecosphere, pending access to the energy feedstock required by current technology and, naturally, on condition that the tech-nology meets stringent environmental and safety standards. As a logical consequence, the nitrogen industry is ubiquitous and tends to be fragmented in terms of the number of operators and its geospatial distribution. Today ammonia is produced in more than 70 countries, and this number keeps increasing every year with the emergence of new operators worldwide.Access to adequate and ample feedstock is a de-termining factor for carrying out nitrogen op-erations in an effective and competitive manner.
Ammonia feedstock evolutionGlobally, feedstook for ammonia continues to evolve in favour of natural gas and coal. Natural gas is currently the main feed-stock for ammonia production using the Haber-Bosch process. It accounted for 66% of global ammonia capacity in 2012 and
will account for close to 67% in 2018, equivalent to 165 MT of ammonia capacity. Globally, nearly 80% of all new ammo-nia operations that should come on stream between 2013 and 2018 will be based on natural gas.The remaining 20% of new projects will use coal as feedstock. These projects will essentially occur in China. The shares of oth-er feedstocks such as naphtha, fuel oil, hydrogen and electricity are projected to continue to decline.Production of ammonia from natural gas is the least energy intensive, whereas production with coal, which predominates
in China, generally has the highest energy consumption and CO2 emissions. Switch-ing from coal- or oil-based ammonia pro-duction to natural gas-based production would result in major energy and green-house gas (GHG) emission savings. On av-erage, about one-third of the GHG emis-sions produced during natural gas-based
production come from fuel combustion and two-thirds from use of natural gas as feedstock. In coal-based ammonia plants, 25% of GHG emissions come from fuel burning and 75% from use of coal as feedstock.
Ammonia Feedstock Evolution (2002-2018)
50
100
150
200
250
2002 2006 2010 2014 2018
Mt ammonia natural gas coal-china others coal
cont’d on page 10
Globally, nearly 80% of all new ammonia operations that should come on stream between 2013 and 2018 will be based on natural gas.

10 fertilizers & agriculture
Ammonia capacity by feedstockCoal and petroleum coke currently represent 31% of the feed-stock for ammonia, equivalent to 68 Mt of ammonia capac-ity. Relying on an ample supply of this feedstock, coal gasifi-cation technologies have been developed by various Chinese engineering companies. China currently contributes 95% of this global coal-based ammonia capacity. According to IFA estimates, around 80% of coal-based ammonia production in China is currently derived from anthracite and 20% from brown coal.
US natural gas productionGlobal unconventional gas accounts for around 18% of world output. North America currently accounts for 80% of uncon-ventional gas production and nearly 100% of shale gas produc-tion. Many other countries are probably endowed with poten-tially large reserves of shale gas, but the International Energy Agency (IEA) foresees only China and Poland becoming pro-ducers of this resource by 2018. In conclusion, we may say that the “shale gas phenomenon” remains confined to the United States and that shale gas will drive virtually all incremental gas production in that country in the next decade.In 2035, shale gas production would account for half of total
US natural gas production, according to the US Energy Infor-mation Administration. To illustrate the impressive progression of shale gas in the energy mix, only 3% of natural gas produc-tion in the US derived from shale gas in 2002.
US ammonia capacity evolutionThe main supply-related “event” in the global fertilizer indus-try in recent years has been the surge of announcements of new capacity in the US. Since 2012, shale gas developments and access to relatively cheap feedstock have spurred a series of an-nouncements from current nitrogen producers, agricultural co-operatives and several farmer organizations concerning more than 25 new nitrogen plants. If all the proposed new nitrogen fertilizer plants in North America were built, they would add more than 10 Mt of new urea capacity in the long term.
In spite of so many announcements, only a handful of these plants are likely to be completed before 2017. IFA estimates that only five or six new greenfield facilities are likely to ma-terialize, and most of these are led by established nitrogen producers that already benefit from market expertise and strong financial commitment. Indeed, a large-scale ammonia/urea complex costs about US$ 1.5-2.0 billion and would have to meet stringent environmental and safety requirements.
Ammonia capacity evolution in ChinaThe other major actor on nitrogen markets is China. Globally, ammonia capacity should keep increasing unabated and reach a plateau around 2016-17. Closure of uneconomical operations and compliance with stringent environmental regulations should result in a capacity rationalization later on, leading to a progressive decline in capacity.
We assume a progression of coal-based ammonia capacity of 5% from 2014 to 2018, compared with 10% for natural gas-based ammonia capacity in the same period.
China Ammonia Capacity Evolution (1988-2018)
20
40
60
80Mt ammonia natural gas coal
1988 1992 1996 2000 2004 2008 2012 2018e2016US Natural Gas Production (1990-2035)
1990
0
5
10
15
20
25
35
30
1995 2000 203020252020201520102005 2035
Trillion cubic feet per year
ProjectionsHistory 2011
Shale gas
Tigh gas
Coalbed methaneAssociated with oilNon-associated onshore
Non-associated offshore
Alaska
23%
26%
9%9%
10%
21%
2%
49%
22%
7%
6%
6%
7%
4%
US Ammonia Capacity Evolution (1988-2018)
1988 1992 1996 2000 2004 2008 2012
4
8
12
14
20
2018e2016
Mt ammonia
cont’d on page 12
cont’d from page 10Feestock issues and capacity developments...

IFA events
More information on upcoming events: www.fertilizer.org/ifaevents
*Restricted to IFA member companies
October 2014 11
IFA Crossroads Asia-Pacific 201428–30 October 2014SingaporeFocusing on the pivotal Asian region and Pacific basin, IFA
Crossroads Asia-Pacific attracts some 300 participants in at-tendance. This event is organized under the guidance of the Regional Vice Presidents for all IFA members with an inter-est in Asia and the Pacific as well as newcomers acquainting themselves with the Association in view of potential mem-bership. www.ifa-singapore2014.org
events 2015Joint Agriculture and Communications Meeting*13-15 January, Paris, France
Global Safety Summit23-26 March, Vancouver, Canada
83rd IFA Annual Conference*25-27 May, Istanbul, Turkey
IFA Production & International Tade ConferenceFlorida, USA, date and venue to be confirmed
IFA Strategic Forum*18-19 November, Paris, France
IFA Crossroads Asia-Pacific7-9 December, Kuala Lumpur, Malaysia
IFA Strategic Forum*
19-20 November 2014Marrakech, Morocco(see above)www.ifa-marrakech2014.org
Marcos JankExecutive Director,
Global Public and Gov-ernmental Affaires, BRF
The first IFA Strategic Forum will take place in Marrakech on 19-20 November. With the merging of IFA’s Council and General Meeting, what used to be the “IFA Enlarged Council Meeting,” this IFA Strategic Forum is now a second general meeting and we encourage all IFA members to join us. Given how busy IFA’s annual general meeting held in May is in terms of business meetings, we offer this meeting to better engage IFA’s members in more strategic discussions on issues facing our industry, while also providing valuable networking opportunities. Key componentsThe opening session examines closely the fertilizer industry’s relationship to other play-ers in the food and agricultural value chain. A panel of leaders from the farming, seed, livestock and food manufacturing sectors, will engage with us on the key trends affecting their respective sectors and the implications of these trends for our industry. Prior to our popular market outlook session, we will hold a special session on sub-Sa-haran Africa (SSA), an area of increasing interest in terms of both fertilizer supply and demand. Given IFA’s efforts to enhance its statistics from the region, a more detailed market outlook focusing on SSA will be provided and IFA members will also be sharing insights into their own strategies and plans on the continent.A fourth session chaired by Chuck Magro, the new chair of IFA Communications & Pub-lic Affairs Committee will focus on how the United Nations works on matters related to agriculture, food security and soil health and how IFA works to position our industry.
Special Agribusiness Panel
Peter KendallPresident, World Farmers Organisation
Paul SchicklerPresident, Dupont
Pioneer
Hans JöhrCorporate Head of Agriculture, Nestle
www.ifa-marrakech2014.org

12 fertilizers & agriculture
Printed with vegetable-based ink by Point44 on paper from sustainably managed forests.
International Fertilizer Industry Association28, rue Marbeuf, 75008 Paris, FranceTel: +33 1 53 93 05 00 Fax: +33 1 53 93 05 45/[email protected] www.fertilizer.org @FertilizerNews!
Fertilizers & Agriculture is a quarterly newsletter published by IFA covering issues in relation to fertilizers and sustainable agriculture.
Mailing listSubscription to Fertilizers & Agriculture is free of charge. To receive a hard copy, send full address details to be added to the mailing list. Additional copies may be supplied to organizations to circulate on behalf of IFA. To consult current and past issues of Fertilizers & Agriculture: www.fertilizer.org/newsletters
ContributionsWe invite your contributions of letters, documents, articles, photographs, etc.
Director General of IFA: Charlotte HebebrandEditor-in-Chief: Claudine Aholou-Pütz
Material in F&A may be reproduced only after prior consent by IFA.
Reference to individuals, publications, research, products, companies or organizations does not indicate endorsement by IFA.
For information on IFA’s activities:www.fertilizer.org
© International Fertilizer Industry Association 2014
12 fertilizers & agriculture
Fertilizer factsConclusionThe nitrogen industry, though centenary, continues to adapt and evolve. Challenges can become opportunities and pave the way for innovation and sustainability.Access to ample and affordable feedstock is a fundamental issue for this highly energy-intensive industry, all the more so with the emergence of competing strategic segments such as power generation and liquid natural gas (LNG) exports. Enhancement of plants’ operational performance aside, feed-stock supply issues are addressed by the fertilizer industry by ei-ther identifying new energy sources – as illustrated by shale gas in the United States – or adopting new technologies based on alternative and abundant feedstock. The coal gasification tech-nologies promoted by Chinese companies around the world are a case in point.
Extract from “Global Nitrogen Supply and Trends in Feedstock” by José de Souza and Michel Prud’homme, FERTASA Annual Congress, Johannesburg, South Africa, 10 June 2014.www.fertilizer.org//En/Knowledge_Resources/Library/IFA_Secre-tariat_Presentations.aspx
The Fertilizer Facts series is published on a monthly basis and presents in a short and data manner topics pertain-ing to the fertilizer industry. IFA encourages members and interested parties to actively use this new tool and to dis-seminate it widely within their networks. www.fertilizer.org//en/Knowledge_Resources/Library/Selection_Fertil-izer_Facts.aspx
cont’d from page 3
Feedstock issues and capacities development...
Organized by Turret Media FZ LLC in partnership with IFA
Welcome to the future of sustainable agriculture. Hosted by the City of Abu Dhabi and in partnership with the Abu Dhabi Food Control Authority, the Global Forum for Innovations in Agriculture is the world’s largest collection of sustain-able agriculture innovations. With the support of over 20 Foundation Partners and international collaborators, GFIA 2015 will host over 6,000 of the world’s brightest minds to show the world how game-changing technologies can feed the world.
Winner of the 2014 Middle East Event Award for ‘Best Meeting/Conference’, GFIA is the most influential event in the world for all those wishing to contribute to the sustainable agriculture movement.
IFA members who wish to participate in the forum get a special dele-gate's package at a discount rate. To obtain the IFA discount code contact: [email protected]
Global Forum for Innovations in Agriculture9-10 March 2015, Abu Dhabi National Exhibition Centre, [email protected] – Tel: +971 2 234 8400www.InnovationsInAgriculture.com – www.twitter.com/gfia2015
How can we narrow the yield gap?Yield gaps can be narrowed through adoption of existing best management techniques and technologies, and improved access to inputs and finance.
Farmers’ yields are often limited by nutrient availability, making mineral fertilizers crucial for bridging yield gaps. Because fertilizer is a bulky product and its efficient use is knowledge-intensive, improving market infrastructures and access to best practices are priorities.
Why do yield gaps matter?High yield gaps are clearly correlated with increases in hunger prevalence.
Fertilizers are crucial for closing the ‘yield gap’
350
1
2
3
4
5
6
30 25 20 15 10
EAST ASIA
1990
2013
SOUTH ASIA1990
2013
SUB-SAHARAN AFRICA
1990
2013
Hunger prevalence %
Cereal yield • t/ha
Relation between prevalence of hunger and cereal yield, 1990-92 and 2011-13
How big are yield gaps?Yield gaps may be substantial. For instance, in Sub-Saharan Africa the average maize yield is only one fifth of the attainable yield.
0,0 0,2 0,4 0,6 0,8 1,0
OCEANIA
NORTH AMERICA
SOUTH AMERICA
EAST & SOUTH ASIA
SUB-SAHARANAFRICA
NORTH AFRICA & WEST ASIA
EUROPE
Ratio between actual yields and attainable yields for maize
Why are some farmers less productive than others?Farmers may achieve very different yield levels under similar agro-ecological conditions. The ‘yield gap’ represents the difference between farmers’ actual and attainable yields and is often caused by poor access to agricultural inputs and to knowledge.
Potentialyields
Attainablefarmers’ yields
Actualfarmers’ yields
Differences in crop management.Can be narrowed.
Environmental differences & non-transferable factors.Cannot be narrowed.
Illustration of the yield gap
Fertilizer facts
May 2014www.fertilizer.org
Nutrient stewardship approach
Right SourceMatch fertilizer typeto crop needs
Right RateMatch amount of fertilizer to crop needs
Right TimeMake nutrients available when crops need them
Right PlaceKeep nutrients where crops can use them
N PK
N K P
Right SourceMatch fertilizer typeto crop needs
Nutrient stewardship approach
Right SourceMatch fertilizer typeto crop needs
Right RateMatch amount of fertilizer to crop needs
Right TimeMake nutrients available when crops need them
Right PlaceKeep nutrients where crops can use them
N PK
N K P
Right SourceMatch fertilizer typeto crop needs
Nutrient stewardship approach
Right SourceMatch fertilizer typeto crop needs
Right RateMatch amount of fertilizer to crop needs
Right TimeMake nutrients available when crops need them
Right PlaceKeep nutrients where crops can use them
N PK
N K P
Right SourceMatch fertilizer typeto crop needs
Nutrient stewardship approach
Right SourceMatch fertilizer typeto crop needs
Right RateMatch amount of fertilizer to crop needs
Right TimeMake nutrients available when crops need them
Right PlaceKeep nutrients where crops can use them
N PK
N K P
Right SourceMatch fertilizer typeto crop needs
Right SourceMatch fertilizer type to crop needs
Right TimeMake nutrients available when crops need them
Right RateMatch amount of fertilizer to crop needs
Right PlaceKeep nutrients where crops can use them
Nutrient stewardship approach
What lies ahead?
Globally, ammonia capacity is forecast to continue to expand beyond
2018. Decoupling nitrogen production from hydrocarbons is not likely
in the foreseeable future. In light of the nitrogen industry’s continued
reliance on hydrocarbon feedstocks, the impressive energy savings that
continue to be achieved in ammonia production are vitally important.
(see Fertilizer Facts, July 2014).
Coal – the basis of China’s
expanding ammonia capacity
China currently accounts for 95% of global ammonia capacity based
on coal feedstock. In view of China’s ample coal reserves, coal gasification
technologies have been further developed and are now used extensively.
Coal-based ammonia capacity represents 86% of total Chinese ammonia
capacity. It is forecast to increase by 5% between 2014 and 2016, but to
decelerate thereafter.
Nitrogen production: why energy feedstock trends are important
China Ammonia Capacity Evolution (1988-2018)
Significant new ammonia
capacity in the United States due
to shale gas development
Since 2012 there has been a surge of announcements of new capacity
in the United States, spurred by shale gas development and thus
relatively cheap feedstock.
US ammonia capacity is forecast to increase 25% by 2018. Of the more
than 25 new nitrogen plants announced, though, only a handful are
likely to be completed before that year.
US Ammonia Capacity Evolution (1988-2018)
What are recent developments?
Nitrogen is all around us. However, converting atmospheric nitrogen
into ammonia to obtain a plant available nutrient requires energy.
Access to an adequate, affordable supply of energy feedstock is of
critical importance to ammonia producers.
Hydrocarbon feedstocks are the raw materials most commonly used in
ammonia production. By 2018 natural gas will contribute 66% of global
ammonia capacity and account for most of the incremental growth
compared to 2013. Coal is projected to account for 30% of feedstock
used in ammonia production by 2018. Shares of other feedstocks
(e.g. naphtha, fuel oil, hydrogen, electricity) are projected to decline.
Fertilizer facts
September 2014
www.fertilizer.org
1988 1992 1996 2000 2004 2008 2012
4
8
12
14
20
2018e2016
0
20
40
60
80
1988 1992 1996 2000 2004 2008 20122018e2016
Mt ammonia
Mt ammonia
Ammonia Feedstock Evolution (2002-2018)
50
100
150
200
250
20022006
20102014
2018e
Mt ammonia
50
100
150
200
250
20022006
20102014
2018e
natural gas coal-china others coal
50
100
150
200
250
20022006
20102014
2018e
50
100
150
200
250
20022006
20102014
2018e
50
100
150
200
250
20022006
20102014
2018e
natural gas coal
50
100
150
200
250
20022006
20102014
2018e50
100
150
200
250
20022006
20102014
2018e0
20
40
60
80
1988 1992 1996 2000 2004 2008 20122018e2016
Ammonia production: moving towards maximum efficiency and lower GHG emissions
Global energy efficiency benchmark (IFA, 2012)
How much energy does the ammonia sector consume?Fertilizer production consumes approximately 1.2% of the world’s total energy on an annual basis. Ammonia production accounts for the bulk, or approximately 90% of the industry’s total, with approximately 166 million tonnes produced annually.
Why is ammonia so energy intensive?The synthesis of ammonia through the Haber Bosch process is the source of nearly all nitrogen fertilizers. On a worldwide basis, natural gas and other hydrocarbon feedstock such as coal (mostly in China) are used.
The fertilizer industry has made great stridesLarge gains in energy efficiency in ammonia production have been achieved over the past 30 years. Ammonia plants have been equipped with the most advanced available technologies, leading to enhanced plant throughput and lower overall energy consumption and reduced CO2 emissions. For example, a typical nitrogen plant built today typically uses 30% less energy per tonne of ammonia produced than one constructed 40 years ago (IFA).
IFA tracks progress in ammonia plant efficiency and CO2 emissions to encourage members to improve their performance. The latest Association benchmark report indicates that the most efficient plants are performing close to maximum efficiency and that incremental advances in energy efficiency have resulted in significant reduction in greenhouse gas (GHG) emissions by nearly all the plants surveyed.
Fertilizer facts
July 2014
www.fertilizer.org
1955
0
10
20
30
40
50
60
70
1965 1975 1985 1995 2005 2010
GJ per tonne of ammonia
Average of 78 plantsin 2012 benchmark
Thermodynamic limit
10 Best-in-class plants in 2012 benchmark
Design efficiency
20
%%
80
AnthraciteOther coal
Coal ChinaOther
1
30
4
65
Global ammonia capacity by feedstock (IFA, 2014)
1955
0
10
20
30
40
50
60
70
1965 1975 1985 1995 2005 2010
GJ per tonne of ammonia
Average of 78 plantsin 2012 benchmark
Thermodynamic limit
10 Best-in-class plants in 2012 benchmark
Design efficiency
Fertilizers
Pulp and paper
Nonmetallic minerals
Refining
Iron and steel
Other
Chemicals (including feedstocks)
1,2
3,46,8
6,8
15,0
19,3
47,5
World industrial energy consumption by sector (eIA, 2010)
Energy efficiency in ammonia production is critical, since it accounts for most of the manufacturing cost and has a significant impact on the reduction of carbon dioxide (CO2) emissions from the sector.
1955
0
10
20
30
40
50
60
70
1965 1975 1985 1995 2005 2010
GJ per tonne of ammonia
Average of 78 plantsin 2012 benchmark
Thermodynamic limit
10 Best-in-class plants in 2012 benchmark
Design efficiency
%Natural gasCoal