october 2005 state of the shopping center industry
Post on 21-Dec-2015
214 views
TRANSCRIPT

October 2005
State of the Shopping Center Industry

The Industry in Connecticut

National Same-Store Sales Sept. 2004-Sept. 2005
2.4%
4.1%
1.8%
2.7%
3.6%
4.7%
4.0%
2.2%
2.8%
5.2%
3.6%3.7%
4.0%
0.0%
1.0%
2.0%
3.0%
4.0%
5.0%
6.0%
S O N D J F M A M J J A S
Source: ICSC

2005 Has Been Solid So FarAverage same-store sales gain of
+3.8% for the fiscal year to date
September’s increase of +4.0% was on trend but concealed unevenness across retailers/categories
Adverse factors were Katrina, energy prices, and lack of “wear now” fashion in extended period of hot weather

Chain-Store Sales YTD 2005 Average Monthly
Growth
1.4%2.0%
3.5%
5.6%6.2%
-6.6%
3.0%
-8%
-6%
-4%
-2%
0%
2%
4%
6%
8%
Apparel
Department
Discounter
Drug
Wholesale
Furniture
Footwear
Source: ICSC

High-end Retailing Continues Strong
6.3%
9.0%
3.7%
2.0%
0%
1%
2%
3%
4%
5%
6%
7%
8%
9%
Same-store SalesGrowth YTD 2005
Nordstrom
Neiman Marcus
Saks Fifth Ave
All Dept Stores

The Luxury Market
Driven by well-heeled consumer and also by moderate income consumer
Luxury bifurcated into high-end and “accessible”
Examples of “accessible” retailers—Coach, Burberry, Neiman Marcus

Positive Fundamentals
Principal drivers of strong retail and property performance still in place
Despite September up tick due to Katrina, the unemployment rate is still a low 5.1% compared with 5.4% a year ago
1.592 million new jobs year to date

0
500
1000
1500
2000
2500
O N D J F M A M J J A S
Economy has generated 2.161 million jobs in the last
year
Source: Bureau of Labor Statistics
Positive Fundamentals
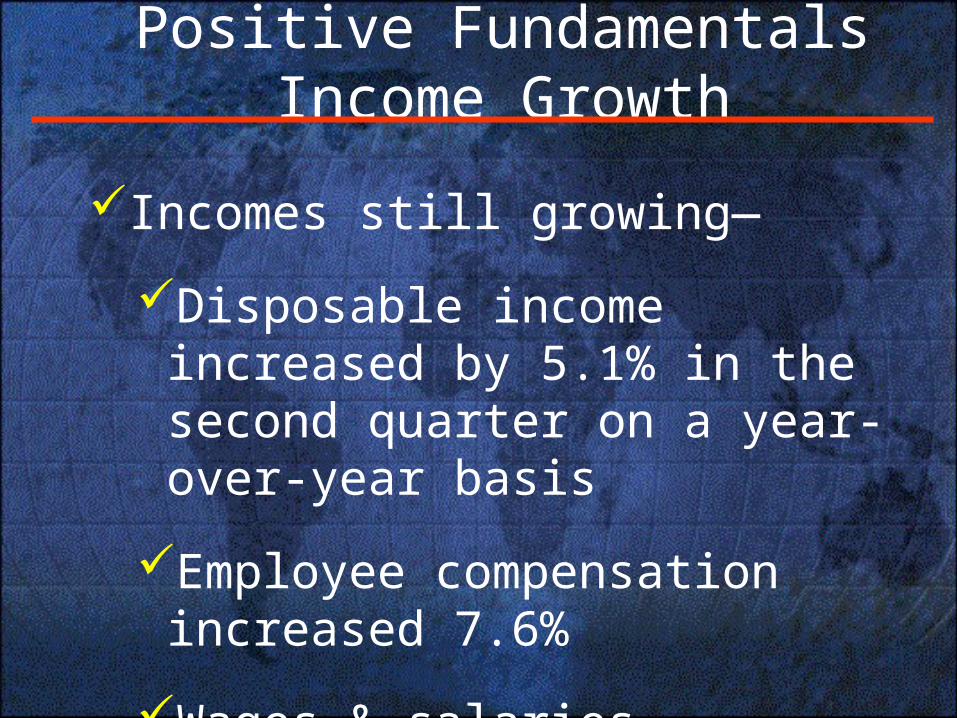
Positive FundamentalsIncome Growth
Incomes still growing—
Disposable income increased by 5.1% in the second quarter on a year-over-year basis
Employee compensation increased 7.6%
Wages & salaries increased 7.4%
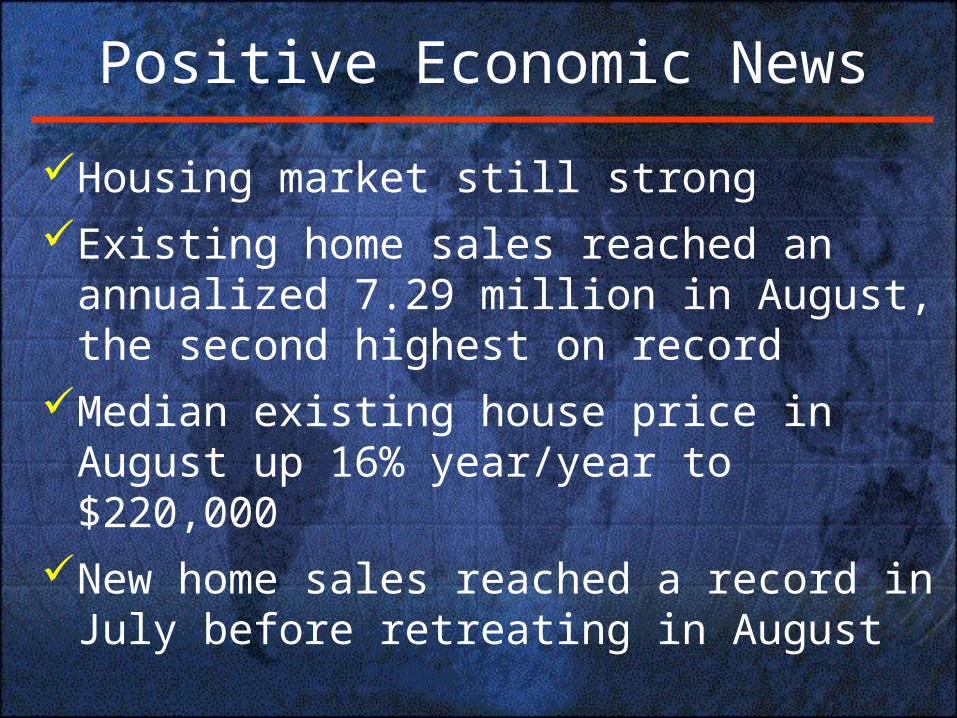
Positive Economic News
Housing market still strongExisting home sales reached an
annualized 7.29 million in August, the second highest on record
Median existing house price in August up 16% year/year to $220,000
New home sales reached a record in July before retreating in August
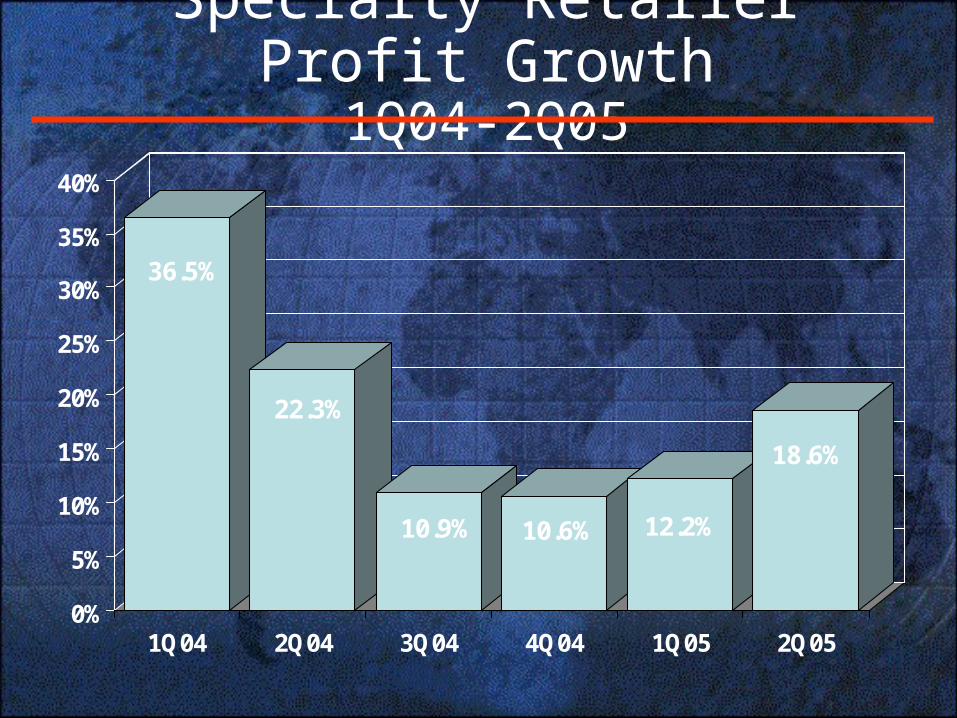
Specialty Retailer Profit Growth
1Q04-2Q05
36.5%
22.3%
10.9% 10.6% 12.2%
18.6%
0%
5%
10%
15%
20%
25%
30%
35%
40%
1Q04 2Q04 3Q04 4Q04 1Q05 2Q05

New Retailers are Stepping in to Fill the Gaps
Established retail names still in growth mode
Exciting new concepts; e.g. “Ruehl,” “Soma,” “Forth & Towne,” “Jimmy ‘Z” and “One Thousand Steps”
European retail names getting a foothold; e.g. Zara, Mango, Mexx

Mergers & Acquisitions
Sears/Kmart
Federated/May
Belk/Saks
Texas Pacific & Warburg Pincus/Neiman Marcus
Among the Department Store Companies:

New Mall Anchors Stepping Up
Retailers lining up for mall anchor slots; e.g. discounters, sporting goods
Provides an opportunity to tap into markets with no alternative greenfield locations
Offers a growth channel to compensate for increasing difficulties getting permissions in outlying areas

REIT Occupancy (2Q05)
84%
86%
88%
90%
92%
94%
96%Regency
Federal Rlty
Devel. Div
Kimco
New Plan
Macerich
Simon
CBL
PREIT
General Grth
Taubman
Glimcher

Total Returns Privately Owned Property
0%
5%
10%
15%
20%
25%
1 yr 3 yrs 5 yrs
Source: NCREIF
NCREIF Property Index Total Returns(through June 30, 2005)
Index
RetailSubindex

Total ReturnsREITs
0%5%
10%15%20%25%30%35%40%
1 yr 3 yrs 5 yrs
Source: NAREIT
NAREIT Index (through September 30, 2005)
Index
Malls
ShoppingCenters

Katrina’s CostPhysical damage approximately $100
billion
50% of damage to housing, 25% to businesses, 25% to infrastructure
About $25 billion in lost economic activity,
80% of lost output directly in the affected Gulf region, mostly in New Orleans

Gasoline prices averaged $2.85 per gallon October 10Prices 86 cents a gallon higher than a year agoA disproportionately harsh impact on low-income
households, which spend about twice as much on energy as a percent of income as the average U.S. household
Energy Prices are a Big Concern

Middle income households increasingly affected54% of households now reducing discretionary
purchases due to gasoline prices—up from 50% in early July but down slightly from 58% in mid-August
46% of households with incomes over $50,000 are reducing spending, up from 37% in July
Consumers partially offsetting higher gas prices by shopping more “efficiently”—i.e., buying more on each trip
ICSC Survey September 22-25

What Can We Expect for the Rest of 2005?
Katrina will take from 2H05 and give back in 1H06GDP growth of 3.0-4.0% for the second half of 2005Reconstruction will add a half percentage point to
growth in 1H064.0%+ growth in 1H06

And for Retail?
The economic fundamentals are still sound but. . .Increasing stress on household balance sheets from rising
energy costs and debt loads. An especially severe winter will be testing
Consumer will still pay full-price for the right merchandiseICSC Research forecasts second-half non-auto sales
growth of 6.7%, in line with first half 7.0%

Thank You!