october 19, 2000acat 2000, fermilab, suman b. beri top quark mass measurements using neural networks...
TRANSCRIPT

October 19, 2000 ACAT 2000, Fermilab, Suman B. Beri
Top Quark Mass Measurements Using Top Quark Mass Measurements Using Neural NetworksNeural Networks
Suman B. Beri, Rajwant Kaur
Panjab University, India
Pushpalatha Bhat
Fermilab
Harrison B. Prosper
Florida State University

October 19, 2000 ACAT 2000, Fermilab, Suman B. Beri
OutlineOutline
Introduction
Neural Networks
Event Simulation
Preliminary Studies
Summary

October 19, 2000 ACAT 2000, Fermilab, Suman B. Beri
IntroductionIntroduction
Run I,Run I,
1995, March 2: Discovery1995, March 2: Discoverymt = 176 ± 17 GeV/c2 (CDF)
mt = 199 ± 30 GeV/c2 (DØ)
1999, Combined Mass1999, Combined Massmt = 174 ± 5 GeV/c2 (CDF+ DØ)
Run II, (2001…)Run II, (2001…)
mt = 174 ± ? ? GeV/c2

October 19, 2000 ACAT 2000, Fermilab, Suman B. Beri
Why Measure The Top Mass?Why Measure The Top Mass?
0),,,( HZWt mmmmf 0),,,( HZWt mmmmffrom which we can infer
something about the Higgs mass
According to the Standard Modelquantum corrections to the W and Zboson masses induce a relationship
Corrections to W and Z mass

October 19, 2000 ACAT 2000, Fermilab, Suman B. Beri
Measuring the Top MassMeasuring the Top Mass
In Run II we expect about 100100 times more data than was collected in Run I. The main task is to reduce systematic errorsreduce systematic errors so that we can benefit from the reduction in statistical errors
Goal to determine mt as accurately as possible by making optimal use of information
using as many decay modes as possibleusing several methodsseveral methods to cross-check the resultsexploring different methods which may yield smaller systematic errors.

October 19, 2000 ACAT 2000, Fermilab, Suman B. Beri
Feed-Forward Neural NetworksFeed-Forward Neural Networks
x1
x2
x3
x4 Use non-lineartransfer function(e.g., sigmoid)
w x aij jj
i i
0
4
w x aij jj
i i
0
4
f ai( )f ai( )
y f w f ai ii
( ( ) )
0
4
y f w f ai ii
( ( ) )
0
4
October 19, 2000 ACAT 2000, Fermilab, Suman B. Beri
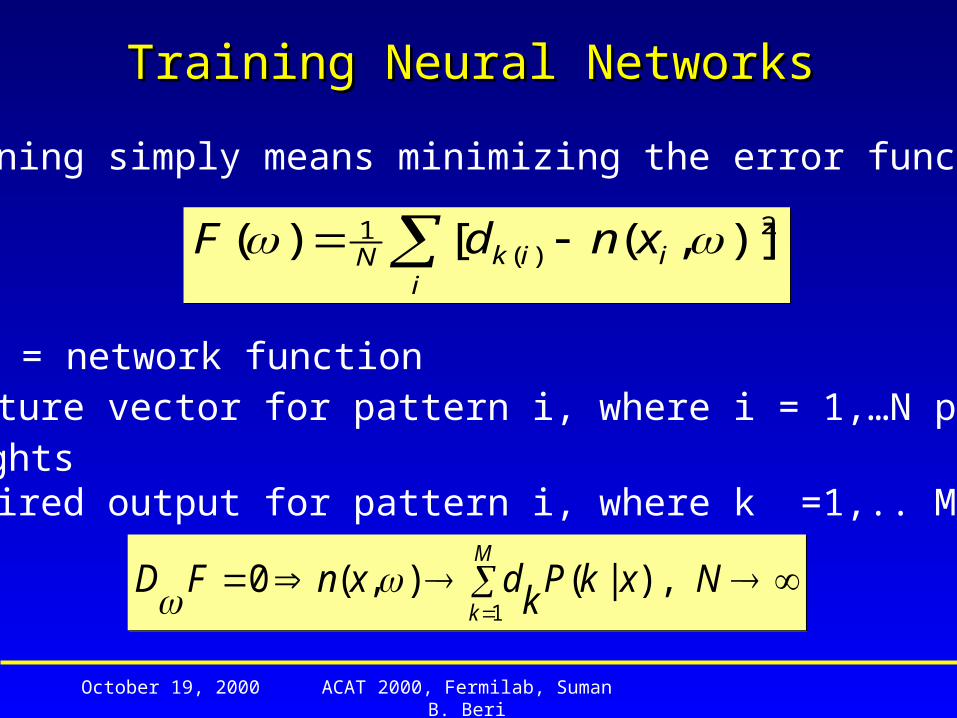
Training simply means minimizing the error function
i
iikN xndF 2)(
1 )],([)( i
iikN xndF 2)(
1 )],([)(
M
kNxkP
kdxnFD
1),|(),(0
M
kNxkP
kdxnFD
1),|(),(0
Training Neural NetworksTraining Neural Networks
n(xi, ) = network functionxi = feature vector for pattern i, where i = 1,…N patterns = weightsdk = desired output for pattern i, where k =1,.. M classes
October 19, 2000 ACAT 2000, Fermilab, Suman B. Beri
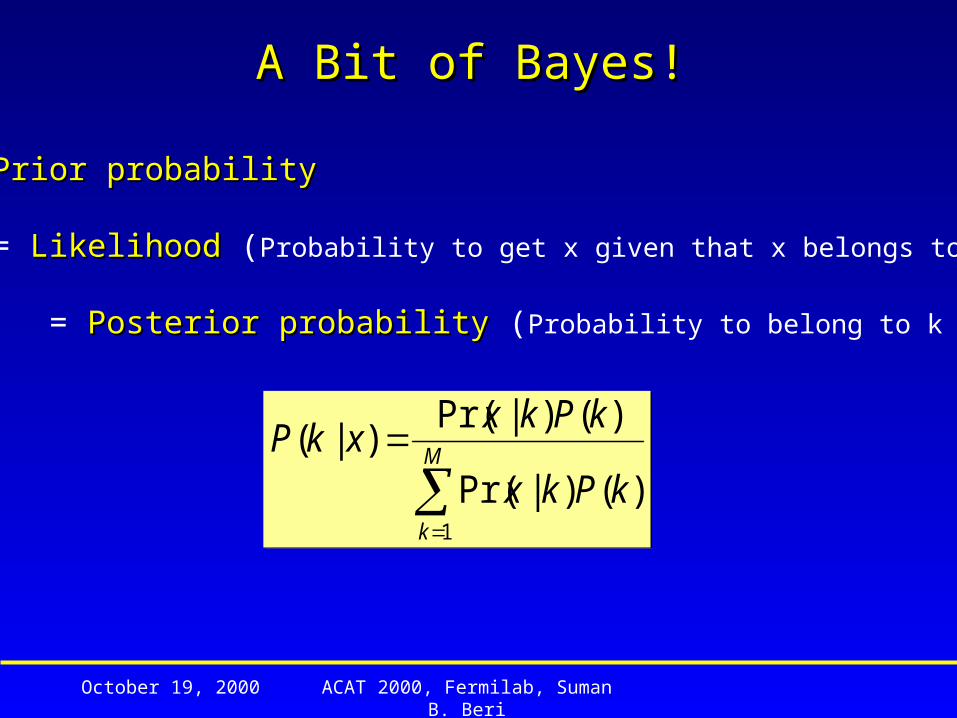
P(k)P(k) = Prior probabilityPrior probability
Pr(x|k)Pr(x|k) = LikelihoodLikelihood (Probability to get x given that x belongs to k)
P(k|x)P(k|x) = Posterior probabilityPosterior probability (Probability to belong to k given x)
M
k
kPkx
kPkxxkP
1
)()|Pr(
)()|Pr()|(
M
k
kPkx
kPkxxkP
1
)()|Pr(
)()|Pr()|(
A Bit of Bayes!A Bit of Bayes!

October 19, 2000 ACAT 2000, Fermilab, Suman B. Beri
If ddkk = 0 for class k = 1 (e.g., background) ddkk = 1 for class k = 2 (e.g., signal)
Then
)|2(),( xPxn )|2(),( xPxn
Special Case: ClassificationSpecial Case: Classification
M
kNxkP
kdxn
1),|(),(
M
kNxkP
kdxn
1),|(),(
Reduces to

October 19, 2000 ACAT 2000, Fermilab, Suman B. Beri
Neural Networks in Run I and IINeural Networks in Run I and II
Run IRun I
Used by DØ to discriminate signal from background
Used in the lepton + jets channel for top quark mass measurement
Run IIRun II
Can they be used to measure masses?
Test some ideas using the e- channel

October 19, 2000 ACAT 2000, Fermilab, Suman B. Beri
The e-The e- channel channel
Pbar
bb
t
bb
t
P
ee
ee
W
W

October 19, 2000 ACAT 2000, Fermilab, Suman B. Beri
Branching fractionsBranching fractions
ee
eee+jets
jets
jets
6 jets44.4%
1.25%
2.5%
14.8%
14.8%
14.8%
+jets

October 19, 2000 ACAT 2000, Fermilab, Suman B. Beri
Characteristics of e-Characteristics of e- Events Events
SignatureSignatureTwo isolated, high pT leptons
Significant missing transverse energy
2 jets from b quarks
Branching fractionBranching fraction~ 2.4 %

October 19, 2000 ACAT 2000, Fermilab, Suman B. Beri
Event SimulationEvent Simulation
ToolsTools:Pythia 6.143 to generate eventsSHW 2.3 to model detector (John Conway)MLPfit 1.4 to train networksPython interface to above tools
SignalSignal Top events (100 to 250 GeV in steps 10 GeV)
BackgroundsBackgroundsZ +- eWW e

October 19, 2000 ACAT 2000, Fermilab, Suman B. Beri
Event VariablesEvent Variables
VariablesVariables:
x1 = f(e,b1)
x2 = f(,b2)
x3 = f(e,b2)
x4 = f(,b1)
where22),( Wmblblf 22),( Wmblblf
End-point occurs at the top mass if b quark and the lepton are correctly pairedEnd-point occurs at the top mass if b quark and the lepton are correctly paired

October 19, 2000 ACAT 2000, Fermilab, Suman B. Beri
Distributions: Correct/Wrong PairingDistributions: Correct/Wrong Pairing
Parton-level (blueblue) distributions compared to distributions at thereconstruction-level (redred).
We see that these variables are insensitive to jet energy scale uncertainties and fragmentation
Also, note the sharp end-pointwhen the b and lepton arecorrectly paired.

October 19, 2000 ACAT 2000, Fermilab, Suman B. Beri
Distributions: Reconstruction LevelDistributions: Reconstruction Level
We have not yet devised a methodto pair the lepton and b quark withhigh probability.
For now we take all pairings of leptons and b quarks.

October 19, 2000 ACAT 2000, Fermilab, Suman B. Beri
Combining Variables using NNCombining Variables using NN
Use NN to create a single mass-dependent variable y from the variables x1 to x4
TrainingTraining:
500 events/top mass (100 to 250 in steps of 10)
Target output dk= top quark mass
200 epochs

October 19, 2000 ACAT 2000, Fermilab, Suman B. Beri
Neural Network Output DistributionsNeural Network Output Distributions
160 GeV169 ± 23
170 GeV175 ± 25
180 GeV181 ± 24
190 GeV186 ± 25
GeV GeV

October 19, 2000 ACAT 2000, Fermilab, Suman B. Beri
Mean NN output vs Top MassMean NN output vs Top Mass
The distortions are caused by edge effects, that is, restriction to a finite range.
Need to deal with this.

October 19, 2000 ACAT 2000, Fermilab, Suman B. Beri
Some thoughts about how to proceedSome thoughts about how to proceed
Let y = be the NN output.
Let P(y|mt) denote the probability to get y given the true top mass mt.
Use Bayes’ theorem to invert probability:
Use position of max[P(mt|y] as top mass estimate
M
kk
kk
myP
myPymP
1
)|(
)|()|(
M
kk
kk
myP
myPymP
1
)|(
)|()|(

October 19, 2000 ACAT 2000, Fermilab, Suman B. Beri
SummarySummary
The challenge in Run II will be to reduce substantially the systematic uncertainties.
We are conducting a systematic study of neural network based methods of mass measurement.
This is just the beginning.
From our success in Run I we are hopeful that our current efforts will be fruitful.