october 12 2005keck hydrowatch – uc berkeley1 keck hydrowatch center at uc berkeley
Post on 22-Dec-2015
213 views
TRANSCRIPT

October 12 2005
Keck HydroWatch – UC Berkeley 1
Keck HydroWatch Centerat UC Berkeley

October 12 2005
Keck HydroWatch – UC Berkeley 2
Project Personnel
Investigators• Inez Fung• Ron Cohen• David Culler• Bill Dietrich• Don DePaolo• Jim Kirchner
Collaborators• Todd Dawson• Mark Conrad• Collin Bode
• Mary Power• Beth Boyer• Tina Chow

October 12 2005
Keck HydroWatch – UC Berkeley 3
Current State of Water Research and Understanding
Routine obs of•Precipitation•Streamflow•River discharge
Satellite obs of•Clouds•Water vapor (expt)•Snow and ice cover
Disciplinary water research
• View of entire lifecycle of water – from sea to sea
• High frequency and comprehensive data on hydrologic processes and water pathways
• Predictions at small enough space scale and long enough time scale to be useful to human welfare
LACKING

October 12 2005
Keck HydroWatch – UC Berkeley 4
Water in Motion: Key Questions
• How is fresh water re-supplied and recycled? – Distribution of precipitation will
change as climate changes. Demand for fresh water will increase with population.
Rain
People
•What is the distribution of water vapor in the lowest kilometer of the atmosphere and of soil moisture across the landscape, and how do atmospheric and land surface processes alter these distributions?
October 12 2005
Keck HydroWatch – UC Berkeley 5
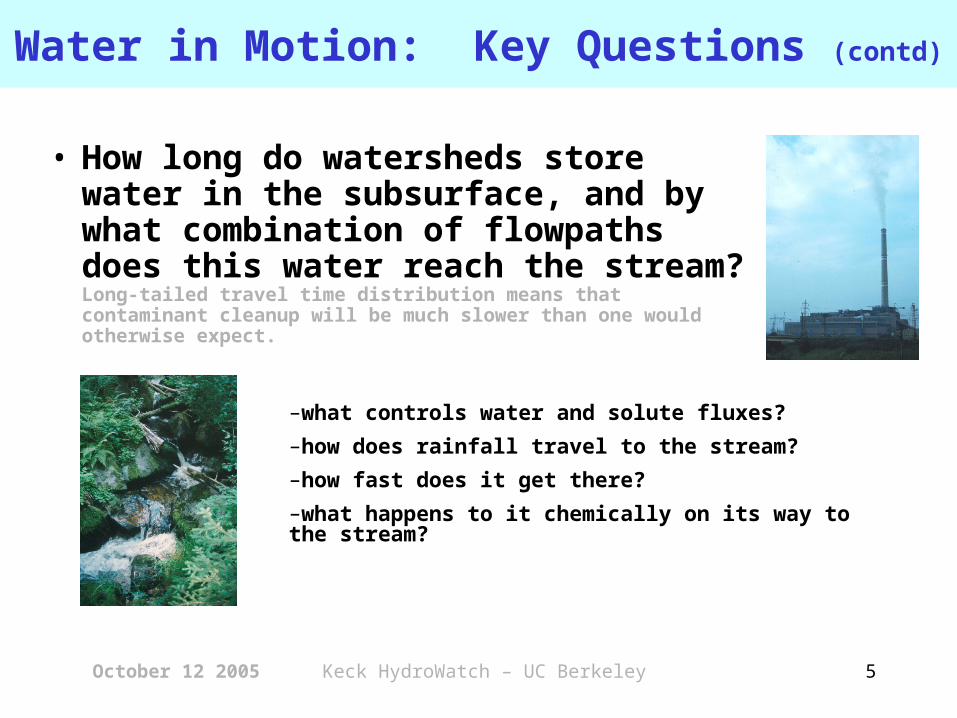
Water in Motion: Key Questions (contd)
• How long do watersheds store water in the subsurface, and by what combination of flowpaths does this water reach the stream? Long-tailed travel time distribution means that contaminant cleanup will be much slower than one would otherwise expect.
–what controls water and solute fluxes?
–how does rainfall travel to the stream?
–how fast does it get there?
–what happens to it chemically on its way to the stream?

October 12 2005
Keck HydroWatch – UC Berkeley 6
Sagehen Creek Field Station
•Winter snow, spring melt•Volcanic bedrock•Gravel bedded, runs
through a meadow•Forest cut in the early
1900’s
Elder Creek Watershed•Winter rain, summer dry•Sedimentary bedrock•Steep, no floodplain•Old growth forest
Colored digital vegetation and topography from a lidar survey
Two Contrasting Study Watersheds

October 12 2005
Keck HydroWatch – UC Berkeley 7
Three gauges on ephemeral tributaries
Four streamflow gauges on Sagehen Creek
Sagehen Creek Field Station

October 12 2005
Keck HydroWatch – UC Berkeley 8
Summit wx stn. temperature precipitation humidity solar radiation winds
SNOTEL site snow depth snow water content temperature soil moisture
Gauging stn. flow stream temp. conductivity
DRI wx stations temperature humidity soil moisture winds
Meadow wx stn. temperature precipitation humidity solar radiation snow depth winds barometric press. soil moisture soil temp.

October 12 2005
Keck HydroWatch – UC Berkeley 9
Data relay towers
Data from upper basin is relayed to summit tower.
Data from lower basin is relayed to field station headquarters, then to internet via satellite.
Sagehen wireless data infrastructure

October 12 2005
Keck HydroWatch – UC Berkeley 10
Lower area of Elder Creek watershed, showing the channel network
ACRR bare earth from Lidar data
ACRR vegetated from Lidar data
ELDER CREEK: 17 km2; 7 km long; 400 to 1200 m elevation; 2000 m annual rainfall (strongly seasonal); steep, landslide-prone topography with a boulder-covered channels in narrow canyons. One of the largest uncut area of forests in California.

October 12 2005
Keck HydroWatch – UC Berkeley 11
USGS station operating since 12-22-1964
Elder Creek USGS station operating since 12-22-1964
Branscomb USGS 1947-1977
And restarted by UCB since 1990
USGS on Tenmile 1955-1977
Existing Hydrologic Programs at Elder Creek

October 12 2005
Keck HydroWatch – UC Berkeley 12
Elder Creek Wireless Infrastructure

October 12 2005
Keck HydroWatch – UC Berkeley 13
Keck HydroWatch ProjectWatersheds are gatekeepers of the•hydrologic cycle... controlling stream flow, soil moisture, evapo-transpiration and groundwater supply.
•Biogeochemical cycle …controlling solute fluxes, evolution of atmos. CO2,nutrient dynamics, and pollutant delivery to downstream waters.
•Landform evolution … controlling rates and patterns of erosion and sediment deliveryGOAL: a new observation and modeling paradigm
to advance our understanding of the water cycle and our ability to predict its changes

October 12 2005
Keck HydroWatch – UC Berkeley 14
(I) Autonomous Measurements of Atmos Water
At 200 points in each watershed will be motes that measure:
• Air Temperature• Relative Humidity• Air Pressure• Location (GPS)• Soil Moisture/Temperature

October 12 2005
Keck HydroWatch – UC Berkeley 15
Electromagnetic pulse sent down parallel waveguides that are inserted in the soil. Travel time across soil between guides is a function of the water content.
•Soil moisture dynamics influence runoff generation and control water availability to plants and, thereby, affect air humidity.
•We will install wireless soil moisture monitoring devices across diverse topography to record storm and seasonal dynamics.
(II) Soil Moisture
Time domain reflectometry (TDR)

October 12 2005
Keck HydroWatch – UC Berkeley 16
• Sample rainfall and streamflow daily
• with higher-frequency sampling during selected storm events.
• Chemical analysis, including 18O
• Monitor major elements,pH, etc. continuouslyvia online autoanalyzers
(III) Intensive Stream Measurements
20406080
100120140160
Co
ndu
ctiv
ity
Conductivity (weekly grab samples)
0.1
1
10
360 380 400 420 440 460
Flo
w (
mm
/hr)
Day number
Hourly flows
20406080
100120140160
Co
ndu
ctiv
ity
Conductivity (hourly)

October 12 2005
Keck HydroWatch – UC Berkeley 17
H2O, HDO, H218O
Dust & moisture
Sr, Nd, Pb, U, S isotopes
Evapo-transpiration effects
(O,H isotopes)
Adsorption, desorption, mineral dissolution and
precipitation(Sr, U, C isotopes)Biological activity
(C, H, N, S, Fe isotopes)
(IV) Integrative Water TracersIsotopic tracers are provided by nature and can help identify sources of water and dissolved constituents

October 12 2005
Keck HydroWatch – UC Berkeley 18
Condensation
Ocean
Evaporation
Transpiration
Evaporation
Canopy
Land
Evaporation
Fractionation
No fractionation
Atmospheric Model: WRF …
Weather Research and Forecasting (WRF) model
• Collaborative development: The National Center for Atmospheric Research (NCAR), the National Oceanic and Atmospheric Administration (the National Centers for Environmental Prediction (NCEP) and the Forecast Systems Laboratory (FSL), the Air Force Weather Agency (AFWA), the Naval Research Laboratory, Oklahoma University, and the Federal Aviation Administration (FAA).
• Flexible application• Flexible resolution:
meters to km• We will incorporate
isotopes and other water tracers into WRF.
Schematic of isotope code incorporated into NCAR climate model (J-E Lee, PhD thesis, UC Berkeley)

October 12 2005
Keck HydroWatch – UC Berkeley 19
…to be coupled to a Hydrologic Model: tbd
(1) Including all the details makes models unwieldy and undecipherable . Requires too much information about terrain properties. Not readily generalizable to the globe.
x
Cv
x
CD
t
C
2
2
(2) Spatially extended, but not spatially disaggregated, models... a 'middle path'
Two key parameters: mean travel time o = L/2 Peclet number Pe = L/2D

October 12 2005
Keck HydroWatch – UC Berkeley 20
Schedule: 2006
• Initiate development of new sensors, precipitation sampler
• Infrastructure “proof-of-concept” by deploying off-the-shelf components– April-Sept: Sagehen– Nov-April: Elder Creek
• Data Synthesis and Modeling: – Develop software for data archival and retrieval– Adapt isotope codes to atmospheric WRF model– Exercise WRF model in various resolutions (from
meters to km)

October 12 2005
Keck HydroWatch – UC Berkeley 21
Schedule: 2007
• Bench test and field test new sensors and instruments
• Extend infrastructure/communication network• Begin large scale replication of sensors• Evaluate hydrology models
• Establish a synthetic observing network structure for modeling and build simulation capacity and data assimilation capacity
• Integrate atmospheric and ground water models into a single model for each watershed

October 12 2005
Keck HydroWatch – UC Berkeley 22
Schedule: 2008
• Full year of observations at both sites • Integrate water system model for
watershed• Interim Assessment
– Evaluate water system model using new observations (waiting for surprises!)
– Assess observational network in terms of sensor accuracy, coverage (space & time), reliability
– Assess strategy for growing obs network
• Science: – new constraints on subsurface properties of
watersheds – new discoveries from high-resolution
observations

October 12 2005
Keck HydroWatch – UC Berkeley 23
Schedule: 2009
• Second full year of observations at both sites
• Address key science questions that focus on the life-cycle of water
• Develop strategy for large scale deployment – science, technical, fund raising

October 12 2005
Keck HydroWatch – UC Berkeley 24
Management
C u lle r, D ie trich , D eP ao loC on rad , h a rd w are en g in eer
Instrum entationC oh en /K irch n er
D eP ao lo , D ie trich , C oh enso ftw are en g in eer
M odelingK irch n er/F u n g
B od e, so ftw are en g in eer
InfrastructureD ie trich /K irch n er/C oh en
PI/CoordinatorF u n g
Scientific Investigation
All
Data Synthesis
All
Monthly meeting of entire team

October 12 2005
Keck HydroWatch – UC Berkeley 25
Leveraging Keck Funding
• SCIENTIFIC– NSF, NOAA, NASA, DoE, USGS– Grad fellowships
• MAINTENANCE OF INFRASTRUCTURE– UCOP– National Center for Earth Surface
Dynamics

October 12 2005
Keck HydroWatch – UC Berkeley 26
Expected Outcomes
• Prototype a new observing system and a new integrated model for the life cycle of water
• For Sagehen and Elder Creek: – Understanding the sources, transport, and
interactions of water along its path– Scenarios of changes in quantity and quality of
water given climate and human perturbations

October 12 2005
Keck HydroWatch – UC Berkeley 27
Long-Term Impact
• Transformative observations of water in motion – analogous to weather satellites
•Improve and extend forecast of water dynamics:
– Month forecast of floods/droughts/streamflow
– 10 day forecast of river levels
•Source attribution of distributed pollutants