oct findings: lesson from stable vs unstable plaques from stable and unstable... · oct findings:...
TRANSCRIPT

ANGIOPLASTY SUMMIT –TCTAP 2010
Imaging Workshop
OCT Findings: Lesson from Stable vs Unstable Plaques
Giulio Guagliumi MDOspedali Riuniti di Bergamo, Italy

DISCLOSURE OF FINANCIAL INTERESTS
ConsultantBoston ScientificVolcano
Grant/ Research SupportMedtronic Boston ScientificLightLab Imaging Abbott VascularLabcoat
Giulio GuagliumiOspedali Riuniti di Bergamo, Italy

Calcified Artery with/without Surface Lipid Pool
LP
Ca++
IVUSOFDI

G. Guagliumi and M. Costa Editorial Comment JACC Interv 2009 May18; 2: 467G. Guagliumi and M. Costa Editorial Comment JACC Interv 2009 May18; 2: 467
From a Foggy Sight to a Clear VisionFrom a Foggy Sight to a Clear Vision

ACS: Focus on mid-distal LAD
V. Sirbu Ospedali Riuniti di Bergamo

CSA=6.17mm² CSA=5.10mm² CSA=8.70mm²
CSA stenosis=31%
LAD LMFocus on proximal LAD

TCFA in Proximal LAD

Lipid plaque
Fibrous cap
30µm
100µm
Kubo et al. Expert Rev Med Dev. 2008;5:691-7
TCFA was defined as a plaque with fibrous cap <65µm thick. The high resolution of OCT has an ability to identify thin-fibrous cap clearly even if it is less than 100µm.
Thin-cap fibroatheroma (TCFA)

0
20
40
60
80
plaque rupture0
40
80
120
160
cap thickness0
0.5
1
1.5
2
2.5
MLA 0
10
20
30
40
ulceration/no cap rupture
% µm mm² %
Clinical Presentation and Plaque Morphology in Unstable Angina
M. Mizukoshi et al. i2 ACC. 2010; JACC Poster 1152-257
Class I Class II Class III
p<0.001 p<0.001 p=0.003 p<0.001

0
20
40
60
80
100
Plaque rupture
0
40
80
120
160
200
Cap Thickness
% µm
Multivessel Desease: SAP vs AMIInfarct Related Artery
Kubo T et al. Am J Cardiol 2010:105:318-322
SAP AMI
p<0.001 p=0.003 p<0.001
0
20
40
60
80
100
Thrombus
%

0
20
40
60
80
100
TCFA0
40
80
120
160
200
Cap Thickness
µm
Multivessel Desease: SAP vs AMINon Infarct Related Artery
Kubo T et al. Am J Cardiol 2010:105:318-322
SAP AMI
% p=0.030 p=0.002

①
②
③
④⑤
⑥
⑦
⑧ ⑨ ⑩ ⑪
⑫
⑬
①②
③
⑥⑦⑧⑨
⑩
⑪
⑬ ⑫
④ ⑤
The culprit lesion was in LCX (#11). TCFA (⑥), plaque rupture (⑦, ⑧) and intracoronary thrombus (⑦, ⑧) were observed by OCT. Although the plaques in LAD (⑫, ⑬) were not unstable, TCFA (①-⑤) and plaque rupture (③, ④, ⑤, ⑩, ⑪) were detected by OCT in the non-culprit lesions of RCA and LCX .
Kitabata, Kubo et al. Heart. 2008;94:544
Multiple plaque rupture in AMI: 3-vessel OCT examination

ACS Multilink ™3.0/25 mm 12 yrs after implant
G. Guagliumi, V. Sirbu Ospedali Riuniti di Bergamo

Ospedali Riuniti di Bergamo
LAD distally to the thrombotic stent site in VLST of BMS

Ospedali Riuniti di Bergamo
TCFA rupture

Ospedali Riuniti di Bergamo
TCFA rupture
32 µm

% necrotic-core: 22%Angle of the total NCCL 100.3º
Cap thickness; 40µmCap thickness; 40µm
NonNon--thinthin--cap IVUScap IVUS--derived TCFA n=33derived TCFA n=33
% necrotic-core: 15%Angle of the total NCCL 35.8º
Cap thickness; 90µmCap thickness; 90µm
T. Sawada, et al. EHJ 2008; 29(9):1136-1146
Use of VH-IVUS vs OCT for detecting in-vivo TCFA
Definite TCFA n= 28Definite TCFA n= 28

Non-TCFA VH +, OCT -
(n=33)
Non-TCFA VH +, OCT -
(n=33)
Definite-TCFAVH +, OCT +
(n=28)
Definite-TCFAVH +, OCT +
(n=28)
65.3 (39.3, 91.4)65.3 (39.3, 91.4)• Plaque volume (mm3/cm)• Plaque volume (mm3/cm)
1.10 (1.06, 1.13)1.10 (1.06, 1.13)• Remodelling index• Remodelling index
Gray-scale IVUSGray-scale IVUS
VHVH
• % Necrotic-core• % Necrotic-core
• Total NCCL angle (degree)• Total NCCL angle (degree)
T. Sawada, et al. EHJ 2008; 29(9):1136-1146T. Sawada, et al. EHJ 2008; 29(9):1136-1146
96.3 (75.6, 117.0)96.3 (75.6, 117.0)
1.21 (1.17, 1.25)1.21 (1.17, 1.25)
0.0010.001
0.00050.0005
18.6 (15.7, 21.4)18.6 (15.7, 21.4)
54.6 (35.6, 73.5)54.6 (35.6, 73.5)
20.0 (17.0, 22.9)20.0 (17.0, 22.9)
89.4 (63.6, 112.4)89.4 (63.6, 112.4)
NSNS
0.00030.0003
Combined use of IVUS-VH and OCT for detection of TCFACombined use of IVUS-VH and OCT for detection of TCFA
P P

G. Guagliumi, V. Sirbu Ospedali Riuniti di Bergamo

in-vivo Association between Positive Remodeling and TFCAIVUS and OCT imaging in 54 lesions from 48 pts
O. Raffael Eur Heart J 2008; 29:1721
0
20
40
60
80
100
Positive Absent Negative
Remodeling
p < 0.001
% of TCFA within each group
80 %
38.5 %
5.6 %

Cavity
Thrombus
Rupture Site
Cavity
Thrombus
NCNC
Cavity
IVUSOFDI
NCNC
Courtesy R. Virmani MD

FindingFinding OCT(n=30)OCT(n=30)
AS(n=30)AS(n=30) pp
Fibrous cap disruptionFibrous cap disruption
Fibrous cap erosionFibrous cap erosion
ThrombusThrombus
73% *†73% *†
100% †100% †
47%47%
3%3%
100% ‡100% ‡
0.0210.021
IVUS(n=30)IVUS(n=30)
40%40%
23% *†23% *† 0%0%
33%33%
0.0030.003
< 0.001< 0.001
OCT identifies plaque rupture, cap erosion and TCFA..and ThrombusOCT vs AS vs IVUS: 30 AMI pts
Kubo et al. J Am Coll Card 2007; 50: 933
* OCT vs AS, p<0.05. †OCT vs IVUS, p<0.01. ‡ AS vs IVUS, p<0.01.

OCT Findings of Culprit LesionsOCT Findings of Culprit Lesions
7070
STEMIn=40
STEMIn=40
NSTE ACSn=49
NSTE ACSn=49
P valueP value
9090
7878
4747
7171
4949
0.0330.033
0.0360.036
0.0080.008
55±2055±20 109±55109±55 0.00010.0001
7878 2727
00 3232
RedRedWhiteWhiteNoneNone
Thrombus %Thrombus %
Fibrous Cap Thickness µmFibrous Cap Thickness µm
TFCA %TFCA %
Lipid Rich Plaque %Lipid Rich Plaque %(>= 2 Quadrants)(>= 2 Quadrants)
Plaque Rupture %Plaque Rupture %
0.00010.0001
2222 4141
M. Riga i2ACC 2010, JACC A190 : 2501-503M. Riga i2ACC 2010, JACC A190 : 2501-503

OCT and IVUS Findings After PCI in UAP and SAP PatientsOCT and IVUS Findings After PCI in UAP and SAP Patients
T. Kubo et al J Am Coll Cardiovasc Imaging, July 2008:475-84T. Kubo et al J Am Coll Cardiovasc Imaging, July 2008:475-84
UAPUAP
SAPSAP
Inadequate *Stent Apposition
Inadequate *Stent Apposition
Tissue* Protrusion
Tissue* Protrusion
Intracoronary* Thrombus
Intracoronary* Thrombus
IVUS IVUS
(%)(%)
Inadequate Stent Apposition
Inadequate Stent Apposition
Tissue Protrusion
Tissue Protrusion
Intracoronary Thrombus
Intracoronary Thrombus
OCTOCT(%)(%)
P< 0.001p=0.001OCT vs IVUS*

� HORIZONS AMI: 2 Separated Lesions TAXUS 2.75 20 mm + 3.0 20 mm
Ospedali Riuniti di Bergamo
Index Procedure 13 month FU
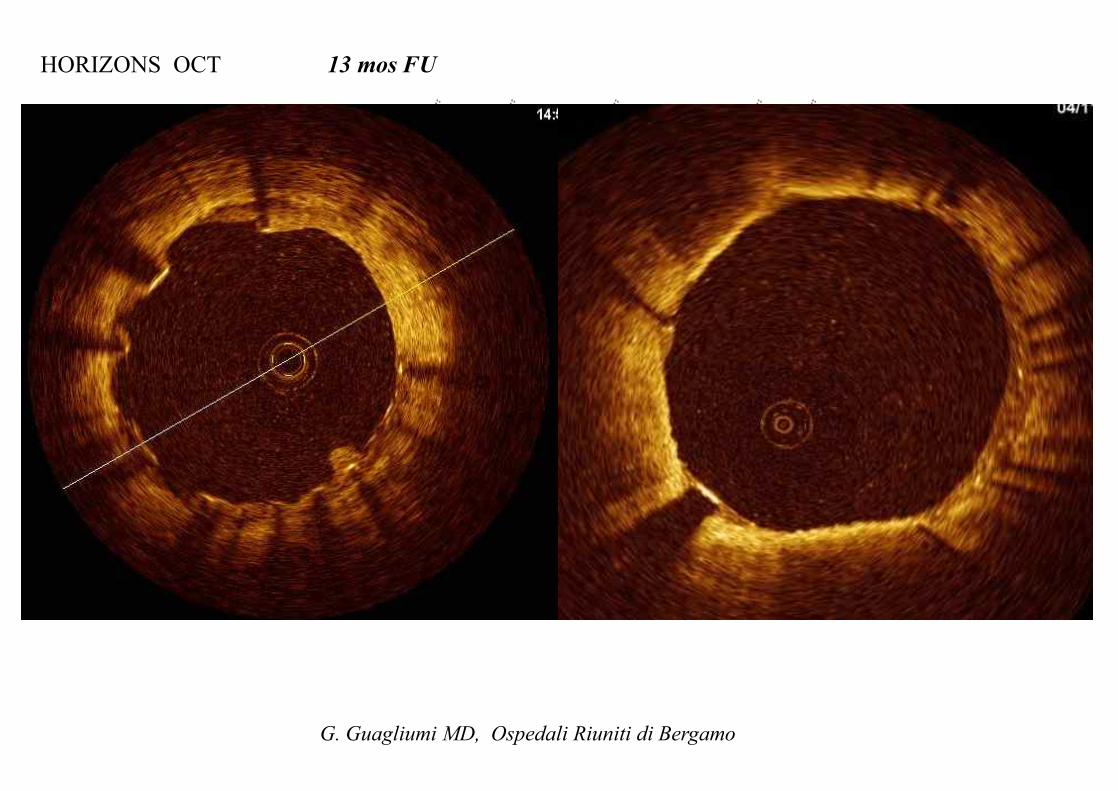
HORIZONS OCT 13 mos FU
G. Guagliumi MD, Ospedali Riuniti di Bergamo
TAXUS 2.75 x 20 mm culprit lesion
TAXUS 3.0 20 mm non culprit

PSST
. 538
1 A
pril
2009
Pag
e 27
of 1
9
Difference in Difference in DES Incomplete Strut Apposition (ISA)DES Incomplete Strut Apposition (ISA)Stable /UA Stable /UA vsvs STEMI STEMI
STEMI: N=16
Stable/Unstable Angina : N=27
% Lesion with at least one ISA
% Frames with at least one ISA
% of Incompletely apposed struts
(%)p=0.01
N. Gonzalo et al JACC Int 2009; 2 (5): 445-452
Median follow-up time 9 months (range 7 to 72)DES: Cypher, Taxus, Xience, Biolimus

G. Guagliumi : HORIZONS Trial 3604 AMI randomized
B1
Thrombus Naturally or Pharmacologically Remodels OvertimeDelayed Healing? Late Incomplete Apposition?

STEMI
Postimplant
6 mos FU
G. Guagliumi, V. Sirbu Ospedali Riuniti di Bergamo

OCTAMI Trial : Index RCA Endeavor 3.0/24 mm
6 mos FU OCT
G. Guagliumi et al TCT Featured Clinical Research, JACC Intv 2010 May, in press

G. Guagliumi et al OCTAMI Featured Research TCT, JACC Intv 2010, May in pressG. Guagliumi et al OCTAMI Featured Research TCT, JACC Intv 2010, May in press
Coverage distribution in different cross-sections along the Stent 6-month FU
Coverage distribution in different cross-sections along the Stent 6-month FU
Proximal
Perc
enta
ge o
f Cov
ered
Stru
ts
DistalMid
ZESBMS(%)

HORIZONS OCT: 13 Months118 Consecutive STEMI pts enrolled in HORIZONS, 155 Taxus™ vs 45 BMS
Independent Core Labs Blind to the stent assignmentOCT Core Lab: Case Western Reserve Univeristy, Cleveland, OH
p=0.0003%
p<0.0001
G. Guagliumi et al, LBT Abstracts Circulation 2008;118:2309-17, submittedG. Guagliumi et al, LBT Abstracts Circulation 2008;118:2309-17, submitted
7,748 cross-sections- 44, 121struts

PSST
. 538
1 A
pril
2009
Pag
e 33
of 1
9
% Lesion with at least one uncovered
strut
% Frames with at least one uncovered strut
% Uncovered struts
(%)p=0.04
Median follow-up time 9 months (range 7 to 72)
N. Gonzalo et al JACC Int 2009; 2 (5): 445-452
Difference in Uncovered Strut Frequency Difference in Uncovered Strut Frequency -- DES DES
STEMI: N=16
Stable/Unstable Angina : N=27

0
5
10
15
20
25
30
35
-0.7 -0.5 -0.3 -0.1 0.1 0.3 0.5 0.7 0.9 1.1 1.3 1.5
Perc
ent o
f Stru
ts (%
)
Strut-Lumen Distance
%
mm
Consistent Strut Level Analysis among the OCT studies with PESHORIZONS OCT (AMI), ODESSA (Long Lesions with stent in overlap), OCTDESI (on label)
Trial Taxus Stentsn
Strutsn
FUmos
ODESSA Liberté 44 11,908 6Horizons OCT Express 115 34,142 13OCTDESI Liberté 19 34,474* 6
*based on every frame analysis
80,524

Backscattered power curves for calcific, fibrous and lipid tissues
Quantitative Analysis
0 100 200 300 400 500 600
100
101
depth (mm)
rela
tive
pow
er P
(z)/P
0(z)
calciumfiberlipid
Plaque type Backscattering coefficient
Attenuation coefficient
Calcification 4.9 ± 1.5 5.7 ± 1.4Fiber 19.2 ± 5.2 6.6 ± 0.7Lipid 29.7 ± 6.4 14.9 ± 2.5
Xu C, Schmitt J et al J Biomed Optics 2008 june ; 13: 034003

OFDI Instent restenosis
Macrophages
Courtesy R. Virmani MD
A. Tanaka , G. Tearney, B. Bouma J Biomed Optics Jan/Feb 2010

Plaque Characterisation
Stents

• Today, the in vivo assessment of entire segments of coronary arteries is possible due to significant improvements in imaging acquisition methods (FD-OCT).
• OCT lesion findings are related to clinical presentation (SAP ≠ ACS , STEMI ≠ non STEMI) and different in culprit compared with not culprit vessel.
• Simultaneous assessment of culprit and not culprit lesions can track atherosclerotic changes overtime (D cap tichkness, D number of TFCA,...) evaluating progression and regression and the effects of treatment.
• Challenging informations like macrophage density need to be further validated
• Incomplete struts apposition, plaque protrusion and thrombus formation after stenting are more frequently observed in UAP vs SAP.
• Data from randomized OCT based studies do not entirely support > uncovered struts in STEMI vs SAP/UAP when treated with PES
• The major expected advances in OCT for lesion assessment are at 3 different levels: cellular (texture parameters), plaque (tissue characterization spectroscopy) and vessel (3D volumetric rendering of the pathology)
Conclusions

OCT in Late and Very Late Stent Thrombosis
Case TIMEto LST DES type Indication at index Overlap DES
Length, mmAntiplatelet
therapy
1 485 SES ACS YES 28 Aspirine2 1438 SES ACS YES 33 Aspirine3 1836 SES ACS NO 18 Aspirine4 200 PES ACS YES 32 DAT5 365 PES SA YES 44 None6 1224 SES ACS NO 33 Aspirine7 172 EVES ACS NO 18 DAT8 275 PES ACS NO 24 DAT9 508 PES ACS YES 48 Aspirine10 508 PES ACS YES 48 Aspirine11 1103 SES SA YES 33 None12 590 PES ACS YES 100 Aspirine13 1174 PES ACS YES 36 Aspirine14 1093 PES ACS NO 24 Aspirine15 1078 PES ACS YES 48 Aspirine16 404 PES ACS NO 16 Aspirine17 569 ZES ACS YES 48 Aspirine18 640 PES ACS NO 24 Aspirine
Mean 579 days, (424-1100) 36±19 mm88%
V. Sibu ESC 2008, Young Investigator Awarded Session Thrombosis , ESC 2008

Baseline
15 mos
Prox end Distal end
Artery Wall
Lipid
Calcium
Macrophages
Stent
Guide Wire
Thrombus
Prox end Distal end
Courtesy G. Tearney MGH and B. Bouma MIT Boston