oct. 2004math meets mapsslide 1 math meets maps a lesson in the “math + fun!” series
Post on 21-Dec-2015
218 views
TRANSCRIPT

Oct. 2004 Math Meets Maps Slide 1
Math Meets MapsA Lesson in the “Math + Fun!” Series
Oct. 2004 Math Meets Maps Slide 2
About This Presentation
Edition Released Revised Revised
First Oct. 2004
This presentation is part of the “Math + Fun!” series devised by Behrooz Parhami, Professor of Computer Engineering at University of California, Santa Barbara. It was first prepared for special lessons in mathematics at Goleta Family School during the 2003-04 and 2004-05 school years. The slides can be used freely in teaching and in other educational settings. Unauthorized uses are strictly prohibited. © Behrooz Parhami

Oct. 2004 Math Meets Maps Slide 3
Globes and Flat MapsContinents and countries appear to scale on a globebut they get distorted when drawn on some flat maps
Africa same size on globe and map,but Greenland much wider on map

Oct. 2004 Math Meets Maps Slide 4
The Globe Can Be Flattened
Segment in a photographic map of Mercury, with gaps inserted to preserve scale

Oct. 2004 Math Meets Maps Slide 5
1. Cut out the two pieces on the left and attach them to form a strip
2. Make the strip into a circle
3. Bring the tips of opposing petals together so that the small circles at the tips overlap; glue or tape
Activity 1:Making a
Hemisphere

Oct. 2004 Math Meets Maps Slide 6
Activity 2: Flattening a Globe
1. Take the hemisphere you made or half an orange peel or ball and draw a map on it
3. Open up the hemisphere or cut the orange peel and flatten it (make sure you don’t cut to the edge)
4. Measure the distance between the same two cities and explain what happened
2. Mark two cities on the map and measure their distance
The hemisphere you made out of paperor half an orange peel or rubber ball

Oct. 2004 Math Meets Maps Slide 7
Another Way of Drawing Flat Maps

Oct. 2004 Math Meets Maps Slide 8
The Equator
The Equator
Verticallongitudinal
lines
Curvedlongitudinal
lines

Oct. 2004 Math Meets Maps Slide 9
0 100 200 300 400 500 1000 MilesMap Scale
Scale doesnot apply to HI & AL

Oct. 2004 Math Meets Maps Slide 10
ReliefMap ofCalifornia
Sea level
Hillsides
Hills
Mountains
Belowsea level

Oct. 2004 Math Meets Maps Slide 11
A Closer Look atthe Relief Map forSouthern California
0 50 100 mi
Oct. 2004 Math Meets Maps Slide 12
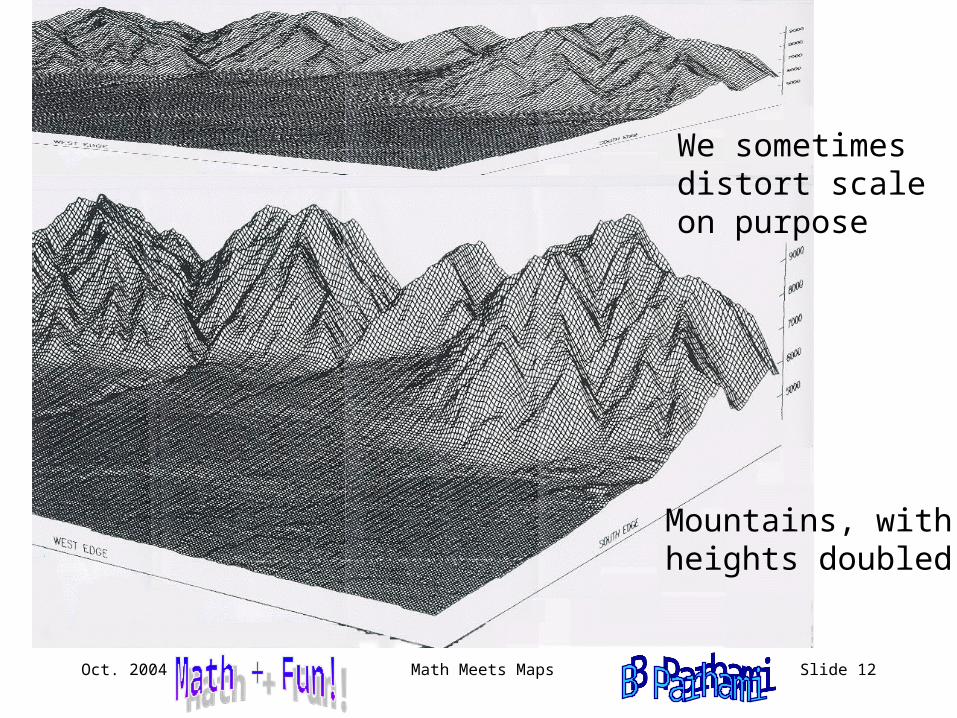
We sometimesdistort scaleon purpose
Mountains, withheights doubled

Oct. 2004 Math Meets Maps Slide 13
Other Examples of Distorted Images

Oct. 2004 Math Meets Maps Slide 14
Aerial Image Looking South from Goleta toward Santa Barbara

Oct. 2004 Math Meets Maps Slide 15
The Previous Image with Exaggerated
Mountain Heights

Oct. 2004 Math Meets Maps Slide 16
Satellite Image of theSanta Barbara Channel

Oct. 2004 Math Meets Maps Slide 17

Oct. 2004 Math Meets Maps Slide 18
Activity 3: From the lyrics of a 1950s song, “Twenty-six miles across the sea,Santa Catalina is awaitin’ for me” establish a scale for this map

Oct. 2004 Math Meets Maps Slide 19
Contour Map

Oct. 2004 Math Meets Maps Slide 20
Activity 4: Pick two points on this map andbuild a hiking trail between themso that it is as flat as possible.

Oct. 2004 Math Meets Maps Slide 21
Contour Map Under the Water

Oct. 2004 Math Meets Maps Slide 22
Distribution of news stories
during 1994-98
Cartograms CombineGeographic and Other Data
Standard US map, showing stateswon by Bush (red) and Kerry (blue)
Cartogram, with states distorted to haveareas proportional to electoral votes
Cartogram, with relative support levelfor candidates indicated by shading
Outcome ofthe 2004 USpresidential
election(S. Fabrikant,UCSB Geog Dept)

Oct. 2004 Math Meets Maps Slide 23
The Map Coloring ProblemWe want to color countries, oceans, lakes, and islands on a map so that no two adjacent areas have the same color.
Twocolors
Threecolors
Fourcolors

Oct. 2004 Math Meets Maps Slide 24
Map and Graph Coloring
Map to becolored
Equivalentgraph

Oct. 2004 Math Meets Maps Slide 25
Activity 5: Color These MapsUse as few colors as possible
Real map: One color already used Made-up map

Oct. 2004 Math Meets Maps Slide 26
Next LessonThursday, November 4, 2004