ocps developer winner workshop for goba planning & governmental ... –eru = net development...
TRANSCRIPT

OCPS DEVELOPER
WORKSHOP FOR GOBA WINNER
September 24, 2015

Our Team
• Planning, Governmental, & Labor Relations – Scott Howat, Senior Executive Director
• Planning & Student Enrollment – Dr. Carol McGowin, Director
• Planning & Governmental Relations – Julie Salvo, AICP, Senior Administrator
– Tyrone Smith, AICP, Senior Administrator
– Jamie Boerger, AICP, Leed AP, Administrator
• Legal Services – Eileen Fernandez, Esq., Associate General Counsel
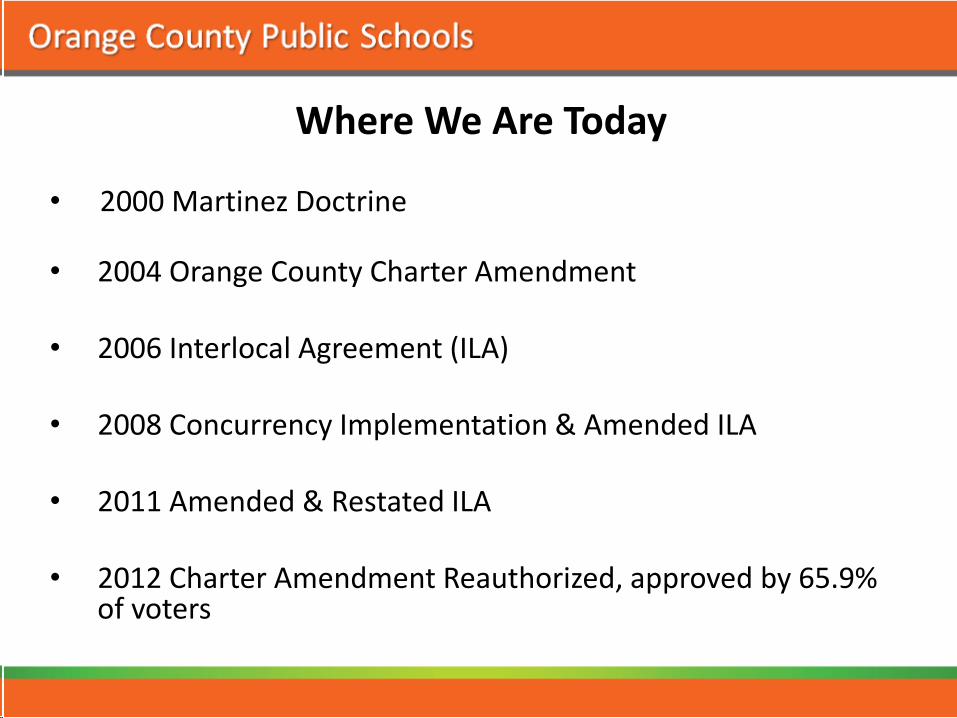
Where We Are Today
• 2000 Martinez Doctrine
• 2004 Orange County Charter Amendment
• 2006 Interlocal Agreement (ILA)
• 2008 Concurrency Implementation & Amended ILA
• 2011 Amended & Restated ILA
• 2012 Charter Amendment Reauthorized, approved by 65.9% of voters

OCPS Planning & Governmental Relations: What We Do
• Informal Capacity Inquiries
• Formal Capacity Determinations
– CEA & CMA
• School Enrollment Projections
• Geographic Information Systems (GIS)
• Tracking and Monitoring of Residential Development
– Participate at TRG/DRC, P&Z, Public Hearings
– Conditions of Approvals
– Collect Mitigation and Prepaid Impact Fees
– Sign-off on Residential Plats
– Letters of Authorization
– Resource to Local Government

• OCPS is a provider of public infrastructure
• Public infrastructure requires revenue
• Planning for growth & enrollment projections – Project capital needs
– Assess portable needs
– Meet class-size requirements
– Address transportation costs
OCPS Planning & Governmental Relations: Why We Do It

Plat/ Site Plan
Building Permit
Vertical Construction
Future Land Use
Zoning Preliminary
Site Plan
No capacity issues exist, project “passes” and
does NOT need School Board approval
Residential Development Process
School Board Review & Decision
AND/ OR
Capacity Enhancement
Concurrency/ Capacity
Reservation
Developer Pays Impact Fees on
Units not Subject to Capacity
Enhancement
Developer Prepays Impact
Fees , Pays Mitigation &
Capital Contribution

School Review Process (CEA vs. CMA)
Capacity Enhancement Agreement (CEA)
Concurrency Mitigation Agreement (CMA)
What? Changing of Land Use Entitlements Prior to Vertical Construction
Land Rezoning & Future Land Use Map Amendments
Site Plan or Pre-plat (All Post-2008 Residential Projects)
Covers “New” Units All Units in Project
When? Early in Development Process Later in Development Process
How? Local, Charter Amendment, ILA Optional/ State Statute, ILA
Timing? Long Range Short Range
Used for Planning Purposes, Incorporated into Background Growth. Does Not Encumber or Reserve Capacity
Requires a Capacity Encumbrance and Reservation
7

Typical CEA/CMA Conditions
Capacity Enhancement Agreement (CEA)
Concurrency Mitigation Agreement (CMA)
Capital Contribution based upon cost per student station
Mitigation based on proportionate share formula
Prepayment of school impact fees Proportionate share eligible for school impact fees credits, but credits will not exceed the value of the school impact fee
Payments due prior to recording of final plat (county) or site plan approval (most cities)
Reservation fee schedule set forth in the agreement, impact fee creditable
CEA capital contribution credited toward CMA proportionate share
Land conveyance for school sites Land conveyance for school sites

Numbers You Need to Know Term Amount
Total Cost per Student $20,843.00
Net Impact Cost per Student $15,140.00
Capital Contribution per Student $5,703.00
Current School Impact Fee $6,525.00 (SF) $3,921.00 (MF)
Level Rate
Elementary .196
Middle .100
High .134
Total .431
Level Rate
Elementary .137
Middle .057
High .065
Total .259
Single Family Multi-Family

Factors Affecting Payment
• Size of project
• Type of units
• Capacity conditions at elementary, middle, and high schools
• Other development activity in area (first come first serve)

Concurrency Formulas
Proportionate Share • Section 19.2 of the Amended & Restated ILA
• Proportionate Share Mitigation:
(Development Impact – Available Capacity) X Total Cost • Translation: Proportionate Share Mitigation = (# Student Stations Needed –
Available Capacity) X Cost per Student Station
Impact Fee Credit • County Ordinance 30-622(c)
• Impact Fee Credit = Equivalent Residential Units for which Proportionate Share is Provided X Impact Fee per Dwelling Unit – Net Development Impact = Development Impact – Available Capacity
– ERU = Net Development Impact / Student Generation Rate

Capacity Solution Options Already Included in CEA/CMA
• Purchase of real property for construction of additional school facilities that would provide additional capacity
• Construction of additional permanent student stations in new buildings or through renovation of existing buildings
• Construction of additional core facilities in new schools or expansion of existing core facilities in existing schools
• Provision of additional temporary capacity through the lease or purchase of portable facilities until permanent facilities may be constructed
• Advancing a school included in the most recent Capital Outlay Plan that will provide capacity for the students generated by the Applicant’s Development Application
• Any other actions which will result in provision of the necessary school capacity

15292
10943
8769
3837 3079 3042
4577
8025
9846
12000
16000
13969
8169
5401
1929
2846
4045
6497
8689 9319
12248
16434
0
2,000
4,000
6,000
8,000
10,000
12,000
14,000
16,000
18,0002
00
6
20
07
20
08
20
09
20
10
20
11
20
12
20
13
20
14
20
15
20
16
Total Certificates ofOccupancy (Orange Co.Property Appraiser)
Total Building Permits(HUD Database)
ACTUAL ESTIMATED
New Residential Construction

Residential Growth
GIS Residential Development Inventory
¹ºE
¹ºK8
¹ºM
¹ºE
¹ºE
¹ºH
¹ºK8
¹ºE
¹ºE
¹ºE
¹ºE¹ºM¹ºM
¹ºE
2014-15 Adopted CIP

GIS Residential Inventory – Ongoing Data Collection
• All residential developments are tracked in GIS and categorized by project phase.
• Data sources include: • DRC & TRG agendas • Public hearing agendas • Capacity Enhancement & Concurrency Agreements • Informal Capacity Inquiries • Community Meetings Notifications • Plat review notifications

Enrollment and Portable Student Stations, 2005-2015
-
20,000
40,000
60,000
80,000
100,000
120,000
140,000
160,000
180,000
200,000
2005 2011 2015
# of Students (Traditional K-12) Portable Student Stations
13% increase in enrollment, 2005-2015
32% decrease in portable seats, 2005-2015

Capital Projects Fund • Budget = $1,589,643,474
• Primary revenue sources – sales surtax, property tax, impact fee
• Minimal state support
• Primary uses are for comprehensive renovations, new schools, capital renewal, debt service, and operations

Budgeted Capital Revenues by Source

Capital Projects Use of Funds (Excluding Reserves)

FY 2016 Impact Fee Budget Revenue Sources
Impact Fees 56,532,082
Beginning Fund Balance 233,597,838
Total Budgeted Revenues 290,129,920
Appropriations
44-E-SE-2 1,500,000
Eagle Creek ES 3,536,494
27-H-W-4 84,572,589
Sun Blaze ES 37,749
Hackney Prairie Elementary School 102,268
81-E-SW-5 15,687,358
52-M-SE-2 34,614,524
133-K8-N-6 40,434,851
2-K8-E-1 32,414,435
Independence ES 3,767,347
117-E-SW-4 18,584,088
84-E-W-4 16,612,000
21-M-E-2 34,131,949
Capital Expenses Contingency 1,404,527
Site Acquisition 51,135,325
Total Budgeted Expenditures 338,535,504
Total Estimated FY16 Ending Fund Balance* (48,405,584)
FY 2016 Impact Fees Budget
*Excess expenditures will be covered from a temporary loan
until sufficient impact fees are collected to fund these
projects.
Revenue Sources
Impact Fees 56,532,082
Beginning Fund Balance 233,597,838
Total Budgeted Revenues 290,129,920
Appropriations
44-E-SE-2 1,500,000
Eagle Creek ES 3,536,494
27-H-W-4 84,572,589
Sun Blaze ES 37,749
Hackney Prairie Elementary School 102,268
81-E-SW-5 15,687,358
52-M-SE-2 34,614,524
133-K8-N-6 40,434,851
2-K8-E-1 32,414,435
Independence ES 3,767,347
117-E-SW-4 18,584,088
84-E-W-4 16,612,000
21-M-E-2 34,131,949
Capital Expenses Contingency 1,404,527
Site Acquisition 51,135,325
Total Budgeted Expenditures 338,535,504
Total Estimated FY16 Ending Fund Balance* (48,405,584)
FY 2016 Impact Fees Budget
*Excess expenditures will be covered from a temporary loan
until sufficient impact fees are collected to fund these
projects.

Schools Built Since 2011 Impact Fee Study
2011
• Wetherbee ES
• Lake Nona MS
2012
• SunRidge ES
• SunRidge MS
2013
• Hackney Prairie ES
• SunBlaze ES
2015
• Independence ES
• Eagle Creek ES

Schools Renovated Since 2011 Impact Fee Study (Sales Tax)
2012
• Cypress Springs ES
• Evans HS
• University HS
• Walker MS
• Zellwood ES
• Aloma ES
2013
• Arbor Ridge K-8
• Brookshire ES
• Eccleston ES
• Lancaster ES
• Oak Ridge HS
• Rock Springs ES
• Westridge MS
2014
• Dr. Phillips ES
• John Young ES
• Lake Silver ES
• Little River ES
• Ocoee ES
• Pineloch ES
• Shingle Creek ES
• Spring Lake ES
• Washington Shores ES
• Waterford ES
• Wheatley ES
2011
• Azalea Park ES
• Apopka MS
• Edgewater HS
• Chickasaw ES
• Hunter’s Creek ES
• Lake Sybelia ES
• Metrowest ES
• Orange Center ES
• Southwood ES
• Waterbridge ES
• Winter Park 9th Grade

2016
2-K8-E-1
117-E-SW-4
81-E-SW-5
2017
21-M-E-2
52-M-SE-2
27-H-W-4
131-PS8-SW-5*
133-K8-N-6
44-E-SE-2
84-E-W-4
Schools in Current CIP
2018
205-K8-SW-6*
2019
37-M-W-4
2020
85-E-W-4
20-E-SW-5
2021
26-E-N-7
114-E-W-4
90-E-N-7
2023
80-H-SW-4
65-M-W-4
2024
43-E-SE-2
56-M-SE-2
102-E-W-4 *Schools funded with half penny sales tax

Downtown Rezonings
Downtown PS-8 131- PS8-SW-5 Intersection of Livingston Street and Parramore Ave
Audubon Park Area 133-K8-N-6 Original Audubon Park ES site
Lake Como Area 205-K8-SW-6 Current Lake Como ES site
24


Digital Curriculum
• State requires 50% of instructional materials to be spent on digital curriculum
• Capital Expenditure = $47.7 million
– Infrastructure and devices
– Not Impact Fees

Announcements
• Impact Fee Study Update
• Public School Siting Regulations
• Development layer and CEA layer online
– http://arcg.is/1wXHdJx

Website Resources • Planning & Governmental Relations
– http://pgr.ocps.net
– Includes applications, submittal requirements, data, maps, and the school impact fee study
– Development layer
• Student Enrollment – https://www.ocps.net/es/legislative/pupil/Pages/default.aspx
– Includes school zone maps and enrollment summaries
• Orange County – http://www.orangecountyfl.net/PlanningDevelopment/ConcurrencyManagement.aspx
– Includes applications for concurrency, vested rights, and submittal requirements

Questions