oceans in motion second part of chap. 1 16-31. oceans in motion waves, tides, and currents
TRANSCRIPT

OCEANS IN MOTION
second part of chap. 1 16-31

OCEANS IN MOTION
waves , tides, and currents

wave breaking
tidal mixing(breaking internal waves)
Net radiative gain
Net radiative
loss
Net radiative
lossWinds
SurfaceCurrents
DeepFlow
The Oceans Store 1000x More Heat Than the AtmosphereThe Oceans Transport Heat Vertically and Horizontally, from Low Latitudes to High

Ocean Waves

Damage to Oil Industry in 2005 from Hurricanes Katrina and Rita
• Oil Platforms: – 3050 of 4000 in direct path– 113 Destroyed – 53 Damaged
• Oil Pipelines: – 457 Damaged, including
101 large diameter pipelines• Oil / chemical spills:
– 1 barrel or greater: 146– 50 barrels or greater: 37– 1000 barrels or greater: 6– No significant coastal or
wildlife impacts noted
Wave Impacts
Thunder Horse – 59,500 tonsWorld’s Largest Oil PlatformUSCG Photo from July 2005
after evacuation for Hurricane Dennis
Source: Minerals Management Service Press Release 1 May 06

Wave Impacts

I. WAVES write this down
• A. Characteristics
• do not move much mass but are propagated through the water,
• " notice how a floating object seems to bob up and down as the wave passes by"
• see diagram of length, period and velocity
• primarily wind driven,

Wave Anatomy (draw this)
Physical Traits
Wave Height: HWater Depth: h (don’t confuse h and H)

Period – How much time between each crest?
Frequency – How many crests pass each second?
Physical Traits

Particle Motion in a Deep Water Wave
Animation from: Dan Russell, Ph.D.,Associate Professor of Applied Physics at Kettering University in Flint, MI
Physical Traits
H
- At the surface, orbital diameter equals the wave height H. - Orbital diameter decreases with depth - At a depth of L/2, motion is negligible
L
http://www.kettering.edu/~drussell/Demos/waves-intro/waves-intro.html
http://www.kettering.edu/~drussell/Demos/waves/wavemotion.html

Storm south of New Zealand on 9 July 2004 generates swell which propagatesto North America in 12 days

Animation of observed swell generated by a storm south of New Zealand on 9 July 2004 propagating across the Pacific Ocean.
Color depicts the wavelength of the waves tracked by the Envisat ASAR Wave mode, with red being the longest.
Long period swell reaches Alaska 12 days later. A similar case was observed in 1963 by Dr. Walter Munk and his colleagues during the “Waves Across the Pacific” experiment.
Credits: IFREMER - BOOST Technologies
htt
p://
esa
mu
ltim
ed
ia.e
sa.in
t//im
age
s/E
arth
Ob
serv
atio
n/2
007
-05-
15
_w
ave
_tra
ckin
g_
20
04/p
aci
fic_
20
040
70
9_2
00
407
21
.gif

Wave Interference
Two sinusoidal waves traveling in the same direction. The phase difference between the waves varies with time, and the effects of both constructive and destructive interference may be seen. The net surface displacement is simply the sum of the individual wave displacements.
Two progressivewaves
Animation from: Dan Russell, Ph.D., Associate Professor of Applied Physics at
Kettering University in Flint, MI
Mathematical Traits

72 ft
???(unrealistic)
Rogue Waves

Simulation of wave encountered by the German cargo ship München,lost at sea on 12 Dec 78. Wreckage indicated possibility of a 20m wave.
Rogue Waves
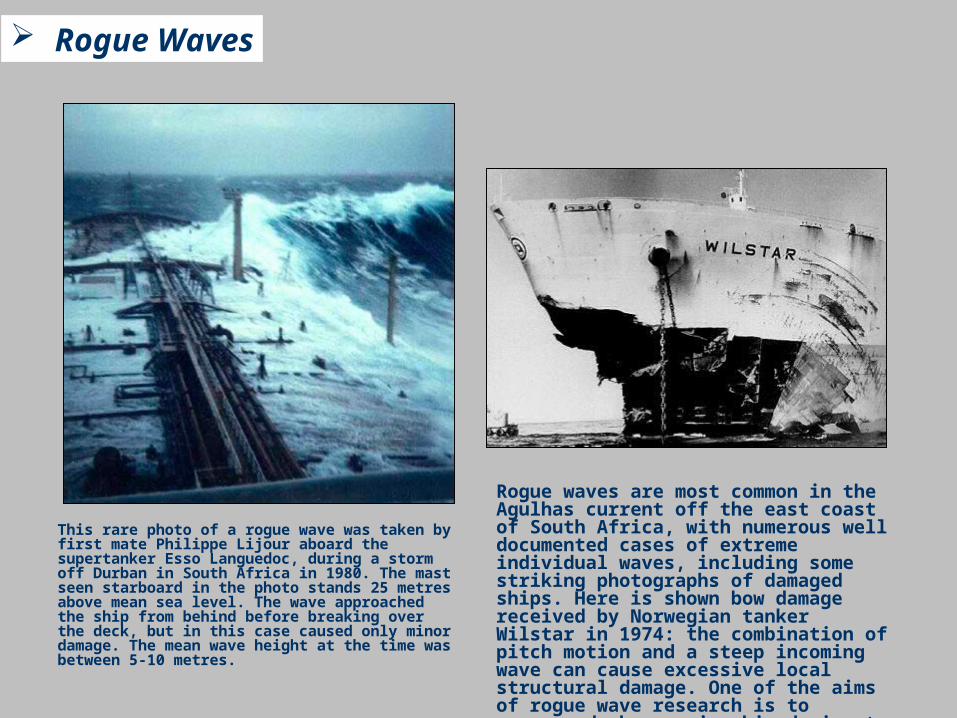
This rare photo of a rogue wave was taken by first mate Philippe Lijour aboard the supertanker Esso Languedoc, during a storm off Durban in South Africa in 1980. The mast seen starboard in the photo stands 25 metres above mean sea level. The wave approached the ship from behind before breaking over the deck, but in this case caused only minor damage. The mean wave height at the time was between 5-10 metres.
Rogue waves are most common in the Agulhas current off the east coast of South Africa, with numerous well documented cases of extreme individual waves, including some striking photographs of damaged ships. Here is shown bow damage received by Norwegian tanker Wilstar in 1974: the combination of pitch motion and a steep incoming wave can cause excessive local structural damage. One of the aims of rogue wave research is to recommend changes in ship design to make them less vulnerable in future.
Rogue Waves

B. Shape change (write this)
• 1. as wave approaches shore there is a shape change fig. 1-13
• If depth is less than 1/2 wavelength, the wave crest will BREAK on shore

• 2. Wave character, force, are determined by shore line slope, seasons and substrate composition.
• (Bays, estuaries, rocky shore and sandy beach) all experience different types of waves

Tidal Modulation of Surf Zone
Wave ShoalingTypes of Breakers
For a given wave height, bottom depth determines where the waves break. For a given wave steepness, bottom slope determines how they break.

C. Types add drawing
• 1. spilling breaker- gently sloping bottom
• 2. plunging breaker- steeply sloping bottom
• 3. surging breaker- no break because of depth

Spilling breakers distribute their energy across a broad surf zone
Wave Shoaling

Steep, plunging breakers are the archetypical breaker. From photo by Jeff Devine.
Wave Shoaling

Surfing 100 Miles Offshore
60 ft
35 mph
CortesBank
http://video.google.com/videoplay?docid=1041053573910778617&q=surfing

Elevation in Meters
Cortes Bank
San Clemente Island
favorableswell
direction
Wave Shoaling

D. Tsunami- seismic shock generated wave
caused by sea floor disturbance (volcanoes, earthquake, landslide) 500 mph. No effect in the deep ocean but a DRAMATIC effect on the shore. 100 ft. waves are possible
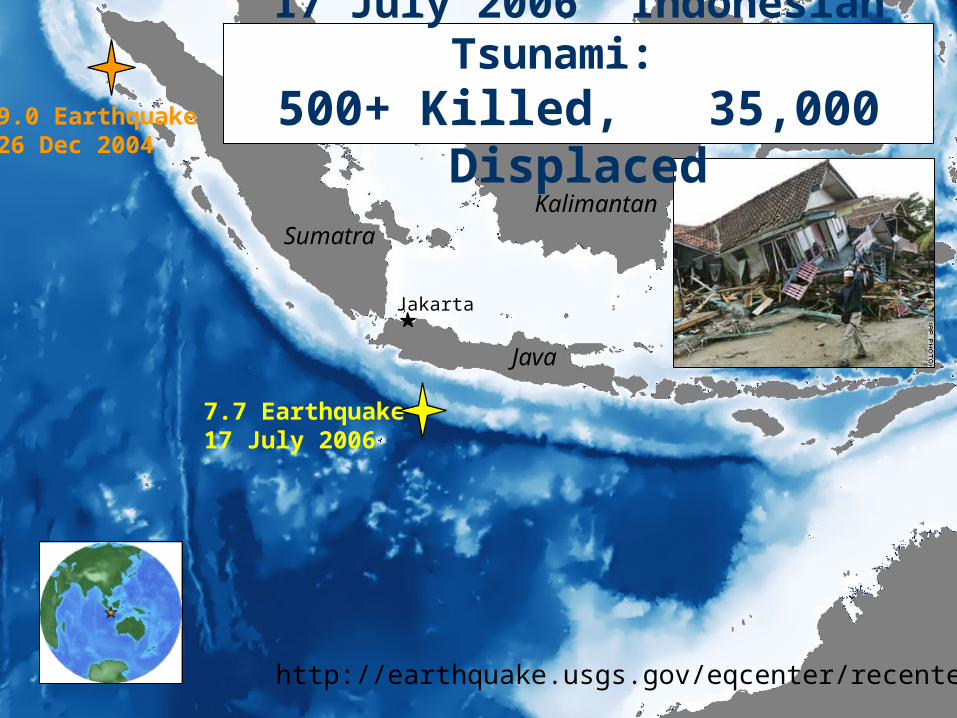
7.7 Earthquake17 July 2006
Java
Sumatra
9.0 Earthquake26 Dec 2004
17 July 2006 Indonesian Tsunami: 500+ Killed, 35,000 Displaced
Jakarta
Kalimantan
http://earthquake.usgs.gov/eqcenter/recenteqsww/

Tsunamis
Since h / L < 1/20, it travels as a shallow water wave!
c = (gh)1/2

Anatomy of a Shoaling Tsunami
Tsunamis

Tsunami Damage is Related to the Slope of the Coastal Sea Floor
http://www.washingtonpost.com/wp-dyn/articles/A54530-2005Jan6.html
Tsunamis

Tsunamis
26 December, 2004http://www.meted.ucar.edu/marine/mod3_wlc_propdis/tsunami_Dec2004.htm

Crest of Tsunami Approaching on the Horizon
This family of Swedish tourists survived the tsunami after being washed ashore by the surging waters. Karin Svard clung to a palm tree and later found her family on higher ground.
Hat Ray Lai BeachKrabi, Thailand26 December, 2004
At least 200 people were killed in this area.
http://www.timesonline.co.uk/article/0,,18690-1423373,00.html

Tsunami Warning Systems
Tsunamis
http://nctr.pmel.noaa.gov/Dart/Jpg/DART-II_05x.swf

Wave Classification
Wind Waves
Physical Traits
Mathematical Traits
Rogue Waves
Seiches
Wave Shoaling
Tsunamis
Internal Waves

Particle Motions in Internal Waves
Yellow dots: Water particles in the middle of the water column move up and down, but do not move horizontally, as the wave passes through.
Magenta dots at the bottom: Particles oscillate horizontally as the wave passes. At a given location, particles at the top and bottom of the water column move in opposite directions.
Groups of magenta dots: Areas of convergence and divergence follow the wave. Convergence occurs where the respective layer is thickest, while divergence occurs where the layers are thinnest.
http://www.es.flinders.edu.au/~mattom/IntroOc/lecture10.html (Fig. 7)
Internal Waves
Courtesy of Matthias Tomczak

The Great Wave off Kanagawa Katsushika Hokusai (1760-1849)