ocean mixing - harvard university
TRANSCRIPT
Ocean MixingThe Harvard community has made this
article openly available. Please share howthis access benefits you. Your story matters
Citation Wunsch, Carl. 2017. Ocean Mixing. In Oxford Encyclopedia of ClimateScience, 2017. doi: 10.1093/acrefore/9780190228620.013.90
Published Version 10.1093/acrefore/9780190228620.013.90
Citable link http://nrs.harvard.edu/urn-3:HUL.InstRepos:34391763
Terms of Use This article was downloaded from Harvard University’s DASHrepository, and is made available under the terms and conditionsapplicable to Other Posted Material, as set forth at http://nrs.harvard.edu/urn-3:HUL.InstRepos:dash.current.terms-of-use#LAA

Ocean Mixing: Oxford Encyclopedia.1
Carl Wunsch∗
Department of Earth and Planetary Sciences
Harvard University
Cambridge MA 02138
email: [email protected]
2
October 21, 20163
Summary4
Oceanic mixing is one of the major determinants of the ocean circulation and its climatolog-5
ical influences. Existing distributions of mixing properties determine the rates of storage and6
redistribution within the climate system of fundamental scalar tracers including heat, fresh-7
water, oxygen, carbon, and others. Observations have over-turned earlier concepts that mixing8
rates might be approximately uniform throughout the ocean volume, with profound implications9
for determining the circulation and its properties. Inferences about past and potential future10
oceanic circulations and the resulting climate influence require determination of changed energy11
inputs and the expected consequent adjustment of mixing processes and their influence.12
Keywords13
Mixing, stirring, balanced eddies, internal waves, oceanic general circulation, sub-mesoscale14
Mixing and Stirring15
The ocean stores, redistributes, and exchanges with the atmosphere a wide variety of substances16
essential to the climate system including heat (enthalpy), freshwater, kinetic and potential en-17
ergies, carbon, oxygen, and nutrients of all sorts. An understanding of climate, and its past and18
∗Also, Dept. of Earth, Atmospheric and Planetary Sciences, MIT
1

potential future changes, thus requires a complete depiction of the distribution and redistribu-19
tion of these scalar properties once they have entered the ocean. In other words, the oceanic20
general circulation in all of the elements that control it and change it must be described if21
varying climate states are to be understood.22
In a laminar flow, physics dictate that the movement of scalar properties is cleanly divisible23
into advective components–proportional to the velocity field, v and diffusive ones dependent24
upon the molecular diffusion coefficients, arising from the internal energy of the fluid. In25
a turbulent fluid like the ocean, the distinction is no longer clear-cut: the inability to analyze26
and cleanly represent the flow field from the largest scales down to the molecular ones has led27
historically to representations of the unresolved scales as, at least in part, as “diffusion-like.”28
This situation renders the study of oceanic mixing processes as a subset of a combined laminar-29
turbulent fluid, but with the turbulence having the special properties of a rotating, stratified30
fluid shell with complex vertical and horizontal boundaries. A complete discussion of mixing31
encompasses the entirety of oceanic fluid physics including fully turbulent flows in the presence32
of stratification, rotation, external forcing, complex boundaries, and global-scale fluid flows.33
A systematic account of many of these elements can be found in the book by Thorpe (2005).34
Mixing is simultaneously a consequence of, and a cause of, the large-scale general circulation of35
the ocean.36
Several important elements of ocean mixing have been clarified recently: (1) Processes and37
effective rates vary by three and four orders of magnitude over the ocean volume; (2) The physics38
of mixing is deeply intertwined with the oceanic energy budget; (3) All of the enormous range39
of scales of oceanic motions from 10,000 km to 1 mm are both affected by, and in turn influence,40
variations in mixing. The consequences have proven profound for basic understanding of the41
oceanic general circulation and its climate impacts. To limit this article, the focus is primarily42
on the interior ocean, touching only tangentially on the special regions of the mixed-layers at the43
sea-surface and sea floor, and the variety of boundary layers occurring over sidewalls and general44
topographic features. Most attention is paid to the vertical or “diapycnal” problem involving45
transfers across the stable stratification, and which differs fundamentally both in magnitude and46
physics from so-called isopycnal mixing–easier motions along layers of near-constant density–47
nearly perpendicular to local gravity.48
Discussion of the causes and numerical values of mixing, apart from being an extremely49
challenging observational problem, is at the very edge of modelling and theoretical understanding50
of fluid physics. Much of the context of this discussion can be understood from the conventional51
advection-diffusion equation for a tracer, written for an ordinary fluid e.g.,52
+ v·∇ = ∇2 (1) {advectiondiff
2

is a Newtonian diffusion coefficient of molecular origin, assumed constant in both space and53
time and ∇ is the three-dimensional gradient operator in any suitable coordinate system. The54
most common tracers in oceanic studies are temperature, and salinity, These two fields55
determine the density, structure of the ocean as56
(r) = ( (r ) (r ) (r )) (2) {density1}
where r is a three-dimensional position (( ) in Cartesian coordinates) and is the pressure.57
(Variations in are here considered to be “small” in the mass balance, but important in the58
momentum equations.) The function in Eq. (2) involves a complicated empirical rule rendering59
the density field a nonlinear function of the variables For many purposes, however, it60
can be linearized in the form,61
(r ) = 0 (1− (r ) + (r ) + (r )) (3) {density2}
where 0, are treated as locally constant. Often is set to 0, in the Boussinesq approx-62
imation, treating the fluid as incompressible. If Eq. (3) is adequate, itself can be treated as63
a tracer, = 64
In the simplest cases, v are independent of tracer concentration (called a “passive”65
tracer), but if or are being considered, they influence v (“active” tracers). Typical66
numerical values are ≈ 10−7m2s for temperature and 10−9 m2 for salt. Discussion of67
tracer mixing in the ocean is intimately tied to momentum mixing (frictional processes) and68
they are best treated together. Thorpe (2007) has a clear introduction. For present purposes,69
v is taken as a “given.”70
The derivatives in the tracer “diffusion” term on the right-hand side only become important71
when the length scales over which they are taken become very small, of order centimeters or less.72
An attractive step for an oceanographer attempting to understand the behavior of a tracer in73
the ocean is to argue that this diffusion term can be neglected, setting the left-hand-side equal74
to zero so that,75
+ v·∇ =
+∇ · (v) = 0 ∇ · v = 0 (4) {advectiondiff
As with much of fluid dynamics, most interest and difficulty arises from the overall behavior76
of the advection-term, v·∇ Estimates of the spatial variation of velocity, v show it carrying77
laminar-like structures on the largest scale (e.g., the overall gyre structure of the circulation of78
the Pacific Ocean) through an entire stochastic continuum of spatial scales down to 1 millimeter.79
As far as can be determined, no spatial scales are absent in the range between these rough limits80
(or in the jargon, there is no spatial “spectral gap”). Much, if not all, of the flow contains81
powerful random (stochastic) elements–that is, it is turbulent–and is best perceived from82
3

Figure 1: Surface speeds in part of the North Atlantic Ocean (from website
http://www.nasa.gov/topics/earth/features/perpetual-ocean.html#.Vy0DIoSDFBd). from a nu-
merical model. Most of these features are intensely time-dependent and can be seen in an animation at
the same web location. Myriad yet-smaller scale features exist in the ocean that are invisible to the eye
in such an overview and remain beyond existing computing capacities.{perpetual_oce
one of the many animations of the ocean circulation now available on the web. Fig. 1 shows a83
snapshot of estimated surface speed in the ocean. The visually conspicuous “swirling” flows carry84
tracer properties with them, stretching their boundaries out to enormous lengths. These motions85
are commonly referred to, somewhat vaguely, as the oceanic “mesoscale eddies”, or “balanced86
eddies”. The latter terminology emphasizes their tendency to satisfy near-geostrophic balance87
(dominated by the Earth’s rotation) although at the shortest scales, below about 10km, they88
become significantly non-geostrophic and are then commonly labelled “sub-mesoscale” eddies.89
Below visual detection, molecular processes are also at work, preventing the structures from90
becoming arbitrarily elongated.91
Suppose a patch of dye with a circumferential distance of order 0 is introduced into such a92
flow in two-dimensions (Fig. 2). An the initial time, at the patch edge, ∇ and hence ∇293
may not be negligible, but the initial = 0 is sufficiently small that an integral of the last94
term in Eq. (1)95 I=0
|∇2| (5) {integral1}
taken around its boundary, is negligible compared to other integrated term from Eq. (1)96
Through time, the patch is stretched out, and extended in a tortuous pathway. Even in97
comparatively simple, non-turbulent flows, pathways commonly have a chaotic behavior (see98
e.g. Ottino, 1989). The boundary demarcating the edge of the path becomes extended in time,99
growing to values 0. At this boundary, the gradients, ∇ are extremely large, and100
the integrals in Eq. (5) taken around the long boundary are very important and cannot be101
4

Figure 2: From Welander (1955) showing the “stirring” of a small square dye patch in a near two-
dimensional fluid flow. “Mixing” would take place along the dye boundary which becomes greatly ex-
tended in length as time goes on. Molecular processes operate primarily at the dye-patch boundaries and
ultimately limit the extensions of the patches. In three-dimensions the tendency to elongation is muted.{welander_1955
ignored and indeed prevent the fluid from developing arbitrarily elongated and tangled struc-102
tures. Indefinite growth is prevented both by these molecular processes, and those acting to103
control particle separations within a dye patch (Salmon, 1998, Section 1.14). Thus one must104
distinguish the statistics of turbulent motion insofar as they affect the center of mass of the dye105
patch, from those controlling the separation of fluid particles within the patch (see especially,106
Garrett, 2006).107
Eckart (1948) divided oceanic processes into three parts–supposing there exists a large-108
scale flow carrying tracer patterns of interest. Superimposed upon those large-scale, flows are109
smaller scale motions, which stretch the tracer out into the complex patterns with intricate110
and extended boundaries. He called those motions “stirring.” Finally, the very smallest scales111
at both patch edges, and within the interior of the patch, the molecular scale rarely observed112
directly, are where molecular processes dominate and act to homogenize the fluid. (Note that113
Fig. 2 depicts an essentially two-dimensional fluid movement; in three dimensions the elongated,114
serpentine, structure is less-pronounced.)115
Although the molecular scale was early on recognized as essential to understanding the116
5
distribution of properties in the oceans, the observational tools available before about 1965117
did not permit discussion of how these mixing processes actually operated. A great deal had118
been learned about the physics of conventional turbulence in unstratified, non-rotating fluids,119
but the oceanic applicability remained obscure. An oceanographic exception was the growth of120
interest in so-called double-diffusive processes, although most of that discussion was focussed on121
laboratory-scale experiments and theory (e.g., Radko, 2013).122
For roughly the first 100 years of physical oceanography (to about 1965), observational123
capabilities on the largest scales were limited to ship-borne measurements of temperature and124
salinity, resulting in the now-familiar and classical charts of oceanic gyres and major boundary125
currents, and are known to be quasi-permanent features. These are identified with scale , see126
Fig. 3, and which were and are represented as a large-scale, fundamentally laminar flow. On127
the other hand, oceanographers were well aware of the existence of smaller scales of flow (see128
Helland-Hansen and Nansen, 1909) and realized that they had both a dynamical and kinematical129
influences on the larger scales, ones that ultimately had to be treated statistically.130
Assuming that these motions were turbulent, in the sense of being stochastic, and in a131
fluid-dynamics approach dating back to the 19th Century, it was hypothesized that both v132
could be broken up into two pieces: v = v + v0 = + 0 where the over-bar represents an133
averaging process, in space, or time, or both. If space was involved (a useful choice in a spatially134
homogeneous flow) the averaging interval was taken to be larger than the stirring scale , but135
less than such that v0 = 0 0 = 0 but v0 0 6= 0 (See especially Tennekes and Lumley (1972)136
or any book on turbulence, e.g. Batchelor, 1953). Alternatively, the assumption might be made137
that a time average would remove all of the small scales–although that involves a strong and138
difficult-to-justify assumption about space-time statistics of the ocean. In particular, the longest139
available records do not support the existence of any kind of spectral gap in frequency. 1 Eq.140
(4) then becomes, when averaged,141
+ v·∇ +∇ · (v0 0) = 0 ∇ · v0 = 0 (6)
v are the quasi-laminar fields with everything else to be handled statistically. The problem–142
the “turbulence closure”–is what to do with the divergence of v0 0 the covariance of the143
1Davis (1994) emphasized, absent a spatial or temporal gap in scales, the assumption that such mixed averages
such as v0 = 0 can fail. Few oceanic measurements exist such that averages taken over any long time-scale are
truly stable: e.g., doubling the record length usually measurably changes the calculated averaged and which may
well be covarying with the variability of the fluctuations. The trough in spectra at frequencies just below the
inertial frequency (usually denoted ) is sometimes regarded as representing a spectral gap, but it is probably
best regarded as the effect of a peak, rather than a minimum. Recent theoretical arguments have also shown how
energy can be transferred across this frequency interval.
6

Figure 3: Neutral surfaces down the central Pacific Ocean (from the Pacific Atlas of the World Ocean
Circulation Experiment, Talley et al., 2007). Note that the contouring interval is not uniform. The
largest scales are quasi-stable over decades, whereas the visual much smaller scale variability was poorly
understood until recently, and is best regarded as a mixture of geostrophically balanced motions and
gravitationally governed internal waves. Surfaces above roughly 1000m in the Southern Ocean outcrop
to the surface before they reach the Antarctic continent. These outcropping surfaces can be stirred and
mixed by direct wind-action. At greater depths, surfaces away from the Southern Ocean are roughly
horizontal sometimes leading to depictions as the result of one-dimensional, vertical, advection-diffusion
balances. These surfaces reach the continent to the south where they become involved with the formation
of very dense water (Antarctic Bottom Water) visible as the deep green plume at the bottom left. This
water must ultimately be returned to the sea surface if the ocean is in a steady-state, through processes
requiring work to mix the properties upward against gravity. The “thermocline” is the region near the
surface of the most rapid density change (controlled largely by temperature). Such figures have a very
great vertical exaggeration with the horizontal range being nearly 10,000 km and the vertical range being
6 km and thus the topographic and isopycnal slopes are in practice very small, but nonetheless extremely
important in many locations. The structure of isopycnal surfaces is very similar to that of neutral surfaces.{woce_atlas_p1
7

spreading scales? (In conventional homogeneous, isotropic turbulence, this divergence vanishes.)144
Following Osborne Reynolds and many others, it can be supposed that these spreading scales145
act as an analogue of the suppressed diffusive ones–but operating entirely locally on the -scale146
so that,147
∇ · ¡v0 0¢ = −∇2 (7)
In a turbulent flow, it is often argued that all tracers are stirred by eddies at the same rate148
so that would be appropriate for all . Because of known anisotropies in oceanic flows and149
features, anisotropic rules were used,150
∇ · ¡v0 0¢ = −2
2−
2
2−
2
2(8)
(in a Cartesian system) or in the most general form,151
∇ · ¡v0 0¢ = −∇ · ¡K∇¢ (9) {tensor1}
where152
K =
⎧⎪⎪⎨⎪⎪⎩
⎫⎪⎪⎬⎪⎪⎭ =
⎧⎪⎪⎨⎪⎪⎩11 12 13
21 22 23
31 32 33
⎫⎪⎪⎬⎪⎪⎭ (10) {tensor2}
has become a tensor (written above both in the special Cartesian and a more general index153
forms) with spatial or even temporal structure whose physical form must obey certain rules (e.g.154
Griffies, 2007, P.288+).155
Use of these “eddy” coefficients (and their analogues for viscosity in the momentum equa-156
tions) have had a long and useful history. Extensive discussions can be found in Defant (1961,157
P. 107+). In both analytic and numerical modelling, the symmetric elements of K destroy any158
gradients long before they reach the scale, and thus function implicitly to dissipate tracer159
variance. That mixing depends only on the local properties of has been assumed: for a160
contrasting approach, see Canuto et al. (2007). Anti-symmetric elements can act as stirring161
motions, increasing the gradients; see e.g. Griffies (2004) or Flierl and McGillicuddy (2007).162
At the time of this writing, a major field experiment, Diapycnal and Isopycnal Mixing Ex-163
periment in the Southern Ocean (DIMES; Sheen et al., 2013), is underway to better understand164
the structure of K albeit the physics of the Southern Ocean flow are often untypical of the165
global ocean.166
Isopycnals and Neutral Surfaces167
Most of the ocean is stably stratified (Fig. 3), and the fluid has difficulty in moving tracers across168
that stratification, which requires work against gravity. In contrast, movement perpendicular to169
8

gravity involves much less work and energy (except for internal viscous stresses), and substantial170
evidence supports the inference that usually 33 1122 In practice, the surfaces of con-171
stant density, 3 = (1 2) in many places deviate from the horizontal (Fig. 3 at the southern172
end), and the expression representing vertical diffusion can become inaccurate. 33 is better173
expressed as (a “diapycnal” diffusion) and 1122 and the various cross-terms become ex-174
pressions for diffusion along the isopycnal surfaces (“isopycnal” diffusion). Because the equation175
of state of seawater, representing the density as a function of temperature, salinity, pressure, and176
location, ( (1 2 3) ( 2 3) (1 2 3)) is significantly non-linear, many authors re-177
place isopycnals with “neutral surfaces” along which the work done against gravity by movement178
along the surfaces is minimal. To emphasize that the “vertical” coordinate will differ from the179
geocentric vertical, the coordinate system ( ) → (1 2 3) where it is understood here180
that 3 is normal to an isopycnal or neutral surface and is nonetheless sometimes most simply181
written as Terminology “isopycnal” will be used here without distinguishing the various rep-182
resentations of surfaces of minimal work against gravity. 33 becomes a “diapycnal” coefficient,183
and 1122 are “isopycnal” coefficients. Over much of the ocean, the distinction between the geo-184
detic vertical and the isopycnal normal direction can be neglected, but the difference is crucial185
in regions of isopycnal slope as seen in Fig. 3 in the Southern Ocean. The non-linearity of the186
equation of state gives rise to a number of sometimes puzzling behaviors of mixed fluids under187
the rubrics of “cabbelling” and “thermobaricity.” (For example, two fluid parcels with different188
temperature and salinity but the same density will, when mixed, have a different density. See189
e.g., McDougall and Garrett, 1992; Schanze and Schmitt, 2013.)190
By definition, in an isopycnal coordinate system, mixing cannot move fluid parcels of different191
density across the reference surfaces, but that is not true of passive tracers. This distinguishing192
behavior leads to a lot of detailed complexity in numerical models of the ocean.193
Scales194
Oceanic flows do not occupy discretely separable spatial scales, but consist instead of195
a continuum of near-geostrophic global horizontal scale structures (basin and larger), changing196
significantly in time only slowly (many decades and longer); a geostrophically balanced eddy197
field, with spatial scales of a few hundred kilometers and changing over many months and longer;198
an internal-inertial wave field on spatial scales of tens of kilometers and changing over hours199
to days; a “sub-mesoscale” where rotation no longer dominates the eddies, and a small-scale200
turbulence with features of tens of meters to millimeters tending to be three-dimensionally201
isotropic, and changing over seconds to days. These motions overlap in a continuous occupation202
of frequency/wavenumber spaces. Derivatives of tracers and velocity, taken over the smallest203
9

scales usually greatly exceed those taken on the largest scales.204
A small extension of Eckart’s (1948) schematic description of oceanic mixing is that tracers205
varying on scale are stirred by the balanced (geostrophic) and sub-mesoscale eddies (scale206
) Then localized breaking by the internal wave field ( ) generates the turbulence that207
is dissipated in a traditional turbulent cascade to the molecular scale , dominating the fi-208
nal conversion into molecular scales. Although a useful conceptual structure, it can be very209
inaccurate and misleading. For example, the gyre scales contain many features such as the west-210
ern boundary currents, the equatorial current system, etc. which lie on the same scale (order211
100km) as do the balanced eddies. Balanced eddies appear to exist even at very long periods–212
much longer than a year. They include such diverse physics as linear and non-linear Rossby and213
Kelvin waves, isolated vortices, coupled waves, instability structures, etc. Internal waves overlap214
the high wavenumber part of the submesoscale eddy field, and also contain balanced “vortical”215
structures. This listing remains only a sketch, ignoring many different boundary layer types216
at the surface, sidewalls and bottom. All of these physical processes are coupled to a greater217
or lesser degree. Sometimes, as in resonant interactions of wave-like motions, energy can move218
from one space- and time-scale to radically different ones. In conventional turbulence, interac-219
tions take place only between nearest-neighbor wavenumber scales, leading to the discussion of220
power laws, of which the Kolmogoroff −53 law is the best known, and where energy “cascades”221
from large to smallest scales. But in the ocean, some processes produce cascades in the oppo-222
site direction with differing power laws. Wave-like motions are often invoked statistically in a223
“wave-turbulence” approach (e.g., Polzin and Lvov, 2011).224
Generalizing, 1 2 12 are dominated by the balanced eddies in the open ocean,225
with the submesoscale becoming most important where isopycnal slopes are steep. 333 3226
are usually controlled by breaking internal waves and provides the ultimate link between the227
stirring-dominated isopycnal terms and the ultimate dissipation. Generalizations about regions228
near lateral boundaries are not justified at the present time.229
Power integrals230
The most direct connection that can be made across the scales is that based upon “power231
integrals” as introduced by Stern (1975) and discussed by Joyce (1980). In a turbulent flow232
field, any structures in the field would be dissipated at a rate,233
= 2
õ2
21
¶2+
µ2
22
¶2+
µ2
23
¶2! (11) {chi}
(the derivatives in Eq. (11) are negligible for scales larger than ) where the overbar denotes a234
space and/or time-average. Then in a statistically steady-state ocean, the input of this variance,235
10

integrated over the ocean is,236 ZZSurfaces
=
ZZZVol.
(12) {diss1}
and the integrals are taken over the ocean boundary area, particularly the surface, but including237
all generation boundaries, and the volume respectively, so that the generation-rate balances the238
dissipation rate. is a measure of the transfer of to the ocean volume from the atmosphere239
and other boundaries under the assumption, in the steady-state, that240 ZZ = 0 (13)
If and are covarying, the resulting variance generated must be dissipated at the molecular241
scale, all physics of scale transformations being integrated out in Eq. (12). Generated variances242
on the left must be consumed in the term on the right at the molecular level, otherwise, the243
spatial variance of would grow without bound. (See Schanze and Schmitt (2013) for the244
complications introduced by various nonlinearities.) The special case of = corresponds to245
entropy conservation. Much of the dissipation, like the generation, occurs within surface the246
mixed-layer, but significant structures remain in the oceanic interior that must be removed at247
the molecular scale.248
These arguments can be generalized to certain types of oceanic regional subvolumes. Using249
Eqs. (11), (12) to solve for gives values (for temperature and salinity) roughly consistent250
with those obtained from completely different methods (and with very different error bars). All251
observations do, however, remain highly uncertain; see Schneider and Bhatt (2000).252
Consider now the analogue of Eq. (11) for the velocity field, defined as v =(1 2 3) =253
( ) and the latter being the Cartesian special case, but the first form permitting the use254
of indices. The dissipation of kinetic energy in the ocean, ultimately at similar molecular scales,255
is usually written as256
=
2
3X=1
3X00=1
Ã
0
0
!(14)
is the ordinary molecular kinematic viscosity and which would again be dominated by the 257
spatial scale. If the turbulence lies mainly in isotropic motions at the smallest scales, the above258
simplifies to,259
=15
2X
µ
¶2 (15)
for any . The connection between is exploited in the measurements described below.260
The “Kolmogoroff length-scale”, =¡3
¢14is a measure of the smallest turbulence scale261
present in the fluid, and complete measurement of dissipation in the ocean would have to reach262
to distances of order 1 cm and less.263
11

Large-scale forces acting on the ocean (e.g., winds and tides with time-scales ranging from the264
mean to short-lived squalls) are communicated to the ocean through processes which generate265
motions on all of the observed flow-scales. The wind and other generation processes can also266
destroy previously-produced structures, and thus must be interpreted as the net production267
in the boundary regions.268
Vertical Mixing269
Quasi-Analytic Model Estimates270
The most influential attempt at estimating an element of K was for the vertical (diapycnal)271
component 33 with the advection-diffusion Eq. (9) written as the special case of a one-272
dimensional steady-state balance,273
3−
3
µ33 (3)
3
¶= 0 (16) {abyssal1}
For constant and 33 the solution is a simple constant plus exponential,274
= 0 + 1 exp (333) (17) {abyssal2}
In widely influential paper, Munk (1966), noting the generally horizontal nature of isopycnals275
in the open Pacific Ocean, inferred 33 from fitting the Eq. (17) profiles of temperature and276
salinity below 1000 meters. Earlier, Wyrtki (1962) used passive oxygen and nutrient distributions277
which, however, involve interior sources and sinks having significant uncertainties. By also278
employing radiocarbon as a tracer with a decay term on the right hand side, Munk was able279
to separately distinguish ≈ 10−733 ≈ 10−4m2/s, assuming the parameters applied280
identically to temperature, salinity (or linearized density), and radiocarbon–as would be true281
in conventional turbulence. In the then convention of centimeter-gram-second (CGS) units, the282
result was the memorable (“canonical”) value 33 =1 cm2s.283
Earlier “thermocline models” (e.g., Stommel and Webster, 1962; Welander, 1971) implicitly284
included Eq. (16) as a special case. These remarkable nonlinear solutions showed however, that285
“perfect fluid” (adiabatic,K = 0) models gave a gross structure in the thermocline (roughly 300-286
1000m depth) similar to the observed temperatures and salinities and visually indistinguishable287
from those with significant vertical mixing. Munk’s “abyssal recipe” was widely mis-applied288
in that upper ocean region, where he had made no claims about 33 and there arose a sense289
that a contradiction existed between the one-dimensional balance and a possible near-adiabatic290
upper ocean. The seeming-paradox was only resolved with the development of direct field291
measurements, taken up below.292
12

Figure 4: Estimated values of 11 = 22 (m2/s, Stammer, 1997) from altimetric variability. The
equatorial region is omitted because of the breakdown of geostrophic balance there.{stammer_jpo19
Lateral Mixing293
Lateral analogues in the horizontal dimension, for determining 1122, using large-scale observed294
horizontal gradients have a long history. An example is discussed by Needler and Heath (1975)295
and Hogg (1987) who, using the conspicuous feature of the Mediterranean Salt Tongue, did a296
simultaneous least-squares fit for both vertical and horizontal values. The latter found 11 =297
22 ≈ 500 m2/s 33 ≈ 5× 10⁻⁵m2/s.298
In more recent years, with the availability of near-global altimetric measurements of surface299
geostrophic flows, a number of attempts have been made to estimate 1122 directly from the300
eddy variability. Starting with Holloway (1986) and Stammer (1997), estimates range from301
about 250 m2/s in the quiescent eastern parts of the ocean to nearly 3500 m2 in the eddy-302
intensified areas of the low-latitude western-boundary regions (Fig. 4). Numerous regional303
estimates have been published subsequently, with a particular emphasis in recent years on the304
eddy-rich Southern Ocean.305
The lateral terms 1∗ 2∗ where the ∗ denotes any of the 3-indices 1 2 3 are commonly306
identified primarily with the powerful kinetic energy of the balanced eddies, and within a mod-307
elling context have been the subject of a wide variety of proposals and tests. Recall, however,308
that the quasi-time average flow field has numerous spatial scales far smaller than the largest309
scale defining the general circulation. Boundary currents such as the Kuroshio and Gulf Stream310
on the west, the Equatorial Undercurrents and their associated shear fields, as well as flows on311
eastern boundaries, are all capable of stretching and greatly extending the mixing volumes of312
tracers. But because the modelling community has focussed on parameterizing the mesoscale313
elements of K comparatively little is known about the mixing processes in strongly sheared314
13

boundary currents. More generally, the presence of strong horizontal flows (boundary currents,315
the circumpolar current) implies that the interaction of the balanced eddy field with those316
motions cannot be ignored. Note in particular (Ferrari and Nikurashin, 2010; Klocker et al.,317
2012) that the horizontal elements of K are apparently suppressed near-surface at the core of318
the Antarctic Circumpolar Current, and presumably in other strongly sheared currents. In the319
same currents, excess mixing can occur at depth in the “critical levels” where the phase velocity320
of the eddy disturbance coincides with the velocity of the mean shear (Abernathey et al., 2010).321
Lateral mixing has also been studied via the separation (dispersion) of clusters of pseudo-322
Lagrangian floats (Lacasce, 2008) as well as from data arising from the purposeful dye experi-323
ments. As with 33 realistic numerical models of the ocean must accommodate a complex and324
highly detailed spatial structure in the lateral components of the mixing tensor. Whether the325
temporal variations, owing to variations in time of energy inputs to the ocean are significant326
and if so, on what time-scales, remains largely unknown.327
Vertical Mixing: Direct Field Measurements328
The discovery of what is now called “microstructure” on scales of centimeters in vertical profiles329
of temperature and salinity in the middle 1960s, through the newly available profiling instru-330
ments (see Baker, 1981) led to the realization that the observed structures were an indicator331
of the direct actions of molecular processes in the oceanic circulation. (“Fine structure” is332
commonly defined as appearing on the larger, meter, scales.)333
Profiling instruments that measure the turbulent velocities have led to numerous direct334
estimates of diapycnal or vertical mixing rates. Osborn (1980) proposed that the relationship335
between the turbulent mixing coefficient and the measured dissipation could be calculated as,336
33 =Γ hi2
(18) {osborn}
where is defined in Eq. (12), brackets indicate an average, and =p− () 3 is the337
buoyancy frequency. Γ is the so-called mixing efficiency which is widely taken to be approxi-338
mately 0.2, but a growing body of evidence suggests that it can vary condiderably (Inoue and339
Smyth, 2009; Lozovatsky and Fernando, 2013). Its physical interpretation is as the fraction of340
the turbulent energy that goes into mixing, noting that it must vanish in an unstratified fluid.341
Variations in Γ by factors of two or three are not usually the limiting uncertainty in calculations342
involving Eq. (18), but eventually it must not be treated as a universal constant.343
An alternative measure (Osborn and Cox, 1972) is based directly on measurements of in344
14

Figure 5: From Waterhouse et al. (2014) showing estimated values of 33 over the top 1000m (a)
and averaged over the full depth (b) with many fewer measurements). (c) Shows the different types of
measurements used for calculations. LADCP is lowered doppler current profiler; CTD is conductivity,
temperature, depth; HDSS is hydrographic doppler sonar system.{waterhouse_et
the form,345
33 =h i2³3
´ (19) {osborn-cox}
The two methods should produce identical results where only temperature controls the stratifi-346
cation. Merrifield et al. (2016) discuss the differences when salinity becomes a factor. A major347
issue with Eqs. (18, 19) is that few instruments are capable of measuring the full spectrum348
of motions down to the Kolmogoroff scale, in or the even smaller equivalent Batchelor-349
scale, =p2 for temperature. Thus the unresolved contributions to or must come350
from extrapolation. Some of these extrapolation formulae are quite complex. Waterhouse et351
al. (2014) have compiled a global calculation of 33 from a very large variety of velocity profile352
measurements and extrapolations taken over the years, and a fixed value of Γ in Eq. (18), and353
are shown in Fig. 5). Upper ocean values are generally of order 10−5m2 with higher values in354
the very high latitudes. Values at depth derive from very sparse sampling and tend to be higher355
over topographic features, e.g., the Mid-Atlantic Ridge in the South Atlantic Ocean.356
Fig. 6 shows an approximate breakdown of their results by topographic roughness type.357
Abyssal plain values are nearly uniform with depth, while those over rough topography, and358
particularly over the mid-ocean ridges show a pronounced increase towards the bottom. Any359
15

calculation today of global mean abyssal values from these measurements would be highly un-360
certain.361
Vertical Mixing: Volumetric Inverse Methods362
Profiling instruments produce measurements at single points, and even in Fig. 5 they remain363
sparse in both space and time, conspicuously so at depth.. A different approach to deter-364
mination of 33 comes from integrating geostrophic flows over large volumes lying between365
isopycnals–and including boundary effects–in geostrophic box models. A closely related ap-366
proach is through the −spiral (e.g., Olbers et al., 1985; Fukumori, 1991).367
A particularly simple example is that of Hogg et al. (1982) who found that the deep Brazil368
Basin had to have a value of 33 of about 10−4m2s, not inconsistent with the abyssal recipes369
canonical value. Later profiling measurements–Toole et al. (1997)–show the volumetric av-370
erage there as being dominated by much higher values over and near the Mid-Atlantic Ridge371
and lower values over the abyssal plain. Various box inversions (e.g., Ganachaud 2003, Lump-372
kin and Speer, 2007, Macdonald et al., 2009) have produced basin-scale estimates ranging from373
about 2×10⁻⁵ to 3×10⁻⁴ , depending upon the location and depth as well as assumptions374
about detailed rates of flow. These results combine the effects of interior and lateral boundary/-375
topography mixing rates. All have significant stated uncertainties. Many places (Ganachaud,376
2003) show an increasing towards the bottom. A number of studies (e.g., Sloyan and377
Rintoul, 2000) have estimated the net diapycnal flux.378
Of particular interest have been the experiments with purposeful dye releases in the open379
ocean (e.g., Watson et al., 2013) which tend to give higher mixing rates than have been inferred380
from local profiling measurements–again probably best interpreted as an indication of higher381
intensity mixing near boundary topographies of various sorts (Mashayek et al., 2016).382
Boundary Mixing383
Munk (1966) had noted in passing that oceanic mixing could be greatly enhanced at the sidewall384
boundaries of the ocean. Stimulated by the intense motions generated on sloping boundaries by385
the internal wave field, Phillips (1970) and Wunsch (1970) examined the flows at the boundaries386
where no flux into the solid is permitted. Later examinations include that of Dell and Pratt387
(2015). No simple separation into vertical and horizontal effects is possible in those regions.388
The peculiar properties of internal waves on sloping boundaries, leading to intense break-389
ing, and boundary layer instabilities (Ivey et al., 2000) seen in the laboratory led to fine and390
microstructure measurements, first near islands and seamounts (Wunsch, 1972; Hogg et al.,391
16

Figure 6: Diffusivity 33 for density as estimated by Waterhouse et al. (2013). Thick red curve is the
average profile over smooth topography, thick orange curve is from rough topography and thick blue from
ocean ridges. General increase towards the bottom is evident, particularly over the latter two regions.
Thin lines show the scatter of each type.{waterhouse_et
17

1978; Eriksen, 1998) and to work on continental margins (e.g., Lamb, 2014). Direct experiments392
with injected artificial dyes (e.g., Ledwell et al., 2016) have confirmed that excess mixing does393
occur through various processes at continental boundaries. The collection of papers found in394
Imberger (1998) provides a useful overview. Oceanic canyons, both on continental margins and395
in the mid-ocean ridges also show strongly increased mixing, likely associated with internal wave396
instabilities of various kinds (see Kunze et al., 2002, Thurnherr et al., 2005). Armi (1978) cal-397
culated the effect of ambient flow and associated turbulence on sloping topography, but which398
gave rise to debate (see Garrett et al., 1993) concerning the influence of that mixing on the399
interior stratification. At the present time, it does appear that sloping boundary turbulence400
and consequent mixing are dominated by the complex motions and breaking from the internal401
wave field, including the internal tide. Whether the maximum effective mixing rates occur in the402
boundary layers, or in the interior region above the boundary layer is not so clear. Garrett et al.403
(1993) have argued that boundary layers tend to mix already mixed fluid and so are relatively404
ineffective compared to the enhanced breaking of internal waves just above the bottom.405
A sweeping generalization would be that the Munk canonical value for a vertical mixing406
coefficient of about 10−4m2s applies primarily to the deep ocean (somewhere deeper than the 1407
km depth he focussed on), as an average of much smaller interior values (below 10−5m2/s) and408
much higher values over topographic features, with generally increasing values as the topography409
(on many scales) is approached from above (See Toole et al., 1994; Munk and Wunsch, 1998).410
Regions with very small values of inferred 33 imply correspondingly very small values of the411
vertical velocity, in those places (see the next section), with major consequences for the412
behavior of the large-scale circulation. Furthermore, the strong increase of 33 toward the413
oceanic floor, away from the abyssal plains, gives rise to somewhat unexpected overall behavior414
through terms such as 333 (Ferrari et al., 2016) which act in the advection-diffusion415
equation as an equivalent abyssal vertical velocity.416
Boundary mixing is included in the inverse box model inversions where hydrographic lines417
terminate in topographic features, but not in most of the profiling measurements. Comparisons418
of volume averages from box models with point measurements from profilers are thus difficult.419
In the region above 1-2 km in the water column, the dominant values of 33 ≤ 10−5m2/s420
are consistent with the thermocline theories treating the motion as nearly non-diffusive. Much421
recent attention has thus focussed on the outcrop regions of the isopycnals/neutral surfaces in the422
Southern Ocean, where direct wind mixing, within the surface mixed-layer/Ekman layer, likely423
provides most of the transformation of water properties required by the observed upper-ocean424
circulation.425
Exchanges between the oceanic interior and fluid in the boundary layers of the sidewalls426
18
(recalling that their slope is usually less than 3◦) requires special treatment in its own right427
(e.g., Phillips et al., 1986; Garrett et al., 2013; Dell and Pratt, 2015) and may (Ferrari et al.,428
2016) control the interior circulation. Attention in the next several years is likely to further429
focus on the interaction of ocean flows on all scales with boundary features of all types.430
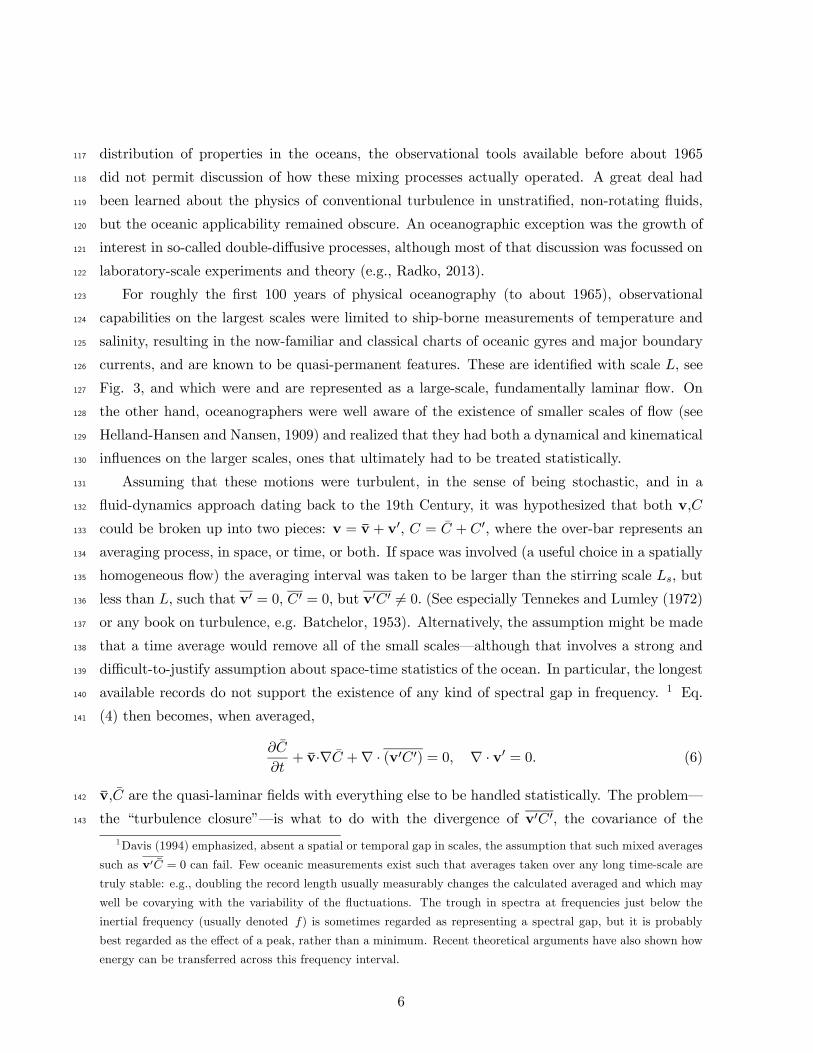
Consequences of Spatial Variations431
The existence of regions of strongly enhanced values of particularly the orders of magnitude432
found in 33 greatly complicates quantitative calculations of effective rates of mixing. Not only433
does the spatial variation have important consequences for the ocean circulation on the largest,434
scale, but the residence time of fluid within those “hotspots” is a function of the large-scale435
circulation itself (Mashayek et al., 2016).436
The simplest dependence on the spatial structure can be seen from the important dynamical437
relationship in a mainly geostrophically balanced ocean in the linear vorticity equation,438
=
(20)
where is the meridional velocity, and is the local meridional derivative of the Coriolis pa-439
rameter, To have a meridional flow requires a finite (the conventional Eulerian vertical440
component) with finite derivative. On the other hand, in regions of nearly horizontal isopycnals,441
Eq. (16) shows that the existence of depends directly upon the existence of a finite 33Weak442
values of vertical mixing, in the absence of steeply sloping isopycnals, imply weak or non-existent443
and hence a strong limit on any meridional flow.444
In the “abyssal recipe” of Eq. (16), a steady-state e.g., of temperature, = is maintained445
with a constant 33 as a balance between the downward diffusion of heat from the high temper-446
atures near the surface, and the upward advection cold water from below. But if the assumption447
of a vertically constant 33 is abandoned, the situation can be very different. Suppose by way448
of example that the abyssal ocean has a constant temperature gradient, 3 = 00, then Eq.449
(16) becomes450
=33
3(21) {wfromk}
and if, as now seems clear (Fig. 5), 33 is often largest near the ocean bottom, 0 and451
the balance is now that of the downward advection of temperature against the upward diffusion452
of cold water.2 An implication is the reversal of the standard picture of an upward movement453
of water balancing high latitude convection of dense, deep water to the abyss. The product of454
2The argument that true mixing can only increase the potential energy applies only to the net effects over the
entire volume.
19

Figure 7: A 20-year average estimated Eulerian from a highly constrained general circulation model (a
“state-estimate”; see Forget et al., 2015). Values at three depths are shown in the left-column, temporal
standard deviations in the right-column. 200m values are dominated by the Ekman pumping of the mean
wind, while the deepest values at 3000m are topographically controlled. Intermediate depth displays a
combination of both fields. (X. Liang, 2015, personal communication). The complex reversals show that
some universally valid description about the nature of vertical ocean fluxes is likely not possible.{liang_vertica
the density profile with that of 33 determines the sign of A more general derivation of this455
result, with a discussion of the potential consequences for the general circulation, is given by456
Ferrari et al. (2016).457
The implied values of from Eq. (21) will have a lateral variability that is as large or458
larger than that seen in 33 itself. Fig. 7 displays a 20-year average and its standard deviation459
obtained from a state estimate (an ocean general circulation model fit to the data by constrained460
least-squares). Among other implications is that the Eulerian field in the ocean is expected461
to be extremely noisy; Fig. 7 displays an estimate of at three depths. The spatial structures,462
particularly at depth, are complex even with 20-years of averaging. Liang et al. (2016) showed463
equivalent maps of the net time-averaged ∗ = + arising both from the Eulerian and464
eddy-induced values. No global generalization, even about just the open ocean values of or465
∗, is likely to be accurate. No reconciliation yet exists of the inferences from the Munk (1966)466
model, and those deriving from the intense spatial variability.467
20
Upper Ocean/Mixed Layer468
The surface layers of the ocean, in direct contact with the atmosphere have a specialized mixing469
literature of their own (D’Asaro, 2014). Surface outcrop areas of isopycnals visible in Fig. 3470
and in other oceans are of particular importance. Exchanges between the mixed layer and the471
ocean below have focussed on the influence of the sub-mesoscale, particularly as it influences472
the nutrient transfers, and hence the biology (e.g., Mahadevan, 2016).473
Vertical Mixing: The Energy Problem474
In the underlying Navier-Stokes equations such as (1), derives from the vibrational and other475
motions of molecules powered by the internal energy of the fluid. Consider that an isolated476
thermally stratified fluid will, after sufficiently long time, become uniform in temperature, with477
a consequent increase in its potential energy–the center of mass having been moved upward and478
with the internal energy correspondingly reduced. In numerical models, where the coefficients479
such as K are commonly introduced as ad hoc parameters representing the action of eddies on480
the larger scale no explicit source of energy has been specified. Beginning in the late 1990s,481
attention began to turn toward understanding of the complete oceanic energy budget including,482
specifically, the source of energy powering the stirring carrying the mixing the final step toward483
the molecular scale.484
Energy suppliers for the turbulent stirring and mixing are identical to those powering the485
overall general circulation and thus a clean separation of sources is not possible. Such overall486
power sources include: (1) the wind; (2) tides; (3) precipitation and evaporation; (4) heat487
exchange with the atmosphere; (5) atmospheric pressure changes. Attaching numbers with488
useful accuracy to these various processes has proved challenging, and the reader is referred for489
more detail to the article on ocean energetics. A summary would be that (3) and (5) are minor490
contributors, (1) and (2) are very important, and that evaluating (4) has proven problematic–as491
it appears to depend strongly on the flows established by (1) as well. Input of energy from the492
wind is thought to take place primarily on the largest scales, and on the scale of oceanic inertial493
motions (near the Coriolis frequency, )Much of the energy input appears first as an increase in494
oceanic potential energy, prior to its release into kinetic energy by a variety of pathways. Winds495
are believed to be the major power source for the balanced eddies via baroclinic instabilities, but496
then can act to destroy them. Tidal input of energy is believed to occur primarily through the497
conversion at topography of the ordinary surface tides into internal tides on scales far smaller498
than 499
Understanding the energetics of mixing then depends upon determination of the pathways500
21

by which the energy inputs carry energy down to the point where molecular processes can begin501
to work efficiently. These pathways and their importance and locales remain poorly quantified.502
Attention has focussed on internal waves–both interior breaking (see e.g., Munk, 1981; Thorpe,503
2010), and the very intense motions they induce on and over slopes of all kinds.504
Most of the kinetic energy of the ocean circulation lies in the balanced eddies and they505
are an obvious source for conversion into smaller scales. As compared to the internal wave506
field, their vertical and horizontal scales tend to be larger, but in topographic interactions they507
are capable of generating a large variety of much smaller scales including internal waves and508
boundary layers. The lifetime of the eddy field has been variously estimated as roughly 6509
months (Ferrari and Wunsch, 2009), but where and how the corresponding dissipation occurs510
is not fully quantified (Zhai et al., 2010; Clément et al., 2016). The direct coupling between511
geostrophically balanced motions and internal waves is weak (Vanneste, 2013). Also a strong512
tendency exists in rotationally dominated turbulence to drive energy “upscale”, that is to larger,513
rather than smaller spatial scales (e.g., Vallis, 2006). But turbulent bottom friction, topographic514
interactions, flow separation at bottom features, all remain viable dissipation candidates.515
General Circulation Models (GCMs)516
Oceanic kinetic energy (what moves tracers around) is dominated by the balanced eddies. As517
modelling power has grown, the greatest efforts have been directed at the detailed numerical518
representation of the balanced eddies in models. In particular, many global models fail to resolve519
the eddy field, and the numerical parameterization of the effects of balanced eddies has generated520
a voluminous literature (see the collection of papers in Hecht and Hasumi, 2007). In numerical521
models the mixing tensor (Eq. 10) is generally formulated in isopycnal coordinates, reflecting the522
anisotropy of diapycnal and isopycnal mixing. In so-called −coordinate models the resulting523
tensor is then transformed approximately back to geodetic coordinates. The re-transformation524
is not required for models written in isopycnal coordinates.525
Because lateral motions are much more intense than vertical ones, numerical difficulties arise526
in preventing artificial vertical diffusivities arising from the horizontal motions, distinguishing527
between those fields (temperature and salinity) which determine the isopycnals, and the passive528
tracers that make no such contribution. This complex subject is covered in the textbooks by529
Haidvogel and Beckmann (1999); Griffies (2004), Vallis (2006), Olbers et al. (2012).530
The largest literature focuses on the best numerical representation of K–in all three-531
dimensions–and its equivalents (the problem of “sub-grid scale parameterization”). In the532
process, the distinction between stirring and mixing has largely been lost, with the molecular533
scales assumed to take care of themselves–between the actions of K and with the inescapable534
22

numerical dissipation becoming a surrogate for the true molecular mixing. Much (not all) of535
the eddy effect is represented in terms of an equivalent lateral velocity (sometimes called the536
bolus velocity), and is calculated from the anti-symmetric components of tensor K (see espe-537
cially Flierl and McGillicudy, 2002, Section 7; the “skew-flux”), and is related closely to the538
transformed Eulerian mean (TEM). A common numerical method relies upon extensions and539
modifications of the proposal of Gent and McWilliams (1990). Because the method, and most540
of its variants, is focussed on baroclinic instability processes, it removes potential energy from541
the fluid by flattening isopycnals, rather than increasing it as in mixing. It is thus a scheme for542
spreading, and not mixing. An explicit dissipation picture for the energy released is lacking.543
Many of the isopycnals in the upper 1000m of the ocean–above the domain of Munk’s544
“abyssal recipes”–outcrop at the sea surface in the Southern Ocean (Fig. 3). There the intense545
turbulence existing in the surface boundary layer, derived directly from the locally powerful546
wind field, can provide an easy route for mixing the fluid across these density surfaces. (see547
e.g., the modelling study of von Storch et al., 2007). In the abyss, where the isopycnals do not548
outcrop to the surface, direct wind-forcing does not act and diapycnal mixing is dependent upon549
the wave breaking mechanisms.550
In a hypothetical ocean model that was capable of directly resolving the centimeter and551
smaller scales, important in ∇2 no parameterizations would be required. Taking the552
requisite length arbitrarily as 1 mm, vertically and horizontally, a global model would require553
of order 1027 grid points or Fourier components, and thus the need for statistical mechanics554
and parameterizations will exist indefinitely. Global models in which the balanced eddy field555
is adequately resolved are on the horizon, but the mixing scales, , remain far beyond direct556
reach.557
Summary Discussion558
The remarkable spatial variations now known to exist in ocean mixing processes have many559
implications for understanding and potential prediction of the ocean circulation and all of its560
climate consequences. With the coupling amongst motions at all time and space scales, discus-561
sion of mixing can hardly be done without a long excursion into all ocean flows and energetics.562
Spatial variations in effective mixing have powerful implications for the general circulation it-563
self (defined as a time average over several decades) implying a very different picture than was564
accepted until quite recently.565
In seeking gross generalizations, it appears that the tide–directly generating internal waves–566
and the wind generated instabilities and inertial motions, produce the turbulence that mixes the567
ocean. Roughly speaking, the equivalent vertical or diapycnal or dianeutral mixing coefficients568
23

range from comparatively low average values in the upper 1000m of about 10−5m2s, to an order569
of magnitude larger below that depth. Very much higher values appear in the surface mixed layer570
with distinct physics. Values increase in the abyss, over certain types of topographic features,571
by two or more additional orders of magnitude. The implications are that much of the upper572
ocean can be treated as a near-perfect fluid, with the necessary mixing occurring at the sea573
surface at high latitudes. In contrast, the very intense mixing over topographic features implies574
that vertical exchanges and hence the meridional oceanic motions are confined to very special575
regions, including lateral boundaries of all types. A general increase in diapycnal mixing toward576
the sea floor in the open ocean implies a net downward flux of temperature generally, with577
part of the upwards return flow being a lateral boundary phenomenon–and which represents a578
radical change in understanding of the deep circulation.579
Determination of the influence of the ocean on future climate change requires quantitative580
prediction of the ways in which energy exchanges with the atmosphere will shift, and in turn581
how those translate into modifications of the general circulation, its storage and transfers of582
heat, freshwater, carbon, oxygen, etc. The gross ocean stratification will also change, along583
with the mixing energetics and rates, as well as will the meteorological interactions. A priori584
calculation of the overall stratification and resulting movement of climate properties in the ocean585
past, present, and future remains a major challenge.586
Acknowledgement. I am grateful to R. Ferrari and C. Garrett for numerous comments and587
corrections and to the ECCO Consortium for support.588
24

References589
Abernathey, R., Marshall, J., Mazloff, M., & Shuckburgh, E. (2010). Critical layer enhance-590
ment of mesoscale eddy stirring in the Southern Ocean. Journal of Physical Oceanography, 40,591
170-184.592
Armi, L. (1978). Some evidence for boundary mixing in the deep ocean. Journal of Geophysical593
Research-Oceans and Atmospheres, 83(NC4), 1971-1979. doi: 10.1029/JC083iC04p01971594
Baker, D. J. (1981). Ocean instruments and experimental design. In B. A. Warren & C. Wun-595
sch (Eds.), Evolution of Physical Oceanography. Scientific Surveys in Honor of Henry Stommel.596
Cambridge MA: The MIT Press.597
Batchelor, G. K. (1953). The Theory of Homogeneous Turbulence: Cambridge Un. Press.598
Canuto, V. M., Cheng, Y., & Howard, A. M. (2007). Non-local ocean mixing model and a new599
plume model for deep convection. OceanModelling, 16, 28-46. doi: http://dx.doi.org/10.1016/j.ocemod.2006.07.00600
Clément, L., Frajka-Williams, E., Sheen, K. L., Brearley, J. A., & Garabato, A. C. N. (2016).601
Generation of internal waves by eddies impinging on the western boundary of the North Atlantic.602
Journal of Physical Oceanography, 46(4), 1067-1079. doi:10.1175/JPO-D-14-0241.1603
D’Asaro, E. A. (2014). Turbulence in the upper-ocean mixed layer. Annual Review of Marine604
Science, 6(1), 101-115. doi:10.1146/annurev-marine-010213-135138605
Davis, R. E. (1994). Diapycnal mixing in the ocean: equations for large-scale budgets. Journal606
of Physical Oceanography, 24(4), 777-800. doi: 10.1175/1520-0485607
Defant, A. (1961). Physical Oceanography, Vol. 1. New York: Pergamon.608
Dell, R. W., & Pratt, L. J. (2015). Diffusive boundary layers over varying topography. Journal609
of Fluid Mechanics, 769, 635-653.610
Eckart, C. (1948). An analysis of the stirring and mixing processes in incompressible fluids.611
Journal of Marine Research, 7(3), 265-275.612
Eriksen, C. C. (1998). Internal wave reflection and mixing at Fieberling Guyot. J. Geophys.613
Res., 103, 2977-2994.614
Ferrari, R., Mashayek, A., McDougall, T. J., Nikurashin, M., & Campin, J.-M. (2016). Turning615
ocean mixing upside down. Journal of Physical Oceanography, 46, 2239-2261.616
Ferrari, R., & Nikurashin, M. (2010). Suppression of Eddy Diffusivity across Jets in the South-617
ern Ocean. Journal of Physical Oceanography, 40(7), 1501-1519. Ferrari, R., & Wunsch, C.618
(2009). Ocean circulation kinetic energy: reservoirs, sources, and sinks. Annual Review of Fluid619
Mechanics, 41, 253-282. doi: DOI 10.1146/annurev.fluid.40.111406.102139620
Flierl, G., & McGillicuddy, D. J. (2002). Mesoscale and submesoscale physical-biological inter-621
actions. In A. R. Robinson, J. J. McCarthy & B. J. Rothschild (Eds.), The Sea, Vol. 12,113-185.622
25

New York: John Wiley & Sons.623
Forget, G., Campin, J.-M., Heimbach, P., Hill, C., Ponte, R., & Wunsch, C. (2015). ECCO624
version 4: an integrated framework for non-linear inverse modeling and global ocean state esti-625
mation. Geosci. Model Dev., 8, 3071?3104.626
Fukumori, I. (1991). Circulation about the Mediteranean Tongue: An analysis of an EOF-based627
ocean. Prog. in Oceanog., 27, 197-224.628
Garrett, C.. (2006). Turbulent dispersion in the ocean. Prog. in Oceanography, 70, 113-125.629
Garrett, C., Maccready, P., & Rhines, P. (1993). Boundary mixing and arrested Ekman630
layers–rotating stratified flow near a sloping boundary Annual Review of Fluid Mechanics, 25,631
291-323. doi: 10.1146/annurev.fl.25.010193.001451632
Griffies, S. M. (2004). Fundamentals of Ocean Climate Models: Princeton U. Press.633
Haidvogel, D. B., & Beckmann, A. (1999). Numerical Ocean Circulation Modeling: Imperial634
College Press, River Edge, NJ.635
Hecht, M. W., & Hasumi, H., (Eds.). (2008). Ocean Modeling in an Eddying Regime. Wash-636
ington, D.C.: American Geophysical Union.637
Helland-Hansen, B., & Nansen, F. (1909). The Norwegian Sea: Its Physical Oceanography638
Based Upon the Norwegian Researches 1900-1904. Report on Norwegian Fishery and Marine639
Investigations 2. Kristiania: Det Mallingske bogtrykkeri.640
Hogg, N. G. (1987). A least-squares fit of the advective-diffusive equations in Levitus Atlas641
data. Journal of Marine Research, 45, 347-375.642
Hogg, N. G., Katz, E. J., & Sanford, T. B. (1978). Eddies, islands, and mixing. Journal of Geo-643
physical Research-Oceans and Atmospheres, 83(NC6), 2921-2938. doi: 10.1029/JC083iC06p02921644
Holloway, G. (1986). Estimation of oceanic eddy transports from satellite altimetry. Nature,645
323, 243-244.646
Huang, R. X. (1999). Mixing and energetics of the oceanic thermohaline circulation.Journal of647
Physical Oceanography, 29, 272-746.648
Imberger, J. E. (1998). Physical Processes in Lakes and Oceans. Washington, DC: American649
Geophysical Union.650
Inoue, R., & Smyth, W. D. (2009). Efficiency of Mixing Forced by Unsteady Shear Flow. Jour-651
nal of Physical Oceanography, 39(5), 1150-1166. doi: 10.1175/2008jpo3927.1652
Ivey, G. N., & Winters, K. B., De Silva, I. P. D. (2000). Turbulent mixing in a sloping benthic653
boundary layer energized by internal waves. Journal of Fluid Mechanics, 418, 59-76.654
Klocker, A., Ferrari, R., & LaCasce, J. H. (2012). Estimating suppression of eddy mixing by655
mean flows. Journal of Physical Oceanography, 42(9), 1566-1576. doi: 10.1175/jpo-d-11-0205.1656
Kunze, E., Rosenfeld, L. K., Carter, G. S., & Gregg, M. C. (2002). Internal waves in Monterey657
26

Submarine Canyon. Journal of Physical Oceanography, 32(6), 1890-1913. doi:10.1175/1520-658
0485(2002)0321890:IWIMSC2.0.CO;2659
LaCasce, J. H. (2008). Statistics from Lagrangian observations. Progress in Oceanography,660
77(1), 1-29.661
Lamb, K. G. (2014). Internal wave breaking and dissipation mechanisms on the continental662
slope/shelf. In S. H. Davis & P. Moin (Eds.), Annual Review of Fluid Mechanics, Vol 46, 231-663
254.664
Ledwell, J. R., He, R., Xue, Z., DiMarco, S. F., Spencer, L., & Chapman, P. (2016). Dispersion665
of a tracer in the deep Gulf of Mexico. Journal of Geophysical Research: Oceans, 2169-9291.666
Liang, X., Wunsch, C., Heimbach, P., & Forget, G. (2016). Vertical redistribution of oceanic667
heat content. Journal of Climate, 28, 3821-3833.668
Lozovatsky, I. D., & Fernando, H. J. S. (2013). Mixing efficiency in natural flows. Philosoph-669
ical Transactions of the Royal Society A: Mathematical, Physical and Engineering Sciences,670
371(1982). doi: 10.1098/rsta.2012.0213671
Lumpkin, R., & Speer, K. (2007). Global ocean meridional overturning. Journal of Physical672
Oceanography, 37, 2550-2562. doi: 10.1175/jpo3130.1673
674
Mahadevan, A. (2016). The impact of submesoscale physics on primary productivity of675
plankton. In C. A. Carlson & S. J. Giovannoni (Eds.), Annual Review of Marine Science, Vol676
8, 161-184).677
Mashayek, A., Ferrari, R., Merrifield, S., Ledwell, J., St. Laurent, L., & Naveira Garabato, A.678
(2016). Topographic enhancement of vertical turbulent mixing in the Southern Ocean. Nature679
Comm., in press.680
McDougall, T. J., & Garrett, C. J. R. (1992). Scalar conservation equations in a turbulent681
ocean. Deep-Sea Research Part A- 39 (11-12A), 1953-1966. doi: 10.1016/0198-0149(92)90007-g682
McWilliams, J. C. (2008). The nature and consequences of oceanic eddies. In M. W. Hecht & H.683
Hasumi (Eds.), Ocean Modeling in an Eddying Regime (Vol. 177, pp. 5-15): AGU Monograph.684
Merrifield, S. T., Laurent, L. S., Owens, B., Thurnherr, A. M., & Toole, J. M. (2016). Enhanced685
diapycnal diffusivity in intrusive regions of the Drake Passage. Journal of Physical Oceanogra-686
phy, 46(4), 1309-1321. doi:10.1175/JPO-D-15-0068.1687
Munk, W. (1981). Internal waves and small-scale processes. In B. A. Warren & C. Wunsch688
(Eds.), in Evolution of Physical Oceanography. Scientific Surveys in Honor of Henry Stommel689
(pp. 264-291): The MIT Press, Cambridge, Ma (also at http://ocw.mit.edu/ans7870/resources690
/Wunsch/wunschtext.htm).691
Munk, W., & Wunsch, C. (1998). Abyssal recipes II: energetics of tidal and wind mixing. Deep-692
27

Sea Res., 45, 1976-2009.693
Munk, W. H. (1966). Abyssal recipes. Deep-Sea Res., 13, 707-730.694
Nash, J. D., Kunze, E., Toole, J. M., & Schmitt, R. W. (2004). Internal tide reflection and695
turbulent Mixing on the continental slope. Journal of Physical Oceanography, 34(5), 1117-1134.696
doi:10.1175/1520-0485(2004)0341117:ITRATM2.0.CO;2697
Needler, G. T., & Heath, R. A. (1975). Diffusion coefficients calculated from the Mediterranean698
salt anomaly in the North Atlantic Ocean.699
Olbers, D., J. M. Wenzel, & Willebrand, J. (1985). The inference of North Atlantic circulation700
patterns from climatological hydrographic data. Revs. Geophys., 23, 313-356.701
Olbers, D., Willebrand, J., & Eden, C. (2012). Ocean Dynamics. Berlin ; New York: Springer.702
Osborn, T. R. (1980). Estimates of the local rate of vertical duffusion from dissipation measure-703
ments.Journal of Physical Oceanography, 10, 83-89.704
Osborn, T. R., & Cox, C. S. (1972). Oceanic fine structure. Geophys. Fl. Dyn., 3, 321-345.705
Ottino, J. M. (1989). The Kinematics of Mixing: Stretching, Chaos, and Transport: Cambridge706
U. Press, Cambridge.707
Phillips, O. M. (1970). On flows induced by diffusion in a stably stratified fluid. Deep-Sea Res.,708
17, 435-443.709
Phillips, O. M., Shyu, J. H., & Salmun, H. (1986). An experiment on boundary mixing–mean710
circulation and transport rates. Journal of Fluid Mechanics, 173, 473-489.711
Radko, T. (2013). Double Diffusive Convection. Cambridge: Cambridge Un. Press.712
Salmon, R. (1998). Lectures on geophysical fluid dynamics. New York: Oxford University Press.713
Schanze, J. J., & Schmitt, R. W. (2013). Estimates of cabbeling in the global ocean. Journal of714
Physical Oceanography, 43(4), 698-705. doi: 10.1175/jpo-d-12-0119.1715
Schneider, E. K., & Bhatt, U. S. (2000). A dissipation integral with application to ocean diffu-716
sivities and structure. Journal of Physical Oceanography, 30(6), 1158-1171. doi: 10.1175/1520-717
0485(2000)0301158:adiwat2.0.co;2718
Sheen, K. L., Brearley, J. A., Garabato, A. C. N., Smeed, D. A., Waterman, S., Ledwell, J. R.,719
Watson, A. J. (2013). Rates and mechanisms of turbulent dissipation and mixing in the South-720
ern Ocean: Results from the Diapycnal and Isopycnal Mixing Experiment in the Southern Ocean721
(DIMES). Journal of Geophysical Research-Oceans, 118(6), 2774-2792. doi: 10.1002/jgrc.20217722
Sloyan, B. M., & Rintoul, S. R. (2000). Estimates of area-averaged diapycnal fluxes from723
basin-scale budgets. Journal of Physical Oceanography, 30(9), 2320-2341. doi:10.1175/1520-724
0485(2000)0302320:EOAADF2.0.CO;2725
Stammer, D. (1997). On eddy characteristics, eddy mixing and mean flow properties.Journal of726
Physical Oceanography, 28, 727-739.727
28

Stern, M. E. (1975). Ocean Circulation Physics: Academic New York.728
Stommel, H., & Webster, J. (1962). Some properties of thermocline equations in a subtropical729
gyre. Journal of Marine Research, 20, 42-56..730
Talley, L. D. (2007). Hydrographic Atlas of the World Ocean Circulation Experiment (WOCE)731
Volume 2: Pacific Ocean (Eds. M. Sparrow, P. Chapman, and J. Gould): http://www-pord.ucsd.edu/whp.mscatlas732
Tennekes, J., & Lumley, J. L. (1972). A First Course in Turbulence: The MIT Press.733
Thorpe, S. A. (2005). The Turbulent Ocean. Cambridge ; New York: Cambridge University734
Press.735
Thorpe, S. A. (2007). An Introduction to Ocean Turbulence: Cambridge.736
Thorpe, S. A. (2010). Breaking internal waves and turbulent dissipation. [Article]. Journal of737
Marine Research, 68(6), 851-880.738
Thurnherr, A. M., L. C. St. Laurent, K. G. Speer, J. M. Toole, & Ledwell, J. R. (2005). Mixing739
associated with sills in a canyon on the Midocean Ridge flank.Journal of Physical Oceanography,740
35, 1370-1381.741
Toole, J. M., K. L. Polzin„ & Schmitt, R. W. (1994). Estimates of diapycnal mixing in the742
abyssal ocean. Science, 264, 1120-1123.743
Vallis, G. K. (2006). Atmospheric and Oceanic Fluid Dynamics: Fundamentals and Large-Scale744
Circulation. Cambridge University Press.745
Vanneste, J. (2013). Balance and spontaneous wave generation in geophysical flows. In S. H.746
Davis & P. Moin (Eds.), Annual Review of Fluid Mechanics, 45, 147-172).747
von Storch, J. S., H. Sasaki, & Marotzke, J. (2007). Wind-generated power input to the deep748
ocean: An estimate using a $ 1/10^o$ general circulation model.Journal of Physical Oceanog-749
raphy, 37, 657-672.750
Waterhouse, A. F., MacKinnon, J. A., Nash, J. D., Alford, M. H., Kunze, E., Simmons, H. L.,...751
Lee, C. M. (2014). Global Patterns of Diapycnal Mixing from Measurements of the Turbulent752
Dissipation Rate. Journal of Physical Oceanography, 44(7), 1854-1872. doi: 10.1175/Jpo-D-13-753
0104.1754
755
Watson, A. J., Ledwell, J. R., Messias, M.-J., King, B. A., Mackay, N., Meredith, M. P.,...756
Naveira Garabato, A. C. (2013). Rapid cross-density ocean mixing at mid-depths in the Drake757
Passage measured by tracer release. Nature, 501(7467), 408-411. doi: 10.1038/nature12432758
Welander, P. (1955). Studies on the general development of motion in a 2-dimensional, ideal759
fluid. Tellus, 7(2), 141-156.760
Welander, P. (1971). The thermocline problem. Phil. Trans. Royal. Society London A, 270,761
69-73.762
29

Wunsch, C. (1970). On oceanic boundary mixing. Deep-sea Research, 17, 293-301.763
Wunsch, C. (1972). Temperature microstructure on the Bermuda slope, with application to the764
mean flow. Tellus, 24, 350-367.765
Wyrtki, K. (1962). The oxygen minima in relation to ocean circulation. Deep-Sea Research,766
9(1), 11-23.767
Zhai, X. M., & Johnson, H. L., Marshall, D. P. (2010). Significant sink of ocean-eddy energy768
near western boundaries. Nature Geoscience, 3(9), 608-612.769
30