ocean islands and seamounts chapter 14: ocean intraplate volcanism figure 14.1. map of relatively...
Post on 21-Dec-2015
218 views
TRANSCRIPT

Ocean islands and seamountsChapter 14: Ocean Intraplate VolcanismChapter 14: Ocean Intraplate Volcanism
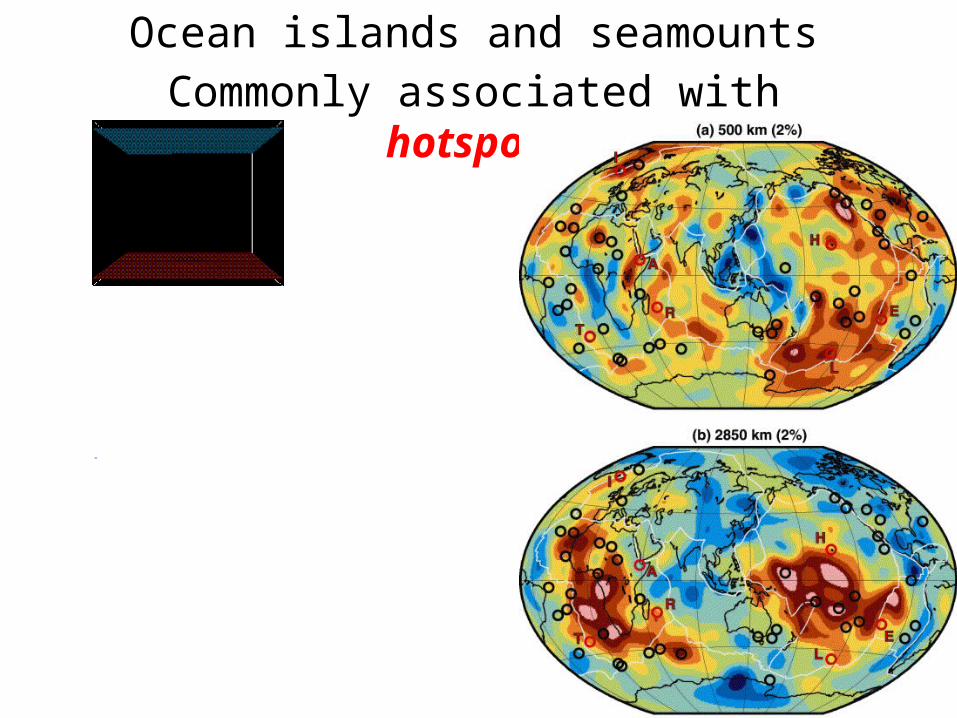
Figure 14.1. Map of relatively well-established hotspots and selected hotspot trails (island chains or aseismic ridges). Hotspots and trails from Crough (1983) with selected more recent hotspots from Anderson and Schramm (2005). Also shown are the geoid anomaly contours of Crough and Jurdy (1980, in meters). Note the preponderance of hotspots in the two major geoid highs (superswells).
Ocean islands and seamounts
Commonly associated with hotspots
PlumePlume
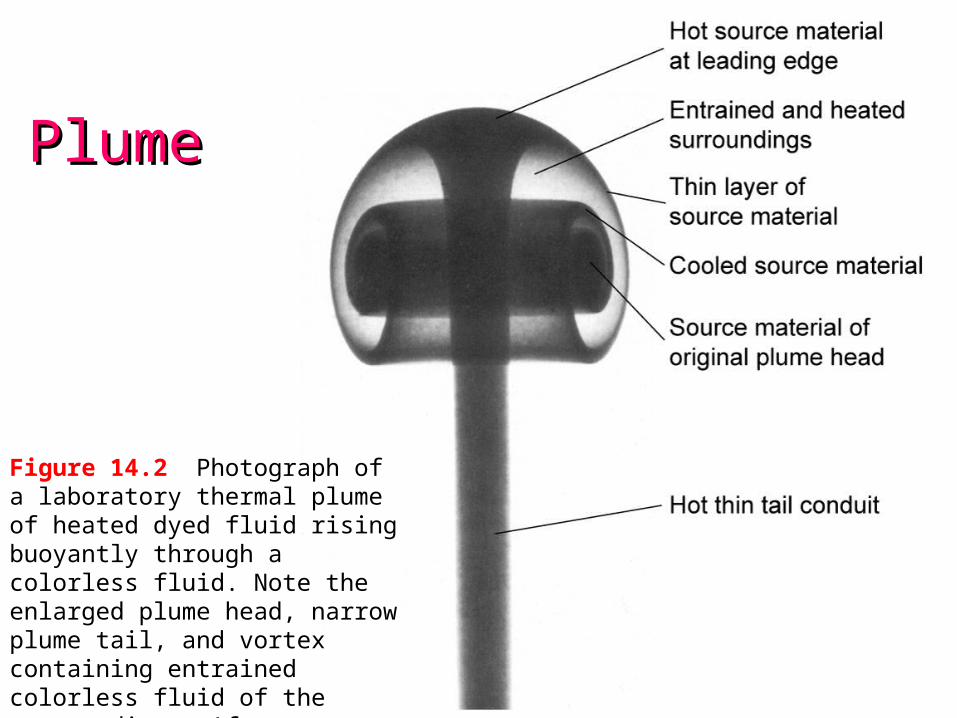
Figure 14.2 Photograph of a laboratory thermal plume of heated dyed fluid rising buoyantly through a colorless fluid. Note the enlarged plume head, narrow plume tail, and vortex containing entrained colorless fluid of the surroundings. After Campbell (1998) and Griffiths and Campbell (1990).
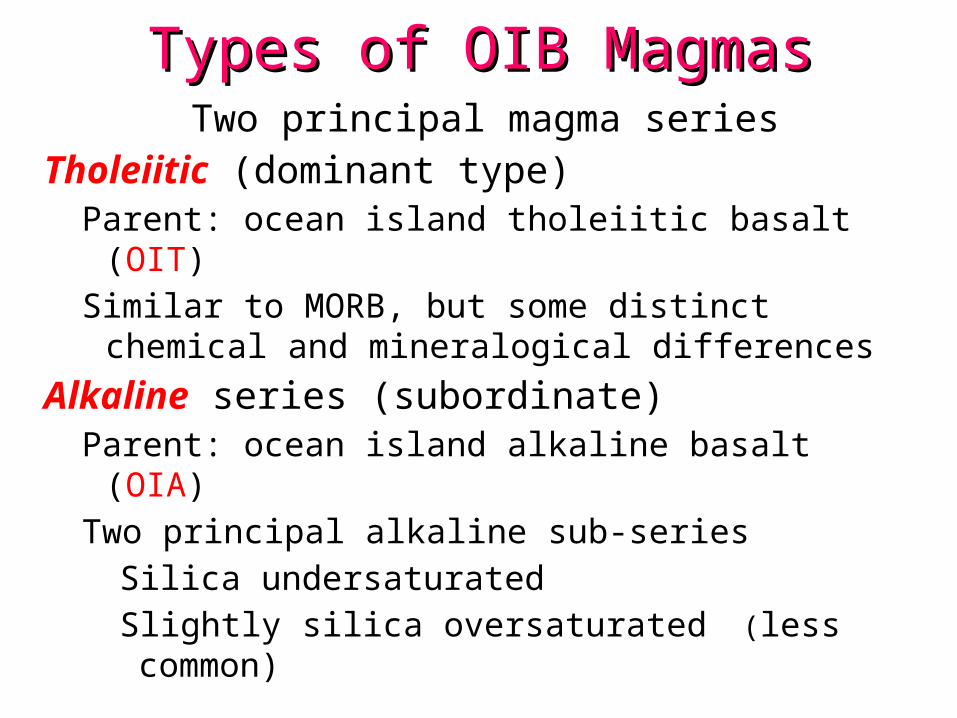
Types of OIB MagmasTypes of OIB MagmasTwo principal magma series
Tholeiitic (dominant type)Parent: ocean island tholeiitic basalt (OIT)
Similar to MORB, but some distinct chemical and mineralogical differences
Alkaline series (subordinate)Parent: ocean island alkaline basalt (OIA)
Two principal alkaline sub-series
Silica undersaturated
Slightly silica oversaturated (less common)

Hawaiian ScenarioHawaiian ScenarioCyclic, pattern to the eruptive history
1. Pre-shield-building stage (variable)2. Shield-building stage begins with tremendous
outpourings of tholeiitic basalts3. Waning activity more alkaline, episodic, diverse,
and violent (Mauna Kea, Hualalai, and Kohala). 4. A long period of dormancy, followed by a late,
post-erosional stage. Characterized by highly alkaline and silica-undersaturated magmas, including alkali basalts, nephelinites, melilite basalts, and basanites

Evolution in the SeriesEvolution in the SeriesTholeiitic, alkaline, and highly alkaline
Figure 14.3. After Wilson (1989) Igneous Petrogenesis. Kluwer.

Table 14-4. Alkali/silica ratios (regression) for selected ocean island lava suites.
Island Alk/Silica Na2O/SiO2 K2O/SiO2
Tahiti 0.86 0.54 0.32Principe 0.86 0.52 0.34Trinidade 0.83 0.47 0.35Fernando de Noronha 0.74 0.42 0.33Gough 0.74 0.30 0.44St. Helena 0.56 0.34 0.22Tristan da Cunha 0.46 0.24 0.22Azores 0.45 0.24 0.21Ascension 0.42 0.18 0.24Canary Is 0.41 0.22 0.19Tenerife 0.41 0.20 0.21Galapagos 0.25 0.12 0.13Iceland 0.20 0.08 0.12
Alkalinity is highly variable
Alkalis are incompatible elements, unaffected by less than 50% shallow fractional crystallization, this again argues for distinct mantle sources or generating mechanisms

Trace ElementsTrace Elements
The LIL trace elements (K, Rb, Cs, Ba, Pb2+ and Sr) are incompatible and are all enriched in OIB magmas with respect to MORBs
The ratios of incompatible elements have been employed to distinguish between source reservoirs N-MORB: the K/Ba ratio is high (usually > 100)
E-MORB: the K/Ba ratio is in the mid 30’s
OITs range from 25-40, and OIAs in the upper 20’s
Thus all appear to have distinctive sources

Trace ElementsTrace Elements
HFS elements (Th, U, Ce, Zr, Hf, Nb, Ta, and Ti) are also incompatible, and are enriched in OIBs > MORBs
Ratios of these elements are also used to distinguish mantle sources
The Zr/Nb ratio
N-MORBs are generally quite high (>30)
OIBs are low (<10)

Trace Elements: REEsTrace Elements: REEs
Figure 14.4. After Wilson (1989) Igneous Petrogenesis. Kluwer.

Trace Elements: REEsTrace Elements: REEs
La/Yb (REE slope) correlates with the degree of silica undersaturation in OIBs
Highly undersaturated magmas: La/Yb > 30 OIA: closer to 12 OIT: ~ 4 (+) slopes E-MORB and all OIBs N-MORB
(-) slope and appear to originate in the lower enriched mantle

MORB-normalized Spider DiagramsMORB-normalized Spider Diagrams
Figure 14-3. Winter (2001) An Introduction to Igneous and Metamorphic Petrology. Prentice Hall. Data from Sun and McDonough (1989).

Nb/U vs. NbNb/U vs. Nb
Figure 14.6. Nb/U ratios vs. Nb concentration in fresh glasses of both MORBs and OIBs. The Nb/U ratio is impressively constant over a range of Nb concentrations spanning over three orders of magnitude (increasing enrichment should correlate with higher Nb). From Hofmann (2003). Chondrite and continental crust values from Hofmann et al. (1986).

Isotope GeochemistryIsotope Geochemistry
Isotopes do not fractionate during partial melting of fractional melting processes, so will reflect the characteristics of the source
OIBs, which sample a great expanse of oceanic mantle in places where crustal contamination is minimal, provide incomparable evidence as to the nature of the mantle
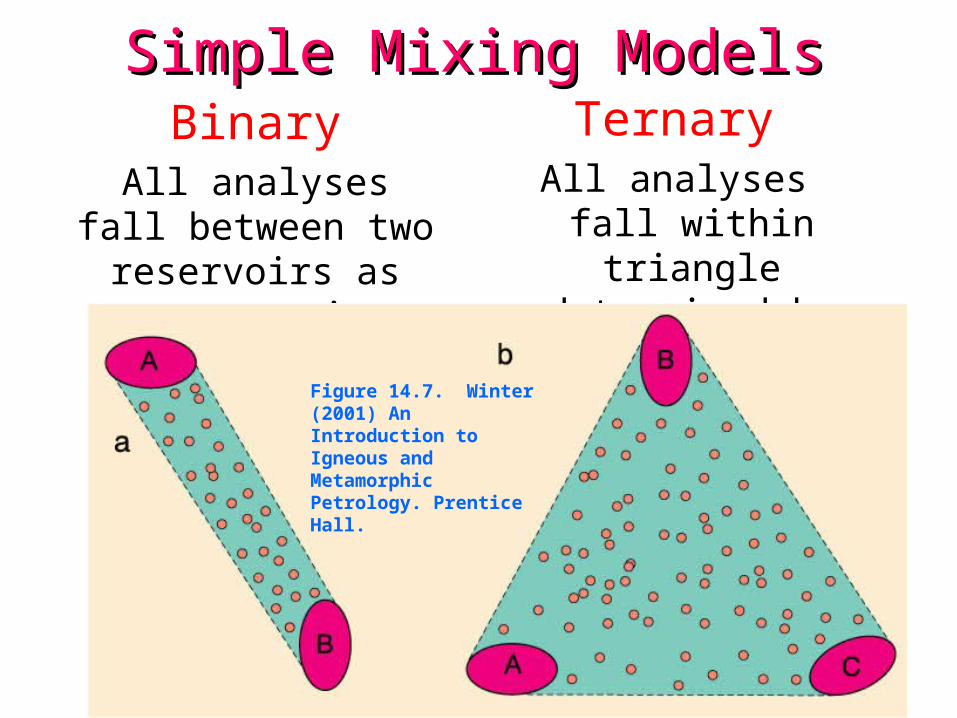
Simple Mixing ModelsSimple Mixing ModelsBinary
All analyses fall between two reservoirs
as magmas mix
TernaryAll analyses fall within
triangle determined by three reservoirs
Figure 14.7. Winter (2001) An Introduction to Igneous and Metamorphic Petrology. Prentice Hall.

Sr - Nd IsotopesSr - Nd Isotopes
Figure 13.13. Data from Ito et al. (1987) Chemical Geology, 62, 157-176; and LeRoex et al. (1983) J. Petrol., 24, 267-318.

Figure 14-6. After Zindler and Hart (1986), Staudigel et al. (1984), Hamelin et al. (1986) and Wilson (1989).

Mantle ReservoirsMantle Reservoirs
1. DM (Depleted Mantle) = N-MORB source
Figure 14.8. After Zindler and Hart (1986), Staudigel et al. (1984), Hamelin et al. (1986) and Wilson (1989).

2. BSE (Bulk Silicate Earth) or the Primary Uniform Reservoir
Figure 14.8. After Zindler and Hart (1986), Staudigel et al. (1984), Hamelin et al. (1986) and Wilson (1989).

3. EMI = enriched mantle type I has lower 87Sr/86Sr (near primordial)
4. EMII = enriched mantle type II has higher 87Sr/86Sr
(> 0.720), well above any reasonable mantle sources
Figure 14.8. After Zindler and Hart (1986), Staudigel et al. (1984), Hamelin et al. (1986) and Wilson (1989).

5. PREMA (PREvalent MAntle)
Figure 14.8. After Zindler and Hart (1986), Staudigel et al. (1984), Hamelin et al. (1986) and Wilson (1989).

Figure 14-6. After Zindler and Hart (1986), Staudigel et al. (1984), Hamelin et al. (1986) and Wilson (1989).
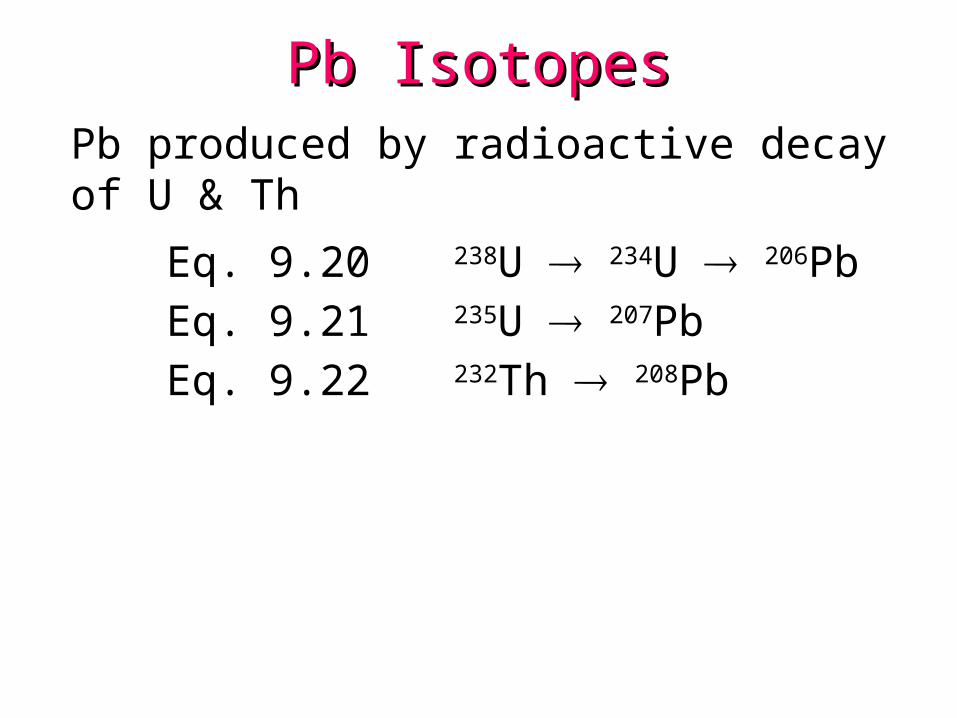
Pb IsotopesPb IsotopesPb produced by radioactive decay of U & Th
Eq. 9.20 238U 234U 206Pb
Eq. 9.21 235U 207Pb
Eq. 9.22 232Th 208Pb

Pb is quite scarce in the mantle Low-Pb mantle-derived melts susceptible to Pb contamination
U, Pb, and Th are concentrated in continental crust (high radiogenic daughter Pb isotopes)
204Pb non-radiogenic: 208Pb/204Pb, 207Pb/204Pb, and 206Pb/204Pb increase as U and Th decay
Oceanic crust also has elevated U and Th content (compared to the mantle)
Sediments derived from oceanic and continental crust
Pb is a sensitive measure of crustal (including sediment) components in mantle isotopic systems
93.7% of natural U is 238U, so 206Pb/204Pb will be most sensitive to a crustal-enriched component
9-20 238U 234U 206Pb9-21 235U 207Pb9-22 232Th 208Pb

Figure 14-7. After Wilson (1989) Igneous Petrogenesis. Kluwer.

= 238U/204Pb (evaluate uranium enrichment)
HIMU reservoir: very high 206Pb/204Pb ratio
Source with high U, yet not enriched in Rb (modest 87Sr/86Sr)
Old enough (> 1 Ga) to observed isotopic ratios
HIMU models: Subducted and recycled oceanic crust (± seawater) Localized mantle lead loss to the core Pb-Rb removal by those dependable (but difficult to
document) metasomatic fluids

EMI and EMIIEMI and EMII High 87Sr/86Sr require high Rb & long time to 87Sr
Correlates with continental crust (or sediments derived from it)
Oceanic crust and sediment are other likely candidates

Figure 14.10 After Wilson (1989) Igneous Petrogenesis. Kluwer. Data from Hamelin and Allègre (1985), Hart (1984), Vidal et al. (1984).
207Pb/204Pb data (especially from the N hemisphere) ~linear mixing line between DM and HIMU, a line called the Northern Hemisphere Reference Line (NHRL)
Data from the southern hemisphere (particularly Indian Ocean) departs from this line, and appears to include a larger EM component (probably EMII)

He IsotopesHe IsotopesNoble gases are inert and volatile4He is an alpha particle, produced principally by -decay of U and Th, enriching primordial 4He3He is largely primordial (constant)
The mantle is continually degassing and He lost (cannot recycle back)4He enrichment expressed as R = (3He/4He)
unusual among isotopes in that radiogenic is the denominator
Common reference is RA (air) = 1.39 x 10⁻⁶
Other isotopic systems that contribute to our understanding of mantle reservoirs and dynamics

He IsotopesHe Isotopes
N-MORB is fairly uniform at 8±1 RA suggesting an extensive depleted (degassed) DM-type N-MORB source
Figure 14.12 3He/4He isotope ratios in ocean island basalts and their relation to He concentration. Concentrations of 3He are in cm3 at 1 atm and 298K.After Sarda and Graham (1990) and Farley and Neroda (1998).

He IsotopesHe Isotopes
Figure 14.12 3He/4He isotope ratios in ocean island basalts and their relation to He concentration. Concentrations of 3He are in cm3 at 1 atm and 298K.After Sarda and Graham (1990) and Farley and Neroda (1998).
OIB 3He/4He values extend to both higher and lower values than N-MORBs, but are typically higher (low 4He).
Simplest explanations:
High R/RA is deeper mantle with more primordial signature
Low R/RA has higher 4He due to recycled (EM-type?) U and Th.

He IsotopesHe Isotopes
Figure 14.13 3He/4He vs. a. 87Sr/86Sr and b. 206Pb/204Pb for several OIB localities and MORB. The spread in the diagrams are most simply explained by mixing between four mantle components: DM, EMII, HIMU, and PHEM. After Farley et al. (1992).
PHEM (primitive helium mantle) is a hi-3He/4He mantle end-member reservoir with near-primitive Sr-Nd-Pb characteristics.

He IsotopesHe Isotopes
Summary:
Shallow mantle MORB source is relatively homogeneous and depleted in He
Deeper mantle has more primordial (high) 3He/4He, but still degassed and less than primordial (100-200RA) values
PHEM may be that more primitive reservoir
Low 3He/4He may be due to recycled crustal U and Th

Re/Os system and Os IsotopesRe/Os system and Os Isotopes187Re → 187Os
Both are platinum group elements (PGEs) and highly siderophile (→ core or sulfides)
Mantle values of (187Os/188Os) are near chondritic (~0.13)
Os is compatible during mantle partial melting (→ trace sulfides), but Re is moderately incompatible (→ melts and silicates)
The mantle is thus enriched in Os relative to crustal rocks and crustal rocks (higher Re and lower Os) develop a high (187Os/188Os) which should show up if crustal rocks are recycled back into the mantle.

Re/Os system and Os IsotopesRe/Os system and Os Isotopes
Figure 14.13 187Os/188Os vs. 206Pb/204Pb for mantle peridotites and several oceanic basalt provinces. Os values for the various mantle isotopic reservoirs are estimates. After Hauri (2002) and van Keken et al. (2002b).
All of the basalt provinces are enriched in 187Os over the values in mantle peridotites and require more than one 187Os-enriched reservoir to explain the distribution.
Peridotites are low (low Re)
Volcanics are Volcanics are high (with high (with little overlap little overlap to peridotites).to peridotites).High Re High Re indicates a indicates a crustalcrustal component.component.

O Isotopes (stable)O Isotopes (stable)Sufficiently light to mass fractionate during several geologic processes
Fractionation during melting, crystallization, and gas exsolution is minor, so most strictly silicate systems cluster at 18O ≈ 5.5 ± 0.2‰.
18O of MORBs reach 6‰ and OIBs up to 7‰ or more.
The change is small, but higher values correlate with trace element and Sr-Nd-Pb-Os values indicative of enriched sources.
18O of near-surface waters (and sediments equilibrated with such waters) range from 8 to 25‰.
High 18O in mantle systems is most readily explained by contamination by material affected by surface waters.

FOZO (focal zone): another “convergence” reservoir toward which many trends approach. Thus perhaps a common mixing end-member
Other Mantle ReservoirsOther Mantle Reservoirs
Figure 14.15. After Hart et al., 1992).

Mantle ReservoirsMantle Reservoirs
Reservoir 87Sr/86Sr 144Nd/143Nd 206Pb/204Pb 207Pb/204Pb 3He/4He 187Os/186Os 18O/16O
End-Member MantleDM 0.7015 - 0.7025 0.5133 - 0.5136 15.5 - 17.7 < 15.45 7 - 9 RA 0.123 - 0.126 low
HIMU 0.7025 - 0.7035 0.511 - 0.5121 21.2 - 21.7 15.8 - 15.9 2 - 6 RA? 0.15 low
EMI c 0.705 < 0.5112 17.6 - 17.7 15.46 - 15.49 2 - 6 RA? 0.152 low
EMII > 0.722 0.511 - 0.512 16.3 - 17.3 15.4 - 15.5 2 - 6 RA? 0.156? high
Other MantleBSE 0.7052 0.51264 18.4 15.58 40 - 80 RA? 0.129 low
PHEM 0.7042 - 0.7052 0.51265 - 0.51280 18.4 - 19.0 15.5 - 15.6 > 35 RA low lowPREMA 0.7033 < 0.5128 18.2 - 18.5 15.4 - 15.5FOZO 0.7028 - 0.7034 0.51287 - 0.51301 19.5 - 20.5 15.55 - 15.71 8 - 32 RA low lowC 0.703 - 0.704 0.5128 - 0.5129 19.2 - 19.8 15.55 - 15.65 20 - 25+? low low
Continental Crust 0.72 - 0.74 0.507 - 0.513 up to 28 up to 20 ~ 0.1 RA high high
Table 14-5. Approximate Isotopic Ratios of Various Reservoirs.
DM, HIMU, EMI, EMII, BSE from Rollinson (1993) p. 233-236, PHEM from Farley et al. (1992), FOZO from Hauri et al. (1994) and Stracke et al. (2005), C from Hanan and Graham (1996), Os values from Shirey and Walker (1998) and van Keken et al. (2002), O estimates based on Eiler (2001).

EMI, EMII, and HIMU: too enriched for any known mantle process...must correspond to crustal rocks and/or sediments
EMI Slightly enriched Deeper continental crust or oceanic crust
EMII More enriched Specially in 87Sr (Rb parent) and Pb (U/Th parents) Upper continental crust or ocean-island crust
If the EM and HIMU = continental crust (or older oceanic crust and sediments), only deeper mantle by subduction and recycling
To remain isotopically distinct: could not have rehomogenized or re-equilibrated with rest of mantle

The Nature of the MantleThe Nature of the Mantle• N-MORBs involve shallow melting of passively rising upper mantle
→ a significant volume of depleted upper mantle (lost lithophile elements and considerable He and other noble gases).
• OIBs typically originate from deeper levels.
Major- and trace-element data → the deep source of OIB magmas (both tholeiitic and alkaline) is distinct from that of N-MORB.
Trace element and isotopic data reinforce this notion and further indicate that the deeper mantle is relatively heterogeneous and complex, consisting of several domains of contrasting composition and origin. In addition to the depleted MORB mantle, there are at least four enriched components, including one or more containing recycled crustal and/or sedimentary material reintroduced into the mantle by subduction, and at least one (FOZO, PHEM, or C) that retains much of its primordial noble gases.
• MORBs are not as homogenous as originally thought, and exhibit most of the compositional variability of OIBs, although the variation is expressed in far more subordinate proportions. This implies that the shallow depleted mantle also contains some enriched components.

The Nature of the MantleThe Nature of the Mantle• So is the mantle layered (shallow depleted and deeper non-depleted and even
enriched)?
• Or are the enriched components stirred into the entire mantle (like fudge ripple ice cream)?
• How effective is the 660-km transition at impeding convective stirring??
• This depends on the Clapeyron slope of the phase transformation at the boundary!

Figure 14.16. Effectiveness of the 660-km transition in preventing penetration of a subducting slab or a rising plume
No Effect Retards Penetration Enhances Penetration→ 2-Layer Mantle Model more likely → Whole-Mantle mixing more likely

Figure 1.14. Schematic diagram of a 2-layer dynamic mantle model in which the 660 km transition is a sufficient density barrier to separate lower mantle convection (arrows represent flow patterns) from upper mantle flow, largely a response to plate separation. The only significant things that can penetrate this barrier are vigorous rising hotspot plumes and subducted lithosphere (which sink to become incorporated in the D" layer where they may be heated by the core and return as plumes). After Silver et al. (1988).
Mantle dynamicsMantle dynamics

Figure14.17. Whole-mantle convection model with geochemical heterogeneity preserved as blobs of fertile mantle in a host of depleted Whole-mantle convection model with geochemical heterogeneity preserved as blobs of fertile mantle in a host of depleted mantle. Higher density of the blobs results in their concentration in the lower mantle where they may be tapped by deep-seated plumes, mantle. Higher density of the blobs results in their concentration in the lower mantle where they may be tapped by deep-seated plumes, probably rising from a discontinuous D" layer of dense “dregs” at the base of the mantle. After Davies (1984) .probably rising from a discontinuous D" layer of dense “dregs” at the base of the mantle. After Davies (1984) .
Mantle dynamicsMantle dynamics
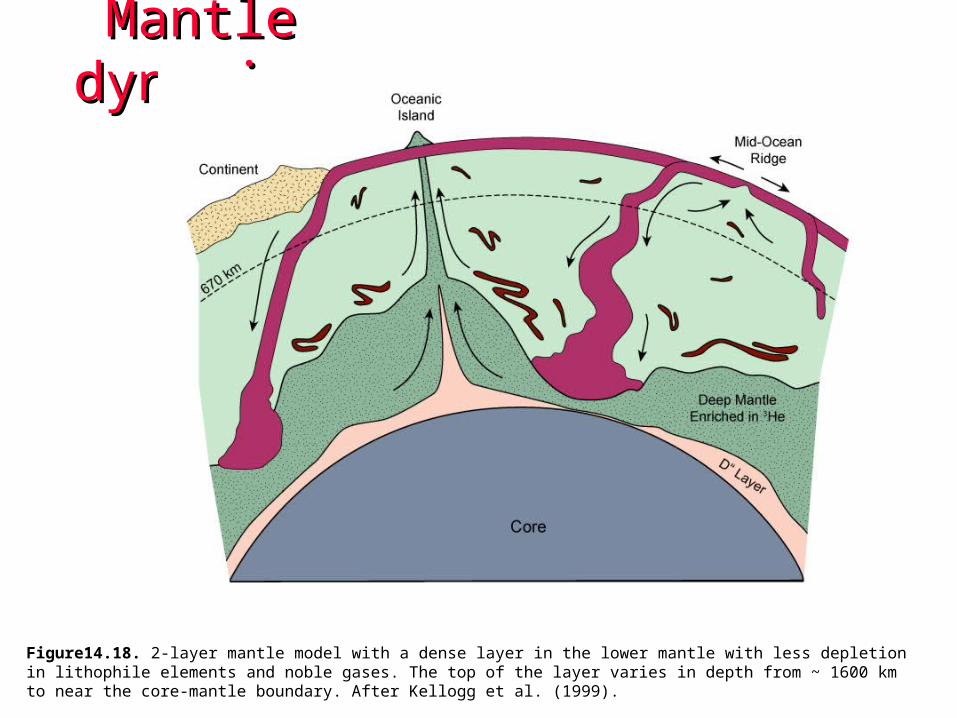
Figure14.18. 2-layer mantle model with a dense layer in the lower mantle with less depletion in lithophile elements and noble gases. The top of the layer varies in depth from ~ 1600 km to near the core-mantle boundary. After Kellogg et al. (1999).
Mantle dynamicsMantle dynamics

Various mantle convection models.
After Tackley (2000). Mantle Convection and Plate Tectonics: Towardan Integrated Physical and Chemical Theory. Science, 288, 2002-2007.
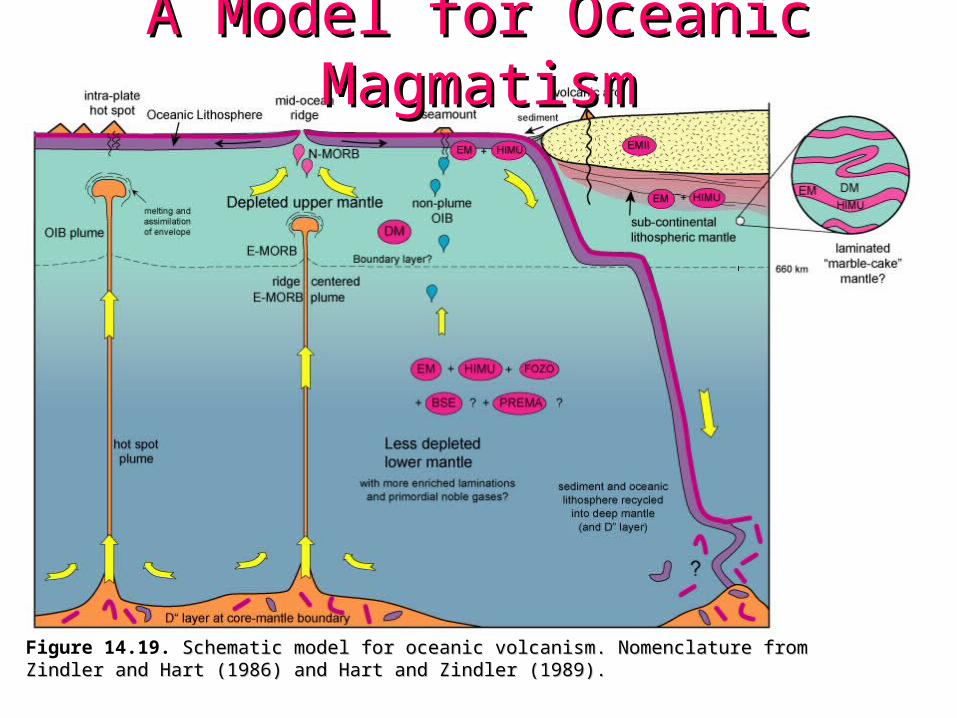
A Model for Oceanic MagmatismA Model for Oceanic Magmatism
Figure 14.19. Schematic model for oceanic volcanism. Nomenclature from Zindler and Hart (1986) and Schematic model for oceanic volcanism. Nomenclature from Zindler and Hart (1986) and Hart and Zindler (1989). Hart and Zindler (1989).

Can map the geographic distribution of the isotopic data, suggesting some very large-scale distribution regimes (in addition to the small-scale “marble-cake” regimes)
Figure 14.11. From Hart (1984) Nature, 309, 753-756.
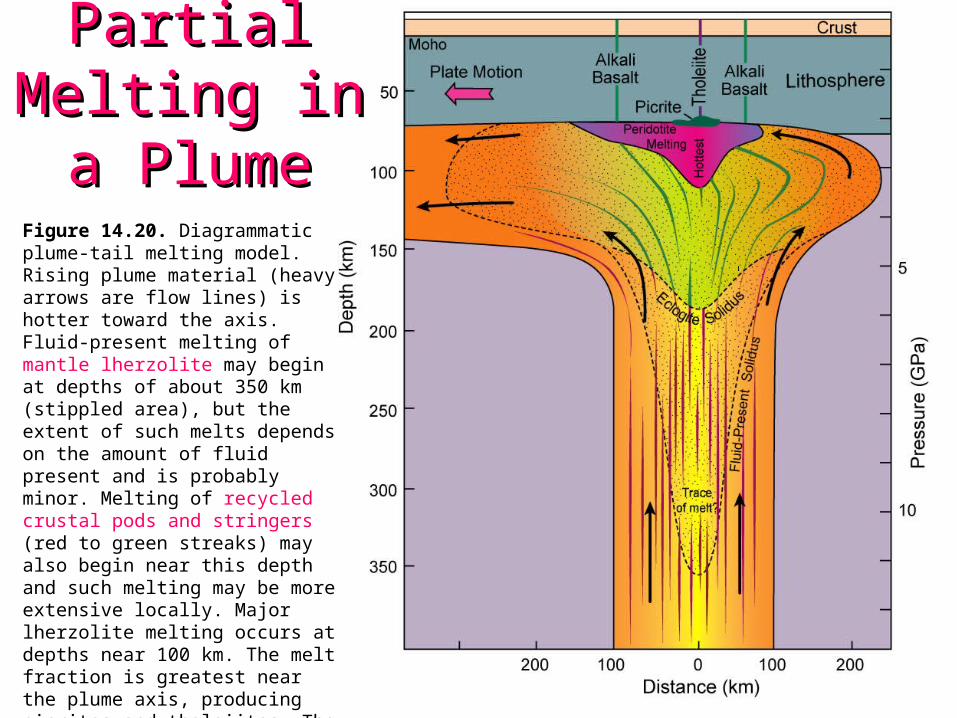
Partial Melting Partial Melting in a Plumein a Plume
Figure 14.20. Diagrammatic plume-tail melting model. Rising plume material (heavy arrows are flow lines) is hotter toward the axis. Fluid-present melting of mantle lherzolite may begin at depths of about 350 km (stippled area), but the extent of such melts depends on the amount of fluid present and is probably minor. Melting of recycled crustal pods and stringers (red to green streaks) may also begin near this depth and such melting may be more extensive locally. Major lherzolite melting occurs at depths near 100 km. The melt fraction is greatest near the plume axis, producing picrites and tholeiites. The extent of plume asymmetry depends on plume flux and plate velocity. Plume-head melting is much more extensive (Chapter 15). Based on Wyllie (1988b).

Figure 14.21. 143Nd/144Nd vs. 87Sr/86Sr for Maui and Oahu Hawaiian early tholeiitic shield-building, and later alkaline lavas. From Wilson (1989). Copyright © by permission Kluwer Academic Publishers.
Odd:
Tholeiites exhibit enriched isotopic characteristics and alkalic is more depleted (opposite to usual mantle trends for OIA-OIT).
Probably due to more extensive partial melting in the plume axial area (→ tholeiites) where the deep enriched plume source is concentrated
Less extensive partial melting (→ OIA) in the margins where more depleted upper mantle is entrained

A possible explanation for the late-A possible explanation for the late-stage Hawaiian melt rejuvinationstage Hawaiian melt rejuvination
Figure 14.22 Melt production in a numerical model of the Hawaiian plume assuming homogenous peridotitic material. Note that melting begins at about 160 km and melt flux is greatest within 30-50 km of the plume axis and deeper that 120 km. Of particular interest is the second melting event 300 km downstream of the primary melt zone, a result of the reascension of plume material that previously advected slightly downward beneath the lithosphere. Heavy black lines are mantle flow streamlines. After Ribe and Christensen (1999).

Figure 14.23 A schematic cross-section through the Earth showing the three types of plumes/hotspots proposed by Courtillot et al. (2003). “Primary” plumes, such as Hawaii, Afar, Reunion, and Louisville are deep-seated, rising from the D" layer at the core-mantle boundary to the surface. “Superplumes” or “superswells” are broader and less concentrated, and stall at the 660-km transition zone where the spawn a series of “secondary” plumes. “Tertiary” hotspots have a superficial origin. From Courtillot et al. (2003).