ocean-atmosphere momentum coupling in the kuroshio
TRANSCRIPT

631
Journal of Oceanography, Vol. 64, pp. 631 to 637, 2008
Keywords:⋅⋅⋅⋅⋅ Wind-stress,⋅⋅⋅⋅⋅ ocean-front,⋅⋅⋅⋅⋅ buoyancy,⋅⋅⋅⋅⋅ current-shear,⋅⋅⋅⋅⋅ scatterometer,⋅⋅⋅⋅⋅ ocean-atmosphere-coupling,
⋅⋅⋅⋅⋅ divergence,⋅⋅⋅⋅⋅ vorticity.
* Corresponding author. E-mail: [email protected]
Copyright©The Oceanographic Society of Japan/TERRAPUB/Springer
Ocean-Atmosphere Momentum Coupling in the KuroshioExtension Observed from Space
W. TIMOTHY LIU* and XIAOSU XIE
Jet Propulsion Laboratory, California Institute of Technology, Pasadena, CA 91109, U.S.A.
(Received 1 December 2007; in revised form 3 March 2008; accepted 11 March 2008)
Using a combination of Quick Scatterometer (QuikSCAT), Advanced Microwave Scan-ning Radiometer-Earth Observing System (AMSR-E), and Lagrangian drifter meas-urements, we demonstrate that wind data alone are not sufficient to derive oceansurface stress (momentum flux) over mid-latitude ocean fronts, specifically theKuroshio Extension. There was no continuous and large-scale stress measurementover ocean until the launch of the scatterometers. Stress had been derived from windsthrough a drag coefficient, and our concept of stress distribution may be largely in-fluenced by our knowledge of wind distribution. QuikSCAT reveals that the variabil-ity of stress could be very different from wind. The spatial coherence between themagnitude of stress and sea surface temperature (SST), between the divergence ofsurface stress and the downwind SST gradient, and between the vorticity of stressand crosswind SST gradient, are the inherent characteristics of stress (turbulenceproduction by buoyancy) that would exist even under a uniform wind field. The co-herence between stress vorticity and SST gradient is masked by the rotation of oceancurrents over the Kuroshio meanders. Surface stress rotates in the opposite directionto surface currents because stress is the vector difference between wind and current.The results are in agreement with a previous study of the Agulhas Extension andconfirm the unique stress measuring capability of the scatterometer.
capability of the space-based scatterometer in measuringstress rather than wind vector is demonstrated over thecurrent and temperature fronts of the Kuroshio Extensionin the northern Pacific Ocean, following the study of Liuet al. (2007) of the Agulhas Extension in the SouthernIndian Ocean. The present inadequacy of theparameterization of τ in terms of wind and the signifi-cance of stress measurement by the scatterometer is ex-amined.
2. Relation between Wind and StressStress is the turbulent transfer of momentum, and
turbulence is generated by atmospheric instability causedboth by wind shear (difference between wind and cur-rent) and buoyancy (vertical density stratification result-ing from temperature and humidity gradients). Direct τmeasurement has only been done in a few field campaignsin the past (e.g., Smith, 1980). For all practical purposes,our knowledge of τ is derived from winds (u) throughturbulence parameterization. The relation between τ andu at a height z, in terms of an empirical drag coefficient(CD), has been studied extensively and is governed bythe flux-profile relation (e.g., Liu et al., 1979):
1. IntroductionOcean surface stress (τ) is the momentum flux that
drives ocean circulation. The two-dimensional τ field isneeded to compute the divergence and curl (vorticity) thatcontrol the vertical mixing. The mixing brings short-termmomentum and heat trapped in the surface mixed layerinto the deep ocean, where they are stored over time, andbrings nutrients and carbon stored in the deep ocean tothe surface, where there is sufficient light for photosyn-thesis. The horizontal currents, driven in part by τ, dis-tribute the stored heat and carbon in the ocean. Until thelaunch of the scatterometer, our knowledge of τ distribu-tion was largely derived from winds measured at shipsand buoys, or from the operational wind product of nu-merical weather prediction (NWP) centers, through a dragcoefficient.
Traditional methods of parameterization of stress andtheir assumptions are discussed in Section 2. The unique

632 W. T. Liu and X. Xie
u u
u
z
z Cs
D
− = −
= ( )*
. ln ,2 51
10
ψ
where us is the surface current, u∗ = (τ/ρ)1/2 is the fric-tional velocity, ρ is the air density, z0 is the roughnesslength, and ψ is a function of the stability parameter,which is the ratio of buoyancy to shear production of tur-bulence. The effects of sea state and surface waves (e.g.,Donelan et al., 1997) are not included explicitly in therelation. In general oceanographic applications the sur-face current is assumed to be small compared with windand the atmosphere is assumed to be nearly neutral. Ne-glecting us and ψ, CD is a constant or a function of windspeed alone.
Advection, rolls (secondary flow), organized convec-tion, and similar circulation factors affect boundary-layerdynamics and winds, but their effects on τ have to bemanifested through surface turbulence according to Eq.(1) (e.g., Brown and Liu, 1982). Near the surface, fluxdivergence, baroclinicity, and Coriolis force can be ne-glected.
3. Data ProcessingThe principle of scatterometry and the history of
scatterometer missions have been reviewed by Liu (2002).The scatterometer sends microwave pulses to the Earth’ssurface and measures the backscatter power. Over theocean, the backscatter power is largely caused by small,centimeter-scale waves on the surface, which are believedto be in equilibrium with τ. Liu and Large (1981) demon-strated, for the first time, the relation between measure-ments by a space-based scatterometer and surface stressmeasured on research ships. There are much less stressthan wind measurements for validation and calibrationof the scatterometer. The geophysical data product of thescatterometer is the equivalent neutral wind (ENW) at 10m height (Liu and Tang, 1996), which, by definition, isuniquely related to τ, while the relation between τ andthe actual winds at the reference level depends on atmos-pheric stability and the ocean’s surface current.
ENW, similar to the frictional velocity, can be viewedas stress scaled to the wind unit. Starting with in-situmeasurements made under stable and unstable conditions,u∗ and z0 are computed (as the gradient and intercept atthe surface) as defined in Eq. (1), the flux-profiles rela-tion of Liu et al. (1979). With u∗ and z0, ENW is com-puted neglecting ψ. As discussed by Liu and Tang (1996)and shown in Liu et al. (2007), ENW is higher than uunder unstable conditions and lower than u under stableconditions. The computed ENW, of course, depends onψ, which represents the state-of-the-art of turbulenceparameterization (Liu et al., 1979). Although there have
been many investigations into improving the drag coeffi-cient (e.g., Fairall et al., 1996) in the past few decades,no significant changes have been introduced in the for-mulation. ENW at 25 km resolution starting from June2002 is used in this study.
AMSR-E, on board NASA’s Aqua satellite, waslaunched in May 2002 and has been collecting global SSTunder clear and cloudy conditions. SST, averaged to 0.25°by 0.25° grids for ascending and descending paths (Wentzand Meissner, 1999), was obtained from the Remote Sens-ing System and monthly averages were calculated.
Recently, more than a decade-long series of a globaldata set of near surface current has been made available.The current velocity was derived from Argos satellitecollections of the displacements of drifters with droguescentered at 15m-depth (Niiler, 2001). Five years of datafrom January 2000 to December 2004 were averaged andused in this study.
The altimeter products were produced by SSALTO(Segment Sol multimissions d’ALTimétrie,d’Orbitographie et de localisation precise)/DUACS (DataUnification and Altimeter Combination System) and dis-tributed by AVISO (Archiving, Validation and Interpre-tation of Satellite Oceanographic data), with support fromCNES (Centre National d’Études Spatiale). The mergeddata sets combine all available satellites with inter-cali-bration (Ducet et al., 2000) including TOPEX/Poseidon,Jason-1, ERS-1/2, Geosat Follow-On (GFO), and Envisat,with 0.25° × 0.25° and weekly resolution.
The operational NWP analysis products of the Na-tional Center for Environmental Prediction (NCEP) at 1°resolution were obtained from the National Center forAtmospheric Research. The high-resolution surface windvectors (at 1°) of the European Center for Medium RangeWeather Forecast (ECMWF) were obtained for the sameperiods by the QuikSCAT projects for validation purposesunder special arrangements.
To separate the features related to the Kuroshio Ex-tension meanders from the large-scale spatial gradients,a two-dimensional filter was applied to the monthly meanof all parameters. The filter essentially removes the run-ning mean with scales of 10° in longitude and 2° in lati-tude, weighted by a sine function. The deviations fromthe running mean were averaged through the availabledata period to construct the long-term mean anomalies;they are referred to as anomalies hereafter. The circularanomaly features associated with the Kuroshio Extensionmeanders are referred to as eddies. For the zonal (U) andmeridional (V) components of a vector (ENW or surfacecurrent), the convergence (–∂U/∂x – ∂V/∂y) and vorticity(∂V/∂x – ∂U/∂y) anomalies are computed from the long-term means of U and V anomalies. Vorticity is the verti-cal component of the curl of the vector.
Momentum Coupling between Kuroshio Extension and the Atmosphere 633
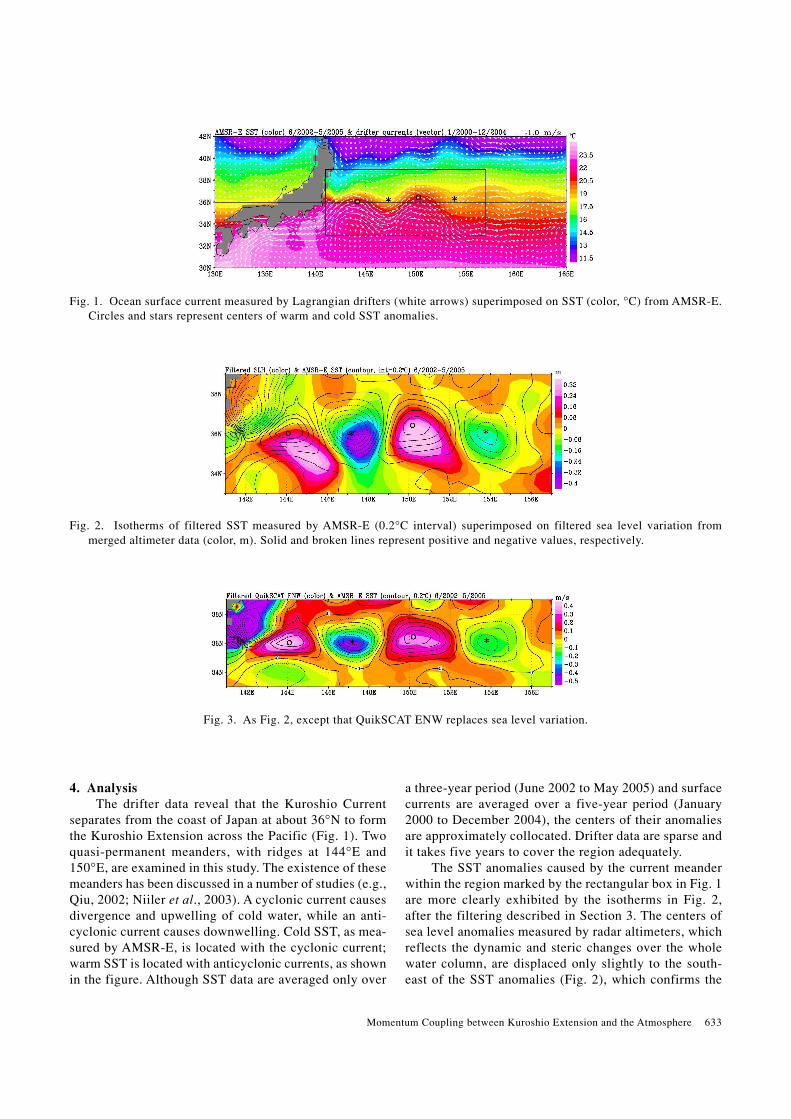
Fig. 1. Ocean surface current measured by Lagrangian drifters (white arrows) superimposed on SST (color, °C) from AMSR-E.Circles and stars represent centers of warm and cold SST anomalies.
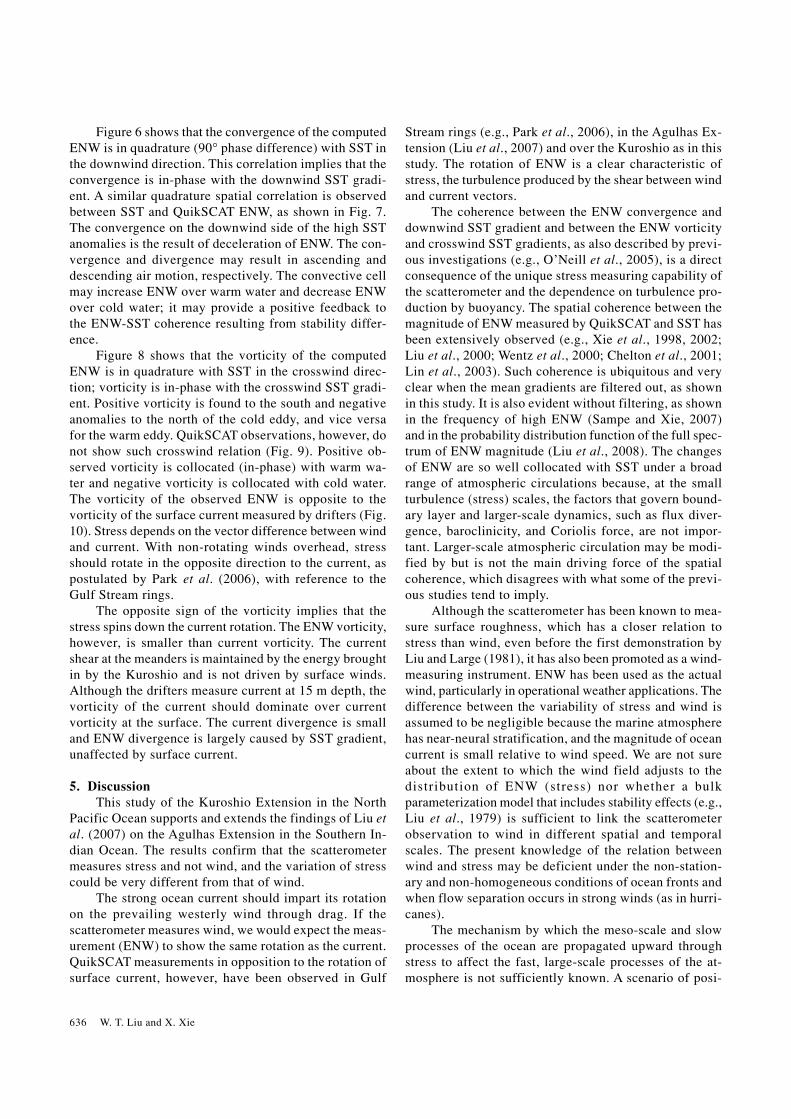
Fig. 2. Isotherms of filtered SST measured by AMSR-E (0.2°C interval) superimposed on filtered sea level variation frommerged altimeter data (color, m). Solid and broken lines represent positive and negative values, respectively.
Fig. 3. As Fig. 2, except that QuikSCAT ENW replaces sea level variation.
4. AnalysisThe drifter data reveal that the Kuroshio Current
separates from the coast of Japan at about 36°N to formthe Kuroshio Extension across the Pacific (Fig. 1). Twoquasi-permanent meanders, with ridges at 144°E and150°E, are examined in this study. The existence of thesemeanders has been discussed in a number of studies (e.g.,Qiu, 2002; Niiler et al., 2003). A cyclonic current causesdivergence and upwelling of cold water, while an anti-cyclonic current causes downwelling. Cold SST, as mea-sured by AMSR-E, is located with the cyclonic current;warm SST is located with anticyclonic currents, as shownin the figure. Although SST data are averaged only over
a three-year period (June 2002 to May 2005) and surfacecurrents are averaged over a five-year period (January2000 to December 2004), the centers of their anomaliesare approximately collocated. Drifter data are sparse andit takes five years to cover the region adequately.
The SST anomalies caused by the current meanderwithin the region marked by the rectangular box in Fig. 1are more clearly exhibited by the isotherms in Fig. 2,after the filtering described in Section 3. The centers ofsea level anomalies measured by radar altimeters, whichreflects the dynamic and steric changes over the wholewater column, are displaced only slightly to the south-east of the SST anomalies (Fig. 2), which confirms the

634 W. T. Liu and X. Xie
Fig. 4. Time-longitude variations of filtered magnitude of ENW (color, m/s) and SST (isotherm, 0.4°C interval) at 36°N.
Fig. 5. Contour of filtered magnitude of QuikSCAT ENW (0.05 m/s interval) superimposed on filtered magnitude of ENWcomputed from a uniform wind field (color, m/s).
Fig. 6. Convergence of filtered ENW computed from a uniform wind field (unit is 10–6/s).
Fig. 7. Convergence of filtered ENW observed by QuikSCAT (unit is 10–6/s).

Momentum Coupling between Kuroshio Extension and the Atmosphere 635
is performed. A uniform wind field at 10 m height is as-sumed, with speed of 7.1 m/s blowing from west to east,which is the average of ECMWF winds for the region forthe three-year period. Using AMSR-E SST and NCEP airtemperature and humidity at each grid location with thisconstant wind field, ENW is computed with the methoddescribed in Section 2. Figure 5 shows that the anoma-lies of computed ENW magnitude have a coherence withSST that is similar to the QuikSCAT measurements shownin Fig. 3, although the spatial variation of the computedENW is weaker than the observed variation. In reality,the wind field should not be uniform but adjusts to sur-face stress changes. The temperature and humidity fromNCEP do not accurately simulate the small-scale varia-tion over the ocean meanders.
Fig. 10. Filtered vector (black arrows) superimposed on vorticity (color, 10–6/s) of the surface current measured by Lagrangiandrifters.
Fig. 8. Vorticity of filtered ENW computed from a uniform wind field (unit is 10–6/s).
Fig. 9. Filtered vector (black arrows) superimposed on vorticity (color, 10–6/s) of ENW observed by QuikSCAT.
ocean upwelling associated with the meanders.The collocation of and the positive correlation be-
tween the magnitude of ENW (or τ) measured byQuikSCAT and SST are clearly demonstrated in Fig. 3.Positive ENW anomalies are found over warmer waterand negative anomalies over cooler water. The quasi-sta-tionary nature of these two meanders is demonstrated inFig. 4. High SST and ENW persist at 144°E and 150°E,while low SST and ENW persist at 146.5°E and 154°E,with exceptions in a few months (e.g., November 2003and February 2005). The stationary nature is weaker atthe eastern end of the meander centered at 154°E.
To illustrate that the coherence between QuikSCATmeasurements and SST is inherent in the definition ofENW (turbulent mixing theory), a conceptual experiment
636 W. T. Liu and X. Xie
Figure 6 shows that the convergence of the computedENW is in quadrature (90° phase difference) with SST inthe downwind direction. This correlation implies that theconvergence is in-phase with the downwind SST gradi-ent. A similar quadrature spatial correlation is observedbetween SST and QuikSCAT ENW, as shown in Fig. 7.The convergence on the downwind side of the high SSTanomalies is the result of deceleration of ENW. The con-vergence and divergence may result in ascending anddescending air motion, respectively. The convective cellmay increase ENW over warm water and decrease ENWover cold water; it may provide a positive feedback tothe ENW-SST coherence resulting from stability differ-ence.
Figure 8 shows that the vorticity of the computedENW is in quadrature with SST in the crosswind direc-tion; vorticity is in-phase with the crosswind SST gradi-ent. Positive vorticity is found to the south and negativeanomalies to the north of the cold eddy, and vice versafor the warm eddy. QuikSCAT observations, however, donot show such crosswind relation (Fig. 9). Positive ob-served vorticity is collocated (in-phase) with warm wa-ter and negative vorticity is collocated with cold water.The vorticity of the observed ENW is opposite to thevorticity of the surface current measured by drifters (Fig.10). Stress depends on the vector difference between windand current. With non-rotating winds overhead, stressshould rotate in the opposite direction to the current, aspostulated by Park et al. (2006), with reference to theGulf Stream rings.
The opposite sign of the vorticity implies that thestress spins down the current rotation. The ENW vorticity,however, is smaller than current vorticity. The currentshear at the meanders is maintained by the energy broughtin by the Kuroshio and is not driven by surface winds.Although the drifters measure current at 15 m depth, thevorticity of the current should dominate over currentvorticity at the surface. The current divergence is smalland ENW divergence is largely caused by SST gradient,unaffected by surface current.
5. DiscussionThis study of the Kuroshio Extension in the North
Pacific Ocean supports and extends the findings of Liu etal. (2007) on the Agulhas Extension in the Southern In-dian Ocean. The results confirm that the scatterometermeasures stress and not wind, and the variation of stresscould be very different from that of wind.
The strong ocean current should impart its rotationon the prevailing westerly wind through drag. If thescatterometer measures wind, we would expect the meas-urement (ENW) to show the same rotation as the current.QuikSCAT measurements in opposition to the rotation ofsurface current, however, have been observed in Gulf
Stream rings (e.g., Park et al., 2006), in the Agulhas Ex-tension (Liu et al., 2007) and over the Kuroshio as in thisstudy. The rotation of ENW is a clear characteristic ofstress, the turbulence produced by the shear between windand current vectors.
The coherence between the ENW convergence anddownwind SST gradient and between the ENW vorticityand crosswind SST gradients, as also described by previ-ous investigations (e.g., O’Neill et al., 2005), is a directconsequence of the unique stress measuring capability ofthe scatterometer and the dependence on turbulence pro-duction by buoyancy. The spatial coherence between themagnitude of ENW measured by QuikSCAT and SST hasbeen extensively observed (e.g., Xie et al., 1998, 2002;Liu et al., 2000; Wentz et al., 2000; Chelton et al., 2001;Lin et al., 2003). Such coherence is ubiquitous and veryclear when the mean gradients are filtered out, as shownin this study. It is also evident without filtering, as shownin the frequency of high ENW (Sampe and Xie, 2007)and in the probability distribution function of the full spec-trum of ENW magnitude (Liu et al., 2008). The changesof ENW are so well collocated with SST under a broadrange of atmospheric circulations because, at the smallturbulence (stress) scales, the factors that govern bound-ary layer and larger-scale dynamics, such as flux diver-gence, baroclinicity, and Coriolis force, are not impor-tant. Larger-scale atmospheric circulation may be modi-fied by but is not the main driving force of the spatialcoherence, which disagrees with what some of the previ-ous studies tend to imply.
Although the scatterometer has been known to mea-sure surface roughness, which has a closer relation tostress than wind, even before the first demonstration byLiu and Large (1981), it has also been promoted as a wind-measuring instrument. ENW has been used as the actualwind, particularly in operational weather applications. Thedifference between the variability of stress and wind isassumed to be negligible because the marine atmospherehas near-neural stratification, and the magnitude of oceancurrent is small relative to wind speed. We are not sureabout the extent to which the wind field adjusts to thedistribution of ENW (stress) nor whether a bulkparameterization model that includes stability effects (e.g.,Liu et al., 1979) is sufficient to link the scatterometerobservation to wind in different spatial and temporalscales. The present knowledge of the relation betweenwind and stress may be deficient under the non-station-ary and non-homogeneous conditions of ocean fronts andwhen flow separation occurs in strong winds (as in hurri-canes).
The mechanism by which the meso-scale and slowprocesses of the ocean are propagated upward throughstress to affect the fast, large-scale processes of the at-mosphere is not sufficiently known. A scenario of posi-

Momentum Coupling between Kuroshio Extension and the Atmosphere 637
tive atmospheric feedback to the SST-ENW relationthrough convection that will strengthen the spatial coher-ence is postulated in Section 4. However, the verticalvelocity of convection is not observed. Present numeri-cal models of atmosphere circulation in the mid-latitudesdo not propagate ocean SST signals vertically much be-yond the atmospheric boundary layer. The lapse rate isbelieved to be too weak to support deep convection. Theobservations of SST signatures in cloud and in atmos-pheric temperature high in the atmosphere by Liu et al.(2007) present a challenge to understanding the transi-tion from random turbulence to organized convection, andto improve the dynamic and the spatial versus temporalscale parameterization in a numerical model.
AcknowledgementsThis study was conducted at the Jet Propulsion Labo-
ratory, California Institute of Technology, under contractof the National Aeronautics and Space Administration(NASA). It was jointly supported by the Physical Ocea-nography and Ocean Vector Wind Programs of NASA.Sharon Schneider and Pearn P. Niiler kindly provided andadvised on the drifter data.
ReferencesBrown, R. A. and W. T. Liu (1982): An operational large-scale
marine planetary boundary layer model. J. Appl. Meteor.,2, 261–269.
Chelton, D. B., S. K. Esbensen, M. G. Schlax, N. Thum, M. H.Freilich, F. J. Wentz, C. L. Gentemann, M. J. McPhadenand P. S. Schoff (2001): Observations of coupling betweensurface wind stress and sea surface temperature in the east-ern tropical Pacific. J. Climate, 14, 1479–1498.
Donelan, M. A., W. M. Drennan and K. B. Katsaros (1997):The air-sea momentum flux in conditions of wind sea andswell. J. Phys. Oceanogr., 27, 2087–2099.
Ducet, N., P.-Y. Le Traon and G. Reverdin (2000): Global highresolution mapping of ocean circulation from TOPEX/Poseidon and ERS-1 and -2. J. Geophys. Res., 105, 19477–19498.
Fairall, C. W., E. F. Bradley, D. P. Rogers, J. B. Edson and G.S. Young (1996): Bulk parameterization of air-sea fluxesfor Tropical Ocean-Global Atmosphere/Coupled Ocean-Atmosphere Response Experiment (TOGA/COARE). J.Geophys. Res., 101, 3747–3764.
Lin, I.-I., W. T. Liu, C.-C. Wu, J. C. Chiang and C.-H. Sui(2003): Satellite observations of modulation of surfacewinds by typhoon-induced upper ocean cooling. Geophys.Res. Lett., 30(3), 1131, doi:10.1029/2002GL015674.
Liu, W. T. (2002): Progress in scatterometer application. J.Oceanogr., 58, 121–136.
Liu, W. T. and W. G. Large (1981): Determination of surfacestress by Seasat-SASS: A case study with JASIN Data. J.
Phys. Oceanogr., 11, 1603–1611.Liu, W. T. and W. Tang (1996): Equivalent Neutral Wind. JPL
Pub., 96-17, Jet Propulsion Lab., Pasadena, 8 pp.Liu, W. T., K. B. Katsaros and J. A. Businger (1979): Bulk
parameterization of air-sea exchanges in heat and watervapor including the molecular constraints at the interface.J. Atmos. Sci., 36, 1722–1735.
Liu, W. T., X. Xie, P. S. Polito, S. Xie and H. Hashizume (2000):Atmosphere manifestation of tropical instability waves ob-served by QuikSCAT and Tropical Rain Measuring Mis-sions. Geophys. Res. Lett., 27, 2545–2548.
Liu, W. T., X. Xie and P. P. Niiler (2007): Ocean-atmosphereinteraction over Agulhas Extension Meanders. J. Climate,20(23), 5784–5797.
Liu, W. T., W. Tang and X. Xie (2008): Wind power distribu-tion over global oceans. Geophys. Res. Lett. (submitted).
Niiler, P. P. (2001): The world ocean surface circulation. p. 193–204. In Ocean Circulation and Climate—Observing andModeling the Global Ocean, ed. by G. Siedler, J. Churchand J. Gould, Academic Press, Volume 77 of InternationalGeophysics Series.
Niiler, P. P., N. A. Maximenko, G. G. Panteleev, Y. Yamagataand D. B. Olson (2003): Near-surface dynamical structureof the Kuroshio Extension. J. Geophys. Res., 108(C6), 3193,doi:10.1029/2002JC001461.
O’Neill, L. W., D. B. Chelton, S. K. Esbensen and F. J. Wentz(2005): High-resolution satellite measurements of the at-mospheric boundary layer response to SST variation alongthe Agulhas Return Current. J. Climate, 18, 2706–2723.
Park, K.-A., P. Cornillon and D. L. Codiga (2006): Modifica-tion of surface winds near ocean fronts: effects of the GulfStream rings on scatterometer (QuikSCAT, NSCAT) windobservations. J. Geophys. Res., 111, C03021, doi:10.1029/2005JC003016.
Qiu, B. (2002): The Kuroshio Extension System: its large-scalevariability and role in the midlatitude ocean-atmosphereinteraction. J. Oceanogr., 58, 57–75.
Sampe, T. and S.-P. Xie (2007): Mapping high sea winds fromspace. Bull. Amer. Meteor. Soc., 88, 1965–1978.
Smith, S. D. (1980): Wind stress and heat flux over the oceanin gale force winds. J. Phys. Oceanogr., 10, 709–726.
Wentz, F. J. and T. Meissner (1999): AMSR Ocean Algorithm,Version 2. RSS Tech. Report 121599A, Remote SensingSystems.
Wentz, F. J., C. L. Gentemann, D. Smith and D. Chelton (2000):Satellite measurements of sea surface temperature throughclouds. Science, 288, 847–850.
Xie, S.-P., M. Ishiwatari, H. Hashizume and K. Takeuchi (1998):Coupled ocean-atmosphere waves on the equatorial front.Geophys. Res. Lett., 25, 3863–3866.
Xie, S.-P., J. Hafner, Y. Tanimoto, W. T. Liu, H. Tokinaga andH. Xu (2002): Bathymetric effect on the winter climatethrough the sea surface temperature in the Yellow and EastChina Seas. Geophys. Res. Lett., 29(24), 2228, doi:10.1029/2002GL015884.