occurrence and importance of foliar diseases on maize (zea
TRANSCRIPT

Occurrence and Importance of Foliar Diseases on Maize (Zea mays L.)
in Central Europe
Dissertation
to obtain the Ph. D. Degree
in the Faculty of Agricultural Sciences,
Georg-August-University Göttingen, Germany
presented by
Lucia Ramos Romero
Born in Granada, Andalusia, Spain
Göttingen, May 2016

D 7
1st Reviewer: Prof. Dr. Andreas von Tiedemann
2nd Reviewer: Prof. Dr. Petr. Karlovsky
Date of submission: 26.5.2016

Dedicated to
Hubert and Christa

-Estudia, que un día te alegrarás-
José Luis Ramos

Contents
I
Contents
Abbreviations
1. Introduction ...................................................................................................................1
1.1. Zea mays (L.): Origin, domestication and actual cultivation in Central Europe ..........1
1.2. Distribution and spread of maize pathogens across continents ................................3
1.3. Main maize leaf diseases in Central Europe .............................................................5
1.3.1. Turcicum leaf blight ...........................................................................................5
1.3.2. Kabatiella eyespot .............................................................................................6
1.4. Maize leaf diseases of secondary importance in Central Europe ..............................9
1.4.1. Common rust.....................................................................................................9
1.4.2. Northern corn leaf spot ....................................................................................10
1.4.3. Maize anthracnose ..........................................................................................10
1.4.4. Phoma spp. complex .......................................................................................12
1.5. Epidemics and potential yield losses ......................................................................14
1.6. Fungicides as control measure ...............................................................................17
1.7. Aim of the thesis .....................................................................................................19
2. Materials and Methods ................................................................................................20
2.1. Materials ................................................................................................................20
2.1.1. Media ..............................................................................................................21
2.1.2. Maize seeds ....................................................................................................22
2.2. Inventory and validation of fungal pathogens on maize leaves ...............................23
2.2.1. Sampling locations ..........................................................................................23
2.2.2. Isolation of fungal organisms ...........................................................................25
2.2.3. Preparation of single spore cultures ................................................................26
2.2.4. In vitro cultivation ............................................................................................27
2.2.5. Morphological identification of causal agents...................................................27
2.2.6. Molecular identification of Phoma spp. ............................................................29
2.2.6.1. Obtaining of DNA from pure cultures ........................................................29
2.2.6.2. Assessment of the obtained DNA yield and quality from cultures .............30
2.2.6.3. Conditions for PCR assay ........................................................................30
2.2.6.4. DNA sequencing and analysis ..................................................................31
2.2.6.5. Identification by the Fungal Biodiversity Center (CBS-KNAW) ..................31
2.2.7. Preservation techniques for fungal organisms .................................................32

Contents
II
2.2.8. Production of inoculum ....................................................................................33
2.2.9. Evaluation of pathogenicity in the greenhouse ................................................34
2.2.10. Re-isolation of the pathogen from the infected tissue ......................................38
2.3. Field locations for spore trapping and fungicide application studies ........................38
2.3.1. Locations for fungicide trials ............................................................................38
2.3.2. Locations for spore trapping ............................................................................41
2.4. Epidemiological studies based on spore trapping in the field ..................................42
2.4.1. Trapping season .............................................................................................42
2.4.2. Air sampling and analysis via microscopy .......................................................42
2.4.3. Spore release, development of the disease and weather conditions ...............43
2.5. Coupling spore trapping with PCR and qPCR assays ............................................43
2.5.1. DNA extractions from the spore trap tape ........................................................43
2.5.2. Specific primer sets for amplification ...............................................................44
2.5.3. Conditions for PCR assay ...............................................................................45
2.5.4. Assessment of the obtained DNA yield from tapes via PCR ............................45
2.5.5. Conditions for qPCR assay .............................................................................46
2.5.6. Primer specificity evaluation ............................................................................46
2.5.7. Primer sensitivity evaluation ............................................................................48
2.5.8. Dilutions of DNA yield as template ..................................................................48
2.6. Control of the main diseases through fungicides in the field ...................................49
2.6.1. Treatment design and fungicide application ....................................................49
2.6.2. Disease assessment .......................................................................................53
2.6.3. Biomass and grain yield ..................................................................................55
2.6.4. Correlation of disease development with weather factors ................................55
2.7. Data management and statistical analysis ..............................................................55
2.7.1. Epidemiological studies based on spore trapping in the field ...........................55
2.7.2. Control of the main diseases through fungicides in the field ............................56
3. Results .........................................................................................................................58
3.1. Inventory and validation of fungal pathogens on maize leaves in Central Europe ...58
3.1.1. Symptoms and morphological characterisation of E. turcicum and P. sorghi ...58
3.1.2. K. zeae, B. zeicola and C. graminicola ............................................................60
3.1.3. Symptoms and pathogenicity tests for Phoma spp. .........................................69
3.1.4. Characterisation of Phoma spp. ......................................................................73
3.1.5. Characterisation of Fusarium spp. and pathogenicity tests ..............................86
3.1.6. Testing of further organisms ............................................................................89
3.1.7. Summary of the inventory................................................................................89

Contents
III
3.1.8. Distribution and prevalence of fungal pathogens occurring on maize leaves ...93
3.2. Meteorological conditions .......................................................................................96
3.2.1. Mittich and Inzing ............................................................................................96
3.2.2. Ostenfeld .........................................................................................................99
3.2.3. Göttingen ...................................................................................................... 101
3.3. Epidemiological studies based on spore trapping in the field ................................ 102
3.3.1. Seasonal incidence of airborne conidia of E. turcicum ................................... 102
3.3.1.1. Inzing 2014 ............................................................................................ 102
3.3.1.2. Göttingen 2015....................................................................................... 105
3.3.1.3. Comparisons based on climatic conditions, development of Turcicum leaf
blight and spore release between Inzing 2014 and Göttingen 2015 ......................... 109
3.3.2. Correlation of microscope counts and DNA yield for E. turcicum ................... 110
3.3.2.1. Inzing ..................................................................................................... 110
3.3.2.2. Göttingen ............................................................................................... 112
3.3.3. Seasonal incidence of inoculum of K. zeae analysed via qPCR .................... 114
3.3.3.1. Ostenfeld................................................................................................ 114
3.3.3.2. Göttingen ............................................................................................... 116
3.3.4. Detection through qPCR and sensitivity ........................................................ 118
3.3.5. Evaluation of specificity ................................................................................. 120
3.4. Evaluation of disease control through fungicides .................................................. 123
3.4.1. Turcicum leaf blight and common rust in Mittich 2013 ................................... 123
3.4.2. Turcicum leaf blight in Inzing 2014 ................................................................ 127
3.4.3. Kabatiella eyespot in Ostenfeld 2013 and 2014 ............................................. 128
3.4.4. Effect of fungicide treatments on yield in Mittich 2013 and Inzing 2014 ......... 132
3.4.5. Effect of fungicide treatments on yield in Ostenfeld 2013 and 2014 ............... 133
3.4.6. Statistical correlation between yield and disease ........................................... 135
3.4.7. Theoretical thresholds ................................................................................... 138
4. Discussion ................................................................................................................. 140
4.1. Occurrence of leaf pathogens on maize in Central Europe ................................... 140
4.1.1. Monitoring and prevalence of diseases in 2012 and 2013 ............................. 140
4.1.2. Aspects of isolation and inoculum production ................................................ 149
4.1.3. Preservation techniques ................................................................................ 150
4.2. Development of E. turcicum and K. zeae across seasons (2011-2014) ................ 151
4.3. Epidemiological studies through spore trapping ................................................... 152
4.3.1. Estimation of the latent period of E. turcicum................................................. 152
4.3.2. Interpretation of K. zeae results ..................................................................... 161

Contents
IV
4.3.3. Further considerations for qPCR and PCR assays ........................................ 163
4.4. Application of fungicides ....................................................................................... 164
4.4.1. Fungicide effects on infected leaf area .......................................................... 165
4.4.2. Disease development .................................................................................... 166
4.4.3. Timing of application ..................................................................................... 167
4.4.4. Disease yield loss relationships ..................................................................... 168
4.4.5. Economic thresholds ..................................................................................... 171
4.4.6. Recommendations for application of fungicides on maize ............................. 175
Summary ........................................................................................................................... 176
References ........................................................................................................................ 179
Appendix ........................................................................................................................... 204
Acknowledgements

V
Abbreviations
BBCH phenological development stages scale
bp base pair
°C degree celsius
cm centimetre
dNTP deoxynucleotide triphosphate
e.g. for example (exempli gratia)
fg fentogram
g/l gram/ litre
h hour
ha hectare
i.e that is (id est)
kg kilogram
klx kilolux
km kilometre
l liter
m metre
m2 square metre
mbp mega base pair
mg milligram
min minute
ml millilitre
mm millimetre
mM milimolar
pg picogram
pmol picomol
rpm revolutions per minute
s second
U units
UV ultraviolet Light
% percentage
xg times gravity
µg microgram
µM micromolar
µmol micromol

Introduction
1
1. Introduction
1.1. Zea mays (L.): Origin, domestication and actual cultivation in Central Europe
Zea mays (family Poaceae) is the only species in the Genus Zea (Paliwal 2001). It was
domesticated from its wild ancestors teosinte (Zea mays L. ssp. parviglumis Illtis & Doebley
and spp. mexicana) and tripsacum between the basin of the Balsas River and the highlands
of Mexico´s Meseta Central approximately 9,000 years ago according to the phylogenetic
analysis of Matsuoka et al. (2002). This theory is supported by the diversity of maize in these
regions, as well as the prevalence of ssp. mexicana growing as a weed in the corn fields of
the Mexican highlands. Furthermore, fossil pollen and maize cobs in caves of the Mexican
region of Puebla have been discovered along with various ceramic remains from the period
in question (Paliwal 2001; Segovia & Alfaro 2009). However, uncertainties surrounding single
and multiple domestication are still extensively discussed in the literature (Paliwal 2001;
Matsuoka et al. 2002). Although some authors maintain that maize was being cultivated in
the central Caribbean Archipelago much earlier, the consensus is that by the 11 th century
maize was distributed across a large number of areas situated in the region (Sanoja 1989;
Higuera-Gundy 1991 cited by Newsom 2009; Newson & Deagan 1994; Pagán Jímenez et al.
2005; Lane et al. 2008). Here, the name “mahiz” (from the Arawak language) was g iven to
the plant by the Taíno people, who inhabited the Bahamian Archipelago and the Greater
Antilles (Rouse 1992). With the first voyage of Christopher Columbus (1492-1493), maize
kernels were transported back to Europe, consequently being cultivated in the 16th Century in
southern European regions (Anghiera 1907 (1st ed. 1530) cited by Dubreuil et al. 2006;
Staller 2010).
Thus, initially maize was most likely cultivated in warm European areas such as southern
Spain (Andalusia) and the surrounding Mediterranean regions (Dubreuil et al. 2006). Later,
the introduction of further Northern American maize populations was decisive for the
adaptation and distribution of maize in other European regions as molecular data from
Rebourg et al. (2002) and Dubreuil et al. (2006) reveal.
The genetic variability of maize has permitted its presence in diverse conditions, reflected by
the current large-scale cultivation of the plant. This adaptation has allowed for the
development of varieties that can grow at lower temperatures and mature in a shorter time
span, hence the crop can grow from temperate to tropical regions (Krishna 2013; Sood et al.
2014).
In Germany, the crop was initially cultivated in the southern region of Baden-Württemberg,
where towards the end of the 19th century, the cultivated area in the region had expanded to
approximately 2,600 ha. The introduction of modern silage preparation techniques in the first

Introduction
2
half of the 20th century encouraged further production of maize, establishing its importance
and increasing its cultivated area to 55,000 ha by the late 1960s (Zscheischler et al. 1990).
Additional aspects that definitively promoted the cultivation of maize in Germany and other
European countries were the introduction of new and improved sowing and harvesting
techniques, chemical control against weeds and the genetic enhancement of varieties that
were adapted to the different climatic regions of Germany and Europe. This has allowed for
an increase in yields and the adaptation of the plant to different soil types (Zscheischler et al.
1990).
At present, maize has several uses in Europe such as food, animal feed, bioenergy and
industrial products. This range of uses has also led to a further increase in the production of
maize across the continent, especially outside of the traditionally largest maize growing
countries, namely France, Romania and Italy1. Taking Germany again as an example, in
2004 the government introduced feed-in-tariffs to promote increased maize production for
use in biogas as alternative energy in line with the German Renewable Energy Act [German:
Erneuerbare-Energien-Gesetz (EEG)]. This has turned Germany into one of the major
producers of maize in Europe, augmenting its cultivated area from 1.6 million ha in 2005 to
2.56 million ha in 20112 (DMK 2015). With an approximate cultivated area of 2.5 million ha,
maize has now become the second most cultivated crop in Germany, surpassed only by
wheat with 3.2 million ha (Federal Statistical Office of Germany 2015).
By far the largest increase in cultivation has been witnessed in the Ukraine, moving from
sixth to first among European producers since the turn of the century (see Figure 1). Despite
maize being the fourth most cultivated crop in the Ukraine (behind wheat, barley and
sunflower seeds), the size of the country and hence potential cultivation area is very large,
and in recent years the production of barley has declined due to growers preferring the more
profitable maize, with higher prices and demand on world markets (FAO 2014). Most of the
growing regions are situated in central-northern areas of the country, which are appropriate
for maize production due to their flat topography, good soils and abundant availability of
water during summer (Bussay 2015).
1 Compared to Germany, which only had a cultivated area 59 046 ha in 1968, France and Italy already had 1
023800 and 967 207 ha, respectively. Data for Romania is only available from 1999 onwards, however in 1999 it had a cultivated area of 3 071 000 ha, making it the second largest producer in Europe at the time. 2 Note that in 2012, the tariff structure of the EEG was changed, offering less incentives for biogas. Maize
production in Germany has remained relatively stable since (DMK 2015).

Introduction
3
Fig. 1. Development of maize cultivation area in the main European producer countries in recent years
(data compiled from ZMP 2008; FAO 2014; USDA 2015; State Statistics Service Ukraine 2015).
Meanwhile, France has maintained a stable level of cultivation in recent years, while
Romania has experienced a reduction, often being affected by drought conditions (ZMP
2008, FAO 2014, DMK 2015). In 2012, for example, yield losses in Romania were estimated
to be 46.1% compared to the average yield from 2009-2011 (Mateescu et al. 2013). The
other traditional producer of maize mentioned above, Italy, has been overtaken in recent
years by Germany and the Ukraine, with the cultivated area of maize falling from the early
60s to around 1990 and remaining relatively stable since then. Italy, like Romania, has also
been affected by drought over the last few decades (Diodato & Bellocchi 2008).
Overall, the general increase in the cultivated area of maize in Europe has led to more
intense maize cultivation in many regions, often accompanied by narrowed crop rotations.
1.2. Distribution and spread of maize pathogens across continents
Several diseases in the cultivation of maize are likely to have been present since the time
maize was grown in its areas of origin in Mexico, where, in addition to soil exhaustion,
abandoned milpas3 and grass invasion (Lundell 1937; Willey and Shimkin 1973; Olson 1978
cited by Brewbaker 1979), pests and diseases have been proposed as limiting factors for
maize cultivation in the Maya civilization (Brewbaker 1979). A number of these diseases
were initially confined to the origin areas of their main host plants Z. mays or Sorghum spp.
3 Land dedicated to the cultivation of maize, and occasionally other crops (Costa Rica, El Salvador, Guatemala, Honduras, Mexico, Nicaragua).

Introduction
4
and as their cultivation spread across the globe, the diseases also began to appear in other
growing areas.
Survival techniques based on the production of a large number of airborne spores which can
be dispersed across long distances are the most viable way through which pathogens can
survive across regions. Especially for biotrophic fungi, the ability to travel long distances
allows for a prolongation of their life cycle and thus find plants to infect as permanent new
hosts (Brown et al. 2002). This is the case for maize rusts, which are also believed to have
their origin on the American continent and occur in teosinte or Euchlanena mexicana, making
these their first hosts. For example, the origin of Puccinia sorghi can be traced back to the
American continent (Savile 1984) and is presently endemic in North and South America – it
was first described in Europe in 1838 (Holland) and later in 1858 in Germany (Neuhaus 1970
cited by Kreisel & Scholler 1994). Cammack (1959) also traces the initial appearance of the
southern corn rust (American corn rust) produced by Puccinia polysora to the American
continent, until it was carried to Africa in 1949 via air currents of viable uredospores. Contrary
to this, at present Physopella zeae (tropical rust) is still confined to its regions of origin in
Central America and has also spread somewhat in South America (Malaguti 2000; CYMMIT
2004; Da Costa 2007).
Another technique which has contributed to the long-distance spreading of several maize
diseases is that of the pathogen accompanying its host plant as it has been distributed
across continents. This has allowed certain pathogens to infect and survive as dormant
propagules within, among other plant material, the seed tissue or by sticking to the seed coat
(Neergaard 1969). One of the most important maize pathogens worldwide, Exserohilum
turcicum, was confirmed as a maize and sorghum seedborne pathogen (Navi et al. 1999; De
Rossi et al. 2012). This could explain its distribution from its traced origin in Mesoamerica or
Central Africa (origin of the host plant Sorghum spp.) according to molecular analyses of
populations by Borchardt et al. (1998). Several maize leaf pathogens such as Bipolaris
zeicola and Colletotrichum graminicola have been confirmed also to be seedborne (Warren
1977; Nelson 1982; Niaz & Dawar 2009). This mechanism of transmission could also explain
the arrival and distribution of the maize leaf pathogen Kabatiella zeae, which was first
described in Japan (Narita & Hiratsuka 1959), into other continents and remote areas like
New Zealand (Reifschneider & Arny 1979). Therefore, seedborne dispersion through
commercial seeds could also have contributed to the introduction of certain diseases into
Europe.

Introduction
5
1.3. Main maize leaf diseases in Central Europe
1.3.1. Turcicum leaf blight
Nomenclature
The causal agent, Exserohilum turcicum (Pass.), Leonard et Suggs (1974), teleomorph:
Setosphaeria turcica (Lutrell) Leonard et Suggs phylogenetically belongs to the Eumycota,
phylum Ascomycota, class Dothideomycetes, order Pleorosporales and family
Pleorosporaceae (Mycobank 2016). The pathogen was first described as Helminthosporium
turcicum in Italy in 1876 by Passerini. Two years later, Cooke and Ellis described the disease
in the United States (Holliday 1980). Although the sexual stage can be obtained without
difficulty in the laboratory via recombination of the mating types MAT1-1 and MAT1-2 (Chang
& Fan 1986), and both of these coexist in some regions (Abadi et al. 1993), it was not
officially reported in the field until it was discovered in 2012 in two maize fields in Thailand
(Bunkoed et al. 2014). Because the asexual stage is present in nature much more frequently
than the sexual stage (Borchardt et al. 1997; Bunkoed et al. 2014), and is therefore the main
causal agent of the disease, the asexual stage was used more frequently for descriptions.
The disease is commonly referred to as “Turcicum leaf blight” or “northern corn leaf blight”.
The latter term was first used in the 1950s in reference to corn leaf blights in the United
States. Although Turcicum leaf blight is found in most growing regions of the country and is
especially prevalent in the southern part of the Corn Belt4, it can also reach northward.
Hence, in order to distinguish it from “southern corn leaf blight” produced by Bipolaris maydis
(teleomorph Cochliobolus heterostrophus), which is especially prevalent in southern states
and does not spread as far north, the name “northern” was assigned to the disease (Robert
1953; Holliday 1980).
Distribution
Turcicum leaf blight is one of the most important diseases affecting maize growing areas in
both the northern and southern hemisphere. Prevalence and epidemics have been reported
in the majority of maize growing regions in the United States and Canada (Lipps 1997;
Tenuta and Zhu 2012; Bergstrom 2014; Wise 2015), Mexico, Ecuador, southwest Brazil,
Argentina (Casela et al. 1998; Formento 2010; De Rossi et al. 2010; Couretot 2011; Culqui-
Recalde 2015), India (Harlapur 2005), north-eastern and northern China (Wang et al. 2014),
Uganda, Kenya and Tanzania (Adipala et al. 1993; Muiru 2008; Nwanosike et al. 2015),
New Zealand and Australia (Fowler 1985; Watson & Napier 2006). In Europe, the disease is
spread across the continent, from northern Spain and the United Kingdom (González &
4 Note that while geographic depictions can differ slightly, the Corn Belt generally refers to the major corn-growing
states in the US. These are located in the Midwest and include Illinois, Iowa, Nebraska, Minnesota, Wisconsin and Indiana, among others.
Introduction
6
González Varela 2007; Mainka et al. 2012), to Latvia, Romania and the Caucasus
(Jinjikhadze 2001; Borcean et al. 2012; Treikale et al. 2014). Focusing on Central European
regions, a higher disease severity has been observed in the southern German regions of
Bavaria and the Upper Rhein Valley, Austria (LfL 2015) and the French region of West-
Bretagne (Cassini 1973; Mainka et al. 2012).
Epidemiology
E. turcicum first shows a hemibiotrophic phase, germinating to penetrate the living tissue,
invading it in the first phase of the infection and subsequently behaving as a necrotroph,
obtaining nutrients from the necrotic tissue (Walsh et al. 2008). Optimum temperatures
between 20 and 25°C and prolonged high humidity with dew periods lasting over seven
hours favour fungal sporulation, which can be distinguished by dark zones on the lesions
(Berger 1970, White 2010).
The fungus overwinters as conidia, mycelia or chlamydospores (formed from the cells of the
spores or from mycelial hyphae) in infected plant debris in several regions worldwide
(Cassini 1973; Shang 1980; Levy 1984) or in host plants such as Sorghum halepense (Levy
1984) giving rise to larger epidemics in fields where tillage is not a common practice. In some
maize regions, e.g. Argentina, spontaneous maize plants (resistant to herbicides) that grow
across rotations can also be an important source of inoculum (personal observation). In the
first few months of the maize season, high humidity and adequate temperatures favour the
initial sporulation in debris in the field. These spores then give rise to first infections.
Thereafter, further sporulation will occur in the lesions and wind currents are the predominant
force through which the spores are transported across fields, subsequently serving as
inoculum for new infections (Berger 1970). The pathogen can also attack grasses such as
Sorghum spp. (S. halepense, S. bicolour L.), Echinochloa (Echinochloa-cruss-galli) and
teosinte (Zea mays spp. mexicana) (Bunker and Mathur 2006).
1.3.2. Kabatiella eyespot
Revision in the categorisation of the fungus
The causal organism of eyespot disease, Kabatiella zeae, belongs to the genus Kabatiella
described by Bubák and Kabát in 1907. With the first morphological observations of the
pathogen in 1956 by Narita and Hiratsuka, it was classified within the Kabatiella Bubák
species. Later, due to the similar in vitro behaviour of Kabatiella and Aureobasidium species
and until new studies provided more information, Dingley (1973) considered including all the
species in a single genus, namely Aureobasidium, belonging to the “black yeasts” fungi
group. Fungi in this group have common morphological characteristics such as melanised
cell walls, conidiophore-like structures and conidia enclosed in a polymeric matrix. However,

Introduction
7
they may differ in terms of specialisation level, taxonomy and genetic relations (Cooke 1962;
Sterflinger 2006). Further morphological studies by Hermanides-Nijhof (1977) also
considered Kabatiella species to belong to the anamorph genus Aureobasidium after
morphological comparisons with the ubiquitous fungus A. pullulans. Recently, several
phylogenetic studies have shown the affinity of some Kabatiella species to A. pullulans,
whereas various K. zeae strains are considerably different genetically from other
Aureobasidium species (De Hoog et al. 1999, Bills et al. 2012). Furthermore, Zalar et al.
(2008) emphasised that, in addition to genetic differences in some species, morphological
distinctions such as the conidia shape (most Kabatiella species have sickle-shaped conidia,
whereas in Aureobasidium they are normally ellipsoidal) could be observed between
Kabatiella and Aureobasidium species. Nevertheless, the authors could not definitively
exclude the possibility of a common grouping of both species. The reasoning behind this is
that the studies were carried out with the saprophytic phyllosphere fungus A. pullulans, as
opposed to the pathogen itself. Consequently, the classification of both genera is not clear to
date and further studies need to be carried out (Bamadhaj et al. 2016).
Although the teleomorph has yet to be observed to date, all these studies have contributed to
the classification of the pathogen. As with other Kabatiella and related Aureobasidium
species, it is thought to be connected to teleomorph species of Discosphaerina (De Hoog et
al. 1999). Thus, according to Mycobank (2016), K. zeae is classified as follows: Kingdom
Mycota, phylum Ascomycota, class Dothideomycetes, order Dothidiales and family
Dothioraceae.
Distribution
Since its first description (Narita & Hiratsuka 1959), K. zeae has been reported in several
temperate regions worldwide, including the northern Corn Belt of the United States and the
Canadian regions of Ontario and Quebec (Arny et al. 1970; Gates & Mortimore 1969;
Munkvold & Martison 2001; Wise 2015), China (Xu et al. 2000), Argentina (Linares &
Martínez 1971; Formento 2010), and New Zealand (Dingley 1973), but also in tropical and
subtropical humid regions in Brazil (Esteves 1984; Dos Santos et al. 2007). In European
regions, despite the disease being known since the 1970s (Smiljakovic & Pencic 1971;
Schneider & Krüger 1972), in recent years it has appeared or increased in fields in Wales,
south and southwest England (Finch et al. 2014), Denmark (Jørgensen 2012), northern
Germany and the Netherlands (Kropf & Schlüter 2013, Mainka et al. 2012).
Epidemiology
Following germination of the spores and penetration of maize leaf tissue, the mycelium
grows within epidermal cells on the leaf and in intercellular spaces. In the tissue, pigmented
globose cells with thick walls will be formed in clusters or stroma-like structures. From here,

Introduction
8
conidiophores emerge through the stomata and produce conidia simultaneously (Narita &
Hiratsuka 1959; Dingley 1973; Schneider and Krüger 1972). The disease is characterized by
a short latency period ranging from seven to 10 days (Reifschneider & Arny 1980a; Munkvold
& Martinson 2001).
The pathogen survives in infected residues - mainly leaves (Arny et al. 1970; Chinchilla
1987) - but the conidia may not be able to germinate in the long-term, thus playing a minimal
role in pathogen survival (Cassini 1973; Chinchilla 1987). The formation of stromatic hyphae,
which form a thick melanised mycelium, has been shown to be the principle means through
which the pathogen survives (Chinchilla 1987). The conidia can be disseminated through air
currents (Arny et al. 1970) and splashing rain (Rapilly et al. 1975), the latter probably being
most important for secondary disease cycles in the field (Chinchilla 1987). The pathogen can
also be transmitted via seeds (Reifschneider & Arny 1979). Generally, the disease is
favoured by mild (14-17°C) and humid weather (Narita & Hiratsuka 1959; Arny et al. 1970).
Besides maize, other alternative hosts have not been reported in nature but instead via
artificial inoculations. Reifschneider and Arny (1980b) showed that other Zea spp. and
Zea mays ssp. (Zea perennis, Zea mays ssp. mexicana, among others) can also be
considered as host plants. However, the same authors could not confirm the role these
plants play in the epidemiology in the field due to the absence of K. zeae in the areas in
Mexico in which they are endemic.
Fig. 2. The two main leaf diseases and their respective causal pathogens on maize in Central Europe.
E. turcicum conidia (A) and typical symptoms on maize leaves (B). K. zeae conidia (C) and typical
symptoms on maize leaves (D). Scale bars =25 µm (40x).

Introduction
9
1.4. Maize leaf diseases of secondary importance in Central Europe
1.4.1. Common rust
Common maize rust is caused by the fungus Puccinia sorghi, which is classified in the
Phylum Basidiomycota, class Pucciniomycetes, order Pucciniales (Mycobank 2016). It was
first described by Schweinitz in 1832 (Hooker 1985), who believed it to infect sorghum.
Evidently there was some confusion as sorghum is not a host plant, i.e. in reality the
susceptible host is maize (Arthur & Bisby 1918). The disease has been reported in several
regions of the world, including a wide distribution in fields throughout North America (Hooker
1985; Pataky & Eastburn 1993; Wise 2015), Central and South America (Casela et al. 1998;
Darino et al. 2016), Asia (Dey et al. 2015), Africa (Dunhin et al. 2004) and Europe (Mercer &
Gilliland 1999; Pataky et al. 2001; Arvalis 2012).
Like other rust diseases, the obligate biotrophic pathogen produces infectious uredospores,
teliospores and basidiospores. When the plants are infected, pustules are developed on
maize leaf surfaces. In the pustules approximately 5,000 orange to brown uredospores will
be produced. These show a characteristic spherical to oval form (Hooker 1985; Jackson
2008). Due to the noticeable form and shape of the pustules, their presence is the first
indicator of the disease in maize fields. Uredinia sporulate on the upper and lower surfaces
of the leaf. P. sorghi is characterised by the production of explosive epidemics with short
latency periods of about five to ten days at temperatures of 15-25°C (Hooker 1985; Vitti et al.
1995; Pataky & Tracy 1999) and is more common at a relative humidity of at least 98%
(Hooker 1985).
Late in the season, the pustules become brown to black, indicating that the uredospores
have been replaced by teliospores, the next and non-infectious stage in the fungus cycle.
The teliospores can survive the winter (Mahindapala 1978). In spring, the two haploid
teliospores first fuse their nuclei, and the germination occurs thereafter. A basidium is formed
through meiosis, which produces basidiospores. These can infect several Oxalis spp. - in
Europe mainly O. corniculata and O. stricta – which serve as alternate hosts for the pathogen
(Zogg & Scherrer 1945; Gäumann 1959; Mahindapala 1978). From basidiospores,
spermagonia with spermatia will be formed. After fusion of spermatia with hyphae of the
opposite mating type, aecia will be formed. These produce aecidiospores which may land on
maize leaves, subsequently infecting them and completing the life cycle by producing
uredospores once again (Dunhin et al. 2004). The occurrence of the aecial infection has also
been reported in Europe (Zogg 1949). This life cycle could be absent in areas where maize is
grown continuously. Here, infections merely occur through the uredial stage, which will then
gradually be transferred from old to more recently planted maize during the year as in the
tropics (Hooker 1985). The pathogen may also survive from year to year as uredospores in

Introduction
10
maize debris (Kellermann 1906) or emanate from southern regions and be dispersed through
wind or storm currents to northern regions during the season (Hooker 1985).
1.4.2. Northern corn leaf spot
Bipolaris zeicola was first described in 1930 by Stout as Helminthosporium zeicola. Its
teleomorph, Cochliobolus carbonum (in reference to the burnt appearance of an infected
ear), was discovered by Nelson in 1959. As the anamorph stage is more frequently observed
in nature as being the main causal agent of the disease, the name Bipolaris zeicola is used
more commonly than Cochliobolus carbonum. B. zeicola belongs to the Ascomycota,
Dothideomycetes, order Pleosporales, family Pleosporaceae (Mycobank 2016).
The pathogen is the causal agent of northern corn leaf spot but can also infect other
Poaceae grasses including Sorghum spp. (Sivanesan 1987), Oryza sativa (Xiao et al. 1991),
and other plant families (Mendes et al. 1998). B. zeicola infects maize worldwide (Sivanesan
1987; Mendes et al. 1998; Canhua et al. 2014; Wise 2015). In Europe, the disease has been
reported to occur in Germany, Austria, France, Serbia and Hungary (EPPO 2016; Welz &
Geiger 1995; Stankovic et al. 2007).
The pathogen can survive as mycelium and through formation of chlamydospores in maize
debris in the field during winter (Nelson 1982). The pathogen invades the tissue intracellulary
and induces lesions, which can vary from small and round-oval to lineal in shape, and
grayish to brown in appearance, depending on the described pathogenic “races” (0 through
4) in question. In this case, the term “race” is mainly applied based on the leaf symptoms
produced, with race 1 being the only B. zeicola race which shows a different reaction when
inoculated onto a set of different maize lines (Multani et al. 1998). Epidemics caused by race
0 in the 70s can be avoided nowadays because resistance gene Hm is present in all cultivars
(White 2010). Seed transmission is also considered to be an important infection source
(Warham et al. 1997). Plant infection is favoured by moderate temperatures (18-26°C) and
dew periods (Lipps & Mills 2001).
1.4.3. Maize anthracnose
Maize anthracnose is caused by the ascomycete Colletotrichum graminicola (teleomorph
Glomerella graminicola D.J. Politis 1975), classified in the class Sordariomycetes, order
Glomerellales, family Glomerellaceae (Mycobank 2016). The disease has been reported in
various temperate, tropical and subtropical areas, but is particularly established and severe
in warm, humid conditions (Wheeler et al. 1973; Gatch & Munkvold 2002; Jackson-Ziems et
al. 2014; da Costa et al. 2014; Zhang et al. 2014; Wise 2015). It has also been observed in
Europe (Sukno et al. 2014; personal observation) but in most cases with a restricted
distribution limited to individual plants in the field.

Introduction
11
C. graminicola produces a complex disease on maize plants which can involve leaf blight, die
back, stalk rot, root rot, kernel and ear infections. The pathogen forms acervuli, which are
composed of spores embedded in a polysaccharide protein mucilaginous matrix with black
setae (appendages). The matrix protects against desiccation and supports germination and
penetration of the tissue (Nicholson & Moraes 1980). The pathogen can penetrate either
directly or indirectly through wounds. The indirect method is more efficient and in the stalk,
for example, the initial wounds are caused by insects such as the European corn borer or
other stalk rot diseases (Gatch & Munkvold 2002). On the plant surface, the spore
germinates into hyphae and develops an appresorium, which allows the pathogen to
penetrate the tissue. From the appresorium, a secondary hypha will colonise the cells, first
through a biotrophic interaction with the host, followed by a necrotrophic stage causing
infection (Wheeler et al. 1973; Venard & Vaillancourt 2007; Sukno et al. 2008; Behr et al.
2010). C. graminicola can overwinter in infected maize debris as a parasite (Vizvary &
Warren 1982, Lipps 1983) and, as recent reports have suggested, probably as microsclerotia
in the soil as well (Sukno et al. 2008).
C. graminicola is also known to infect other important crops such as wheat and oat (Dickson
1956). This could lead to the assumption that crop rotation or intercropping of these crops
with maize could lead to an increase in infections. Nevertheless, while Wheeler et al. (1973)
reported the ability of C. graminicola maize isolates to infect members of the genus Sorghum
such as Sorghum bicolor and Sorghum halepense, these same maize isolates did not infect
other cereals like wheat, oat, barley or millet. The authors also reported that isolates from
these four cereals were non-pathogenic on maize, indicating different host specificity.

Introduction
12
Fig. 3. Other causal agents of maize leaf diseases present in Central Europe. P. sorghi uredospores
(A) and initial typical brown pustules formed on maize leaves (B). B. zeicola: conidia (C) and leaf
symptoms (D). C. gramicola: conidia (E) and leaf symptoms (F) Scale bars =25 µm (40x).
1.4.4. Phoma spp. complex
In the literature, several Phoma spp., or other pathogens related to this genus, are
associated with maize, whether it be in pathogenic or saprophytic form. Here, fungal
taxonomists are still dealing with the morphological and molecular identification, and
consequent classification (Boerema et al. 2004; Aveskamp et al. 2008; Aveskamp et al.
2010). There are several reasons behind this complication. Firstly, Phoma comprises a large
number of species (more than 3,000), which are classified based on their respective host
plant and extended morphological characteristics. Secondly, these characteristics vary
greatly with regard to in vitro culture (Aveskamp et al. 2010).
A review on the most frequently found Phoma leaf pathogen in temperate regions, namely
Phoma zeae-maydis, is provided below. Comparisons with other Phoma spp. present on
maize are also summarised.
Introduction
13
Yellow leaf blight
Yellow leaf blight, produced by Phoma zeae-maydis (syn. Didymella zeae-maydis), is the
most important Phoma leaf disease described in temperate regions (Frezzi 1972; Cassini
1973; Jimenez-Diaz & Boothroyd 1979). The disease has been reported since the mid-late
sixties in Ohio and Pennsylvannia, USA (Scheifele & Nelson 1969; McFeeley 1971) and
Ontario, Canada (Gates & Martimore 1969), making it one of the most recently discovered
maize leaf diseases. Initially, the causal agent was depicted as a Phyllosticta species. A
further description of the pathogen was carried out by Arny and Nelson (1971), resulting in its
classification as Phyllosticta maydis.
In the past, Phyllosticta was designated for those species inhabiting leaves, while Phoma
was designated for those inhabiting stalks and roots until new criteria for their classification
were recently introduced (Van der Aa & Vanev 2002; Boerema et al. 2004). Through these
criteria, some Phyllosticta or Ascochyta species were reclassified in the Phoma genus
(Aveskamp et al. 2008). In accordance with this concept and as the epithet was occupied by
other Phoma spp. (Phoma zeae, Phoma zeicola, Ph. maydis), Punithalingam (1990)
reclassified the species as Phoma zeae-maydis.
De Gruyter (2002) included P. zeae-maydis in the section Macrospora, having been
introduced by Boerema (1997). Nevertheless, Aveskamp et al. (2010) excluded the
importance of the spore size as an informative and reliable characteristic, instead
accommodating this species in the Phoma section Peyronellaea (anamorphic genus) based
on its production of multicellular chlamydospores (dyctiochlamydospores) and DNA
phylogeny. The teleomorph stage was first described as Mycosphaerella zeae-maydis in
1973 by Mukunya & Boothroyd. Further molecular analyses carried out by Chen et al. (2015)
establish the teleomorphic genus of the fungus as Didimella zeae maydis in an effort to
resolve “the Phoma enigma”.
Distribution and epidemiology
Following overwintering in leaf debris, pseudothecia are considered to be the first source of
inoculum at the beginning of the season, favoured by low temperatures and darkness
(Jimenez-Diaz & Boothroyd 1979). After infection of lower leaves, the necrotic tissue
becomes a suitable substrate for the development of further pseudothecia (Jimenez-Diaz &
Boothroyd 1979). After formation of pycnidia and conidia, secondary infections develop, with
these asexual stages being favoured by light and higher temperatures (optimal temperature
24°C) (Arny & Nelson 1971; Jimenez-Diaz & Boothroyd 1979). Ascospores are carried by
wind over long distances, infecting other fields, and conidia are disseminated through water
splash in the local field (Munkunya & Boothroyd 1973; Jimenez-Diaz & Boothroyd 1979).

Introduction
14
Other Phoma spp. on maize
Many other Phoma spp. species related to Phoma zeae-maydis that produce maize leaf
diseases or live saprophytically on leaves can be found in the literature. A summary is given
in Table 1.
Tab. 1. Some Phoma spp. reported to be isolated from maize leaves or seeds
Phoma spp. Sexual stage Disease Interaction Reported from (Source)
P. maydis
P. sorghina
Phaeosphaeria
maydis
Phaeosphaeria
leaf spot
complex
Pathogenic Brazil (Casela et al. 1998);
(Do Amaral et al. 2004)
Argentina (Díaz 2011),
United States (Carson 2005)
P. zeae Stout Mycosphaerella
zeae
-- Pathogenic Czechoslovakia* (Cejp 1967 cited
by Arny & Nelson 1971)
Rumania (Scheifele & Nelson
1969)
North America (Stout 1930;
Scheifele & Nelson 1969;
McFeeley 1971; Arny & Nelson
1971)
Review: (Punithalingam 1990)
P. maydis
Fautrey
Mycosphaerella
maydis
-- Not specified Lambotte & Fautrey (1894)
North America (Stout 1930)
Review: (Punithalingam 1990)
P. pomorum -- -- Not specified Denmark (Sørensen et al. 2010)
P. subherbarum -- -- Saprophytic
seeds
Canada
(De Gruyter et al. 1993)
1.5. Epidemics and potential yield losses
Foliar diseases can have a direct influence on the amount of dry matter stored in the grain or
in the final biomass of the plant (Shah & Dillard 2006; Couretot et al. 2012). In this context,
different foliar maize fungal species have been reported to produce yield losses worldwide
when high rates of severity are reached. “Helminthosporium leaf blights” (named after
previous nomenclature) including Turcicum leaf blight, southern corn leaf blight (causal agent
Bipolaris maydis), northern corn leaf spot and gray leaf spot (causal agent Cercospora zeae-
maydis) have been reported to cause serious problems in various maize producing areas
worldwide (Lipps 1998; De Rossi et al. 2010; Señerez Arcibal 2013; Wise 2014; Mubeen et
al. 2015). Nevertheless, the southern corn leaf blight seems to be less important in northern
European regions (Jørgensen 2012), while grey leaf spot does not have a noticeable

Introduction
15
relevance in Europe, presumably due to scarce information about the disease. Conversely, in
recent years, Turcicum leaf blight has been frequently reported in many European regions.
For example, severe epidemics were noted in 2002, 2008 and 2010 in the southern German
region of Bavaria (Mainka et al. 2012; Urban 2012; Zellner 2012). Worldwide, the disease
has been reported to cause severe damage in recent years and also in several following
seasons (Wise 2013; Wise 2014; De Rossi 2015).
Regarding northern corn leaf spot, its importance in Europe is restricted to certain regions,
e.g. Lower Saxony (Bornemann 2015), and is not seen as a major concern for yield losses at
present. Worldwide, while in some maize producing countries the disease is considered to
cause significant damage only on inbreds used in hybrid seed production, with outbreaks like
in the Corn Belt in the United States (White 2010) being an exception, in other regions, e.g.
hilly and mountainous areas of China, it is considered an important limiting factor to corn
production (Liu et al. 2015).
Common rust, together with Turcicum leaf blight, is considered to be the most damaging
foliar disease in the maize fields of several regions. It produces severe epidemics which, in
some cases, can generate 100% yield losses (Jeffers & Chapman 1994).
Compared to the aforementioned diseases, severe outbreaks produced by K. zeae have so
far not been widely reported. In Europe, a severe epidemic was observed in 2011 in some
regions of Denmark and Germany (Schleswig-Holstein and Lower Saxony), where yield
losses varying from 10% to 30% were recorded, respectively (Hanhart 2012; Jørgensen
2012; Kropf & Schlüter 2013). The disease has been suggested to have a similarly
destructive potential to that of northern corn leaf spot if optimal conditions are present
(Reifschneider 1983).
A summary of the significant yield losses caused worldwide in recent years by key foliar
diseases (by natural infection) of maize present in Europe is shown in Table 2.

Introduction
16
Tab. 2. Recorded disease severities and correlated yield losses reported in recent years under natural
infection.
Maize leaf disease
(Causal pathogen)
Recorded disease severity
and/or yield losses Source
Turcicum leaf
blight
(E. turcicum)
Disease severity 10-50% depending on the variety
2008/2010
Yield losses of about 40% recorded in Argentina.
De Rossi et al.
2010
15-30% yield losses in South Africa
Cramptom 2015
33% to 62% in the humid highlands & between 4% to
35% in the dry, coastal lowlands in Tanzania
Nwanosike et al.
2015
2002 – 10-30% yield losses in Germany
Zellner 2012
2013 - approx. 3.36 million tonnes (1%);
2014 - approx. 8.9 million tonnes (2.5%) in the
United States and Ontario (Canada).
Wise 2013; 2014
Common rust
(P. sorghi) Up to 60% yield losses in India Dey et al. 2012
2000 - high severity in Indiana
Wise 2010
100% yield losses in some Mexican field trials
7.8 million hectares (34%) affected in subtropical-
through-highland maize ecologies worldwide
Jeffers & Chapman
1994.
2013 approx. 1.34 million tonnes (<1%);
2014 aprox. 2.79 million tonnes (<1%) in the United
States and Ontario (Canada).
Wise 2013; 2014
Northern corn leaf
spot
(B. zeicola)
2013- approx. 0.10 million tonnes (<1%);
2014 approx. 0.21 million tonnes (<1%) yield losses
in the United States and Ontario (Canada).
Wise 2013; 2014
Major cause of great losses in Yunnan Province
(China)
Zhang et al. 2013
Eyespot
(K. zeae)
10% at trials in Ostenfeld (Schleswig-Holstein,
Germany) (2013)
21% at trials in Ostenfeld with monoculture and non-
tillage (2011)
30% in Denmark (2011)
2013 - approx. 0.33 million tonnes (<1%);
2014 - approx. 0.36 million tonnes (<1%) in the
United States and Ontario (Canada).
Kropf & Schlüter
2013
Schlüter 2012
Hanhart 2012
Wise 2013; 2014

Introduction
17
1.6. Fungicides as control measure
In the effort to avoid yield losses, maintaining some maize leaf diseases under a certain
level, i.e. a threshold through which economical damage is avoided, can be achieved via the
use of resistant varieties (Ogliari et al. 2005; Kumar et al. 2011; Sillón 2012; Formento et al.
2014) and phytosanitary measures such as tillage practices and crop rotation (Arny et al.
1970; Levy 1984; Chinchilla 1987; Nyvall & Martison 1997; Dill-Mackey & Jones 2000;
Formento et al. 2012; Draper et al. 2009). Where these measures are not sufficient or cannot
be included as a suitable method for the management of the crop, the use of fungicides
becomes a feasible option as part of modern and efficient maize production in order to
control epidemics (Jurca Grigolli 2009; Couretot et al. 2012; Díaz et al. 2012). With regard to
the maize crop, the application is based on systemic leaf compounds, which include triazoles
as active substances from the demethylation inhibitors fungicide group (DMI) and
strobilurines from the quinone outside inhibitors group (QoI-fungicides) (FRAC 2016). These
compounds are summarised in Table 3.
Tab. 3. Classification of the main active ingredients in fungicides applied to the maize crop, according
to their mechanism of action (FRAC 2016).
Target effect on fungal pathogen
Target site and code
Group name Chemical
group Common Name
Sterol
biosynthesis in
membranes
C14-demethylase
in sterol
biosynthesis
(erg11/cyp51)
DMI fungicides
(Demethylation
inhibitors)
Triazoles
Cyproconazole
Epoxiconazole
Flusilazole
Propiconazole
Prothioconazole
Respiration
Complex III
Cytochrome bc1
(ubiquinol oxidase)
at Qo site
(cy b gene)
QoI-fungicides
(Quinone outside
inhibitors)
Methoxy-
acrylates
Azoxystrobin
Methoxy-
carbamates
Pyraclostrobin
Dihydro-
dioxazines
Fluoxastrobin
Triazoles belong to the DMI fungicides group and thus the biochemical action mechanism is
based on the inhibition of the enzyme C14-demethylase. This enzyme is responsible for the
production of ergosterol, which is a part of the fungal cell membrane (Mauler-Machnik et al.
2002). Although the germ tube will be formed, its elongation and hyphal growth will be

Introduction
18
impeded through disorders in the division and further development of the cell walls (Heitefuss
2000; Häuser-Hahn et al. 2004).
In strobilurin-based fungicides (QoI-fungicides), the mechanism of action implies the inhibition
of the electron transport at the Qo-center of the cytochrome bc1 of the complex III in the
mitochondrial membrane, interrupting the respiratory chain. Thus, several developmental
stages of the pathogen essential for the colonization of the plant such as spore germination,
germ-tube growth, penetration and mycelia growth will be either directly or indirectly
interrupted (Becker et al. 1981; Bartlett et al. 2002; Fernández-Ortuño et al. 2010).
Strobilurines show a high level of effectiveness against sporulation and spore development,
an effect which azoles do not show (Häuser-Hahn et al. 2004). Therefore, strobilurines will
usually be applied prior to infection or in early stages of the fungal life cycle (as a protective
and early curative application). Strobilurines are never applied as an individual treatment but
rather in combination with other active ingredients from other fungicide groups (Bartlett et al.
2002).
Triazoles and strobilurines are effective against a broad fungal spectrum, which includes
important species from the Ascomycetes and Basidiomycetes (Bartlett et al. 2002) such as
Helminthosporium species, K. zeae and P. sorghi in maize (Pinto 2004; Couretot et al. 2012;
Wise 2015).
In line with this, fungicide treatments for the management of maize leaf diseases are
registered as a control option in maize fields of key maize producing countries like the United
States, Argentina, Brazil and India, among others (Bradley et al. 2010; Formento 2010;
Juliatti et al. 2013; UNL Extension 2014; Kumar et al. 2014). In Europe, they are permitted in
some countries such as France, Hungary, Poland, United Kingdom, Austria, Germany and
Denmark (French Ministry of Agriculture 2015; Agrinex 2015; Minrol 2016; HSE 2016; AGES
2016; BVL 2016; SEGES 2016). In Germany, the farmer assesses the risk of disease and
makes an independent decision on the adequacy of a fungicide treatment. If the farmer
requires further advice, he can consult the responsible local extension service (Bornemann
2015; Agravis 2015). The application of fungicides in maize in Germany is only permitted
once per season (Bornemann 2015).

Introduction
19
1.7. Aim of the thesis
The primary aim of this thesis was to review the phytosanitary state of maize crops in Central
European regions, focusing on fungal leaf diseases and their epidemiology, particularly
addressing less-known or novel pathogenic species. To this end, a qualitative monitoring
was carried out in different Central European regions through the collection and subsequent
analysis of leaf samples. In regions with a higher disease pressure, the correlation between
favourable weather conditions, development of the disease and seasonal fluctuations in
inoculum was analysed for the main pathogens in order to gain more in-depth knowledge on
the dynamic of these diseases in the field. This was to be achieved by using a Burkard spore
trap in three locations. With the aim of accelerating the assessment of spore trap samples,
the possibility of a molecular biological detection of propagules of the main leaf pathogens
was investigated. In addition, the latent period of the disease was determined. Finally,
studies were conducted to provide insight into whether fungicide application is necessary and
how to determine the optimal timing of application. The suitability of fungicides for the optimal
control of the disease was the final goal of the thesis. In this regard, the effect of different
timing of application on infected leaf area and yield were analysed. Based on the relationship
between infected leaf area and yield, the possibility of establishing an economic action
threshold was investigated.

Material and Methods
20
2. Materials and Methods
2.1. Materials
Chemicals
Trisiloxan/ Emulgator (Silwet® Gold) Spiess-Urania Chemicals
Hexane Carl Roth GmbH + Co. KG Karlsruhe
Vaseline Ratiomed Megro GmbH & Co. KG, Wesel
Taq-Buffer A with MgCl2 (10x) Nippon Genetics, Dueren
dNTPs Mix (10 mM) Bioline, Luckenwalde
Proteinase K (20 mg/ml) AppliChem, Darmstadt
Ribonuclease (RNAse) (100 x 4U/mg) AppliChem, Darmstadt
Taq polymerase (5U/µl) FastGene Nippon Genetics, Dueren
Glycoblue coprecipitant (15mg/ml) Thermofisher Scientific, Dreieich
DNA Gel Loading Dye (6 X)
Midori Green Advance
Thermo Fisher Scientific, Dreieich
Nippon Genetics, Dueren
Thrichloromethane/Chloroform Carl Roth GmbH + Co. KG Karlsruhe
Isoamyl alcohol AppliChem, Darmstadt
Polyethilene glycol (PEG) 6000 AppliChem, Darmstadt
β-Mercaptoethanol Sigma-Aldrich Chemie, Steinheim
Phenol Carl Roth GmbH + Co. KG Karlsruhe
Glycerol
Carl Roth GmbH + Co. KG Karlsruhe
Buffer compounds
CTAB buffer
(Brandfass & Karlovsky 2008)
N-Cetyl-N,N,N-trimethyl-ammoniumbromid
(CTAB) (0.02 M)
Ethylenediaminetetraacetic acid disodium
(Na-EDTA) (20 mM)
Sorbitol (0.13 M)
N-Lauroylsarcosin-Sodiumsalt (0.03 M)
TRIS-HCl pH 8.0 (10 mM)
NaCl (0.8 M)
Polyvinylpyrroidon K30 1% (w/v)
Merck, Darmstadt
AppliChem, Darmstadt
Merck, Darmstadt
Merck, Darmstadt
Applichem, Darmstadt
Applichem, Darmstadt
AppliChem, Darmstadt
Material and Methods
21
DNA gel loading dye Thermofisher, Dreieich
TE buffer
(Brandfass & Karlovsky 2008)
Ethylenediaminetetraacetic acid disodium
(Na-EDTA) (100 mM, pH 8.0)
Tris (1M, pH 8.0)
AppliChem GmbH, Darmstadt
AppliChem GmbH, Darmstadt
TBE buffer
(TRIS-Borat-EDTA)
AppliChem GmbH, Darmstadt
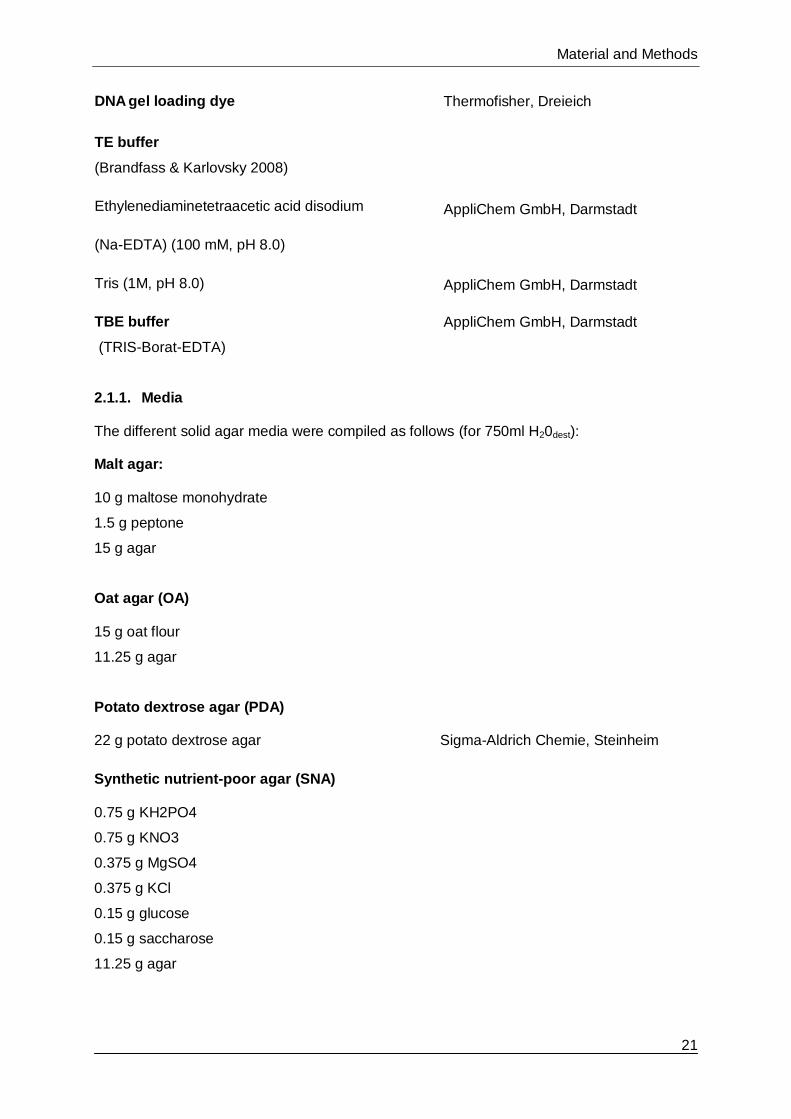
2.1.1. Media
The different solid agar media were compiled as follows (for 750ml H20dest):
Malt agar:
10 g maltose monohydrate
1.5 g peptone
15 g agar
Oat agar (OA)
15 g oat flour
11.25 g agar
Potato dextrose agar (PDA)
22 g potato dextrose agar Sigma-Aldrich Chemie, Steinheim
Synthetic nutrient-poor agar (SNA)
0.75 g KH2PO4
0.75 g KNO3
0.375 g MgSO4
0.375 g KCl
0.15 g glucose
0.15 g saccharose
11.25 g agar

Material and Methods
22
Vegetable 8 (V8)
1.5 g Ca CO3
11.25 g agar
75 ml V8 vegetable juice
Yeast malt extract agar (YE+ME)
25.2 g yeast malt extract agar Sigma-Aldrich Chemie, Steinheim
Water agar 0.8 % (WA)
6 g agar
K. zeae-liquid medium
7.5 g carboxymethylcellulose (low viscosity) Sigma-Aldrich Chemie, Steinheim
3.7 g maltose,
1.1 g peptone,
0.75 g monobasic potassium phosphate
For all the media:
Agar: Carl Roth GmbH + Co. KG, Karlsruhe.
The necessary amount of nutrient medium was autoclaved with steam at 121ºC under 2 bar
pressure for 20 min. After autoclaving, streptomycin (200 ppm) (Duchefa Biochemie,
Haarlem) was added.
2.1.2. Maize seeds
Variety Ricardinio, certified KWS GmbH, Einbeck Variety Barros, certified
KWS GmbH, Einbeck
Variety Fernandez, certified
KWS GmbH, Einbeck
Variety Kalvin, certified
Syngenta GmbH, Maintal
Variety Ronaldinio, certified
KWS GmbH, Einbeck
Variety NK Silotop, certified
Syngenta GmbH, Maintal

Material and Methods
23
2.2. Inventory and validation of fungal pathogens on maize leaves
In order to reflect the actual situation of maize leaf diseases in Central Europe and due to the
scarce information about their occurence in Central European maize fields, a qualitative
monitoring of the occurrence of potential leaf infecting species was carried out within regions
of Germany, the Netherlands, Czech Republic, Austria, France and Poland during the years
2012 and 2013. The inventory and validation is based on the prevalence of the respective
diseases and the completion of Koch´s postulates for the less known diseases to verify that
the obtained fungal organism produces the disease. To achieve this, symptomatic leaf
samples were collected and fungal organisms were isolated and analysed morphologically.
For a number of isolates, pathogenicity tests were conducted by inoculating healthy plants in
the greenhouse with spore suspensions prepared from single-spore cultures.
Koch’s postulates were followed in order to subsequently establish the relationship between
a disease and the organism it infects and comprise the following in vitro and in vivo methods.
All four of the following steps must be completed for their fulfilment:
1. The organism has to be detected in the diseased tissue.
2. It has to be isolated and grown in pure culture.
3. With the pure culture, the disease must be reproduced on the host plant.
4. The pathogen has to be recovered from the inoculated plant.
These steps were carried out one after another using the experimental setup described in the
next sections.
2.2.1. Sampling locations
Samples of infected maize leaves were collected in 2012 and 2013 from selected fields in
Germany (27 locations), the Netherlands (six locations), Czech Republic (six locations),
Austria (three locations), France (two locations) and Poland (two locations) in order to
perform a qualitative monitoring (Table 4 and Figure 4). These locations are comprised of
breeding stations, trial locations and conventional agricultural fields. Fields belong to
conventional farms, maize trial locations focused on fungicide application (Syngenta,
Landwirtschaftskammern) and breeding locations (Syngenta).

Material and Methods
24
Tab. 4. Sampled locations for the monitoring in 2012 and 2013.
Code Location Country Year Variety Purpose Organisation
North and Centre
12.14/13.14 Ommen Netherlands 2012/2013 -- Breeding Syngenta
12.15 Princepeel Netherlands 2012 -- Breeding Syngenta
12.28 Groningen Netherlands 2012 -- Breeding Syngenta
12.30 Biddinghausen Netherlands 2012 -- Breeding Syngenta
12.21 Ottersum Netherlands 2012 -- Breeding Syngenta
13.35 centre Netherlands 2013 SY Milkitop Breeding Syngenta
12.2/13.2 Ostenfeld Germany 2012/2013 Ronaldinio Trials FH Kiel
12.20/13.20 Nordholz Germany 2012/2013 -- Breeding Syngenta
12.19 Cloppenburg Germany 2012 -- Breeding Syngenta
12.23 Rade Germany 2012 Ricardinio Trial LWK SH
12.24 Beesten Germany 2012 -- Breeding Syngenta
13.40 Wessin Germany 2013 Ronaldinio Trial Syngenta
13.42 Klein Marzehns Germany 2013 Diverse Conventional --
13.43 Bodenwerder Germany 2013 Ronaldinio Conventional --
13.44 Taaken Germany 2013 Ricardinio Conventional --
12.27 Bad Oldesloe Germany 2012 Fernandes Trial Syngenta
12.11 Köhn (Plön) Germany 2012 Kalvin Trial Syngenta
12.31 Giekau Germany 2012 -- Trial Syngenta
12.13 Stapel Germany 2012 Ricardinio Trial LWK NS
12.12 Schleswig Germany 2012 Agro Yoko Conventional --
13.45 Linum Germany 2013 Ricardinio Conventional --
13.47 Waake Germany 2013 -- Conventional LWK Hessen
13.48 Göttingen Germany 2013 -- Trial Uni Göttingen
13.49 Dewitz Germany 2013 Ronaldinio Trial BioChem agrar
12.3 Liesborn Germany 2012 -- Breeding Syngenta
12.25 Milte Germany 2012 Zidane/Logo Trial LWK NRW
South
13.39 Windsbach-
Untereschenbach Germany 2013 -- Trial Syngenta
12.32 Marburg Germany 2012 -- Trial Syngenta
12.16/13.16 Mariaporsching Germany 2012/2013 -- Trial Syngenta
12.17 Mintraching Germany 2012 -- Breeding Syngenta
13.36 Mittich Germany 2013 Zidane Trial Syngenta
13.37 Hartkirchen Germany 2013 DKC4590 Trial Hetterich
13.38 Ruhstorf (Rott) Germany 2013 Ricardinio Conventional Syngenta
12.10/13.10 S. Peter am Hart Austria 2012/2013 -- Breeding Syngenta
12.18 Schönering Austria 2012 -- Breeding Syngenta
13.46 Steiermark Austria 2013 -- Trial Syngenta
East
12.26 Galowo Poland 2012 -- Breeding Syngenta
12.29 Zybiszów Poland 2012 -- Breeding Syngenta
12.4 Nechanice C. Republic 2012 -- Breeding Syngenta
12.5 Lysice C. Republic 2012 -- Breeding Syngenta
12.6 Lesany C. Republic 2012 -- Breeding Syngenta
12.7 Bylany C. Republic 2012 -- Breeding Syngenta
12.8 Caslav C. Republic 2012 -- Breeding Syngenta
12.9 Plana C. Republic 2012 -- Breeding Syngenta
West
12.22 Moorlas France 2012 -- Breeding Syngenta
12.34 Garlin France 2012 -- Breeding Syngenta

Material and Methods
25
Fig. 4. Distribution of the monitoring locations in 2012 and 2013 in Germany (27 locations), the
Netherlands (six locations), Czech Republic (six locations), Austria (three locations), France (two
locations) and Poland (two locations).
2.2.2. Isolation of fungal organisms
Two different methods were used for the recovery. This was dependent on the capacity of
the target pathogen to sporulate under artificial conditions and, consequently, the difficulty of
isolating it from the infected sample in the presence of strongly sporulating saprophytes.
a) Placement of the infected tissue on sterile filter paper or SNA.
Samples of infected maize leaves (approx. 1-2 cm in length) exhibiting lesions were
segmented and transferred into a glass beaker, where they were disinfected in a 2% sodium
chloride (NaOCl) solution for 45 s and then rinsed in sterile water for another 45 s. This last
step was repeated and finally the leaf samples were dried with absorbent sterile paper.
Following this, sterile filter paper was moistened with sterile water. This surface was used for
E. turcicum as it facilitates fungal sporulation and can be isolated directly from the leaf. An
alternative was the placement of the infected tissue on SNA medium as it provides a higher
level of humidity than filter paper and for a longer period of time. It also allows the organism
to not only sporulate on the leaf, but also facilitate its growth and sporulation on the agar
surface. This procedure was regularly used for K. zeae, B. zeicola, C. graminicola,
Phoma spp. and Fusarium spp., among others.

Material and Methods
26
b) Waring blendor technique (Arny et al. 1970, adapted from Stover & Waite 1953).
Using this method, the samples containing lesions were also segmented into small pieces
(approx. 1 cm in length), but in this case were merely washed in running water, dried with
absorbent paper, transferred to sterile water in a beaker, and blended for five min. Three
successive dilutions were performed with sterile water (1:10) and the suspensions were
plated on to SNA Petri dishes. After settling, the excess suspension layer was discarded,
leaving the dish in a slanted position for one hour to remove the excess liquid. The fungus
was isolated from the developed colonies on the agar after approximately one to two days.
This method was used in difficult cases as concerns the isolation of
K. zeae, Phoma spp. or Fusarium spp., caused by poor sporulation and growth or a high
abundance of saprophytes.
c) Isolation from seeds
A seed lot sample of the commercial variety Kalvin was received in 2012 from Ostenfeld for
examination of seedborne fungal pathogens. From the seed lot, 200 seeds were washed in
running water, disinfected in a 2% sodium chloride (NaOCl) solution for 45 s and then rinsed
in sterile water for another 45 s. Under sterile conditions on the clean bench, the seeds were
dissected into two parts and placed on water agar (1%) plates. In vitro sporulation of fungal
organisms was observed during the next nine days.
2.2.3. Preparation of single spore cultures
Single cultures were obtained for a number of isolates. This was done for several purposes,
including inoculation in the greenhouse, storage, or, as in the case of Phoma spp., further
DNA analysis. To obtain single spore cultures, two different methods were used depending
on the feasibility of separating single spores:
a) Smearing out a spore
This method consists of placing a spore on transparent and selective poor nutrient agar, SNA
or WA, using an inoculation needle. With the help of a stereo microscope, spores were
selected, laid separately and marked. After germination of the spores, these were then
transferred to a second dish on a suitable solid medium and grown under optimal conditions
(see Table 5). This method was used for organisms with relatively large and pigmented
spores such as E. turcicum, Bipolaris spp., Alternaria spp. and Epiccocum nigrum, among
others.
b) Dilution plating
In this method, spores were transferred directly from plant material or obtained colonies
through the Waring Blendor technique onto a solid medium, where, after in vitro growth of the

Material and Methods
27
colony (up to Ø 0.5 mm), 1-2 ml sterile water was added to the colony. The colony was
rinsed with water and the resulting spore suspension was plated on transparent agar (SNA)
by streaking out with a Drigalski spatula to distribute single spores. After two to three days,
the Petri dish was checked for the formation of monosporic colonies, which, if present, were
removed and allocated to an adequate medium for the respective fungi. This method was
used for relative small or hyaline spores of K. zeae, C. graminicola, Phoma spp. and
Fusarium spp.
2.2.4. In vitro cultivation
To achieve in vitro sporulation, the selected organisms for the study were cultured on
different agar media in accordance with the requirements of each fungus (Table 5).
Tab. 5. Media and conditions used for cultivating different fungi for the inventory.
Fungus Medium Temperature Light/dark h regime
E. turcicum V8 24°C Dark
K. zeae PDA/MA 24°C 12h/12 h.
B. zeicola V8 24°C UV-L or 12h/12 h.
C. graminicola PDA 18°C-20°C UV-L
Phoma spp. OA 20°C UV-L and dark*
Fusarium spp. PDA/SNA 18°C-20°C UV-L/24°C
Alternaria spp. PDA 24°C 12h/12h
Epiccocum
nigrum.
WA 24°C 12h/12h
*For morphological analyses, both were necessary for comparisons according to Boerema
et al. (2004).
2.2.5. Morphological identification of causal agents
The morphological parameters were analysed through macro and microscopy. Images were
taken using a DFC 240® microscope camera (Leica, Ernst Leitz Wetzlar GmbH). The
identification of the disease was based on leaf symptoms and on the morphological features
of the causal agent following the respective keys in Table 6.

Material and Methods
28
Tab. 6. Literature keys for the identification of frequently found fungi on maize leaves.
Target pathogen Key
E. turcicum Alcorn 1988; White 2010
B. zeicola Alcorn 1988; Stankovic 2007; White 2010
K. zeae Narita et Hirasuka 1959; Arny et al. 1970;
Schneider & Krüger 1972
Puccinia spp. Savile 1984; White 2010
C. graminicola White 2010
Phoma spp. Stout 1930; Boerema & Dorenbosch 1973;
Punithalingam 1990; Aveskamp et al. 2010;
Boerema et al. 2004; qBank Database 2012-2015
Fusarium spp. Leslie and Summerell 2006; White 2010
Other and saprophytes
(Alternaria spp., Epiccocum spp.,
Cladosporium spp. ...)
Ellis 1971; Ellis 1976; White 2010; Watanabe 2010
In contrast to other maize leaf pathogens, a precise identification of Phoma species, which
implies the recognition of several micromorphological features, was carried out. Based on
data from Boerema et al. (2004), Aveskamp et al. (2010), and related summaries from the Q-
Bank database, the following macroscopic and microscopic parameters were analysed to
obtain more accurate descriptions:
Description of the colony
In vitro growth rate (after seven days)
Colour (according to the scale of Rayner 1970)
Production and characterisation of mycelium
Microscopic observations
Shape and size of the pycnidia (by averaging the measurements of 5-10 samples)
Shape and size of the conidia (by averaging the measurements of 30 samples)
Presence of chlamydospores/ multicellular chlamydospores (dyctiochlamydospores)
Unless otherwise indicated, the analysis was carried out after incubation of the plates for two
weeks in complete darkness at 20-22°C. To guard against cases where these conditions did
not produce pycnidia, a second plate was also incubated for each isolate with a UV light
regime of 12/12 h darkness to stimulate the formation of pycnidia.

Material and Methods
29
Furthermore, six Phoma isolates from the CBS culture collection (CBS-KNAW Central
Biodiversity Center, Utrecht, the Netherlands) were compared morphologically with the
isolated specimens (see Table 7). CBS freeze-dried isolates were obtained in lyophilized
form and revived under incubation in OA medium. The selected isolates were: Ph. glomerata,
Ph. pomorum, Ph. sorghina, Ph. subherbarum (two isolates) and Ph. zeae-maydis. The
selection of these CBS isolates was based on their relation to Phoma species colonising
maize in the literature.
Tab. 7. Isolates of Phoma species obtained from the CBS (Central Biodiversity Center, Utrecht, the
Netherlands) for morphological comparisons with the isolated Phoma specimens in the monitoring.
Phoma spp. (syn.) CBS Number Origin Selected after
Ph. glomerata
(Didymella glomerata) 528.66 Netherlands Payak et al. 1987
Ph. pomorum
(Didymella pomorum) 838.84 Germany
Sørensen et al. 2010
Ph. sorghina
(Epiccocum sorghinum) 180.80 South Africa Do Amaral et al. 2004
Ph. subherbarum
(Didymella subherbarum) 250.49 Peru De Gruyter et al. 1993
Ph. subherbarum
(Didymella subherbarum) 249.49 Peru De Gruyter et al. 1993
Ph. zeae-maydis
(Didymella maydis) 588.69 USA, Wisconsin Arny & Nelson 1971
2.2.6. Molecular identification of Phoma spp.
Due to the limitations of identification based on morphological characters, further molecular
analysis were carried out for nine isolates (12.18; 12.20; 13.2P, 13.2C, 13.2B; 12.13; 12.19;
12.36; 12.37).
2.2.6.1. Obtaining of DNA from pure cultures
Pure cultures of the different fungi were grown on suitable solid medium at 24°C for 2 weeks.
Liquid cultures were inoculated with a single mycelial plug (diameter approx. 0.5 cm) in 30 ml
of Czapek-DOX (34 g/l) in 100 ml Erlenmeyer flasks. Cultures were incubated on a shaker at
20-22°C and 100 rpm for 14 to 21 days. After this period, the culture was harvested by
filtration through a Büchner funnel with filter paper and using a water-jet pump. To prevent
cross contamination, the funnel was disinfected between samples with 70% ethanol. The
mycelium was washed with autoclaved water, freeze-dried for 48 h and stored in Falcon
tubes with Parafilm at -20°C until DNA extraction was carried out.
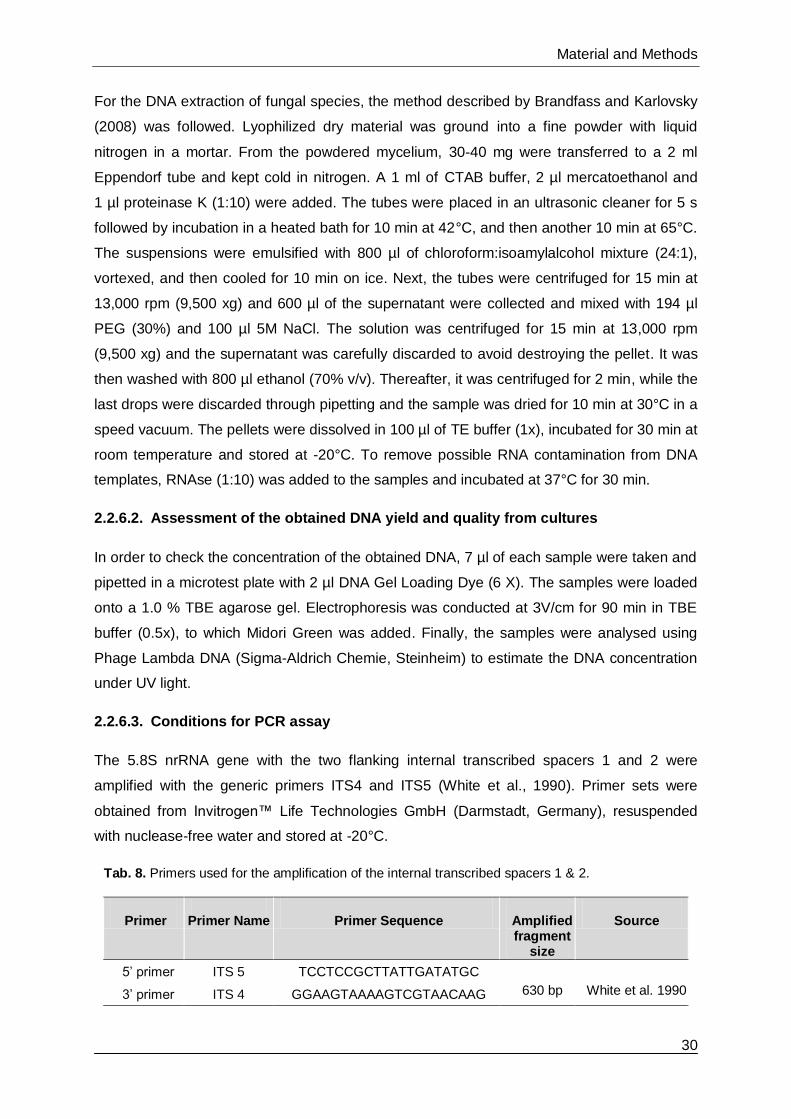
Material and Methods
30
For the DNA extraction of fungal species, the method described by Brandfass and Karlovsky
(2008) was followed. Lyophilized dry material was ground into a fine powder with liquid
nitrogen in a mortar. From the powdered mycelium, 30-40 mg were transferred to a 2 ml
Eppendorf tube and kept cold in nitrogen. A 1 ml of CTAB buffer, 2 µl mercatoethanol and
1 µl proteinase K (1:10) were added. The tubes were placed in an ultrasonic cleaner for 5 s
followed by incubation in a heated bath for 10 min at 42°C, and then another 10 min at 65°C.
The suspensions were emulsified with 800 µl of chloroform:isoamylalcohol mixture (24:1),
vortexed, and then cooled for 10 min on ice. Next, the tubes were centrifuged for 15 min at
13,000 rpm (9,500 xg) and 600 µl of the supernatant were collected and mixed with 194 µl
PEG (30%) and 100 µl 5M NaCl. The solution was centrifuged for 15 min at 13,000 rpm
(9,500 xg) and the supernatant was carefully discarded to avoid destroying the pellet. It was
then washed with 800 µl ethanol (70% v/v). Thereafter, it was centrifuged for 2 min, while the
last drops were discarded through pipetting and the sample was dried for 10 min at 30°C in a
speed vacuum. The pellets were dissolved in 100 µl of TE buffer (1x), incubated for 30 min at
room temperature and stored at -20°C. To remove possible RNA contamination from DNA
templates, RNAse (1:10) was added to the samples and incubated at 37°C for 30 min.
2.2.6.2. Assessment of the obtained DNA yield and quality from cultures
In order to check the concentration of the obtained DNA, 7 µl of each sample were taken and
pipetted in a microtest plate with 2 µl DNA Gel Loading Dye (6 X). The samples were loaded
onto a 1.0 % TBE agarose gel. Electrophoresis was conducted at 3V/cm for 90 min in TBE
buffer (0.5x), to which Midori Green was added. Finally, the samples were analysed using
Phage Lambda DNA (Sigma-Aldrich Chemie, Steinheim) to estimate the DNA concentration
under UV light.
2.2.6.3. Conditions for PCR assay
The 5.8S nrRNA gene with the two flanking internal transcribed spacers 1 and 2 were
amplified with the generic primers ITS4 and ITS5 (White et al., 1990). Primer sets were
obtained from Invitrogen™ Life Technologies GmbH (Darmstadt, Germany), resuspended
with nuclease-free water and stored at -20°C.
Tab. 8. Primers used for the amplification of the internal transcribed spacers 1 & 2.
Primer Primer Name Primer Sequence Amplified fragment
size
Source
5’ primer ITS 5 TCCTCCGCTTATTGATATGC
630 bp White et al. 1990 3’ primer ITS 4 GGAAGTAAAAGTCGTAACAAG

Material and Methods
31
Standard PCR amplification reactions (final volume of 25 µm) were performed containing
nuclease-free water, 1 X Taq Buffer (contains a final MgCl2 concentration of 1.5 mM), 0.2
mM of dNTPs, 1 µM of each primer, 2.5 units of Taq DNA Polymerase and 10 ng of template
DNA. Gradient PCR reactions were performed on TProfessional basic Gradient
Thermocycler (Biometra, Germany). To establish the melting temperature (Tm) of the specific
primers, a range of temperatures above and below the calculated Tm (55-65°C) were tested
simultaneously in a preliminary analysis for two isolates (12.10 & 12.18). The final selected
assay conditions are shown in Table 9.
Tab. 9. Universal PCR cycling assay for generic primer set ITS4 and ITS5.
Step Temperature Time Repetitions
Initialisation 94°C 5 min
Denaturation 94°C 1 min
Annealing 61°C 1 min
Elongation 72°C 1 min
Final extension 72°C 10 min
To avoid undesired proteins and inhibitors, PCR products were purified with the “QIAquick
PCR Purification Kit” (Qiagen GmbH, Hilden, Germany) according to the instructions
provided. Finally, the purified DNA was quantified through electrophoresis as described
above.
2.2.6.4. DNA sequencing and analysis
DNA samples were sent for sequencing (Eurofins MWG operon, Ebersberg, Germany). The
forward and reverse strands were sequenced with the same primers used in the PCR
amplification (ITS 4 & ITS 5). The sequences obtained were analysed using the basic local
alignment search tool (BLAST) of the National Center for Biotechnology Information (NCBI)
Database5. Comparisons were carried out with those sequences registered with accession
numbers of the Central Biodiversity Center (CBS-KNAW, Utrecht, the Netherlands).
2.2.6.5. Identification by the Fungal Biodiversity Center (CBS-KNAW)
For most of the Phoma isolates, DNA sequencing of the 5.8S nrRNA gene with the two
flanking internal transcribed spacers 1 and 2 resulted in several species. In these cases, a
concrete determination of the species was not possible for all isolates. Therefore, three
representative isolates collected in 2012 and 2013 were sent to the CBS-KNAW for further
identification. The procedure was based on the generation of the internal transcribed spacer
1 and 2 regions and partial sequences of the actin and translation elongation factor 1α gene,
and a further comparison with CBS sequence databases.
5 Database can be found here: http://blast.ncbi.nlm.nih.gov/Blast.cgi
x 36

Material and Methods
32
2.2.7. Preservation techniques for fungal organisms
The conservation of the isolated fungal species should not only guarantee survival, but also
virulence and capacity to produce a large amount of spores. These are necessary
parameters for further in vitro and in vivo studies. Freshly grown fungal colonies (1-2 weeks
old) were used. Different methods from the literature were selected, adapted for each
different genus, and are explained in this section. In some cases, more than one method had
to be used when the inefficacy of certain methods was discovered as work progressed,
obligating a change of preservation method (section 4.1.3, Discussion). Parallel to the
methods described here, representative isolates were dispensed in storage vials, prepared
through freeze-drying (lyophilisation) and deposited for long-term preservation at 4°C at the
Division of Plant Pathology and Plant Protection of the University of Göttingen.
a) Preservation with water and glycerol (25%)
Autoclaved water and glycerol (75:25) was added to the colony of the fungus grown on solid
agar and the colony was crushed with a sterile glass rod. In order to remove remains of
mycelia, the suspension was poured onto a sterile cheese cloth inserted into a funnel, which
was inside a 50 ml tube. 1 ml of the spore suspension was pipetted in 1.5 µl Eppendorf tubes
and stored at -20°C. This method was used for Phoma spp.
b) Preservation in silica gel granules with skim milk solution (in accordance with Perkins
1962; Vaillancourt Laboratory 1995 modified from Tuite & Lutrell 1969)
Due to non-survival or a low survival rate of K. zeae, B. zeicola and C. graminicola spores
after storage with autoclaved water and glycerol (25%), this second method was used. Given
the absence of moisture, the use of a solid medium like silica gel granules prevents all fungal
growth and metabolism. Silica gel granules (1-2.3 mm; 10-18 mesh without indicator) were
sterilised by heating for two hours in a drying oven at 160°C and cooled to 4°C thereafter.
Screw cap tubes of 10 ml were filled with approx. 4 g of the sterile silica gel granules. A 7.5%
(v:v) solution of dry powdered skim milk was prepared with autoclaved water, autoclaved and
cooled to 4°C. 30 min before use, as well as during usage, the tubes with silica granules
were placed in an ice bath. Freshly produced spores were collected by following the same
procedure used for the prior method (water + glycerol), but on this occasion the culture was
washed with the prepared 7.5% skim milk suspension. From the obtained skim milk spore
suspension, 250 µl were pipetted into the silica granules and the mixture was placed
immediately onto a vortex mixer adding another 250 µl of skim milk. The caps were sealed
with Parafilm, left in an ice bath for approx. 30 min, and stored at 4°C. To check viability, a
few silica granules from selected isolates were sprinkled onto a suitable agar medium after

Material and Methods
33
two weeks. This sprinkling process was repeated regularly thereafter to check for viability of
the spores.
c) Storage on sterile filter paper (adapted from Formento 2015, pers. comm., 23
February)
Parallel to the silica gel method, an alternative method was used because some K. zeae and
B. zeicola isolates could not be obtained from the silica gel granules after several months
and sprinkles. Following the method of Formento (2015) for some fungal pathogens on
maize leaves, initially autoclaved filter papers were placed directly on medium next to a
growing fungal colony until they were overgrown by the mycelium of the respective fungi.
Due to the fact that pieces of mycelium are also stored through this procedure, a second
variant was also used. In this case, the filter papers were placed into 1.5 ml Eppendorf tubes
(6 filter papers/tube) and autoclaved. Freshly produced spores were collected through
suspension of the colony in autoclaved water and crushing it with a glass rod. In order to
remove remains of mycelia, the suspension was poured onto a sterile cheese cloth inserted
into a funnel, which was inside a 50 ml tube. From the obtained spore suspension in the
tube, 50 µl were pipetted into the filter papers, vortexed, dried and stored at -20°C. Due to
the capability of storing spores for a long period of time, enhanced accuracy, low material
costs and a less time-consuming procedure, this method was also practical for common
saprophytes like Alternaria spp. and E. nigrum.
2.2.8. Production of inoculum
Spores of the various fungal species served as inoculum for greenhouse experiments.
Bipolaris spp., C. graminicola, Phoma spp., Fusarium spp., Alternaria spp. and E. nigrum
isolates were grown on suitable solid medium and under optimal conditions (Table 5). The
mycelium was suspended in a water solution with the surfactant agent Silwet® Gold
(0.0125%), which facilitated moistening and spreading of the spore solution onto the leaf by
reducing the surface tension. After crushing the mycelium with a glass rod, freshly produced
spore suspensions were collected and in order to remove remains of mycelia, the
suspension was poured onto a sterile cheese cloth inserted into a funnel, which was inside a
50 ml tube.
Spores were counted under the microscope (20x- 40x magnification) with a Thoma-counting
hemacytometer for Phoma spp., and a Fuchs-Rosenthal hemacytometer for all other fungal
organisms. Spore suspensions were adjusted to the final spore concentration shown in
Tables 10-11 (section 2.2.9) depending on the organism and isolate.

Material and Methods
34
Production of inoculum for K. zeae
Due to the slow growth of some K. zeae isolates and its limited ability to produce spores on
agar, a liquid medium known as K. zeae medium (Reifschneider and Arny 1979) was used
first. Flasks (1 L) were filled with 500 ml of the K. zeae liquid medium and each flask was
inoculated with four-day-old colony plugs and placed on the shaker at 100 rpm for seven to
10 days at room temperature (approx. 18-20°C). Spore suspensions were then calculated
and adjusted by adding water to achieve the required densities (Reifschneider and Arny
1979).
Due to the dissimilarity between isolates to produce spores, a modification of this method
with an improved step provided by Algermissen (2014, pers. comm., 24 March) was used for
the production of large and uniform amounts of K. zeae spores. Here, one agar colony plug
was inoculated into 30 ml of Kabatiella zeae liquid medium described by Reifschneider and
Arny (1979) and incubated for four days. From here, 400 µl of the liquid medium were
pipetted onto malt agar plates, evenly distributed with a Drigalski spatula, and incubated at
24°C. After four days, a high amount of K. zeae colonies with masses of spores had already
formed in the plates. The Petri dish was suspended in a water solution with the surfactant
agent Silwet Gold (0.0125%). After crushing the mycelium with a glass rod, freshly produced
spore suspensions were collected and, in order to remove remains of mycelia, the
suspension was poured onto a sterile cheese cloth inserted into a funnel, which was inside a
50 ml tube.
2.2.9. Evaluation of pathogenicity in the greenhouse
Pathogenicity tests were carried out in the greenhouses of the Division of Plant Pathology
and Plant Protection of the Georg-August-University Göttingen. The orientation of the
greenhouses is north-south and the benches inside have an east-west orientation. The
greenhouses consist of side and roof ventilation systems and can be ventilated and heated
automatically. The day/night light regime (14/10h) was automatically controlled in the
greenhouse in winter through sodium vapour lamps (Philips SON-T Plus 400 watt 20 klx).
For a number of isolates of less known diseases in Central Europe, namely K. zeae,
B. zeicola, C. graminicola, Phoma species, Fusarium spp., Alternaria spp., and E. nigrum
(see Tables 10-11), pathogenicity tests were conducted by inoculating healthy plants with
spore suspensions prepared from single-spore cultures in order to fulfil Koch’s postulates.
Maize varieties Ricardinio and Barros were selected because they show a reasonable level
of susceptibility to some maize leaf diseases. This is based on personal observations from
field visits made during the monitoring. In the greenhouse, plants were sown (one seed/pot)

Material and Methods
35
in pots (11x11 cm) containing a mixture made up of one part of sand, one part of compost
and one part of standard substrate with pea and clay (Einheitserdewerke Werkverband e.V.,
Sinntal-Altengronau). The mixture was then covered with a small layer of sand. As nutrient
fertiliser, Hakaphos® (15% N, 15% K2O, 11% P2O, 1% MgO) was applied at a concentration
of 4 g/l.
Maize seedlings were inoculated with spore solutions using a pump sprayer once the fifth or
sixth leaf had unfolded (5th-6th leaf stage). This was usually four to five weeks after sowing.
The control was inoculated with water and the surfactant agent (Silwet Gold 0.0125%). Each
fungal isolate treatment consisted of three replications for every maize variety. The
replications were fully randomised and placed in a humidity chamber, maintaining a high
level of humidity and moisture by spraying the chamber and the leaves with water. After
three days, the plants were removed and placed on greenhouse benches.
Due to the extended range of Phoma species and current lack of knowledge about them, a
second pathogenicity test was conducted. Plants were incubated in a climate chamber at a
controlled temperature and relative humidity of 20°C and 90%, respectively.

Material and Methods
36
Tab. 10. Isolates of different fungi tested for pathogenicity in the greenhouse and
concentrations (spores/ml) used.
Organism Isolate Location Spores/ml
K. zeae 12.10 Braunau am Inn 5x10⁵
12.11 Köhn (Plön) 5x10⁵
12.13 Stapel 1x10⁵
12.14 Ommen 50x103
12.17 Mintraching 25x103
12.24 Beesten 5x10⁵
12.28 Groningen 2x10⁵-5x10
5
12.30 Biddinghausen 3x10⁵
12.31 Giekau 3x10⁵
Bipolaris spp. 12.2S Ostenfeld 1x10⁶
12.7 Bylany 1x10⁶
12.8 Caslav 1x10⁶
12.9 Plana 1x10⁶
12.18 Schönering 1x10⁶
12.20 Nordholz 1x10⁶
12.27 Bad Oldesloe 1x10⁶
C. graminicola 12.15 Princepeel 1x10⁶
12.22 Moorlas 1x10⁶
Phoma spp. 12.2 Ostenfeld 3.8x10⁶-1x10
7
13.2d Ostenfeld 1x10⁷
13.2b Ostenfeld 1x10⁷
13.2.1 Ostenfeld 1x10⁷
13.2P Ostenfeld 1x10⁷
13.2B Ostenfeld 1.1x10⁶-4.5x10
6
13.2C Ostenfeld 1x10⁷
13.2.1 Ostenfeld 1x10⁷
12.10 Braunau 1x10⁷
12.12 Schleswig 1x10⁷
12.13 Stapel 1x10⁷
12.18 Schönering 5x10⁶-1x10
7
12.19 Cloppenburg 1x10⁷
12.20 Nordholz 1x10⁷
12.23 Rade 1x10⁷
12.23.2 Rade 2x10⁶-4x10
6
12.27 Bad Oldesloe 1x10⁷
12.28 Groningen 1x10⁷
12.31 Giekau 1x10⁷
13.20 Nordholz 1x10⁷
13.36 Mittich 1x10⁷
13.37 Hartkirchen 1x10⁷
13.47 Kassel 1x10⁷
13.48 Kassel 1x10⁷
14.51 Offenburg* 65x104-2.5x10
6
Phoma spp. CBS Ph. Glomerata 528.66 1x10⁷
Ph. Pomorum 838.84 1x10⁷
Ph. Sorghina 180.80 6x10⁴-7x10
4
Ph. Subherbarum 249.92 1x10⁷
Ph. Subherbarum 250.92 1x10⁷
Ph. zeae-maydis 588.69 17x104-75x10
4
Alternaria spp. 14.50* Inzing 5x10⁴
14.51* Offenburg* 1x10⁴
Epiccocum spp. 14.51* Offenburg* 2x10⁴-6x10
4
* Received sample from 2014 not belonging to the monitoring of 2012/2013

Material and Methods
37
Tab. 11. Isolates of Fusarium spp. tested for pathogenicity in the greenhouse and concentrations
(spores/ml) used.
Organism Isolate Location Spores/ml
Fusarium spp. 12.2S Ostenfeld 1x10⁶
13.2 Ostenfeld 1x10⁶
12.8 Caslav 1x10⁷
12.10 Braunau 1x10⁶-1x10
7
12.12 Schleswig 1x10⁶
12.13 Stapel 105
12.14 Ommen 8.5x10⁵
12.19 Cloppenburg 8.5x10⁵
12.23 Rade 1x10⁶
12.27 Bad Oldesloe 1x10⁶
12.30 Biddinghuizen 1x10⁶
12.31 Giekau 1x10⁶
The evaluation of pathogenicity of the isolates on maize was carried out 14 days after
inoculation, on the fourth, fifth and sixth unfolded leaves (BBCH 15-16). The visual scale
used was adapted for each pathogen depending on the development of the lesions (Tables
12 & 13).
Tab. 12. Disease rating scale adapted for maize seedling plants inoculated with B. zeicola,
C. graminicola and K. zeae.
Grade Pathogen Symptoms Reaction
0 B. zeicola, C. graminicola, K. zeae
No symptoms were observed --
1 B. zeicola, C. graminicola, K. zeae
Slight chlorosis <5% of the leaf area Slight
2 B. zeicola, C. graminicola, K. zeae
Chlorosis spreading >5% leaf area Moderate
3 B. zeicola, C. graminicola K. zeae
Chlorosis develops to dark spots/ necrosis Chlorosis develops a central brown ring
Moderate
4 B. zeicola, C. graminicola K. zeae
Chlorosis expansion with dark spots/necrosis Chlorosis/ brown rings develop in patches
Moderate
5-6 B. zeicola, C. graminicola K.zeae
Necrosis/ dark spots prevail Necrotic lesions coalesce Leaf begins with senescence
Moderate- Severe
7-8 B. zeicola, C. graminicola K.zeae
Leaf begins with senescence Leaf senescence
Severe
8-9 B. zeicola, C. graminicola K.zeae
Leaf has died Severe
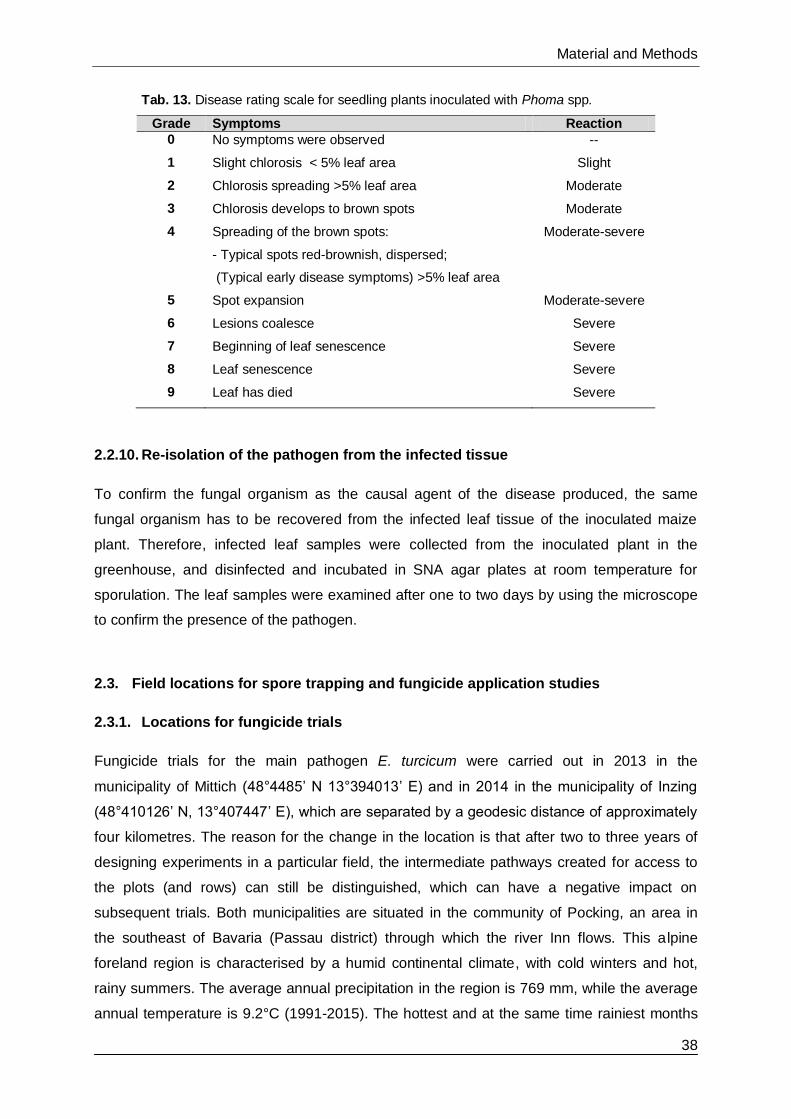
Material and Methods
38
Tab. 13. Disease rating scale for seedling plants inoculated with Phoma spp.
Grade Symptoms Reaction
0 No symptoms were observed --
1 Slight chlorosis < 5% leaf area Slight
2 Chlorosis spreading >5% leaf area Moderate
3 Chlorosis develops to brown spots Moderate
4 Spreading of the brown spots:
- Typical spots red-brownish, dispersed;
(Typical early disease symptoms) >5% leaf area
Moderate-severe
5 Spot expansion Moderate-severe
6 Lesions coalesce Severe
7 Beginning of leaf senescence Severe
8 Leaf senescence Severe
9 Leaf has died Severe
2.2.10. Re-isolation of the pathogen from the infected tissue
To confirm the fungal organism as the causal agent of the disease produced, the same
fungal organism has to be recovered from the infected leaf tissue of the inoculated maize
plant. Therefore, infected leaf samples were collected from the inoculated plant in the
greenhouse, and disinfected and incubated in SNA agar plates at room temperature for
sporulation. The leaf samples were examined after one to two days by using the microscope
to confirm the presence of the pathogen.
2.3. Field locations for spore trapping and fungicide application studies
2.3.1. Locations for fungicide trials
Fungicide trials for the main pathogen E. turcicum were carried out in 2013 in the
municipality of Mittich (48°4485’ N 13°394013’ E) and in 2014 in the municipality of Inzing
(48°410126’ N, 13°407447’ E), which are separated by a geodesic distance of approximately
four kilometres. The reason for the change in the location is that after two to three years of
designing experiments in a particular field, the intermediate pathways created for access to
the plots (and rows) can still be distinguished, which can have a negative impact on
subsequent trials. Both municipalities are situated in the community of Pocking, an area in
the southeast of Bavaria (Passau district) through which the river Inn flows. This alpine
foreland region is characterised by a humid continental climate, with cold winters and hot,
rainy summers. The average annual precipitation in the region is 769 mm, while the average
annual temperature is 9.2°C (1991-2015). The hottest and at the same time rainiest months

Material and Methods
39
are June, July and August (average over 1981-2010 period). These conditions facilitate a
natural pressure of E. turcicum in these locations.
For the second main pathogen K. zeae, fungicide trials were conducted in 2013 and 2014 at
the Experimental Station Lindenhof (54°318843’N, 9°801423’E), which belongs to the
Department of Agricultural Sciences of the University of Applied Sciencies of Kiel. The
station is located in the municipality of Ostenfeld (district of Regensburg–Eckernförde) in the
northern region of Schleswig-Holstein. In this location, a high natural pressure of K. zeae has
been observed in recent years. The region is characterised by mild winters and temperate
summers. The average annual precipitation is 826 mm, while the average annual
temperature is 8.8°C. The hottest and rainiest month is July. The area is also prone to strong
winds. Further information about the characteristics of the locations is provided in Table 14.
Tab. 14. Soil and geographical parameters of the trials in Bavaria and Schleswig-Holstein.
Parameter Location
Mittich Inzing Ostenfeld
Soil order Clay-loam Sandy-loam Loamy-sand
Soil quality index 65 65 50
Soil type Luvisol Luvisol Luvisol
Altitude above mean sea level 319 m 309 m 14 m Nearest geodesic distance to a river
2.4 km (Inn River) 1 km (Inn River) -
7.8 km (North Sea Canal)
374 m (Rott: Inn’s secondary river)
4.5 km (Rott: Inn’s secondary river)
30.5 km (Baltic Sea)
Sowing and Field Management
The agronomical measures for field preparation and sowing were carried out according to the
practical standards relevant to each region by the personnel of the cooperating institutions
(FH Kiel in Ostenfeld (Lindenhof), and Syngenta GmbH and Hetterich field trials in Inzing and
Mittich). For each location and season, these standards are provided in detail in Table 15
and Appendix Tables A1 and A2. In order to achieve a higher pressure of the disease,
conservation tillage or maize cultivation in the previous season was preferred where
possible; if, for example, other agricultural measures were not required to reduce other
damaging factors such as the overwintering survival of the larvae of Ostrinia nubilalis in the
southern German locations of Mittich and Inzing.
The maize hybrids selected for the studies are varieties which are commonly used in the
locations and surrounding region. In the southern locations, the early-maturing grain variety
Zidane (K240) and the late-maturing variety NK Silotop (S270) were used in 2013 (Mittich)

Material and Methods
40
and 2014 (Inzing), respectively. Regarding resistance to E. turcicum, Zidane and NK Silotop
are classified as “susceptible” and “moderately resistant”, respectively (LWK NW 2012;
Hiltbrunner et al. 2015). In Ostenfeld, the silage middle early-maturing varieties Ronaldinio
(S240) and Kalvin (S200) were sown. These varieties have been observed as being
moderately susceptible to the disease in some northern fields (Schlüter 2012; personal
observation).
Tab. 15. Sowing and management in test fields.
Location Mittich (2013) Inzing (2014) Ostenfeld (2013) Ostenfeld (2014)
Maize variety
Zidane®
NK Silotop®
Ronaldinio®
SY Kalvin®
Sowing date 25.04.2013 22.04.2014 22.04.2013 16.05.2014
Seeding rate 9 seeds/m2 9 seeds/m
2 10 seeds/m
2 10 seeds/m
2
Soil preparation Conventional
tillage/ plough
Conventional
tillage/plough
Conventional
tillage/plough Minimal tillage
Soil preparation Mechanical
method
Rotary harrow Rotary harrow Rotary harrow Rotary harrow
Debris
management
debris worked
with flail mower
and grubber
debris worked with
flail mower and
grubber
Rototiller in
autumn
Grubber
Rototiller in
autumn
Grubber
Crop rotation
Maize (2010)
Maize (2011)
Winter wheat-
mustard (2012)
Maize (2013)
Maize (2010, 2011)
Winter wheat- under
sown crops (2012)
Maize (2013)
Maize (2014)
Maize
(since 2007)
Maize
(since 2007)

Material and Methods
41
2.3.2. Locations for spore trapping
Spore traps were placed in the fields of the fungicide trials in Inzing in 2014 for the detection
of E. turcicum, as well as in Lindenhof in 2013 and 2014 for K. zeae (1 spore trap/location).
In 2015, further epidemiological studies through spore traps were suspended due to the
absence of the fungal disease in Ostenfeld, while in Inzing the trial was damaged by drought.
Therefore, a third location, which forms part of the “Göttinger Miniplot Soil Warming
Experiment” (51°5578‘N, 9° 9519‘E) at the Division of Plant Pathology and Plant Protection
at the Georg-August-University Göttingen was used to analyse the development of both
diseases. This was done through artificial inoculation of maize plants as part of a related
bachelor project6. In this experiment, plants were inoculated at the end of tasseling (BBCH
59-63) and plots were covered with plastic, providing a saturated atmosphere (100% RH) to
favour the initial establishment of the pathogen in the plant.
This third location is characterised by moderately cold winters and temperate summers with
rainy periods. In the summer period, both the hottest (July - average temperature of 17°C)
and the rainiest month coincide (June - average precipitation of 81 mm)7.
Tab. 16. Soil and geographical parameters in Göttingen
(“Miniplot” experimental site).
Parameter Göttingen
Soil order Loamy- sand
Soil quality index 80
Altitude above
mean sea level 150
Nearest geodesic
distance to a river
2.6 km
(Leine)
6 “Relationship between Infection and Yield Losses for E. turcicum and K. zeae”. Bachelor thesis project Jakob
Schnackenberg. Division of Plant Pathology and Plant Protection. Georg-August-University Göttingen. Experimental trials from July to September 2015. 7 Information from Wetterstation Göttingen: http://www.wetterstation-goettingen.de/klimabericht.html

Material and Methods
42
2.4. Epidemiological studies based on spore trapping in the field
To investigate the dynamic of the main fungal foliar pathogens, epidemiological studies of
E. turcicum and K. zeae were carried out based on their air dispersal pattern. Therefore, a
Burkard 7-day spore-recording volumetric trap (Burkard Manufacturing Co. Rickmansworth,
UK) was used to monitor the airborne inoculum.
2.4.1. Trapping season
Spore samples were collected during the maize crop season in summer and at the beginning
of autumn when epidemics of K. zeae and E. turcicum occur and spores of both pathogens
are released. For K. zeae in Ostenfeld, the period under investigation lasted from 16 July to 1
October in 2013, and from 30 June to 5 October in 2014. For the examination of
E. turcicum in Inzing, samples were collected from 8 July until 6 October 2014, with the
exception of 23 September due to the malfunction of the trap. In Göttingen, samples from
both pathogens were collected from 15 July until 24 September 2015, except on 29 July and
20 August due to malfunction of the trap.
2.4.2. Air sampling and analysis via microscopy
Spore traps were placed approx. 120 m from the studied field in Inzing and approx. 10 m
from the nearest maize field in Ostenfeld. In Göttingen, due to the space restrictions in the
“Miniplot” site, the spore trap had to be situated at a distance of 5 m from the trial. The spore
trap was oriented in the direction of the prevailing winds in each location. Once set up, the
spore trap absorbs air particles (10 l min-1) at 1 m above ground level through a small orifice
with the assistance of a motor attached to the bottom of the trap. The energy for the motor
was provided by weekly battery changes. The absorbed spores are captured on a cellophane
tape, the surface of which is coated with a mixture of vaseline and hexan (40:40). The tape is
secured in a metal drum with a fixed circumference, which rotates in a 7-day cycle using a
timer. This allows for specific measurement of the day the spores were captured on the tape,
which was changed upon the completion of each 7-day cycle. The upper part of the spore
trap consists of a vane, which permits the trap, and simultaneously the orifice absorbing the
spores, to move with the wind.
The cellophane tapes were carefully removed from the drum of the spore trap each week
and divided into seven daily segments. Tapes for microscopy examination were stored at
4°C to preserve spore morphology and avoid germination or degradation. Each slide
(representing 24 hours) was mounted on microscope slides (76 x 26 mm) and the daily

Material and Methods
43
number of spores captured was examined microscopically at 20x to 40x magnification. In
order to obtain the most accurate results, the total number of conidia on the tape surface was
counted.
2.4.3. Spore release, development of the disease and weather conditions
For the correlation between Kabatiella eyespot and Turcicum leaf blight disease
development and the obtained data from the spore trap, the progression of the percentage of
infected leaf area from the non-treated control of the fungicide trials in Ostenfeld and Inzing
was compared. Rating scales and number of assessments for Inzing and Ostenfeld are
described in detail in section 2.6.2. In Göttingen, the progression of the percentage of
infected leaf area was obtained as part of the aforementioned bachelor project (section
2.3.2). In this location, due to the fast development of the diseases, four assessments were
carried out: the vegetative stage (BBCH 39), end of flowering development of the grain (69-
71), end of development of the fruit (75-79), and ripening (BBCH 87-89). Spore release data
were correlated with climatic parameters (section 2.6.4).
2.5. Coupling spore trapping with PCR and qPCR assays
After a visual count of the number of spores via microscope, the samples were extracted
from the vaseline following the procedure for air samples published by Kaczmarek et al.
(2009) for Leptosphaeria maculans (pathogen in oilseed rape) with some modifications. The
detection through real time qPCR was first adapted, optimised and finally validated for the
detection of K. zeae and E. turcicum DNA. The PCR method was used as part of the
specificity test and to check for a high amplified quantity of organic material (see section
2.5.6. and 2.5.8., respectively).
2.5.1. DNA extractions from the spore trap tape
Each daily section of the tape was cut into two parts and introduced into a 2 ml screw-
capped tube filled with lysing glass beads (300-400 mg). 500 µl of CTAB buffer, 2 µl
mercaptoethanol and 1µl proteinase K (1:10) were added to the sample tubes with the beads
and sample tapes. The mixture was prepared using the FastPrep-24 Instrument®, which
breaks the cells down through a multidirectional, continuous beating in order to obtain their
cellular content. The samples were set to six cycles of 30 s at a velocity of 6 m s-1 until most
of the spore cells lyse. This step was carried out after checking for spore remains with the
microscope. To avoid overheating of the biological material, the samples were incubated in

Material and Methods
44
ice for 30 s between repetitions. The suspension was incubated for 30 min at 70°C (mixed for
10 min each), emulsified with an equal volume of a chloroform:isomylalcohol mixture (24:1),
vortexed, and chilled for 10 min on ice. Next it was centrifuged for 15 min at 12,000 rpm
(8,050 xg) and the supernatant was collected and mixed with a double amount of absolute
ethanol (96-99% v/v) and 0.1 volume of sodium acetate (3 M, pH 5). The solution was
incubated for 1 h at -20°C centrifuged for 15 min at 13,000 rpm (9,500 xg) thereafter. The
supernatant was carefully discarded to avoid destroying the pellet, which was washed with
ice-cold ethanol (70% v/v) and 3 ul of the coprecipitant Glycoblue (1:3). It was then
centrifuged for 2 min to separate the DNA, and the last drops were discarded by pipetting
and the sample was dried for 10 min at 30°C in a speed vacuum. The pellets were dissolved
in 100 ul of 1 x TE buffer, incubated for 30 min at room temperature and stored at -20°C.
2.5.2. Specific primer sets for amplification
PCR and qPCR assays were carried out with specific primers which are derived from the
Internal Transcribed Spacer (ITS). The primer set JB 585/JB 586 for E. turcicum and JB 616/
JB 618 for K. zeae (Table 17) amplify a specific DNA target region within the target pathogen
(Beck 1997). Primer sets were obtained from Invitrogen™ Life Technologies GmbH
(Darmstadt, Germany), resuspended with nuclease-free water and stored at -20°C.
Tab. 17. Specific primer set information used for the amplification of E. turcicum and K. zeae extracts.
Fungal Organism
Primer Name
Primer Sequence Amplified fragment
size Source
E. turcicum 5’ primer
JB 586
5‘TGGCAATCAGTGCTCTGCTG3'
485bp
Beck
1997 E. turcicum 3’ primer JB 595 5‘TCCGAGGTCAAAATGTGAGAG3'
K. zeae 5’ primer
JB 616
5'TGTTGTTAAAACTACCTTGTTGC3' 455bp
Beck
1997 K.zeae 3’ primer JB 618 5' GTTTCTGTCGGCAGAAGTC3'
Additionally, due to the low number of positive amplified samples for the analysis of K. zeae
from Ostenfeld, DNA samples from this location (2013 and 2014) were checked for DNA
quality via PCR with the generic primers ITS4 and ITS5 described in section 2.2.6.3.
Therefore, unsuccessful DNA extraction could be excluded.

Material and Methods
45
2.5.3. Conditions for PCR assay
Standard PCR amplification reactions were performed as described in section 2.2.6.3. using
thermal cycling conditions shown in Table 18. These conditions were selected according to
the instructions provided. To establish the melting temperature (Tm) of the specific primers, a
range of temperatures above and below the calculated Tm (55-65°C) were tested
simultaneously in a preliminary analysis for E. turcicum and K. zeae primer sets. The
annealing temperature was finally set after testing non-target fungal organisms. This was
done in a way which reduced possible non-specific amplifications. The final selected assay
conditions are shown in Table 18. To check DNA quality with the generic primers ITS4 and
ITS5, a universal fungal PCR cycling assay established in the laboratory was used (Table
19).
Tab. 18. PCR conditions used for the amplification of DNA with the specific
primer sets JB 585/JB 586 for E. turcicum and JB 616/JB 618 for K. zeae.
Step Temperature Time Repetitions
Initialisation 94°C 5 min
Denaturation 94°C 30 s
Annealing E.turcicum/ K. zeae 64.°C/65.2°C 45 s
Elongation 72°C 45 s
Final extension 72°C 10 min
Tab. 19. Universal PCR cycling assay for generic primer set ITS4 and ITS5 used to
check DNA quality of the spore trap tape samples.
Step Temperature Time Repetitions
Initialisation 95°C 5 min
Denaturation 95°C 1 min
Annealing 57°C 1 min
Elongation 72°C 1 min
Final extension 72°C 10 min
2.5.4. Assessment of the obtained DNA yield from tapes via PCR
In order to check the amplified DNA size through PCR, 5 µl of each sample were taken and
pipetted in a microtest plate with 2 µl DNA Gel Loading Dye (6 X). The samples were loaded
onto a 1% TBE agarose gel, to which Midori Green (6 %) was added. Electrophoresis was
conducted at 3V/cm for 300 min in TBE buffer (0.5x). Finally, the samples were analysed
using a 100 bp molecular weight marker (Nippon Genetics GmbH, Dueren) to estimate the
concentration, and the DNA concentration was evaluated under UV light.
x 35
x 36

Material and Methods
46
2.5.5. Conditions for qPCR assay
Standard 10 µl qPCR amplification reactions were performed with the 2x SensiFAST SYBR®
Lo-ROX Kit (5 µl) (Bioline, Luckenwalde), nuclease free water (3.2 µl), 0.4 µM of each primer
(0.40 µl), and 10 ng of template DNA (1 µl). RT-qPCR reactions were performed on the RT-
PCR System CFX 384 TouchTM C1000 Detection System (Bio-Rad, Hercules, CA, USA)
using thermal cycling conditions, shown in Table 20.
Tab. 20. qPCR cycling protocol for specific primers JB 585/JB 586 for E. turcicum and
JB 616/JB 618 for K. zeae
Step Temperature Time Repetitions
Initialisation 95°C 2 min
Denaturation 95°C 5 sec
Annealing 68°C 25 sec
Elongation 72°C 30 sec
If the amplifications were above the established baseline threshold and the melting
temperature curve coincided with the pure E. turcicum melting temperature curve, samples
were considered as positive.
2.5.6. Primer specificity evaluation
The specificity of the selected primers was checked during the development of this method.
This is important in order to guarantee the exclusive amplification of the targeted sequence
of DNA from the respective pathogens E. turcicum and K. zeae. Thus, to evaluate the
specificity of the primers used for E. turcicum and K. zeae, pure cultures of 13 other fungi
(Table 21) were tested. These organisms were selected due to their airborne dispersal and
presence in European maize fields, as well as in surrounding field crops, or because they are
genetically related to the target species being investigated. The organisms were obtained
from the samples collected during the monitoring carried out as part of this project (section
2.2), as well as from collections of the Division of Plant Pathology and Plant Protection of the
University of Göttingen and the CBS-KNAW in Utrecht.
x 34

Material and Methods
47
Tab. 21. Target and non-target fungal organisms used for PCR specificity tests with
JB 585/JB 586 (E. turcicum) and JB 616/JB 618 (K. zeae) primer set.
Fungal organism Obtained from Id. code Medium
E. turcicum (target organism) Monitoring 13.10 V8
K. zeae (target organism) Monitoring 12.31 MA
Alternaria spp. Monitoring 13.10 PDA
Aspergillus spp. APP 0006 PDA
Bipolaris sorokiniana APP 3198 V8
Bipolaris zeicola Monitoring 13.2 V8
Botrytis cinerea APP -- --*
Cladosporium spp. Monitoring 13.10 PDA
Epicoccum nigrum Monitoring 13.10 SNA
Fusarium graminearum Monitoring 12.12 PDA
Kabatiella caulivora*** CBS-KNAW 242.64 MA
Phoma lingam APP C40 --**
Penicillium spp. APP 0282 PDA
Septoria tritici APP 0606 YE+ME
Trichoderma spp. APP 0320 OA
*Culture was obtained in frozen form from the Division of Plant Pathology and Plant Protection
of the University of Göttingen (APP). **DNA was obtained directly from the Division of Plant
Pathology and Plant Protection of the University of Göttingen (APP). ***only tested for K. zeae.
The obtention of DNA from pure cultures of the different fungi was carried out through the
method described in section 2.2.6.1. Further assessment through electrophoresis of the
obtained DNA yield and quality is described in section 2.2.6.2.
The 13 fungi species were tested by PCR under the same conditions described in section
2.5.3, but with annealing temperatures ranging from 60 to 68°C. With the selected melting
temperature (Tm) from the PCR assay, a range of temperatures above it were tested through
qPCR in order to avoid possible non-target amplifications. Parallel to the check for possible
amplifications with specific primer sets JB 585/JB 586 (E. turcicum) and JB 616/JB 618
(K. zeae), DNA samples of the 13 fungi were checked for DNA quality via PCR with the
generic primers ITS4 and ITS5 mentioned above.
The qPCR assay was performed as described in section 2.5.5 with one of the non-target
fungal organisms, namely Alternaria spp. for E.turcicum primers, and K. caulivora for K. zeae
primers. These non-target fungal organisms were selected because they both resulted in
more complications in terms of non-specific amplifications during the PCR test for specificity
at lower temperatures or at the same selected annealing temperature. Through qPCR, with
the selected primers for E. turcicum (JB 585/JB 586), dilutions of Alternaria spp. of 1, 10 and

Material and Methods
48
100 pg µl-1 were tested, while for the selected primer of K. zeae (JB 616/JB 618) the dilutions
were 10 fg, 1 and 10 pg µl-1. The final selected assay conditions are shown in Table 20
above. Unexpected signals were investigated through DNA electrophoresis.
2.5.7. Primer sensitivity evaluation
To obtain quantification standard curves and determine the limit of detection through qPCR,
a series of diluted genomic DNA standards (100 pg µl-1,10 pg µl-1, 1 pg µl-1, 100 fg µl-1, 10 fg
µl-1,) was generated from pure mycelia of E. turcicum and K. zeae using the software Multi-
Analyst (Bio-Rad, Hercules, CA, USA).
Furthermore, the qPCR assay was tested for detection of spore trap samples with artificially
inoculated spore tapes. A suspension from pure E. turcicum agar cultures and autoclaved
water was prepared. Suspension drops were pipetted onto fresh vaseline plastic tapes equal
in size to those used in the spore trap in the field. The final number of spores per tape was
then counted via microscope (1 to 330 spores per slide). DNA extraction from tape samples
and evaluation through PCR and qPCR assay were carried out as described above (sections
2.5.1 to 2.5.5).
Due to the difficulty to detect K. zeae spores on the vaseline tape via microscope, a series of
spore suspensions from pure K. zeae agar cultures was prepared. The dilution range
consisted of 1,000, 500, 250, 125, 62, 31 to 15 spores in a total pipetted volume of 10 µl per
tape. This total volume was inoculated onto the freshly prepared vaseline tapes, divided into
two drops of 5 µl. Three repetitions were done for each sample. DNA from the vaseline tape
was extracted from all samples following the procedure for DNA extraction described in
section 2.5.1.
2.5.8. Dilutions of DNA yield as template
A high quantity of organic matrix material can inhibit the amplification of DNA through qPCR
(McDewitt et al. 2007; Kaczmarek et al. 2009). Therefore, samples were first amplified
through PCR. When amplified samples with the specific primer sets for E. turcicum or
K. zeae showed prominent bands of DNA on agarose gel, the samples were diluted (1:4).

Material and Methods
49
2.6. Control of the main diseases through fungicides in the field
To evaluate fungicides as an effective method against the main leaf diseases, i.e. Turcicum
leaf blight, common rust and Kabatiella eyespot, the development of the infected leaf area
was analysed under the effect of different fungicide applications at different stages.
Kabatiella eyespot was evaluated in Ostenfeld and Turcicum leaf blight in Mittich and Inzing
in 2013 and 2014, respectively. Due to the higher pressure of P. sorghi (common rust) in
Mittich in 2013, this disease was also evaluated.
2.6.1. Treatment design and fungicide application
The experimental units were rectangular plots with four repetitions for each treatment and
fully randomised (Table 22). Due to the placement of the experiment and in order to
complete the randomised block, both the number of repetitions and blocks could vary
between four and five in Ostenfeld depending on the treatment. The individual plot
measurements were 7 m (length) x 3 m (width) for Ostenfeld, 12 m x 3 m for Mittich, and 10
m x 3 m for Inzing. Row spacing was 0.75 m in all locations.
Tab. 22. Design of experiments for the trials in 2013 and 2014
Location Year Treatments + Control Repetitions Blocks
Mittich 2013 5 4 4
Inzing 2014 6 4 4
Ostenfeld 2013 6 5 5
Ostenfeld 2014 5 3-5 3
In 2014, three further trials were planned in the location of Ostenfeld using the variety
Ronaldinio sown in April. These trials were excluded from further analysis because the leaf
area infected by K. zeae was less than 1 % at the end of the season in both the treated plots
and the untreated control. Results for the trial sown in May using the variety SY Kalvin will,
however, be presented.
As a representative example for the fungicide treatment trials in each location, the design of
the experiments in Ostenfeld and Mittich in 2013 is presented in Figure 5.

Material and Methods
50
Fig. 5. Design of the experiment in Ostenfeld (left) and Mittich (right) in 2013. Different numbers
indicate different treatments. Each row represents a single block. P= Periphery border.
Different treatments were applied at various growth stages of the plant in order to obtain
different levels of the disease, which could then be correlated with diverse yield losses. Thus,
this should provide more information about an adequate control schedule between early and
late treatments.
Parallel to the untreated control, treatments consisted of:
Propiconazole and azoxystrobin (Quilt Excel®), which is registered on the German
market for foliar application on maize against Turcicum leaf blight;
Epoxiconazole and pyraclostrobin (Opera®), which is used in Denmark to control
maize leaf diseases such as Kabatiella eyespot. In Germany, it is only applied to
cereals.
Fluopyram and prothioconazole (Propulse®) and carbendazim and flusilazole
(Harvesan®), which are registered for application to other crops like cereals (against
Septoria spp., Blumeria graminis and Puccinia spp.) and oilseed rape (against leaf
and stalk diseases such as Alternaria brassicae and Sclerotinia sclerotiorum).
In Mittich, applications were carried out at two different growth stages, BBCH 33 (vegetative)
and BBCH 65 (flowering). In 2014 in Inzing, the fungicides were applied at BBCH 51
(tasseling) and BBCH 65 (flowering). A summary of the different fungicide treatments and
timing of application in 2013 and 2014 is shown in Tables 23 and 24. Because the seeds
were additionally treated with the fungicide Aatiram® in Inzing in 2014, two controls, one
without seed treatment and another with seed treatment, were arranged to detect possible
effects of the seed treatment on the different foliar treated variants.
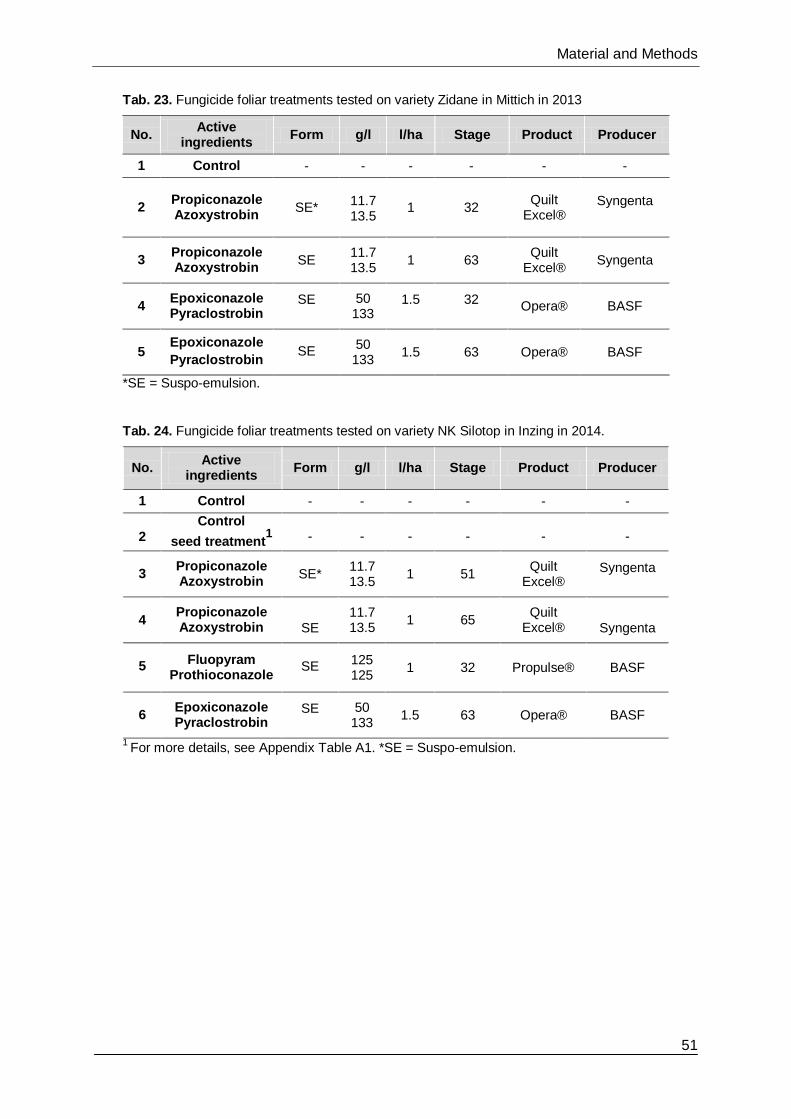
Material and Methods
51
Tab. 23. Fungicide foliar treatments tested on variety Zidane in Mittich in 2013
No. Active
ingredients Form g/l l/ha Stage Product Producer
1 Control - - - - - -
2 Propiconazole Azoxystrobin
SE*
11.7 13.5
1 32 Quilt
Excel® Syngenta
3 Propiconazole Azoxystrobin
SE 11.713.5
1 63 Quilt
Excel® Syngenta
4 Epoxiconazole Pyraclostrobin
SE 50 133
1.5 32 Opera® BASF
5 Epoxiconazole
Pyraclostrobin SE
50 133
1.5 63 Opera® BASF
*SE = Suspo-emulsion.
Tab. 24. Fungicide foliar treatments tested on variety NK Silotop in Inzing in 2014.
No. Active
ingredients Form g/l l/ha Stage Product Producer
1 Control - - - - - -
2 Control
seed treatment1
-
-
-
-
-
-
3 Propiconazole Azoxystrobin
SE* 11.7 13.5
1 51 Quilt
Excel® Syngenta
4
Propiconazole Azoxystrobin SE
11.7 13.5
1 65 Quilt
Excel® Syngenta
5
Fluopyram Prothioconazole
SE
125 125
1 32 Propulse® BASF
6 Epoxiconazole Pyraclostrobin
SE 50 133
1.5 63 Opera® BASF
1 For more details, see Appendix Table A1. *SE = Suspo-emulsion.

Material and Methods
52
In Ostenfeld, treatments were applied using a wheel sprayer with a hand-held spray boom
with flat fan nozzles (model IDK-120-025, 50 cm nozzle spacing). The application was
calibrated to a volume of 250 l/ha at 3 bars and sprayed at about 4.5 km/h (6 s/7 m long
plot).
In both Mittich and Inzing, treatments were applied using a backpack sprayer with a hand-
held spray boom with flat fan nozzles (model Airmix 110-02, 50 cm nozzle spacing). The
application was calibrated to a volume of 260 l/ha at 2.8 bars for Mittich in 2013, and 300 l/ha
at 2.5 bars for Inzing in 2014. In both cases, the spraying rate was about 4 km/h (9-11 s/10-
12 m long plot).
In Ostenfeld in 2013 and 2014, the mixture of propiconazole and azoxystrobin (Quilt Excel®)
was applied at three different crop growth stages, BBCH 33 (vegetative), BBCH 55
(appearance of the first symptoms or tasseling) and BBCH 63 (flowering). In 2013, other
treatments were applied at BBCH 55. A summary of the different fungicide treatments and
timing of application is shown in Tables 25 and 26.
Tab. 25. Fungicide foliar treatments applied to the variety Ronaldinio in Ostenfeld in 2013.
Nr Active
ingredients Form g/l l/ha Stage Product Producer
1 Control - - - - - -
2 Propiconazole Azoxystrobin
SE*
11.7 13.5
1 33 Quilt
Excel® Syngenta
3 Propiconazole Azoxystrobin
SE 11.7 13.5
1 55 Quilt Excel®
Syngenta
4 Propiconazole Azoxystrobin
SE 11.7 13.5
1 63 Quilt Excel®
Syngenta
5 Fluopyram Prothioconazole
SE 125 125
1 55 Propulse® Bayer
6 Carbendazim
Flusilazole SE
125 250
0.8 55 Harvesan® DuPont
*SE = Suspo-emulsion.

Material and Methods
53
Tab. 26. Fungicide foliar treatments applied to variety Kalvin in Ostenfeld in 2014.
Nr Active
ingredients Form g/l l/ha Stage Product Producer
1 Control -
-
-
-
-
-
2 Propiconazole Azoxystrobin
SE*
11.7 13.5
1 33 Quilt
Excel®
Syngenta
3 Propiconazole Azoxystrobin
SE 11.7 13.5
1 55 Quilt
Excel®
Syngenta
4 Propiconazole Azoxystrobin
SE 11.7 13.5
1 63 Quilt
Excel®
Syngenta
*SE = Suspo-emulsion.
2.6.2. Disease assessment
Disease severity assessments began when the infected leaf area was at least sufficient to
carry out a visual rating of the untreated control (normally at flowering, i.e. BBCH 63-65).
Further assessments were carried out when a noticeable increase in the disease severity
was observed in the plots, normally during the development of the grain (BBCH 71-73) and
at ripening (BBCH 83-87). A schematic graph showing the development of the plant in
relation to fungicide application and time of rating is exhibited in Figure 6.
Fig. 6. Schedule of fungicide application and disease ratings related to maize stages in 2013 (Mittich
and Ostenfeld) and 2014 (Inzing and Ostenfeld) trials (maize development data obtained from Hack et
al. 1992 and Dekalb 2015).

Material and Methods
54
In accordance with the EPPO Guidelines (2011), disease assessments were made on five
successive plants in the centre of each of the two central rows in each plot. Five leaves,
consisting of the main ear leaf (L0), two leaves above the main ear (L+1 & L+2), and two
below (L-1 & L-2), were given a score based on a visual rating of the percentage of infected
leaf area (0-50%). The visual rating was done following the keys from the EPPO Guidelines
(2011) for the development of Kabatiella eyespot and common rust, and from the University
of Wisconsin Extension (2011) for the development of Turcicum leaf blight (Figures 7 & 8).
Fig. 7. Diagrammatic representation for rating of percentage of infected leaf area used to evaluate
disease severity of Kabatiella eyespot and common rust based on the Ministry of Agriculture, Fisheries
and Food (GB) (1976) and the EPPO Guidelines (2011).
Fig. 8. Diagrammatic representation for rating of the percentage of infected leaf area used to evaluate
disease severity for Turcicum leaf blight based on the University of Wisconsin Extension (Esker 2010).

Material and Methods
55
2.6.3. Biomass and grain yield
As the main purpose of use of maize varieties in the region is silage and biogas production,
the amount of biomass was recorded in Ostenfeld. Harvest and preparation of the samples
were carried out by the personnel of the cooperating institution, FH Kiel. Plants from the
central row of each plot were harvested for quantitative recording of yield once a wet matter
level of 33% had been reached in the plant (specified German national standard). Plants
were dried in an oven at 105°C for two days. The total dry weight (kg/ha) of the harvested
plants (including the ears) was then recorded.
In the southern locations of Inzing and Mittich, grain yields were measured as maize used for
livestock feeding is predominant in the region. The central rows of each plot were harvested
and weighed. The harvest and preparation of the samples was completed at the facilities of
the participating companies (Syngenta GmbH and Hetterich Field Trials).
2.6.4. Correlation of disease development with weather factors
Because the development of the foliar maize diseases is reliant on specific weather factors,
the correlation of both is necessary for the characterisation of the development pattern of the
disease in the field. Therefore, in order to describe these epidemics, the daily means of
temperature (°C), relative humidity (%), precipitation (mm) and wind (m s-1) were recorded.
For Ostenfeld (Schleswig-Holstein), the weather station was situated directly in the
experimental fields. For Mittich and Inzing (southern Bavaria), the climatic parameters were
obtained from the weather station of the Bavarian State Research Centre for Agriculture
(LfL). This is situated in Bärnau (Pocking), at a geodesic distance of approx. 4 km from
Inzing and 8 km from Mittich.
2.7. Data management and statistical analysis
2.7.1. Epidemiological studies based on spore trapping in the field
The number of spores was counted through microscopy and their corresponding DNA yield
was assessed via qPCR. Given one categorical variable, the log model y= exp (a + ax),
assuming a negative binomial distribution, was used to determine the relation between
number of spores and DNA yield, as well as to make an inference about the model
parameters. To facilitate reading and interpretation, the x and y axes were flipped. Analyses
were carried out with the E. turcicum samples from sensitivity tests and samples from Mittich
2013 and Inzing 2014 because the number of spores could be assessed via microscope. For

Material and Methods
56
K. zeae, only the artificial spore trap samples were used as it was not possible to detect
spores through visual assessment (microscopy).
For the statistical analysis, the GENMOD procedure by SAS was used. Model parameters
were tested by the corresponding Pearson's chi-squared test. In all analyses, the general
level of significance was set to p<0.05.
2.7.2. Control of the main diseases through fungicides in the field
From the disease rating in the field, values were obtained for the main ear leaf (L0) and the
two leaves above (L+1 & L+2) and below the main ear (L-1 & L-2).
During leaf ripening, a distinction between senescence and pathogen damage became more
and more difficult. Consequently, the number of observed data per treatment was different.
This led to unequal sample sizes which require the use of weighted means [(least square
means (LS means)] to prevent confounding of treatment effects. For every treatment and
treatment combination the LS means were calculated by using PROC GLM or MIXED and
MINITAB.
The experiments were arranged in a completely randomised split-split block design. For the
estimation of treatment effects and the comparison of means for each experiment, an
analysis of variance (ANOVA) was conducted using GLM, MIXED and MINITAB. The same
software was used for the regression analysis. In all statistical procedures, the residual
analysis and appropriateness was examined using SAS. The sample means out of ten
observations formed the ANOVA database. For these means, the Central Limit Theorem
applies, which means no data transformation is required. To study the relation between
infected leaf area and yield adjusted for block effects, the GLM co-variance procedure was
employed. Treatment effects and the regression coefficients were tested by the
corresponding F-test and the Bonferroni multiple mean comparisons method was applied to
estimate mean differences. In all analyses, the general significance level was set to p<0.05.
For the results obtained, the general linear model used with the following components was
the most adequate assumption:

Material and Methods
57
From all factors used in the above model, only the blocks which can be seen as randomly
chosen environments are random. Treatment, leaf position and stage are fix factors since
their levels are all chosen according to the specific research questions. In a mixed model, the
GLM as MIXED procedure in SAS allows the hypothesis test about LS means and their
differences for main and joint factor effects.
Considering the fact that the treatments and severity of the diseases differed from one year
to the other, a combination of the 2013 and 2014 data was not considered reasonable for a
common analysis of variance.
3
2
1
Error
Error)()(
Error)(
terms Error
stage*position* Treatment )(
effects joint order Second
stagePosition)( and stageTreatment ), (positionTreatment ) (
effects joint order First
(random) Stages 3 δ Position, 5 γ (random), Blocks 4β ,Treatments 6
effects Main
mean General
:effects following the of composed are values ObservedY
)()()()()()()(Y
ijkl
ijkjk
ij
ikl
klilik
ijkl
ijklikljlillijkjkikkijjiijkl

Results
58
3. Results
3.1. Inventory and validation of fungal pathogens on maize leaves in Central Europe
Knowledge about the appearance and regional distribution of maize leaf diseases and their
respective pathogens is an indispensable prerequisite to achieve effective control.
During 2012 and 2013, potential leaf infecting pathogens isolated from symptomatic leaves
were identified according to different literature keys (see section 2.2.5). In the case of
P. sorghi, the characteristic symptoms or pathogenic structures on the leaf were a clear
signal of the presence of the pathogen in the field. This meant that a microscopic
examination was only required in single cases. Similarly, E. turcicum was recognisable in all
cases by the symptoms described in the literature. Typical development of the lesion was
favoured due to the absence of resistance in the observed plant varieties.
The determination of K. zeae, B. zeicola, C. graminicola and Phoma spp., in contrast, was
more difficult during the monitoring as they occasionally exhibited similar symptoms in the
initial stages of the formation of lesions on the leaf. This led to further isolation on solid media
and in vitro observation for several isolates.
Pathogenicity tests served to confirm the correlation between the isolated organisms and the
disease, and were therefore conducted for less known pathogens which induce lesions such
as K. zeae, B. zeicola, C. graminicola, Phoma spp. and Fusarium spp. Here, a series of
isolates was tested, also serving for subsequent diagnosis on the leaf. The only exception
was Phoma spp., for which all of the isolates were tested because it was necessary to carry
out pathogenicity tests in order to reveal and distinguish between pathogenic and
saprophytic Phoma species. The resulting symptoms of the disease are described in detail
below (based on in-depth visual assessment) and are compared with the symptoms
observed in the field.
3.1.1. Symptoms and morphological characterisation of E. turcicum and P. sorghi
E. turcicum
The initial symptoms are green or yellow lesions, which develop into elliptical or cigar-shaped
lesions of approximately 3-20 cm in length and fuse with time. After periods of high humidity
or moisture, dark zones of fungal sporulation can be distinguished in the lesions. However,
after long dry periods, the lesions expand without sporulation. Lower and middle leaves
generally exhibited a higher rate of infection than the upper leaves.

Results
59
Conidia are olive green to brown, 2-9 septa, spindle-shaped with a strongly protruding hylum.
Their size ranged within the parameters given by De Rossi et al. (2015) (10-20 to 30-147
µm). The conidia show mono and bipolar germination. Formation of chlamydospores and
shorter, stroma-like mycelium cells could be observed in vitro when the plates were
incubated at 4°C for several months.
Fig. 9. E. turcicum. A. Typical symptoms on maize leaves B. Extreme leaf blight without sporulation.
C. Conidia. D-E. Compacted mycelium and production of chlamydospore-like structures in mycelium
and conidia. Scale bars =25 µm (40x).
P. sorghi
Brown pustules containing orange to brown uredospores develop on the surface of maize
leaves. Due to the noticeable form and shape of the pustules, their presence was the first
indicator of the disease in the maize field. Uredinia of P. sorghi sporulate on the upper and
lower surfaces of the leaf. In the late season, the pustules become brown to black, indicating
that the uredospores have been replaced by teliospores. Uredospores are orange to brown,
with a spherical to oval form. Teliospores are smooth, oblong to ellipsoid, with two cells
detached at the septa and with a long pedicel. The disease tends to develop on the middle
and upper leaves of the plant.

Results
60
Fig. 10. P. sorghi. A. Pustules on maize leaves. B. Pustules with teliospores. C. Uredospores.
D. Teliospores (40x).
3.1.2. K. zeae, B. zeicola and C. graminicola
K. zeae
In the field, the pathogen produces circular to oval lesions (up to 4 mm), which develop a
narrow, yellow halo. Later, the halo will be surrounded by a brown, black or purple ring
inducing the form of an eye, hence the name “eyespot”. The lesions can be delimited in
patches and later fuse to form large necrotic areas. In some locations, the disease was
restricted to the upper leaves of the plant. The symptoms can also be observed in ear husks
and leaf sheaths.
After incubation of the lesions in a humidity chamber, slimy masses of spores (similar to
sporodochia) cover the lesions. In the plant tissue, dark chains of stromatic mycelium are
formed. In some cases, these colonies can be confused with the colonies of Fusarium spp.
on the leaf. In this case, an analysis via microscope is necessary to confirm the isolate in
question. Conidia are hyaline, curved to falcate with pointed ends, which later can suffer
deformations, probably due to germination of the spore. Conidia are normally non-septate,
but one or two septa could be formed. Their size varies between 1-4 and 24-33 µm (average
3 x 27 µm).
According to Reifschneider & Arny (1980a), one of the most reliable parameters for the
identification of K. zeae is its in vitro growth. Colonies show a slow-growing mycelium on malt
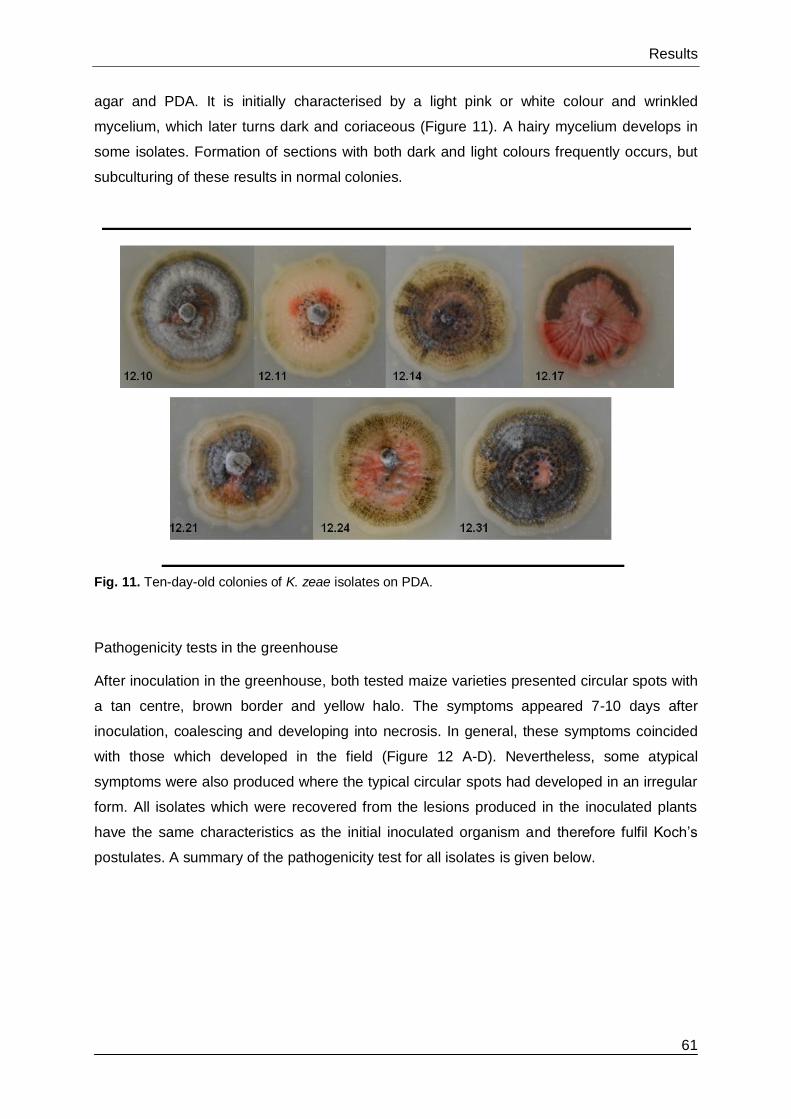
Results
61
agar and PDA. It is initially characterised by a light pink or white colour and wrinkled
mycelium, which later turns dark and coriaceous (Figure 11). A hairy mycelium develops in
some isolates. Formation of sections with both dark and light colours frequently occurs, but
subculturing of these results in normal colonies.
Fig. 11. Ten-day-old colonies of K. zeae isolates on PDA.
Pathogenicity tests in the greenhouse
After inoculation in the greenhouse, both tested maize varieties presented circular spots with
a tan centre, brown border and yellow halo. The symptoms appeared 7-10 days after
inoculation, coalescing and developing into necrosis. In general, these symptoms coincided
with those which developed in the field (Figure 12 A-D). Nevertheless, some atypical
symptoms were also produced where the typical circular spots had developed in an irregular
form. All isolates which were recovered from the lesions produced in the inoculated plants
have the same characteristics as the initial inoculated organism and therefore fulfil Koch’s
postulates. A summary of the pathogenicity test for all isolates is given below.

Results
62
Fig. 12. Eyespot disease and its causal organism K. zeae. A-D. Initial and late symptoms in the field.
E. Symptoms after artificial inoculation in the greenhouse. F-G. Conidia and disposition of the conidia
in the mycelium. H. Sporulating colonies on the lesions.
Bipolaris zeicola and Bipolaris spp.
Different types of symptoms were observed for B. zeicola in the field. The most common
consisted of brown elongated and irregular spots, which resemble the description for
B. zeicola race 2 in the literature (Figure 13 A-B). Characteristic symptoms for this race were
observed in leaves originating from Schönering (sample 12.18) and Nordholz (sample
12.20). Other observed symptoms were the production of linear, greyish lesions along the
leaf vein (Figure 13 C), indicating the presence of race 3 (sample 12.7, Bylany). B. zeicola
could also be diagnosed in commercial seeds which were planted at the Ostenfeld location
(sample 12.2S). Small necrotic lesions were observed in samples from location Bad Oldesloe
(sample 12.27), sharing the leaves with K. zeae. Two isolates of Bipolaris spp. (sample 12.8,
Caslav and sample 12.9, Planá) were isolated from oval to irregular-shaped lesions, tan in
colour and a clearly defined dark border.
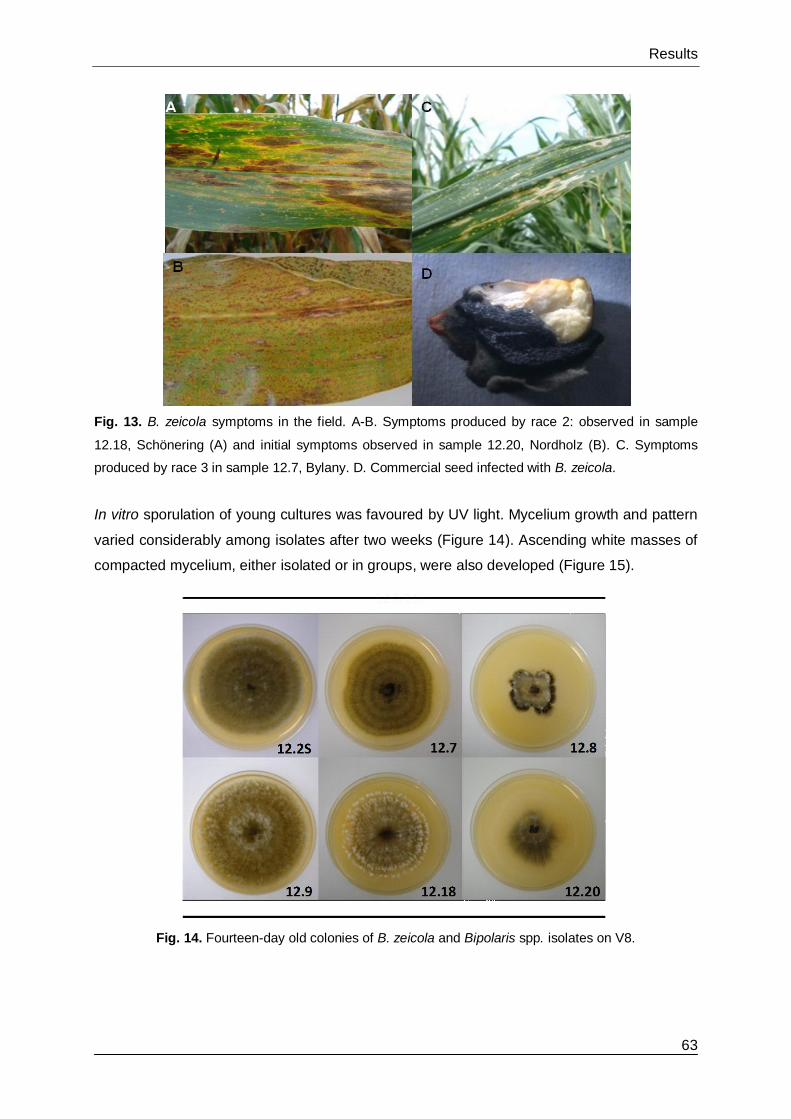
Results
63
Fig. 13. B. zeicola symptoms in the field. A-B. Symptoms produced by race 2: observed in sample
12.18, Schönering (A) and initial symptoms observed in sample 12.20, Nordholz (B). C. Symptoms
produced by race 3 in sample 12.7, Bylany. D. Commercial seed infected with B. zeicola.
In vitro sporulation of young cultures was favoured by UV light. Mycelium growth and pattern
varied considerably among isolates after two weeks (Figure 14). Ascending white masses of
compacted mycelium, either isolated or in groups, were also developed (Figure 15).
Fig. 14. Fourteen-day old colonies of B. zeicola and Bipolaris spp. isolates on V8.

Results
64
Fig. 15. Ascending white isolated masses of compacted mycelium typical from Bipolaris spp.
Conidia of B. zeicola are olive to dark brown, slightly curved, with rounded ends and septate.
The number of septa and size of the conidia oscillates within the range given by White
(2010), i.e. 7-18 x 25-100µm. Other identified Bipolaris spp. spores differ from the B. zeicola
species described, with a darker appearance when observed directly on the sample leaf and
also when cultivated in vitro. The majority of the spores of these isolates exhibit less or, in
some cases, no curvature compared to the spores of B. zeicola (Figure 16, E-F). Some
spores also exhibited flat, irregular borders. Growth in agar differs greatly between the two
isolates; isolate 12.8 shows slow growth after 14 days (2-3 cm), is dark in colour and exhibits
formation of white buffs, as is characteristic for other Bipolaris spp. Isolate 12.9, on the other
hand, exhibits fast growth on the medium, with a grey mycelium and formation of buffs,
closely mirroring colonies of B. zeicola.
Fig. 16. Conidia of B. zeicola (A-D). Isolate 12.2S (A) Isolate 12.7 (B) Isolate 12.18 (C) Isolate 12.27
(D). Conidia of Bipolaris spp. (E-F). Isolate 12.8 (E) Isolate 12.9 (F).Scale bars= 25 µm

Results
65
Pathogenicity tests in the greenhouse
Two days after inoculation, the two maize varieties tested showed symptoms for all five
B.zeicola isolates. The appearance and severity of these symptoms differed among isolates
(Figure 17). Isolate 12.7 exhibited linear and yellow-brown to greyish lesions, which are the
typical symptoms described in the literature for race 3 of B. zeicola. The symptoms were also
similar to those found in the field. Although the two varieties exhibited chlorotic symptoms
around the lesions, which are usually regarded as being characteristic of plant resistance,
this did not impede the progression of the disease, which induced premature senescence
and ultimately the death of the leaf. In fact, isolate 12.7 reached a higher level of severity
than any of the other isolates (grade 9 for the variety Ricardinio/grade 8 for Barros). Isolate
12.2S, originating from commercial seeds, produced very small lesions (0.5-2 cm) with a tan
centre and marked brown border. Its development was rather slow compared to isolate 12.7,
with the maturing of the plant occurring before further development of the disease could be
observed. Despite this, the organism was able to produce necrosis (grade 6 for the variety
Ricardinio/5 variety Barros).
The symptoms observed for isolate 12.18 were similar to those of isolate 12.2S. In both
varieties, small necrotic lesions were produced, with a subsequent fusing of the lesions
similar to that found in the field in Schönering. This even induced the beginning of a
premature senescence in the Ricardinio variety (grade 7). Isolate 12.20 produced tan spots
similar to those of the isolates above, but with the formation of lesions with pronounced
borders and spread out across the leaf. Isolate 12.27 produced necrosis with less-defined
borders than those of isolate 12.2S, 12.18 and 12.20. In contrast to the other isolates,
chlorotic halos were not produced.
Of the two varieties tested, the variety Barros exhibited a higher level of resistance than
Ricardinio for all B. zeicola isolates. For all B. zeicola isolates, the successful recovery of the
same fungal organism from the artificially inoculated and subsequently infected tissue was
achieved, completing Koch´s postulates. This confirms that the isolated fungal organism is
the causal agent of the disease.
The unidentified Bipolaris spp. isolate 12.8 produced similar initial spots (necrotic centre and
chlorotic halo) as B. zeicola isolates 12.2S, 12.18, 12.20. For isolate 12.9, small chloroses
were produced, which started to develop into necrosis after two weeks. It was not possible to
observe a further development of the disease on the plant for both isolates due to the natural
maturing of the leaf. However, the pathogen was successfully re-isolated in both cases from
the low number of lesions that had already developed, fulfilling Koch’s postulates and
confirming the pathogenicity of the isolates. Between the two varieties, Barros again
exhibited a higher level of resistance than Ricardinio to the two Bipolaris spp. isolates.

Results
66
Fig. 17. Symptoms produced by B. zeicola and Bipolaris spp. after artificial inoculation in the
greenhouse. A. Isolate 12.20 B. Isolate 12.27 C. Isolate 12.8 D-E. Isolate 12.7 clearly reflecting the
typical linear lesions produced by race 3.
Colletotrichum graminicola
Symptoms on maize leaves are oblong to rectangular lesions with a tan centre and red to
reddish-brown borders (Figure 19, A-F). These develop through the deformations produced
via the penetration of the leaf tissue by the lesions. The acervuli can be clearly observed
within the lesions, making it one of the unequivocal parameters for the diagnosis of the
disease in the field. After incubation of the leaves in a humidity chamber for two days,
substantial appresorium formation could be observed.
In vitro, the colony grows quickly under UV light conditions, completely covering the agar with
orange masses of spores which are embedded in a mucilaginous matrix with black setae
(acervuli) and a dark, flat mycelium. The colony therefore exhibits a dark colour with slimy,
dotted orange groupings at the surface (Figure 18). Spores are hyaline and show a
distinctive drop in the centre. Conidial size was within the range described by White et al.
(1987) (5 x 30 µm).
Fig. 18. Fourteen-day-old colonies of C. graminicola isolates (12.15 and 12.22) on PDA.

Results
67
Pathogenicity tests in the greenhouse
Both isolates, 12.22 and 12.15, produced a similar pattern of development on the two maize
varieties tested. Chlorotic spots (1 mm) were produced two days after inoculation, developing
into long brown and necrotic areas along the leaf, coalescing with time. In some lesions,
acervuli could be observed. Necrotic areas were also developed in the midrib and
progressed further from here into the surrounding middle areas of the leaf, giving the
appearance of strangulating the leaf. Dead leaves turned a reddish-brown colour. Stalk
discolouration and necrosis were also produced by both isolates. Both fungi could be
recovered from the symptoms on both varieties and the corresponding colonies have the
same features as the initially inoculated fungal pathogens, fulfilling Koch’s postulates.
Fig. 19. C. graminicola. A-B. Symptoms in the field and presence of acervuli in the lesions.
C-F. Symptoms after artificial inoculation in the greenhouse. G-H. in vitro observations: G. acervuli
H. Conidia. Scale bar =25 µm. I. Formation of appressoria.
The results of all isolates tested are summarised in Table 27 below. The score data refer to
the maximum score obtained from all leaves in each variety. The respective controls (non-
inoculated) did not exhibit symptoms in any of the experiments.

Results
68
Tab. 27. Summary of the isolates tested for Koch’s Postulates from the monitoring in 2012 and 2013.
Inoculation into a healthy plant
Grade rating variety Ricardinio/Barros
Organism Isolate Location
Presence of the pathogen in symptomatic
leaves
Isolated and in vitro pure
culture
Leaf#4
Leaf#5
Leaf#6
Re-isolation
K.zeae 12.11 Köhn (Plön) √ √ 0/0 4/3 4/0 √
12.13 Stapel √ √ 0/0 3/2 3/1 √
12.17 Mintraching √ √ 1/1 4/3 3/3 √
12.24 Beesten √ √ 4/0 5/4 5/5 √
12.28 Groningen √ √ 0/0 3/4 5/5 √
12.30 Biddinghausen √ √ 3/0 5/2 5/3 √
12.31 Giekau √ √ 4/0 5/4 5/5 √
B. zeicola 12.2S* Ostenfeld √ √ 4/4 5/4 6/5 √
12.7 Bylany √ √ 9/8 8/8 7/7 √
12.8 Caslav √ √ 1/2 4/1 2/1 √
12.9 Plana √ √ 3/2 2/1 2/1 √
12.18 Schönering √ √ 7/2 3/1 4/6 √
12.20 Nordholz √ √ 4/3 5/3 6/4 √
12.27 Bad Oldesloe √ √ 7/5 5/3 5/2 √
C. graminicola
12.15
Princepeel
√
√
9/9 8/8
7/8
√
12.22 Moorlas √ √ 9/9 8/8 7/7 √
*isolated from commercial seeds.
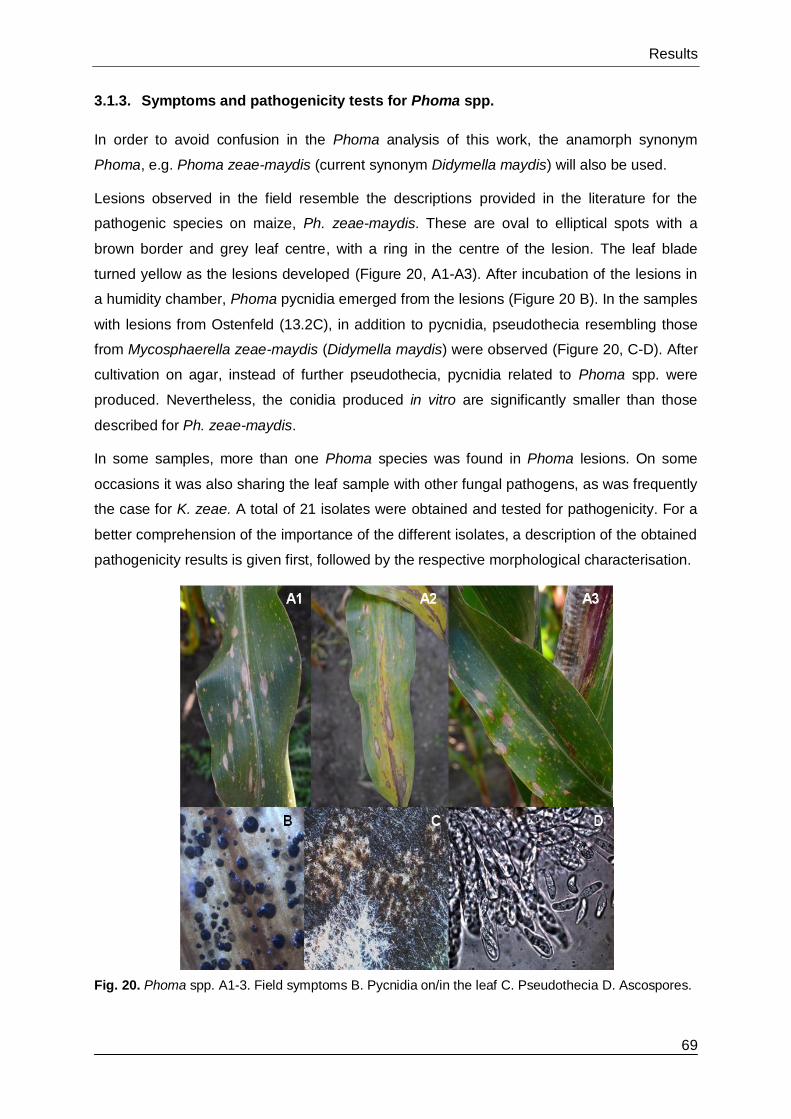
Results
69
3.1.3. Symptoms and pathogenicity tests for Phoma spp.
In order to avoid confusion in the Phoma analysis of this work, the anamorph synonym
Phoma, e.g. Phoma zeae-maydis (current synonym Didymella maydis) will also be used.
Lesions observed in the field resemble the descriptions provided in the literature for the
pathogenic species on maize, Ph. zeae-maydis. These are oval to elliptical spots with a
brown border and grey leaf centre, with a ring in the centre of the lesion. The leaf blade
turned yellow as the lesions developed (Figure 20, A1-A3). After incubation of the lesions in
a humidity chamber, Phoma pycnidia emerged from the lesions (Figure 20 B). In the samples
with lesions from Ostenfeld (13.2C), in addition to pycnidia, pseudothecia resembling those
from Mycosphaerella zeae-maydis (Didymella maydis) were observed (Figure 20, C-D). After
cultivation on agar, instead of further pseudothecia, pycnidia related to Phoma spp. were
produced. Nevertheless, the conidia produced in vitro are significantly smaller than those
described for Ph. zeae-maydis.
In some samples, more than one Phoma species was found in Phoma lesions. On some
occasions it was also sharing the leaf sample with other fungal pathogens, as was frequently
the case for K. zeae. A total of 21 isolates were obtained and tested for pathogenicity. For a
better comprehension of the importance of the different isolates, a description of the obtained
pathogenicity results is given first, followed by the respective morphological characterisation.
Fig. 20. Phoma spp. A1-3. Field symptoms B. Pycnidia on/in the leaf C. Pseudothecia D. Ascospores.

Results
70
Pathogenicity tests in the greenhouse
Chlorotic lesions (1-2 mm) were observed in the varieties Ricardinio and Barros two to three
days after inoculation for six isolates (12.18, 12.20, 12.23.2, 13.2P, 13.2C, 13.20). The
chlorosis developed into round to oval lesions with an orange centre and yellow halo, turning
into a necrotic centre, resembling the initial symptoms of the specific disease in the field
(Figure 21). The lesions expanded along the leaf veins, coalescing in large areas which
provide space for chlorotic zones that surrounded the lesions. From the pathogenic isolates,
12.18 and 12.20 induced a premature death of the leaves, thus achieving the highest grade
of virulence of all tested isolates (grade 9).
Of the Phoma spp. isolates obtained from the CBS, only isolate 588.69, Ph. zeae-maydis
(syn. Didymella maydis), produced lesions which tend to expand (grade 5). Isolate 180.80
(Phoma sorghina) produced only very slight chlorosis.
Fig. 21. Initial Phoma spp. lesions. A. Field symptoms B-C. Symptoms after artificial inoculation on
healthy plants in the greenhouse with isolates 12.20 (B) and Phoma zeae-maydis (CBS 588.69) (C).
A seventh isolate (12.3B) developed chlorosis on both maize varieties but these did not turn
into necrosis. Isolates 13.36 and 13.37 produced very limited slight chlorosis to the upper
leaf in the variety Ricardinio only. Based on these results, none of these isolates (13.2B,
13.36; 13.37) could be considered as causal agents of the disease produced in the field. The
rest of the isolates obtained during the monitoring did not exhibit any symptoms. A summary
of the results is presented in Table 28.
From the lesions produced by isolates 12.18, 12.20, 12.23.2, 13.2P, 13.2C, 13.20 and
CBS 588.69, the fungal organism could be recovered from the infected tissue, resembling
the initially inoculated conidia and therefore fulfilling Koch’s postulates.
A B C

Results
71
Tab. 28. Summary of the Phoma isolates obtained during the monitoring in 2012 and 2013 and tested for Koch’s postulates.
Inoculation on healthy plants
Score rating variety Ricardinio/Barros
Isolate Location
Presence of the pathogen in symptomatic
leaves
Isolated and in vitro pure
culture
Leaf#4
Leaf#5
Leaf#6
Re-Isolation
12.2 Ostenfeld √ √ 0/0 0/0 0/0 -
13.2d Ostenfeld √ √ 0/0 0/0 0/0 -
13.2P Ostenfeld √ √ 4/3 4/4 6/4 √
13.2B Ostenfeld √ √ 0/0 2/0 2/2 (*)
13.2C Ostenfeld √ √ 5/5 5/5 5/5 √
12.10 Braunau √ √ 0/0 0/0 0/0 -
12.13 Stapel √ √ 0/0 0/0 0/0 -
12.18 Schönering √ √ 9/9 8/8 6/6 √
12.19 Cloppenburg √ √ 0/0 0/0 0/0 -
12.20 Nordholz √ √ 9/8 7/6 6/6 √
12.23.1 Rade √ √ 5/5 5/5 5/5 √
12.23.2 Rade √ √ 0/0 0/0 0/0 -
12.27 Bad Oldesloe √ √ 0/0 0/0 0/0 -
12.28 Groningen √ √ 0/0 0/0 0/0 -
12.31 Giekau √ √ 0/0 0/0 0/0 -
* only chlorosis

Results
72
Tab. 28. (continued) Summary of the Phoma isolates obtained during the monitoring in 2012 and 2013 and tested for Koch’s postulates.
Inoculation on healthy plants
Score rating variety Ricardinio/Barros
Isolate (syn.) Location
Presence of the pathogen in symptomatic
leaves
Isolated and in vitro pure culture
Leaf#4
Leaf#5
Leaf#6
Re-
Isolation
13.20 Nordholz √ √ 5/3 5/4 5/4 √
13.36 Mittich √ √ 0/0 0/0 0/1 -
13.37 Hartkirchen √ √ 0/0 0/0 0/1 -
13.47 Kassel √ √ 0/0 0/0 0/0 -
13.48 Kassel √ √ 0/0 0/0 0/0 -
Ph. glomerata
(D. glomerata)
CBS 528.66 - - 0/0 0/0 0/0 -
Ph. pomorum
(D. pomorum)
CBS 838.84 - - 0/0 0/0 1/0 -
Ph. sorghina
(E. sorghinum)
CBS 180.80 - - 0/0 0/0 0/1 -
Ph. subherbarum
(D. subherbarum)
249.92 - - 0/0 0/0 0/0 -
Ph. subherbarum
(D. subherbarum)
250.92 - - 0/0 0/0 0/0 -
Ph. zeae-maydis
(D. maydis)
CBS 588.69 - - 0/1 4/3 5/2 √
For all Phoma isolates tested, the respective controls did not exhibit any symptoms in any of the experiments.

Results
73
3.1.4. Characterisation of Phoma spp.
The different Phoma spp. isolates are characterised by high variability in their respective in
vitro growth, as well as morphological differentiations indicating that several Phoma species
or strains exist. The exhaustive morphological characterisation of each isolate and the CBS
isolates for comparison is exhibited below.
Colony size measurements were taken after the first incubation week (dark, 20-22°C).
Further characterisation of the colony was described after 14 days. In addition, plates were
also cultivated under UV light. If any changes were observed in the colony growth or
morphological features of the pycnidia and conidia, these were also noted.
After searching for similarities using BLAST, 100% similarity was found for only two (non-
pathogenic) isolates, 12.36 and 12.37, which matched with Ph. pomorum CBS 838.84. As
described below, morphological characters of this isolate also coincide with in vitro
descriptions of isolates 12.36 and 12.37. For the rest of the isolates (13.2C, 13.2P, 12.18,
12.20, 13.2B, 12.13 and 12.19), molecular analysis resulted in several Phoma species for
each isolate (Apendix Table A3). All of these Phoma species had a similarity level of 98%-
99% with our isolates and no definitive conclusions could be drawn. Data from the obtained
forward and reverse strands can be found for all species in the appendix.
Further analysis by the Central Biodiversity Center (CBS-KNAW, Utrecht, the Netherlands)
confirmed the isolates 13.2B (considered saprophytic), 12.20 (pathogenic) and 12.13
(considered saprophytic) as three putative new species within the genus Peyronellaea (syn.
Didymella; anamorph related to the genus Phoma).
The Phoma spp. isolates described below are grouped according to similar in vitro
characteristics and pathogenicity. First, six pathogenic isolates (classified as pathogenic after
fulfilment of Koch’s postulates) are presented and described in detail, followed by those
considered non-pathogenic.
Pathogenic Phoma spp. isolates
In general, pathogenic isolates present a slow growth rate between 24 and 38 mm after
seven days. Moderate to abundant production of aerial mycelium floccose to woolly, green to
olivaceous, brown or white with regular border. Chlamydospores or dictyochlamydospores
are present in some isolates. Spore size varies within the range 4.1-7.9 x 1.5-3.2 µm.

Results
74
Fig. 22. Phoma spp. pathogenic isolates. Fourteen-day-old colonies on OA incubated in a dark
regime.
Isolate 13.2C
Growth rates between 35 and 39 mm after seven days. Moderate to abundant production of
aerial mycelium floccose to woolly, green to olivaceous, brown or white with regular border.
Size of the conidia: 4.7- 7.5 x 1.8-2.6 µm (average 6.2 x 2.2 µm). Conidia are ellipsoidal,
single-celled, hyaline, presenting one to four polar, small to medium size guttules. Pycnidia
are produced at a moderate rate under the mycelium layer and frequently found in the centre
of the colony. Pycnidia are also produced in agar and more frequently in the centre of the
colony when agar plates are incubated in UV light conditions. Pycnidia are dark brown to
black, subglobose on agar and mostly irregular in agar, glabrous, with
pseudoparenchymatous thick-walled cell structure. The size of pycnidia range between 50-
200 x 50-150 µm and are solitary or confluent with other pycnidia. The number (0-4) and
form of ostioles can vary considerably, presenting slightly to conspicuously papillate forms. In
some cases, the formation of numerous small cavities (possibly ostioles) was also observed
when the isolate was subcultured. The pycnidia present a white matrix (in which conidia are
embedded) with moderate production of conidia. Chlamydospores present.
Fig. 23. Phoma isolate 13.2C. A. Pycnidia. B. Textura angularis (pseudoparenchymateous cell wall).
D.Conidia. Scale bars A=50 µm; C=10 µm.
A B C

Results
75
Isolate 13.2P
Growth rates of the colony between 36 and 38 mm after seven days. The production of aerial
mycelium is moderate to abundant, usually white and wooly in appearance, developing some
greenish/olivaceous to brown areas when cultivated in UV light conditions. The colony
presents regular borders with scarce to moderate pycnidia production. Pycnidia under the
mycelium layer and most commonly in the centre of the colony. Size of the conidia: 4.1-7.6 x
2-3.2 µm (average 6 x 2.6 µm). Conidia are ellipsoidal to oblong, single-celled, hyaline,
presenting one to five mostly polar, medium-sized guttules. Pycnidia are brown to black,
globose to subglobose, glabrous, normally with a pseudoparenchymatous thick wall. In every
pycnidium, a unique, slightly papillate ostiole was observed. In some cases, however, it was
either difficult to recognize or absent entirely. The size of the pycnidia varies within the range
of 125-300 x 125-300 µm. The pycnidia present a white-yellowish colour matrix with
moderate production of conidia, or an absence thereof. Formation of light and dark brown
chlamydospores and dictyochlamydospores.
Fig. 24. Phoma isolate 13.2P. A. Pycnidia on the agar medium surface. C. Conidia. D.
Dictyochlamydospores. Scale bars B=10 µm.
Isolate 12.18
The diameter of the colony ranged from 29 to 30 mm after seven days with regular border.
Moderate production of concentrical zones of floccose to wooly, white, brown, green to
olivaceous aerial mycelium which can develop felty areas near the colony centre with an
abundant presence of pycnidia. Under UV light conditions, the wooly white and brown
mycelium could be produced in sectors. Size of the conidia: 3.7-6.1 x 1.5- 2.3 µm (average: 5
x 2 µm). Conidia are ellipsoidal, single-celled, hyaline, presenting one to four polar, small-
medium size guttules. Pycnidia are produced at a moderate rate and are brown to black in
colour, globose and subglobose in the agar, taking an irregular form once situated on the
agar. The pycnidia surface is glabrous, with pseudoparenchymatous thick-walled cell
structure. Solitary and confluent pycnidia fall within the range of 50-100 x 50-100 µm and
A B C

Results
76
present one slightly papillate ostiole. The pycnidia present a white matrix with moderate
production of conidia.
Fig. 25. Phoma isolate 12.18. A. Pycnidia in/on the agar medium surface. B. Pycnidia. C. Spores.
Scale bars B=50 µm C=10 µm.
Isolate 12.20
According to the CBS analysis: Peyronellaea new species. (syn. Didymella spp.). The colony
showed regular growth, varying between 24 and 28 mm after seven days Moderate
production of concentrical zones of flat/effuse to floccose white and brown aerial mycelium.
Size of the conidia: 4.5-7.9 x 1.6-3.9 µm (average 6.1 x 2.7 µm). Conidia are ellipsoidal,
single-celled, hyaline, presenting one to four polar, medium-large size guttules. Under UV
light conditions, the concentric zones remain predominantly different tones of dark to pale
brown colours. Pycnidia production varies from scarce to moderate and is situated under the
mycelium layer. The pycnidia are dark brown to black, globose on agar, subglobose in agar,
with pseudoparenchymatous cell structure. Pycnidia are either solitary or confluent and their
size ranges between 75-200 x 50-150 µm. Pycnidia mostly present one ostiole, which varies
in form from slightly to conspicuously papillate. White matrix present with moderate
production of conidia.
Fig. 26. Phoma isolate 12.20. A. Pycnidia in/on the agar medium surface. B. Pycnidia. C. Spores.
Scale bars B=100 µm; C=10 µm.
A B C
A B C

Results
77
Isolate 13.20
Growth rates of the colony ranged between 37 and 38 mm after seven days with a regular
border. Abundant production of whitish wooly mycelium with some green olivaceous to grey
areas scattered in the mycelium or in the margin zone. Size of the conidia: 4.3-7.7 x 1.8-2.9
µm (average 5.7 x 2.4 µm). Conidia are ellipsoidal to oblong, single-celled, hyaline,
presenting none to three polar, small-medium size guttules. Pycnidia are scarcely to
moderately produced under the mycelium layer, mostly on the agar surface. Pycnidia are
brown, globose to subglobose, solitary and confluent, glabrous with a
pseudoparenchymatous thick wall. A single, slightly papillate ostiole was observed for each
pycnidia. The size of the pycnidia varies within the range of 100-250 x 100-300 µm. The
pycnidia present a white matrix, with moderate production of conidia.
Fig. 27. Phoma isolate 13.20. A. Pycnidia on the agar medium surface. B. Pycnidia. C. Conidia.
Scale bars B=100 µm; C=10 µm.
Non-pathogenic Phoma spp. isolates
Here, only a few representative isolates are presented. Descriptions of further non-
pathogenic isolates can be found in the appendix.
In general, non-pathogenic Phoma spp. isolates present a faster growth than the pathogenic
Phoma spp. isolates, which, with the exception of isolate 13.2B and 12.10 (range 35-43)
oscillate between 45-75 mm after seven days. With the exception of isolate 13.2B
(11.9 x 3.9 µm), spore size varies within the range 2.9-6.3 x 1.3-3.1 µm.
Isolate 13.2B
According to the CBS analysis: Peyronellaea new putative species.
The colony showed regular growth, varying between 35 and 38 mm after seven days. There
was scarce production of brown, flat to effuse aerial mycelium, which can develop some
white floccose areas in the centre of the colony. Under UV light conditions, mycelium
production is inhibited, producing only pycnidia. Size of the conidia: 9.9-11.9 x 3.3-4.3 µm
A B C
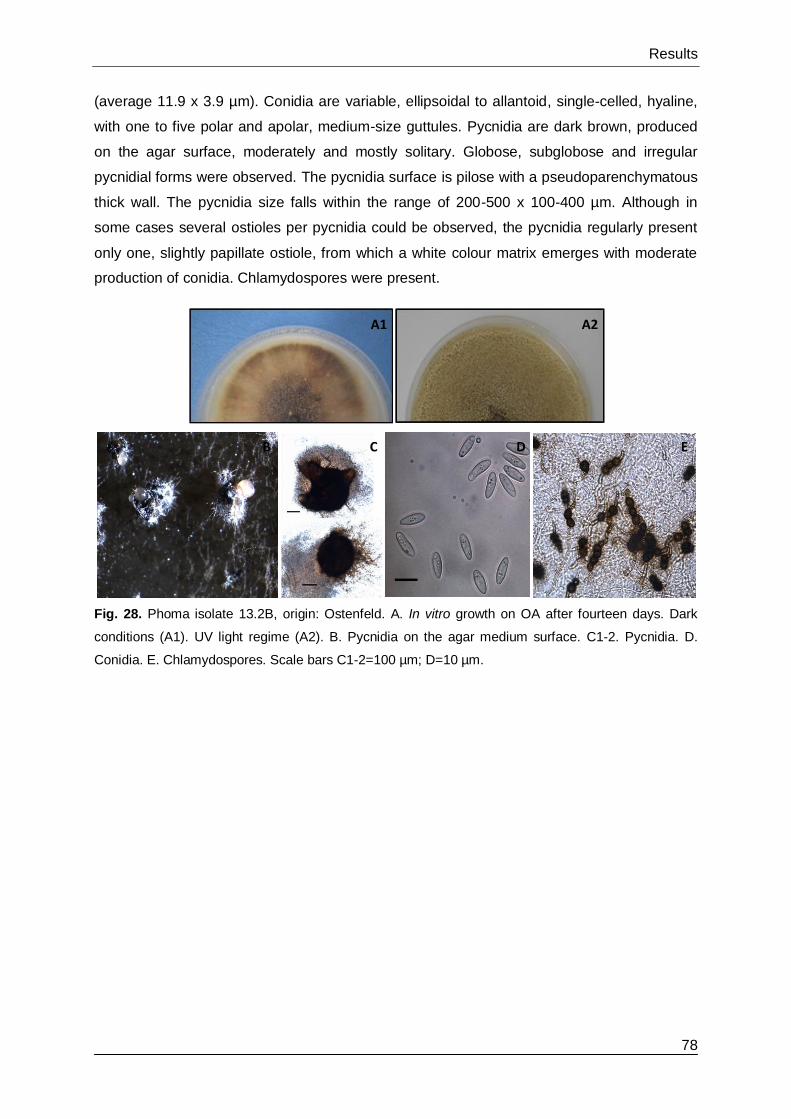
Results
78
(average 11.9 x 3.9 µm). Conidia are variable, ellipsoidal to allantoid, single-celled, hyaline,
with one to five polar and apolar, medium-size guttules. Pycnidia are dark brown, produced
on the agar surface, moderately and mostly solitary. Globose, subglobose and irregular
pycnidial forms were observed. The pycnidia surface is pilose with a pseudoparenchymatous
thick wall. The pycnidia size falls within the range of 200-500 x 100-400 µm. Although in
some cases several ostioles per pycnidia could be observed, the pycnidia regularly present
only one, slightly papillate ostiole, from which a white colour matrix emerges with moderate
production of conidia. Chlamydospores were present.
Fig. 28. Phoma isolate 13.2B, origin: Ostenfeld. A. In vitro growth on OA after fourteen days. Dark
conditions (A1). UV light regime (A2). B. Pycnidia on the agar medium surface. C1-2. Pycnidia. D.
Conidia. E. Chlamydospores. Scale bars C1-2=100 µm; D=10 µm.
A1 A2
B C D E

Results
79
Fig. 29. Non-pathogenic Phoma spp. isolates. Fourteen-day-old colonies on OA.
Isolate 12.13
According to the CBS analysis: Peyronellaea new putative species. (syn. Didymella spp.).
Colony size 70-75 mm in diameter after seven days, with a regular border. Scarce production
of aerial mycelium, which is salmon and flat/effuse to scattered. Mycelium is immersed, dark
brown or red/vinaceous. Size of the conidia: 2.9-5.2 x 1.2- 2.0 µm (average 3.4 x 1.6 µm).
Conidia are ellipsoidal, single-celled, hyaline, presenting either one or no guttule, which is
polar and small in size. Large spores could also be observed but were unusual. Pycnidia are
produced in abundance and homogeneously distributed on the plate, situated on the agar
surface and also in the agar. Pycnidia are brown, globose to irregular, glabrous or with
hyphal outgrowths, with pseudoparenchymatous cell wall structure. The size of the pycnidia
ranges between 75-300 x 75-200 µm and are either solitary or confluent with other pycnidia.
Pycnidia mostly present a single ostiole, while in some cases it is absent. If present, it is
conspicuously papillated and so-called ‘necks” are also formed. Pycnidia present a rosy buff,
white conidial matrix. Conidia are produced in abundance and extruded in cirri.

Results
80
Fig. 30. Phoma isolate 12.13. A1-2. Pycnidia on the agar medium surface with white conidial matrix.
B-C. Irregular pycnidia. D. Conidia. Scale bars C=100 µm; D=10 µm.
Isolate 12.19
Colony diameters after seven days: 65 and 72 mm with a regular border. Immersed mycelia
are flat, red vinaceous to brown. Aerial mycelium brown, flat to effuse with some scattered
areas of effuse mycelium. Size of the conidia: 3.3-4.7 x 1.5-1.9 µm (average 3.9 x 1.7 µm).
Large spores could also be observed but were unusual. Conidia are ellipsoidal, single-
celled, hyaline, presenting one to three polar and small guttules. Pycnidia are produced in
abundance and mostly at the margin of the colony situated on the agar surface and also in
the agar. Pycnidia are brown to black, globose, subglobose and flask-shaped, glabrous or
with hyphal outgrowths, with a pseudoparenchymatous cell wall structure. The size of the
pycnidia ranges between 75-150 x 75-200 µm and are located solitarily or in confluence with
other pycnidia. Pycnidia mostly present, with or without ostiole, predominantly slightly or non-
papillate. Conidial matrix whitish to yellow, containing conidia in abundance.
Fig. 31. Phoma isolate 12.19. A. Pycnidia on the agar medium surface. B. Pycnidia. C. Conidia. Scale
bars B=50 µm; C=10 µm.
A B C
A B C D
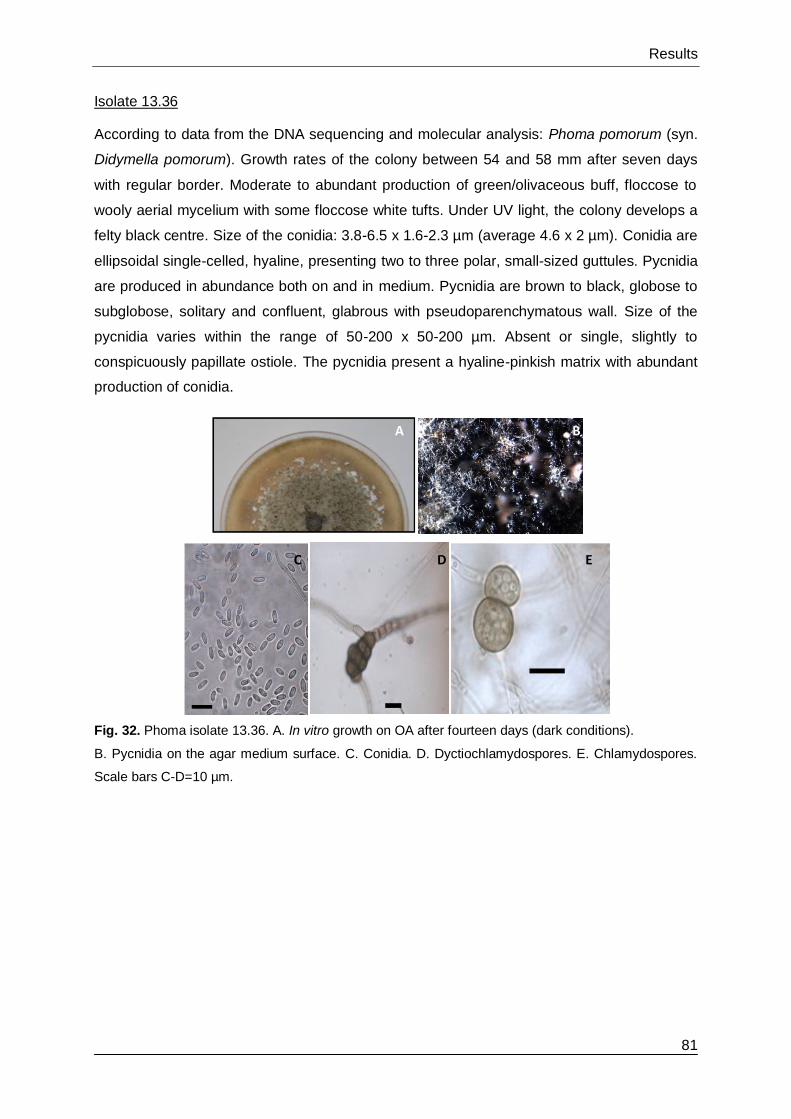
Results
81
Isolate 13.36
According to data from the DNA sequencing and molecular analysis: Phoma pomorum (syn.
Didymella pomorum). Growth rates of the colony between 54 and 58 mm after seven days
with regular border. Moderate to abundant production of green/olivaceous buff, floccose to
wooly aerial mycelium with some floccose white tufts. Under UV light, the colony develops a
felty black centre. Size of the conidia: 3.8-6.5 x 1.6-2.3 µm (average 4.6 x 2 µm). Conidia are
ellipsoidal single-celled, hyaline, presenting two to three polar, small-sized guttules. Pycnidia
are produced in abundance both on and in medium. Pycnidia are brown to black, globose to
subglobose, solitary and confluent, glabrous with pseudoparenchymatous wall. Size of the
pycnidia varies within the range of 50-200 x 50-200 µm. Absent or single, slightly to
conspicuously papillate ostiole. The pycnidia present a hyaline-pinkish matrix with abundant
production of conidia.
Fig. 32. Phoma isolate 13.36. A. In vitro growth on OA after fourteen days (dark conditions).
B. Pycnidia on the agar medium surface. C. Conidia. D. Dyctiochlamydospores. E. Chlamydospores.
Scale bars C-D=10 µm.
A B
C D E

Results
82
Phoma spp. obtained from the CBS
Fig. 33: Fourteen-day-old Phoma spp. isolates obtained from the CBS on OA.
588.89 Ph. zeae-maydis 180.80 Ph. sorghina 528.66 Ph. glomerata 249.92-250.92 Ph. subherbarum.
838.84 Ph. pomorum.
Phoma zeae-maydis CBS 588.69 (syn. Didymella maydis)
Growth rates of the colony between 32 and 34 mm after seven days with regular border.
Scarce to moderate production of whitish, green/olivaceous flocosse mycelium with black
felty centre and yellow border. Size of the conidia: 10.7-16.5 x 3.7-4.8 µm (average 13.5 x
4.1 µm). Conidia are distinctively larger than those of all the other Phoma isolates presented.
Conidia are ellipsoidal, mostly single-celled but single septa can be developed. Conidia are
hyaline, presenting one to five polar and apolar, large guttules. Pycnidia are produced
moderately under the mycelium layer, mostly on the agar surface. Pycnidia are brown,
globose to subglobose and distribution is predominantly solitary. Pycnidium surface glabrous
or with hyphal outgrowths with pseudoparenchymatous wall. Pycnidia do not have ostioles or
if present, it is single and non-papillate. Size of the pycnidia varies within the range of 180-
250 x 150-250 µm. The pycnidia present a white matrix with scarce to abundant production
of conidia.
Fig. 34. Phoma zeae-maydis (CBS 588.69). A. Pycnidia on the agar medium surface. B. Pycnidia.
C. Conidia. Scale bars B= 100 µm; C= 10 µm.

Results
83
Phoma glomerata CBS 528.66 (syn. Didymella glomerata)
Growth rates of the colony between 50 and 54 mm after seven days with regular border.
Moderate to abundant production of white, green/olivaceous flocosse and wooly aerial
mycelium. Under UV light, the mycelium tends to be more floccose. The pattern of in vitro
growth varies greatly, but green/olivaceous flocosse mycelium remains permanent. Size of
the conidia: 4.3-6.6 x 2-2.9 µm (average 5.4 x 2.6 µm). Conidia are ellipsoidal to clavate,
single-celled, hyaline, presenting one to two polar, medium-sized guttules. Brown to black
pycnidia are produced in abundance on the medium, subglobose, both solitary and confluent,
glabrous or with hyphal outgrowths and with pseudoparenchymatous wall. A single, slightly
to conspicuously papillate ostiole was observed most of the time for every pycnidium. The
pycnidia present a white to rosy buff matrix, with abundant production of conidia.
Fig. 35. Phoma glomerata (CBS 528.66) A. Pycnidia on the agar medium surface. B. Conidia.
Scale bar=10 µm.
Phoma pomorum CBS 838.84 (syn. Didymella pomorum)
Growth rates of the colony between 50 and 54 mm after seven days with regular border.
Moderate to abundant production of white, brown, yellow buff flat/effuse aerial mycelium.
Size of the conidia: 4.1-5.9 x 1.9-3.1 µm (average 5 x 2.5 µm). Large conidia were also
observed. Conidia are ellipsoidal to oblong, single-celled, hyaline, presenting one to two
polar, small-medium sized guttules. Pycnidia are produced in masses and are submerged in
the medium where only their pinkish orange matrix emerges from the agar. Pycnidia are pale
brown, subglobose, solitary and confluent, glabrous or with brown hyphal outgrowths, with
pseudoparenchymatous wall. It seems to be that pycnidia only have a single, slightly
papillate ostiollum (or this is absent).
A B
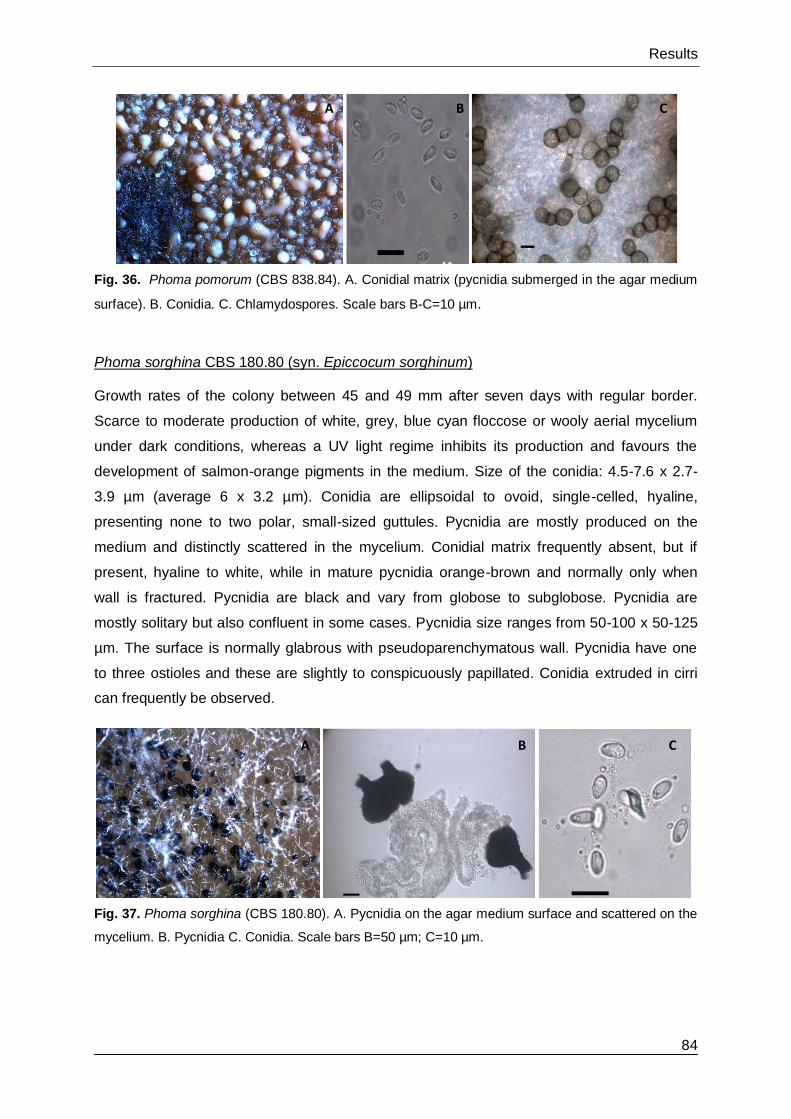
Results
84
Fig. 36. Phoma pomorum (CBS 838.84). A. Conidial matrix (pycnidia submerged in the agar medium
surface). B. Conidia. C. Chlamydospores. Scale bars B-C=10 µm.
Phoma sorghina CBS 180.80 (syn. Epiccocum sorghinum)
Growth rates of the colony between 45 and 49 mm after seven days with regular border.
Scarce to moderate production of white, grey, blue cyan floccose or wooly aerial mycelium
under dark conditions, whereas a UV light regime inhibits its production and favours the
development of salmon-orange pigments in the medium. Size of the conidia: 4.5-7.6 x 2.7-
3.9 µm (average 6 x 3.2 µm). Conidia are ellipsoidal to ovoid, single-celled, hyaline,
presenting none to two polar, small-sized guttules. Pycnidia are mostly produced on the
medium and distinctly scattered in the mycelium. Conidial matrix frequently absent, but if
present, hyaline to white, while in mature pycnidia orange-brown and normally only when
wall is fractured. Pycnidia are black and vary from globose to subglobose. Pycnidia are
mostly solitary but also confluent in some cases. Pycnidia size ranges from 50-100 x 50-125
µm. The surface is normally glabrous with pseudoparenchymatous wall. Pycnidia have one
to three ostioles and these are slightly to conspicuously papillated. Conidia extruded in cirri
can frequently be observed.
Fig. 37. Phoma sorghina (CBS 180.80). A. Pycnidia on the agar medium surface and scattered on the
mycelium. B. Pycnidia C. Conidia. Scale bars B=50 µm; C=10 µm.
A B C
A B C

Results
85
Phoma subherbarum 249.49 (syn. Didymella subherbarum)
Colony diameter after seven days about 50 and 55 mm with regular border. Aerial mycelium
is white to salmon, flat to effuse and scattered. Immersed mycelium brown. Brown to
red/vinaceous pigments are produced in the medium. Size of the conidia: 2.7-4.9 x 1.4-2.4
µm (average 4 x 2 µm). Conidia are ellipsoidal, single-celled, hyaline, either with or without
one or two polar, small guttules. Pycnidia are produced in abundance and evenly distributed
on the plate, on the surface and in the medium. Pycnidia are either solitary or fuse with other
pycnidia. The characteristical shape is mostly subglobose and irregular, with glabrous
surface and pseudoparenchymatous wall. Size of the pycnidia falls within the range of 50-
250 x 50-250 µm. Pycnidia present with one to four, slightly to conspicuously papillate
ostioles with possible development of ‘necks’. Micropycnidia also present. Conidial matrix
initially hyaline and later becomes white to pinkish, containing conidia in abundance.
Fig. 38. Phoma subherbarum (CBS 249.49). A. Pycnidia on the agar medium surface.
B. Pycnidia C. Conidia Scale bars B=100 µm; C=10 µm.
Phoma subherbarum 250.92 (Syn. Didymella subherbarum)
Colony diameter after seven days 61 and 65 mm with regular border. In vitro growth
resembles isolate CBS 249.92 (also Ph. subherbarum), but the colour spectrum is lighter
with white, flat, scattered aerial mycelium, with immersed light brown and salmon pigments in
the agar. Size of the conidia: 2.9-4.8 x 1.2-2.0 µm (average 3.9 x 1.8 µm). Conidia are
ellipsoidal, single-celled, hyaline, either without or with one or two small guttules, normally
polar. Pycnidia are produced in abundance, both on the surface and in the agar. Pycnidia are
brown to black, mostly solitary and globose to subglobose. Pycnidia have a glabrous surface
or with hyphal outgrowths and pseudoparenchymatous cell wall. Size of the pycnidia falls
within the range of 100-150 x 100-150 µm. Pycnidia present one to two non- papillate
ostioles. Conidial matrix white, yellow or pinkish containing conidia in abundance.
A B C

Results
86
Fig. 39. Phoma subherbarum (CBS 250.92). A. Conidial matrix and pycnidia on/in agar medium
surface. B. Pycnidia. C. Conidia. Scale bars B=50 µm; C=10 µm.
3.1.5. Characterisation of Fusarium spp. and pathogenicity tests
Fusarium spp. were frequently found in the infected leaf samples, together with other fungal
organisms. Testing for the Koch’s postulates becomes necessary for two reasons: first, to
confirm or reject Fusarium species as symptomatic pathogens producing leaf spots, and
second, to accurately associate less known pathogenic fungal organisms (such as those
belonging to the Phoma spp.) when Fusarium was also present in the same lesions.
Fusarium symptoms were observed in the field in corn husks, leaf sheaths, stalks and ears
(Figure 40). On the leaf, the pathogen was normally sharing lesions with another pathogen.
In total, 21 Fusarium isolates were obtained (Table 29 and Figure 41).
Due to the secondary role of the pathogen in producing foliar maize spot diseases, the
identification in this work, if possible, was only carried out through morphological
observations. From the 21 isolates, 12 could be identified. These belong to four species:
F. graminearum, F. avenaceum, F. cerealis and F. proliferatum.
In the greenhouse, inoculations of healthy plants were carried out for 12 Fusarium spp.
isolates (see Table 29). None of the isolates could produce any symptoms after spraying
spore suspensions onto healthy leaves of the plant. Thus, Fusarium spp. could not be
confirmed as main leaf pathogens which produce symptomatic spots on maize leaves.
A B C

Results
87
Fig. 40. Fusarium spp. symptoms observed in the field on: A-B. Stalk. C. Ear kernels. D. Corn husks.
E. Leaf sheaths. F. Presence in maize debris (Giberella zeae).
Tab. 29. Fusarium spp. isolates obtained from the monitoring in
2012 and 2013.
Location Fusarium spp. Substrate
12.2* F. graminearum Seeds
13.2 F. graminearum Stalk debris
12.8* Fusarium spp. Leaf
12.10* Fusarium spp. Leaf
12.12* F. graminearum Leaf
12.13* F. graminearum Leaf shead
12.14* Fusarium spp. Leaf shead
12.19* F. avenaceum Leaf shead
12.23* Fusarium spp. Leaf shead
12.23b Fusarium spp. Leaf
12.27* F. avenaceum Leaf
12.30* Fusarium spp. Leaf
12.31* F. avenaceum Leaf
13.18 Fusarium spp. Leaf
13.20 F. avenaceum Leaf
13.42 Fusarium spp. Leaf
13.43 Fusarium spp. Leaf
13.47 Fusarium spp. Corn husk
13.47b Fusarium spp. Corn husk
13.47c Fusarium spp. Leaf
13.47d F. graminearum Leaf
*isolate tested for pathogenicity

Results
88
Fig. 41. Fourteen-day-old colonies of Fusarium spp. isolated from maize samples during the monitoring 2012 and 2013.
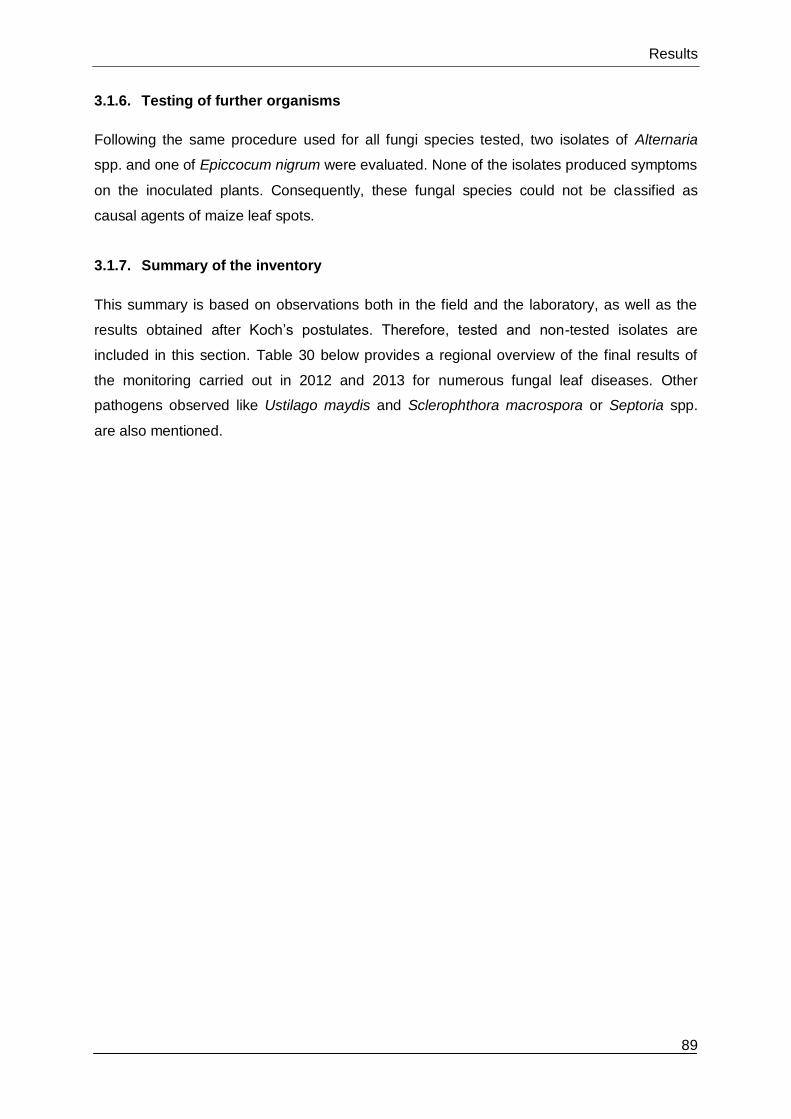
Results
89
3.1.6. Testing of further organisms
Following the same procedure used for all fungi species tested, two isolates of Alternaria
spp. and one of Epiccocum nigrum were evaluated. None of the isolates produced symptoms
on the inoculated plants. Consequently, these fungal species could not be classified as
causal agents of maize leaf spots.
3.1.7. Summary of the inventory
This summary is based on observations both in the field and the laboratory, as well as the
results obtained after Koch’s postulates. Therefore, tested and non-tested isolates are
included in this section. Table 30 below provides a regional overview of the final results of
the monitoring carried out in 2012 and 2013 for numerous fungal leaf diseases. Other
pathogens observed like Ustilago maydis and Sclerophthora macrospora or Septoria spp.
are also mentioned.

Results
90
Tab. 30. Summary of the monitoring of maize leaf diseases in Central Europe during the 2012 and 2013 seasons.
Code location
Location Season E. turcicum K. zeae P. sorghi B. zeicola C. graminicola Phoma
spp* Fusarium spp.* Others
North
12.2 Ostenfeld 2012 X X Xs Xs
12.11 Köhn (Plön) 2012 X
12.12 Schleswig 2012 Xs Xs
12.13 Stapel 2012 X Xs Xs
12.20 Nordholz 2012 X X X X
12.23 Rade 2012 X X/Xs
12.27 Bad Oldesloe 2012 X Xs Xs
12.31 Giekau 2012 X X/Xs
13.2 Ostenfeld 2013 X X X
13.20 Nordholz 2013 X X X U.maydis
13.40 Wessin 2013 X X Xs
13.44 Taaken 2013
13.49 Dewitz 2013 North-West
12.19 Cloppenburg 2012 X X Xs Xs
12.24 Beesten 2012 X X
12.14 Ommen 2012 X X X Xs S.
macrospora
12.15 Princepeel 2012 X X X X
12.21 Ottersum 2012 X X X
12.28 Groningen 2012 X X Xs Septoria spp.
12.30 Biddinghuizen 2012 X X X Septoria spp.
13.14 Ommen 2013 X X
* X: pathogenic isolates producing symptoms. Xs: isolates considered saprophytes or not producing symptoms on maize leaves after Koch’s postulates.
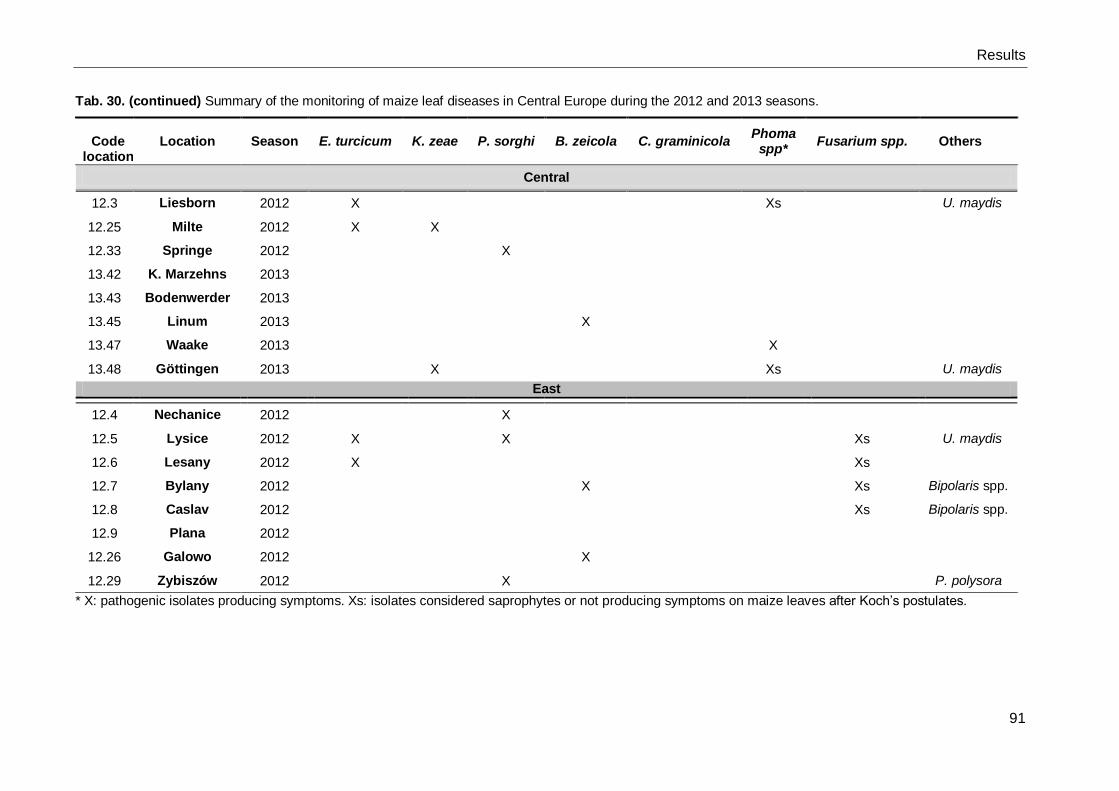
Results
91
Tab. 30. (continued) Summary of the monitoring of maize leaf diseases in Central Europe during the 2012 and 2013 seasons.
Code
location Location Season E. turcicum K. zeae P. sorghi B. zeicola C. graminicola
Phoma spp*
Fusarium spp. Others
Central
12.3 Liesborn 2012 X Xs U. maydis
12.25 Milte 2012 X X
12.33 Springe 2012 X
13.42 K. Marzehns 2013
13.43 Bodenwerder 2013
13.45 Linum 2013 X
13.47 Waake 2013 X
13.48 Göttingen 2013 X Xs U. maydis
East
12.4 Nechanice 2012 X
12.5 Lysice 2012 X X Xs U. maydis
12.6 Lesany 2012 X Xs
12.7 Bylany 2012 X Xs Bipolaris spp.
12.8 Caslav 2012 Xs Bipolaris spp.
12.9 Plana 2012
12.26 Galowo 2012 X
12.29 Zybiszów 2012 X P. polysora
* X: pathogenic isolates producing symptoms. Xs: isolates considered saprophytes or not producing symptoms on maize leaves after Koch’s postulates.

Results
92
Tab. 30. (continued) Summary of the monitoring of maize leaf diseases in Central Europe during the 2012 and 2013 seasons.
Code location Location Season E. turcicum K. zeae P. sorghi B. zeicola C. graminicola Phoma
spp* Fusarium spp. Others
South
12.10 Braunau 2012 X X X Xs X
12.16 Mariaporsching 2012 X
12.17 Mintraching 2012 X X
12.18 Schönering 2012 X X X X
12.32 Marburg 2013 X X
13.10 Braunau 2013 X X
13.39 Windsbach 2012
13.36 Mittich 2013 X X X Xs S. macrospora
13.37 Hartkirchen 2013 X X Xs
13.38 Ruhstorf (Rott) 2013 X
13.41 Mariaporsching 2013
13.46 Steiermark 2013
South-West
12.22 Moorlas 2012 X X
12.34 Garlin 2012 X
* X: pathogenic isolates producing symptoms. Xs: isolates considered saprophytes or not producing symptoms on maize leaves after Koch’s postulates..

Results
93
3.1.8. Distribution and prevalence of fungal pathogens occurring on maize leaves
In this section, the prevalence and distribution (Table 31 & Figure 42) of the pathogens which
are considered the most common causal agents of symptoms on maize leaves, i.e. E.
turcicum, K. zeae, P. sorghi, C. graminicola, Phoma spp., are presented according to the
data from the monitoring. Note that only the pathogenic Phoma isolates are included on the
map.
E. turcicum
The pathogen was diagnosed in 18 locations in 2012 and only six in 2013, representing a
prevalence of 54% and 32%, respectively. It was frequently observed in the central and
eastern regions of the Czech Republic and also in the Netherlands. Although the pathogen is
also frequently found in the north-western part of Lower Saxony, it is endemic in southern
parts of Germany and northern Austria – in these regions, a higher disease pressure was
observed for both years.
P. sorghi
Although the pathogen was diagnosed in various areas of the Netherlands and central
Germany, southern Germany is the main region in which the pathogen is widespread across
fields. In total, the pathogen was diagnosed in nine locations in 2012 and one location in
2013, which corresponds to a prevalence of 27% of all studied locations in 2012, falling to
5% in 2013. After E. turcicum, P. sorghi can be considered the second most important
disease in southern Germany.
K. zeae
The presence of the pathogen was confirmed in a total of 16 locations in 2012 (48%) and six
locations in 2013 (32%). While it was found on just a few plants in the southern German and
northern Austrian locations, it was particularly widespread in fields of the Netherlands and
northern Germany (northern and western Lower Saxony and Schleswig-Holstein).
B. zeicola
The pathogen was distributed across various regions. It was observed in both the southern
and northern regions, as well in the west (north-western Germany) and east (Czech
Republic). There was no dominant region for the disease, but a higher prevalence was
observed in the northern German location of Nordholz. Prevalence ranged from 30% in 2012
to 26% in 2013.

Results
94
C. graminicola
The pathogen was only identified on isolated plants in north-western Germany, the
Netherlands, and France. It was diagnosed in three locations in 2012, representing 9%
prevalence, falling to 5% in 2013 when it was only diagnosed in a single location.
Phoma spp.
Pathogenic Phoma species were identified in the northern German locations of Ostenfeld
(2012 and 2013), Rade (2012), Nordholz (2012 and 2013), as well as in Waake in central
Germany (2013) and in Schönering (northern Austria). In total, it was identified in three
locations in 2012 and two locations in 2013. Non-pathogenic Phoma species are generally
distributed across all the studied regions. In 2012, non-pathogenic Phoma species were
isolated from 13 locations in 2012 and four locations in 2013, which represents a prevalence
of 30% and 21%, respectively.
Tab. 31. Prevalence of maize leaf diseases according to the 2012 and 2013 monitoring.
Disease Turcicum leaf blight
Kabatiella eyespot
Brown spot
Common rust
Anthracnose Phoma spp.*
Causal
Agent E. turcicum K. zeae B. zeicola P. sorghi C. graminicola NP P
2012
Locations 18 16 10 9 3 10 3
Prevalence (100%=33)
54% 48% 30% 27% 9% 30% 9%
2013
Locations 6 6 5 1 1 4 2
Prevalence (100%=19)
32% 32% 26% 5% 5% 21% 16%
*NP: non pathogenic. P: pathogenic.

Results
95
Fig. 42. Distribution of fungal pathogens on maize leaves in Central Europe from the samples
collected in 2012 and 2013. Main foliar diseases, K. zeae, E. turcicum and P. sorghi, are shown above
and of secondary importance, B. zeicola, Bipolaris spp. Phoma spp. and C. graminicola, are shown
below. Principle regions of distribution are circled.

Results
96
3.2. Meteorological conditions
In order to compare the development of the epidemic in the field, it is important to analyse
the weather conditions which prevailed from the first appearance of the symptoms in the
middle of the season to the late growing season stages. Weather conditions varied in both
locations markedly from one year to another.
3.2.1. Mittich and Inzing
Figure 43 depicts the relationship between temperature (daily average), precipitation and
relative humidity for the years in which trials were conducted, 2013 and 2014.
Fig. 43. Weather conditions in the region of Mittich in 2013 (above) and Inzing in 2014 (below).
▌ Precipitation ▬ Temperature (daily average) ▬ Relative humidity.

Results
97
In 2013 (Figure 43, above), it is clear that there was very little precipitation in July, with some
more frequent rain falling towards the end of the month. In August, there was a day of very
heavy rain in the first week and some accumulation of precipitation towards the end of the
month. Although a slightly higher quantity of precipitation was recorded in August than in
September, it rained more frequently in September, i.e. on more days. In comparison,
precipitation in 2014 was higher but still with frequent dry intercalary periods. This was
especially noticeable in July and August, where several events of precipitation are evident.
Regarding temperatures in 2013, in July they initially rose slowly (from 15.8°C to 20.8°C),
with a slight decrease around the middle of the month (20.5°C to 16.1°C) and a constant rise
(peak temperature 26.8°C) until a few days before the end of the month. At the beginning of
August, the temperatures rose again (21.4°C to 25.5°C), slowly falling from the second week
onwards (lowest temperature 15.0°C), while in September the temperature was stable until a
notable decrease in the second week (19.1°C to 10.9°C). In 2014, there was some
fluctuation in July, with a clear increase in the initial days of the month (14.5°C to 22.9°C)
and a sharp fall at the end of the first week (22.9°C to 13.0°C). Thereafter, there was a
constant increase in the temperature until another decrease occurred (22.7°C to 17.6°C),
coinciding with two days of very heavy rain on 21 and 22 July. The temperatures in August
were more constant, in particular after they dropped in the second week (21.9°C to 13.4°C).
September was less consistent, with higher temperatures initially, a decrease in the second
week (18.2°C to 12.5°C), followed by an increase in the middle of the month and a second
drop in temperature (18.1°C to 9.5°C). Overall, the average temperature in September 2014
was slightly higher than in 2013, while for July and August it was lower than 2013 (see Table
32).
To gain a greater overview of the weather patterns either side of 2013 and 2014 and make
subsequent comparisons with past years, Table 32 displays the average temperatures and
levels of precipitation for July, August and September from 2010 to 2015. The starting year is
2010 due to the epidemic of Turcicum leaf blight which occurred in this season (Urban 2012).

Results
98
Tab. 32. Overview of weather conditions for the region of the locations of Mittich
and Inzing from 2010 to 2015.
Mittich/
Inzing region
July
(vegetative to
reproductive
phase)
August
(reproductive phase
to development of
the fruit)
September
(fruit
development
to ripening)
Temperature
2010 20.6 17.8 12.9
2011 16.8 18.7 14.7
2012 19.0 18.9 14.2
2013 20.3 18.7 13.7
2014 19.2 16.7 14.8
2015 21.5 21.1 13.7
Long-term
average
(1981-2010)
18.7 18.1 13.9
Precipitation
2010 190.8 146.7 36.1
2011 172.3 66.8 71.3
2012 78.9 88.9 66.4
2013 23.7 89.3 73.6
2014 105.3 127.5 69.6
2015 42.0 20.6 47.4
Long-term
average
(1981-2010)
112.0 109.0 72.0
For the southern German locations of Mittich and Inzing, it is clear that the temperatures
varied from 2010 to 2015, especially in July and August. Here, the average monthly
temperatures ranged from 16.8°C (2011) to 21.5°C (2015) and 16.7°C (2014) to 21.1°C
(2015) in July and August, respectively. The levels of precipitation also varied greatly
between 2010 and 2015. This was noticeable in July and August, ranging from a low of 23.7
mm (2013) to a high of 190.8 mm (2010) in July, and 20.6 mm (2015) and 146.7 (2010) in
August. In September, while the average temperature and precipitation was more stable from
2010-2015, there was some variation (especially in 2010). Despite this variation, clear
patterns still emerge. It is noteworthy that 2010-2015 were relatively warm and dry seasons
compared to the long-term average (1981 to 2010). In fact, only six (July 2011, August 2010,
August 2014, September 2010, September 2013 and September 2015) of the 18 months fell
below the corresponding long-term average temperature, while only five (July 2010, July

Results
99
2011, August 2010, August 2014, September 2013) of the 18 months had a higher level of
precipitation than the corresponding long-term average. 2010 stands out here, however, with
very high levels of precipitation.
3.2.2. Ostenfeld
Figure 44 depicts the relationship between temperature (daily average), precipitation and
relative humidity for the years in which trials were conducted, 2013 and 2014.
Fig. 44. Weather conditions in Ostenfeld in 2013 (above) and 2014 (below). ▌Precipitation
▬ Temperature (daily average) ▬ Relative humidity.
In Ostenfeld, there was minimal precipitation in both July 2013 and 2014. While some rainfall
occurred around the middle of the month in August 2013, a dry period thereafter meant that
the level of precipitation was much lower than in August 2014. In contrast, precipitation was
more frequent in September 2013 compared to September 2014 (with a clear, isolated peak
on 14 September).

Results
100
Regarding the temperature in 2013, in July the temperatures were relatively constant, slowly
rising (peak 22.5°C) until a slight drop occurred at the end of the month (22.5°C to 17.8°C).
At the beginning of August there was a sharp rise (25.4°C) and subsequent fall (18.3°C) in
the temperature, with a relatively constant trend thereafter. The temperatures in September,
on the other hand, fluctuated frequently, with several notable increases and decreases within
a few days (high 20.8°C; low 9.6°C), and a slight downward trend overall. In 2014, there was
a sharp increase in the temperature at the start of July (12.9°C to 21.7°C) and overall it was
a warmer month compared to 2013. August 2014, on the other hand, was cooler than in
2013, with a relatively constant downward trend (high 22.9°C; low 11.9°C) until an increase
in the temperature at the end of the month (11.9°C to 16.8°C). As in 2013, temperatures in
September 2014 fluctuated but were more consistently warm.
To gain a greater overview of the weather patterns either side of 2013 and 2014 and make
subsequent comparisons, Table 33 displays the average temperatures and level of
precipitation for August, July and August from 2011-2015. The starting year is 2011 due to
the epidemic of Kabatiella eyespot which occurred in this season in Schleswig-Holstein
(Urban 2012; Schlüter 2011).
Tab. 33. Overview of weather conditions in Ostenfeld from 2011 to 2015.
Ostenfeld region
July
(vegetative to reproductive
phase)
August (reproductive phase to
development of the fruit)
September
(development of the fruit to ripening)
Temperature (°C)
2011 16.4 16.5 14.5
2012 16.4 17.2 13.4
2013 18.1 17.5 13.1
2014 19.8 16.1 15.5
2015 16.8 18.2 13.0
Long-term average
(1981-2010) 17.3 16.9 13.5
Precipitation (mm)
2011 110.7 244.8 107.2
2012 145.5 60.2 63
2013 55.4 44.9 70.1
2014 33.9 111.8 48.8
2015 186.6 56.5 76.2
Long-term average
(1981-2010) 84.0 82.0 76.0

Results
101
There is notable variation in the temperature and level of precipitation. Regarding the
temperature, there were noticeable differences for all months, with lows and highs ranging
from 16.4°C to 19.8°C (July), 16.5°C and 18.2°C (August), and 13.0°C and 15.5°C
(September). Precipitation levels also exhibited noticeable differences, with distinctly dry
months in July (2013 and 2014), as well as very wet months (2012 and 2015). August 2011
was an unusually wet month compared to August 2012-2015, while September was relatively
stable in comparison. In contrast to Mittich and Inzing, no clear patterns emerge with respect
to the long-term average. Eight (seven) of the 15 months analysed were below (above) the
long-term average for temperature, while this was also the case for precipitation (eight below
average / seven above average).
3.2.3. Göttingen
For this location, only the weather records for 2015 are presented (Table 34 and Figure 45)
as the experiment consisted of a single artifical inoculation in that year. The region is not
characterised by the presence of maize leaf diseases, thus reducing the likelihood of
possible inoculum. Comparisons with previous years are therefore not justified here.
Tab. 34. Summary of the weather data for the Göttingen “Miniplot” site.
Göttingen “Miniplot”
July*
(vegetative to reproductive phase)
August*
(reproductive phase to development of the fruit)
September* (development of the
fruit to ripening)
Temperature
2015 18.7°C 20.2°C 14.0 °C
Precipitation
50
69
58 2015
*Data registered during the experiment from 13.July (artificial inoculation) until 29 September (harvest).
The average temperature during the vegetative to reproductive phase of the plant was
18.7°C. The end of July and beginning of August was characterised by a dry and warm
period with isolated rain showers. In the middle of August, there was a decrease in the
temperatures and some heavy rain was recorded. Although a higher quantity of precipitation
was recorded in August than in September, it rained more frequently in September, i.e. on
more days.

Results
102
Fig. 45. Weather conditions in the “Miniplot” in Göttingen in 2015. ▌ Precipitation ▬ Temperature
▬ Relative humidity.
3.3. Epidemiological studies based on spore trapping in the field
3.3.1. Seasonal incidence of airborne conidia of E. turcicum
The seasonal incidence of conidia of E. turcicum was investigated through the use of
Burkard spore traps during the 2014 season in Inzing (natural inoculum) and 2015 season in
Göttingen (artificial inoculum). The evaluation of the samples, initially through microscopy, is
presented in this section. Different patterns of E. turcicum conidial release and dispersal
were considered according to previous reports for E. turcicum (Casselman & Berger 1970;
Leach 1975; Leach et al. 1977; Bleicher & Balmer 1993; Rapilly 1991), i.e. those influenced
by wind, rain, variations in relative humidity (henceforth RH) and temperature. Further
estimations of latent periods based on the data obtained from the spore trap and the
correlation with weather conditions are discussed in detail in section 4.3.1.
3.3.1.1. Inzing 2014
A total of 90 tapes were collected in 2014 for Inzing. From the collected samples, 69%
presented E. turcicum conidia through microscopic assessment.
First conidia were detected on 8 July (first day of monitoring), when the plants were at the
beginning of tassel emergence (BBCH 51). The following two months (middle of July until
end of August) did not present any noticeable conidia release (mostly 0-2 conidia; max. 7
conidia) and therefore are not presented here in detail. These low amounts of conidia
coincided with low precipitation and low humidity during July and August. However, at the
end of July (30-31) and beginning of August (1-5), a combination of moderate temperatures
(18-21°C) and six rainy days with three days (30, 31 July, 5 August) of high RH were

Results
103
recorded (>90% average RH per day). For instance, on 30 July, 18 h of 100% RH were
registered. Shortly thereafter, the first lesions (minimal) in the location were detected on 7
August (<1% infected leaf area). Trapped conidia remained at low levels.
Two periods of notable (10 and 17-18 September) and two of abundant (24-26 September
and 3-4 October) conidia release were considered for detailed analysis and are therefore
shown in detail in Figure 46.
Fig. 46. Fluctuation of conidia release ( ) for the sampling period in Inzing in 2014 with development
of the percentage of infected leaf area (----) and periods of notable (points 1 & 2) and abundant
conidia release (points 3 & 4). ).*= missing data
Weather data for Inzing in 2014 and correlation with the trapped number of spores are shown
in Figure 47. At the end of August and beginning of September, a period of frequent rain
(about 8 days) including five days of high humidity (>93%) was recorded. On several days of
this period (26, 30 August and 2 September), at least 14 h of 100% RH occurred. Thereafter,
a first notable peak of conidia release was registered on 10 September, albeit with a
relatively low quantity of spores (21 spores). Strong winds with accompanying rain and an
increase in the RH coincided on the preceding day of conidial release. On the following days
(11-14 September), a decrease in the temperatures was observed (range 12-16°C),
coinciding with a four-day period of rainfall and high humidity (16-23 h of 100% RH were
recorded daily). On these days, only a few spores were trapped despite high wind velocities
also being recorded (3.1 to 3.7 m s-1 on 12-13 September). A slight increase in the infected
leaf area was noted on these days (Figure 46). On 17-18 September, a noticeable (low)
conidia release was detected (15 and 18 conidia per day, respectively). This coincided with a
strong decrease in the RH on 17 September (avg. 73%), followed by an increase in wind on
18 September, where the maximum peak was registered. In the late season, a relatively
warm (17-18°C) period spanning three days (17-19 September) occurred. The end of this
three-day period coincided with a noticeable amount of precipitation, which continued until 23
September and was accompanied by two days of high humidity (15 and 19 h of 100% RH,
respectively).
*

Results
104
Fig. 47. Fluctuation of conidia release and weather conditions in Inzing in summer 2014: Average
temperature and precipitation (above), wind velocity (centre) and average relative humidity (below).
*=missing data.
*
*
*

Results
105
First peaks of abundant conidia release were recorded during a three-day period on 24, 25
and 26 September, presenting 72, 248 and 127 conidia per tape, respectively. On the day of
the maximum registered peak of the season, i.e. 25 September, a violent increase in the RH
(100% for 14 h) occurred in combination with rain and wind. These enhancing factors (high
humidity and rain) for conidia release and further infection were prolonged until 26
September. An increase in the temperature (up to 15°C), coinciding with a four-day period of
high humidity (>93-99% RH), occurred from 30 September to 3 October - 14-21 h of 100%
RH were recorded daily. A slight increase in the number of trapped spores was observed,
with a clear increase on 3 and 4 October (153 and 159 spores, respectively). On 3 and 4
October, a violent decrease in the relative humidity accompanied by wind coincided with
these peaks of conidial release. An increase in the infected leaf area (approx. 3% on
average) was recorded after these periods (Figure 46).
3.3.1.2. Göttingen 2015
Seasonal fluctuations of airborne conidia were studied in Göttingen in 2015 after artificial
inoculation of the plants through spraying with spore suspensions (13 and 24 July).
E. turcicum conidia were recorded on 68% of the samples through microscopy.
With the exception of the first two days after inoculation - when plants were covered with
plastic for 48 h and a saturated atmosphere (100% RH) is therefore assumed - the structure
of the data for Göttingen did not allow for an accurate calculation of the number of hours with
100% RH. Hence, a day characterised by high RH is considered to have an average of at
least 90%.
First chlorotic lesions were observed 24 hours after artificial inoculation. On 16 July, three
days after artificial inoculation, first conidia were detected when the plants were, on average,
at the beginning of the flowering stage (BBCH 59-63). These initial and inconsiderable
quantities of conidia (1-4 per day) on the days thereafter were directly related to the sprayed
inoculum (artificial inoculation) and not as a result of their own sporulation on the leaf tissue
after an established process of infection. Two periods of moderate conidia release and four
main periods of abundant conidia release were considered for detailed analysis. These are
depicted in detail in Figure 48.
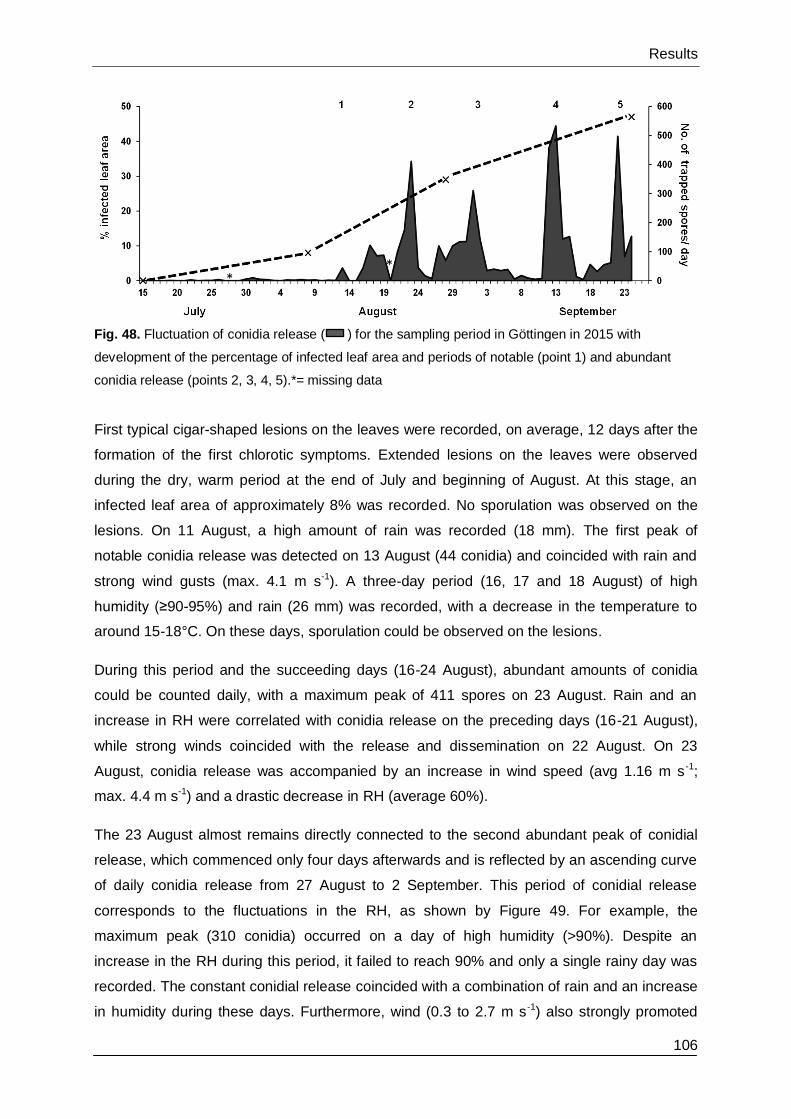
Results
106
Fig. 48. Fluctuation of conidia release ( ) for the sampling period in Göttingen in 2015 with
development of the percentage of infected leaf area and periods of notable (point 1) and abundant
conidia release (points 2, 3, 4, 5).*= missing data
First typical cigar-shaped lesions on the leaves were recorded, on average, 12 days after the
formation of the first chlorotic symptoms. Extended lesions on the leaves were observed
during the dry, warm period at the end of July and beginning of August. At this stage, an
infected leaf area of approximately 8% was recorded. No sporulation was observed on the
lesions. On 11 August, a high amount of rain was recorded (18 mm). The first peak of
notable conidia release was detected on 13 August (44 conidia) and coincided with rain and
strong wind gusts (max. 4.1 m s-1). A three-day period (16, 17 and 18 August) of high
humidity (≥90-95%) and rain (26 mm) was recorded, with a decrease in the temperature to
around 15-18°C. On these days, sporulation could be observed on the lesions.
During this period and the succeeding days (16-24 August), abundant amounts of conidia
could be counted daily, with a maximum peak of 411 spores on 23 August. Rain and an
increase in RH were correlated with conidia release on the preceding days (16-21 August),
while strong winds coincided with the release and dissemination on 22 August. On 23
August, conidia release was accompanied by an increase in wind speed (avg 1.16 m s -1;
max. 4.4 m s-1) and a drastic decrease in RH (average 60%).
The 23 August almost remains directly connected to the second abundant peak of conidial
release, which commenced only four days afterwards and is reflected by an ascending curve
of daily conidia release from 27 August to 2 September. This period of conidial release
corresponds to the fluctuations in the RH, as shown by Figure 49. For example, the
maximum peak (310 conidia) occurred on a day of high humidity (>90%). Despite an
increase in the RH during this period, it failed to reach 90% and only a single rainy day was
recorded. The constant conidial release coincided with a combination of rain and an increase
in humidity during these days. Furthermore, wind (0.3 to 2.7 m s-1) also strongly promoted
* *

Results
107
conidial release, particularly for the dispersal of conidia on 31 August and 1 September. In
the following days, unfavourable weather conditions of frequently low humidity dominated,
coinciding with a low conidial release plateau. During this period, the leaf blight lesions
continued to expand with sporulation, reaching an infected leaf area of 30% (rated on 28
August). The next period of abundant conidia release occurred from 12 to 15 September,
where maximum peaks of 457 and 533 conidia were registered on 12 and 13 September,
respectively. On 12 September, a slight decrease in the RH coincided with spore release. On
13 and 14 September, wind, or wind combined with rain, corresponded with the peaks of
spore release and dispersal. An increase in the RH (>90%) was also observed. From 13 to
17 September, frequent rain and one day of high humidity (>90%) occurred. Days of strong
wind and high humidity occurred on the days thereafter, e.g. 17, 19 and 21 September, yet
very few conidia (between 4 and 62) were recorded. An abundant peak of spore release (497
conidia) occurred on 22 September, attributable to the heavy rain as the wind speed was
relatively low. After this period of high spore release, an infected leaf area of 46% was
recorded.

Results
108
Fig. 49. Seasonal fluctuations in conidia number and weather conditions in Göttingen in summer 2015:
average temperature and precipitation (above), wind velocity (centre) and average relative humidity
(below). ).*= missing data
*
*
*

Results
109
3.3.1.3. Comparisons based on climatic conditions, development of Turcicum leaf
blight and spore release between Inzing 2014 and Göttingen 2015
Based on the observations obtained from the spore release pattern, an outline of the different
climatic conditions which enhance the development and further sporulation until the spore
release described above in Inzing and Göttingen are summarised in Table 35. The latent
periods described became shorter after successive infection periods when the disease was
established in the field and the disease pressure was higher. Further considerations for the
length of the latent period are discussed in section 4.3.1.
Tab. 35. Overview of the decisive climatic conditions enhancing the development of the disease,
including sporulation and further conidial release in Inzing in 2014 compared with Göttingen in 2015.
Phenomen Environmental conditions enhancing the development
of Turcicum leaf blight related to the spore release
Inzing
Göttingen
(artificial inoculation)
Infection
+ sporulation
Low sporulation (early season):
successive periods of 96-100% RH
(at least 17 hours)
18-21°C
Massive sporulation (late season):
successive periods of 100% RH
(periods ranging between 69 to 121
hours) accompanied by rainy periods
(>4 days)
9-18°C
Infection:
at least 24 hours of 100% RH
Sporulation:
Low: 18 mm precipitation
High: ±3 days ≥ 90-95% RH
26 mm precipitation
15-18°C
Lesion expansion Low-moderate Outstanding
Favoured by a warm period of
28-30°C for lesion expansion
after establishment of the
infection
Latent period 7-14 days 6-14 days
Spore release
coincided with
Drastic increase and decrease in RH
Wind and/or rain
Drastic increase and decrease
in RH
Wind and/or rain
Spore spread Wind and/or rain Wind and/or rain

Results
110
3.3.2. Correlation of microscope counts and DNA yield for E. turcicum
Samples from Inzing and Göttingen were analysed via qPCR assay to evaluate DNA yields
of E. turcicum. Both molecular methods were evaluated and compared with the data
obtained from the traditional method of visual light microscopy (section 3.3.1).
3.3.2.1. Inzing
From the 90 samples obtained in Inzing, positive amplifications were obtained through qPCR
with the E. turcicum specific primer pair in 51% of the samples. An overview of the monitored
season in Inzing in 2014, with results from the qPCR assay compared to those of the visual
microscopy, is depicted in Figure 50.
Fig. 50. Seasonal fluctuations in conidia number of E. turcicum assessed via microscope and DNA
amount assessed via qPCR on spore trap tapes in Inzing 2014.
Through visual microscopy, the first E. turcicum conidia were detected on 8 July (2 conidia).
First detections through qPCR assay occurred two days later on 10 July (3.04 pg), where
seven conidia were counted by microscopy. Higher conidia quantities (x>10) were regularly
amplified through both methods. A low number of conidia (0<x≤10) were counted through
microscopic assessment in 48% of the samples (43/90), whereas only 47% (20/43) of these
samples were positive via qPCR assay. This was the case on 8 August, for example, where
six conidia were counted but no amplification was achieved through qPCR.
On the contrary, there were also samples for which DNA amplifications were registered via
qPCR assay despite the fact that no spores were visually detected through microscopy. An
example here is 2 September, where an amplification of 7.8 pg DNA was quantified via
qPCR yet no spores were visualised through microscopy. Of the 29 samples (32% of total) in
which no spores were registered through microscopy, positive amplifications via qPCR assay
were obtained for eight of them (28%).

Results
111
The first notable peak of conidial release determined through microscopic counts on 10
September (21 spores) coincides with the first notable DNA yield determined via qPCR
assay (87 pg). The highest peak achieved during the season was recorded on 25 September
through microscopy (248 conidia), whereas the maximum amplification of DNA occurred on
26 September (127 conidia).
The third seasonal fluctuation in spore numbers was recorded on 3 and 4 October for both
methods. While the highest number of conidia was recorded by microscopy on 3 October,
the highest DNA yield was detected on 4 October (495 pg).
According to the log linear model used (see section 2.7.1), we can assume a significant
(p<0.05) relation between DNA yield and the number of spores for the samples from Inzing
2014. At levels of up to 250 pg, it seems that the relation follows a more linear pattern, i.e. up
to about 85 spores (Figure 51). The average DNA yield (28.3 pg) obtained corresponds to 24
spores, i.e. 1.15 pg/ spore.
Fig. 51. Relation between number of E. turcicum spores estimated through microscopic counts and
DNA yield assessed via qPCR samples (p<0.05) for Inzing 2014. Red crosses (+) are observed pairs
of DNA concentration (qPCR) and the corresponding number of spores for each individual sample.
Blue triangles (Δ) are the estimates of DNA concentration and number of spores according to the
model equation.

Results
112
3.3.2.2. Göttingen
From the 70 samples obtained in Göttingen, positive amplifications were obtained through
qPCR with the E. turcicum specific primer pair in 67% of the samples.
Higher conidia quantities (x>10) were regularly amplified through both methods. The only
exception was two days (15 and 16 September) for which no DNA amplification was
achieved via qPCR. Low numbers (0<x≤10) of conidia were observed through microscopic
counts in 27% of the samples (24/70), while E. turcicum DNA (determined via qPCR) was
only detected on 42% (10/24) of these samples. Of the 12 samples (17% of total) in which no
spores were registered through microscopy, positive amplifications via qPCR assay were
obtained for five of them (42%). For example, on 15 August an amplification of 31 pg DNA
was quantified via qPCR yet no spores were visualised through microscopy.
An overview of the complete monitored season in Göttingen in 2015 is provided in Figure 52.
The first important spore release of the season occurred on 13 August with 44 spores,
corresponding to 240 pg DNA obtained via qPCR. Thereafter, four periods of abundant
sporulation were observed by microscopy: 17 to 23 August, 27 August to 2 September, 12 to
15 September and 22 September. These four seasonal fluctuations coincide with the periods
for which DNA amplification was successful via qPCR assay.
Fig. 52. Seasonal fluctuations in conidia number of E. turcicum assessed via microscope and DNA
amount assessed via qPCR on tapes in Göttingen in 2015.
During the first and second periods of abundant conidial release, the highest DNA
amplifications were detected on 17 August (662 pg) and 23 August (1768 pg), coinciding with
the highest peaks of conidia (122 and 411 per day, respectively) observed on these days by
microscopy.
For the third seasonal fluctuation (12-14 September), the highest peak of DNA amplification
was observed on 12 September via qPCR assay, while one day later (13 September) the
highest peak of spore release was recorded by microscopy. For the fourth seasonal

Results
113
fluctuation, a one-day peak on 22 September was recorded via both visual assessment and
qPCR.
According to the log linear model used (see section 2.7.1), we can assume a significant
relation between DNA yield and the number of spores for the samples from Göttingen 2015.
At levels of up to 1165 pg, it seems that the relation follows a more linear pattern, i.e. up to
about 175 spores (Figure 53). The average DNA content (353.67 pg) obtained corresponds
to 78 spores, i.e. 4.6 pg/ spore.
Fig. 53. Relation between number of E. turcicum spores estimated through microscopic counts and
DNA yield assessed via qPCR samples (p<0.05) for Göttingen 2015. Red crosses (+) are observed
pairs of DNA concentration (qPCR) and the corresponding number of spores for each individual
sample. Blue triangles (Δ) are the estimates of DNA concentration and number of spores according to
the model equation.

Results
114
3.3.3. Seasonal incidence of inoculum of K. zeae analysed via qPCR
In Ostenfeld, a total of 77 tapes were collected in 2013 and 84 tapes in 2014. In Göttingen,
the same samples analysed for E. turcicum (70 tapes) were also analysed for the presence
of K. zeae conidia.
Tapes from Göttingen in 2015 and Ostenfeld in 2013 were analysed through light microscopy
for K. zeae conidia but it was not possible to distinguish them from the numerous conidia of
other fungi registered daily on the vaseline tape samples. Therefore, only a range of tapes
from Ostenfeld in 2014 were analysed to check for K. zeae spores but the same difficulties
as in 2013 were encountered. Consequently, it was not possible to confirm the spore release
of K. zeae through light microscopy for any of the examined locations. Thus, only results
from the molecular analysis via qPCR, if successful, can be directly correlated with the
development of K. zeae in the field.
3.3.3.1. Ostenfeld
In 2014, it was not possible to detect DNA from the tape samples via qPCR. The infected leaf
area produced by Kabatiella eyespot remained under 1% until the beginning of September
(BBCH 75-79; fruit development) and a maximum infected leaf area of 3.7% was recorded
for the untreated control at the end of the season.
As shown in Figure 54, in 2013, only three DNA amplifications (4% of total samples) were
recorded via qPCR (16, 17, 28 September). DNA yields were lower than 1 pg day-1. The
three peaks of DNA amplification were detected when periods of frequent rain (at least 2-3
days) occurred on the days prior to the amplified peak. During August, while some periods of
high humidity and rain could have favoured sporulation, long periods of low humidity, a lack
of precipitation and moderate temperatures (17-18°C) could have simultaneously had a
counteracting effect. Symptoms of Kabatiella eyespot were only observable in some plants,
scattered inconsistently across the field, and DNA amplifications were not registered.
In the late season, the onset of cold weather was registered around 7 September. During this
month, the average temperature decreased to 13.1°C. On 11 September, a slight increase in
the infected leaf area (1.3%) compared with the first assessment at the beginning of August
(0.3%) could be recorded in the untreated control. Thereafter, on 16 and 17 September, first
peaks of DNA amplification were recorded, coinciding with a four-day rainy period. On 28
September, a low peak of DNA amplification was recorded after a four-day period of rain. By
2 October, when plants were at the ripening stage (BBCH 83-85), the infected leaf area in
the control had developed to 5.9%.

Results
115
Fig. 54. Seasonal fluctuations of K.zeae DNA yield and weather conditions in Ostenfeld in summer
2013: average temperature and precipitation (above), average relative humidity (centre) and wind
velocity (below).

Results
116
3.3.3.2. Göttingen
In Göttingen in 2015, DNA amplifications were only registered on 14 September (2 pg)
(Figure 55).
First lesions of Kabatiella eyespot were observed in the location seven days after inoculation
(on 20 July) and by the end of July the disease was widely distributed among plants. It was
not possible to observe sporulation on the leaves without incubating leaf samples in
conditions of high humidity in the laboratory. After a warm and dry period (until the beginning
of August), favourable weather conditions of heavy rainfall occurred in the middle and at the
end of August. A slight increase in the infected leaf area was registered on 28 August (6%
infection), but concentrations of K. zeae had yet to be amplified via qPCR. A further decrease
in the average temperature, starting from 2 September until 6 September, was recorded (15
to 11°C). Although high temperatures and low levels of humidity were recorded on 7
September, cool temperatures (11-13°C) were predominant on the days immediately
thereafter (8-12 September). On 14 September, the first amplification of K. zeae DNA yield
was registered (2 pg). This occurred within a period of frequent rain. Strong rain and wind are
correlated with spore release and dispersal on 14 September. A further decrease in the
average temperature combined with frequent periods of rain favoured the development of the
disease, which translated into an infected leaf area of 20% at the end of September. Further
amplification of DNA of K. zeae DNA were not registered via qPCR.

Results
117
Fig. 55. Seasonal fluctuations of K.zeae DNA yield and weather conditions in Göttingen in summer
2015: average temperature and precipitation (above), average relative humidity (centre) and wind
velocity (below).

Results
118
3.3.4. Detection through qPCR and sensitivity
In order to test sensitivity of the qPCR method, a range of annealing temperatures (64-68°C)
was tested, starting with the established temperature from the PCR assay (see section
2.5.7). The E. turcicum primer set could amplify E. turcicum DNA at the minimum level of 10
fg µl-1, even at the highest tested annealing temperature of 68°C. Considered positive
samples for K. zeae DNA could be detected at the minimum level of 100 fg µl-1 at melting
temperatures ranging from 64-68°C. Ct value (cycle threshold) for the lowest detected
standard concentration of E. turcicum (10 fg µl-1) was, on average, close to 33. Ct value for
the lowest detected standard concentration K. zeae (100 fg µl-1) was close to 31.
Analysing the obtained melting curve (Tm), amplifications of E. turcicum resulted in a narrow
symmetric single melting point curve, obtained at 86.5 °C (Figure 56, left). K. zeae DNA
amplifications resulted in two individual melting phases, one at 89°C and another close to
85°C (Figure 56, right).
Fig. 56. Melting curves obtained via qPCR method. Narrow symmetric single melting point curve
obtained at 86.5°C for E. turcicum (left). Double melting curve obtained for K. zeae at 85°C and 89°C
(right).
A second experiment was conducted directly from artificial spore trap tapes, which were
analysed for the lowest detectable quantities of conidia.
For E. turcicum, the qPCR method could detect a minimum of two to four conidia (0.06-0.1
pg µl-1), which corresponds to 6-10 pg of DNA per sample (a sample corresponds to 100 µl
TE). For K. zeae, DNA amplifications from artificial spore trap tapes amplified via qPCR were
considered to be positive at a minimum of 125 conidia.
Furthermore, with the artificial spore trap tapes, the relation between the number of spores
counted through microscopy and those obtained via qPCR was evaluated.

Results
119
According to the log linear model used (see section 2.7.1), we can assume a significant
relation (p<0.05) between DNA yield and the number of spores. At levels of up to 600 pg, it
seems that the relation follows a more linear pattern, i.e. up to about 300 spores (Figure 57).
The average DNA content (178.4 pg) obtained corresponds to 144 spores, i.e. 1.24 pg/spore.
Fig. 57. Relation between number of E. turcicum spores estimated through microscopic counts and
DNA yield assessed via qPCR samples (p<0.05) with artificial spore trap tapes. Red crosses (+) are
observed pairs of DNA concentration (qPCR) and the corresponding number of spores for each
individual sample (for range of 1-330 spores). Blue triangles (Δ) are the estimates of DNA
concentration and number of spores according to the model equation.
For K. zeae, according to the log linear model used (see section 2.5.7), we can assume a
significant relation between the number of K. zeae conidia in the range of 125-1000 and DNA
yield. At levels of up to 1.55 pg, it seems that the relation follows a more linear pattern, i.e. up
to about 719 spores (Figure 58). On average, the DNA content obtained (1.18 pg)
corresponds to 606 spores, i.e. 0.002 pg/ spore.

Results
120
Fig. 58. Relation between number of K. zeae spores estimated through microscopic counts and DNA
yield assessed via qPCR samples (p<0.05) with artificial spore trap samples. Red crosses (+) are
observed pairs of DNA concentration (qPCR) and the corresponding number of spores for each
individual sample (for range of 125-1000 spores; only positive samples according to the melting curve
and the threshold were considered). Blue triangles (Δ) are the estimates of DNA concentration and
number of spores according to the model equation.
3.3.5. Evaluation of specificity
With the purpose of testing the applicability of the protocol under natural conditions in the
field, the specificity of the primers JB585/586 for E. turcicum and JB616/JB618 for K. zeae
DNA was tested through PCR and qPCR.
Primer sets JB585/JB586 for E. turcicum and JB616/JB618 for K. zeae were tested against a
collection of 13 other fungi through PCR (Table 36). These organisms were selected due to
their airborne dispersal and presence in European maize fields, as well as in surrounding
field crops, or because they are genetically related to the target species being investigated.
The specificity test through PCR for the E. turcicum specific primer set resulted in
amplifications of the target organism E. turcicum and none of the 13 fungal non-target
species when the annealing temperature was increased from 55°C to 64°C. Primer set
JB616/JB618 selected for amplification of K. zeae DNA revealed additional amplifications of
the genetically related species K. caulivora at all annealing temperatures tested (55°C-65°C),
but not for the rest of the tested species. In this case, using higher annealing temperatures
did not help to improve specificity through PCR. This was because the amplification of the
K. zeae diagnostic amplicon was negatively affected.
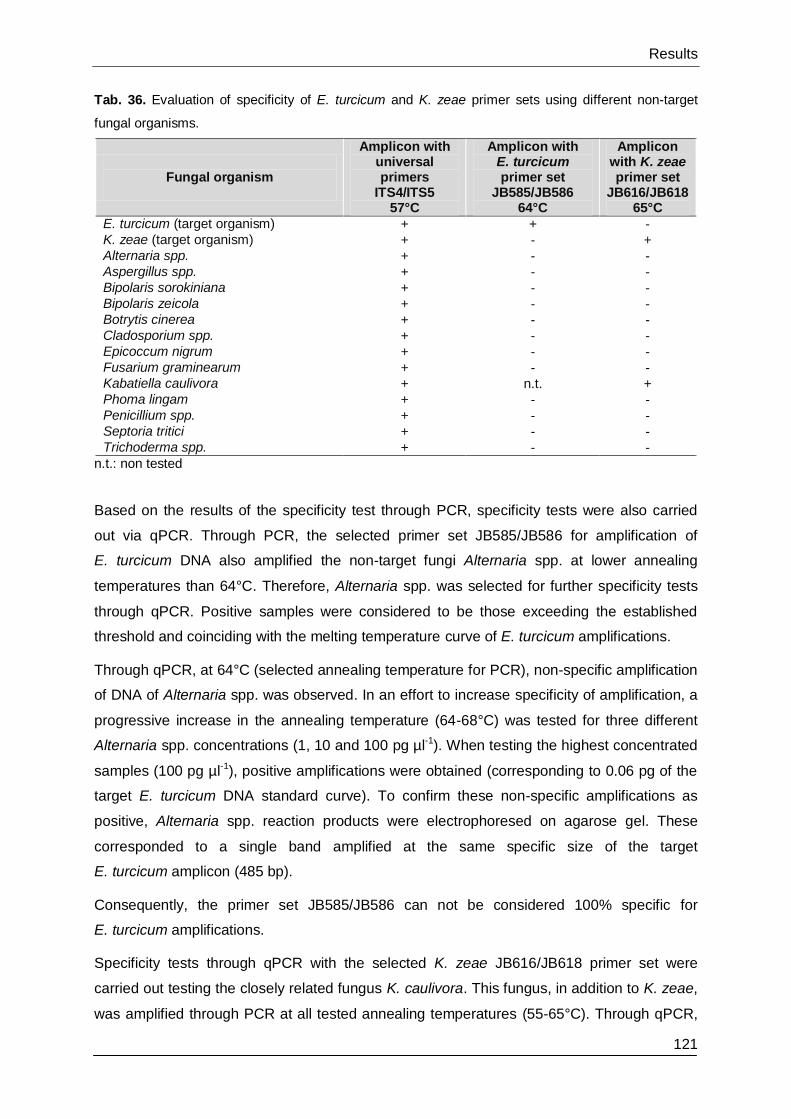
Results
121
Tab. 36. Evaluation of specificity of E. turcicum and K. zeae primer sets using different non-target
fungal organisms.
Fungal organism
Amplicon with universal primers
ITS4/ITS5 57°C
Amplicon with E. turcicum primer set
JB585/JB586 64°C
Amplicon with K. zeae primer set
JB616/JB618 65°C
E. turcicum (target organism) + + - K. zeae (target organism) + - + Alternaria spp. + - - Aspergillus spp. + - - Bipolaris sorokiniana + - - Bipolaris zeicola + - - Botrytis cinerea + - - Cladosporium spp. + - - Epicoccum nigrum + - - Fusarium graminearum + - - Kabatiella caulivora + n.t. + Phoma lingam + - - Penicillium spp. + - - Septoria tritici + - - Trichoderma spp. + - -
n.t.: non tested
Based on the results of the specificity test through PCR, specificity tests were also carried
out via qPCR. Through PCR, the selected primer set JB585/JB586 for amplification of
E. turcicum DNA also amplified the non-target fungi Alternaria spp. at lower annealing
temperatures than 64°C. Therefore, Alternaria spp. was selected for further specificity tests
through qPCR. Positive samples were considered to be those exceeding the established
threshold and coinciding with the melting temperature curve of E. turcicum amplifications.
Through qPCR, at 64°C (selected annealing temperature for PCR), non-specific amplification
of DNA of Alternaria spp. was observed. In an effort to increase specificity of amplification, a
progressive increase in the annealing temperature (64-68°C) was tested for three different
Alternaria spp. concentrations (1, 10 and 100 pg µl-1). When testing the highest concentrated
samples (100 pg µl-1), positive amplifications were obtained (corresponding to 0.06 pg of the
target E. turcicum DNA standard curve). To confirm these non-specific amplifications as
positive, Alternaria spp. reaction products were electrophoresed on agarose gel. These
corresponded to a single band amplified at the same specific size of the target
E. turcicum amplicon (485 bp).
Consequently, the primer set JB585/JB586 can not be considered 100% specific for
E. turcicum amplifications.
Specificity tests through qPCR with the selected K. zeae JB616/JB618 primer set were
carried out testing the closely related fungus K. caulivora. This fungus, in addition to K. zeae,
was amplified through PCR at all tested annealing temperatures (55-65°C). Through qPCR,

Results
122
three different K. caulivora DNA concentrations were tested (0.01, 1 and 10 pg µl-1). The test
resulted in non-specific DNA amplification of K. caulivora DNA at the previously established
temperature of 65°C through PCR. A further increase in the annealing temperature (65-68°C)
through qPCR resulted in non-specific amplifications, even at the highest annealing
temperature of 68°C for concentrations of 1 and 10 pg (corresponding to 0.04 and 0.28 pg of
the target K. zeae DNA standard curve, respectively). The non-specific amplification products
of K. caulivora DNA also correspond to the two individual melting phases (at 89°C and
another close to 85 °C) observed for K. zeae.
Consequently, the primer set JB585/JB586 can not be considered 100% specific for
K. zeae amplifications.

Results
123
3.4. Evaluation of disease control through fungicides
The development of the disease and the response of the plant to various fungicide
compounds and differences in timing of application were evaluated in four field experiments
in 2013 and 2014 under conditions of natural inoculum.
In 2013, Turcicum leaf blight and common rust were analysed in Mittich. In 2014 in Inzing,
only Turcicum leaf blight could be assessed due to the low pressure of common rust in the
location. In Ostenfeld, the development of Kabatiella eyespot could be evaluated in 2013 and
2014.
Results for the development of the diseases across the season are exhibited together with
the performance of the fungicide treatments applied at different stages. The development of
the disease on the leaves of the plant (L-2, L-1, L0, L+1, L+2) is also presented in order to
provide detailed information about the effect that the pathogen had on each one of these
leaves in the respective location. This parameter provides information on the dynamic of the
pathogen. This is important in the context of fungicide management in order to know which
zones of the plant are most vulnerable and consequently need to be treated.
An estimation of the destructive potential of the diseases was then carried out by comparing
the final yield of the non-treated control and treated plots. Here, yield reduction was
calculated for each percentage point increase in the disease.
3.4.1. Turcicum leaf blight and common rust in Mittich 2013
The first disease assessment was performed on 31 July (BBCH 65: flowering), 28 days after
the first fungicide application and 8 days after the penultimate treatment. On this date, the
first scattered lesions were observed in the location. Following this assessment, the
dispersion of the disease in the field was inhibited, delaying the second disease assessment
until an increase in the infected leaf area could be observed in the field. This ocurred on 5
September (BBCH 75-79: fruit development), 35 days after the first assessment. However, at
this stage significant differences in the infected leaf area among the non-treated control and
treated plots could not be observed. Twenty days after the second assessment, the final
disease assessment was performed (25 September; BBCH 85: ripening of the plant). At this
time, both early (at BBCH 32: stem elongation) and late fungicide applications (BBCH 63:
flowering) had a significant positive effect with respect to the non-treated control (8% infected
leaf area).
The mixture of epoxiconazole + pyraclostrobin applied at both stages, early (BBCH 32: stem
elongation) and late (BBCH 63: flowering), showed a higher efficacy (4.6% and 4.7%
reduction in infected leaf area, respectively) compared to the mixture propiconazole +

Results
124
azoxystrobin (3.0% and 3.6% reduction in infected leaf area, respectively). Concerning the
timing of applications using the same fungicide treatment, no significant differences were
observed for either mixture.
Fig. 59. Mittich 2013. E. turcicum infected leaf area on maize variety Zidane at three growth stages –
flowering, fruit development, ripening. Comparison of control and different fungicide applications at
different times. 32 (BBCH) = applied at vegetative stage (early application). 63 (BBCH) = applied at
flowering (late application). PROP= propiconazole; AZO= azoxystrobin; EPO= epoxiconazole; PYR=
pyraclostrobin; Least significance difference (LSD) according to Bonferroni test: LSD= 1.47 (p<0.05);
LSD= 1.64 (p<0.01).
Focusing on the development of the disease in the plant (LS means of each leaf position
from all treatments and the non-treated control), leaves L0, L-1 and L+1 showed a higher
infected leaf area (Figure 58). The ear leaf (L0) showed the highest infected area (6.2%),
followed by the leaves L-1 (5.0%) and L+1 (5.7%). Differences among these three leaves
were not significant. The upper leaf L+2 (4.3%) and the lower leaf L-2 (3.1%) showed the
lowest infected area. The upper (L+2) and the lower leaf (L-2) differ significantly (p<0.05
respectively) from L+1, L0 and L-1.

Results
125
Fig. 60. Mittich 2013. E. turcicum infected leaf area on maize variety Zidane according to the leaf
position on the plant at three growth stages - flowering, fruit development, ripening. L0= main ear leaf;
L-1 and L-2= two leaves below main ear leaf; L+1 and L+2= two leaves above main ear. Data
obtained from control and different fungicide applications sprayed at different times. Least significance
difference (LSD) according to Bonferroni test: LSD= 1.31 (p<0.05); LSD= 1.47 (p<0.01).
Below, Figure 61 shows that although the first pustules of common rust were observed at the
end of July, lesions around the pustules were not observed until the second assessment (5
September), and these represented less than 1% of the infected leaf area. In the next two
weeks, the infected leaf area increased to around 5.8% in the non-treated control, whereas in
the treated plots it remained below 3%. All treatments differed significantly from the non-
treated control (p<0.01). Comparing the fungicide treatments, these had no significant effect
when applied at the vegetative stage (BBCH 32). When applied at flowering (BBCH 63),
however, propiconazole + azoxystrobin provided significant disease control (4.6% reduction
in infected leaf area; p<0.01) compared to epoxiconazole + pyraclostrobin (2.9% reduction in
infected leaf area). Within the same treatment, significant differences between early and late
application could only be observed for the treatment propiconazole + azoxystrobin, where a
late application was more effective.

Results
126
Fig. 61. Mittich 2013. P. sorghi infected leaf area on maize variety Zidane at three growth stages –
flowering, fruit development, ripening. Comparison of control and different fungicide applications at
different times. 32 (BBCH) = applied at vegetative stage (early application). 63 (BBCH) = applied at
flowering (late application). PROP= propiconazole; AZO= azoxystrobin; EPO= epoxiconazole; PYR=
pyraclostrobin; Least significance difference (LSD) according to Bonferroni test: LSD= 0.95 (p<0.05);
LSD=1.06 (p<0.01).
Conclusions on the distribution of the infected leaf area on the plant (Figure 62) could only be
drawn from observations made in the final rating on 25 September (BBCH 85). There is a
slight upward trend from the lower leaves L-2 (1.3% infected leaf area) and L-1 (1.6%) to the
ear leaf (2.3%) and upper leaves L+1 (4%) and L+ 2 (5.6%). A significant difference between
the lower leaves (L-1 and L-2) and the upper leaves (L+1 and L+2) was observed (p<0.01).
Fig. 62. Mittich 2013. P. sorghi infected leaf area on maize variety Zidane according to the leaf
position on the plant at three growth stages - flowering, fruit development, ripening. L0= main ear leaf;
L-1 and L-2= two leaves below main ear leaf; L+1 and L+2= two leaves above main ear. Data
obtained from control and different fungicide applications sprayed at different times. Least significance
difference (LSD) according to Bonferroni test: LSD= 0.87 (p<0.05); LSD= 0.98 (p<0.01).

Results
127
3.4.2. Turcicum leaf blight in Inzing 2014
First Turcicum leaf blight symptoms were visible during the first rating on 7 August (BBCH
71: fruit development). Nevertheless, the disease did not develop further and in the second
assessment on 12 September, the infected leaf area was lower than 1% in both non-treated
and treated plots. At this time, the maize plants were at the end of the fruit development. On
8 October, an increase in the infected leaf area was observed, ranging from 2.4% to 2.8% in
the non-treated controls (with and without seed treatment, respectively). LSD analysis did not
show significant effects between the non-treated controls.
The mixture propiconazole + azoxystrobin at early application (BBCH 51: pre tassel, 10 July)
showed a lower, statistically significant (p<0.05) infected leaf area (1.2%) in relation to the
non-treated controls. This significant difference did not hold for the late application (1.4%) on
23 July (BBCH 65: flowering). Fluopyram + prothioconazole and epoxiconazole +
pyraclostrobin, both applied at early stage BBCH 51, did not significantly reduce the infected
leaf area with respect to the non-treated plots (1.4% & 2.4%, respectively).
Fig. 63. Inzing 2014. E. turcicum infected leaf area on maize variety NK Silotop at three growth stages
– flowering, fruit development, ripening. Comparison of control and different fungicide applications at
different times. 51 (BBCH)= applied at tasseling (middle-late application); 65 (BBCH)= applied at
flowering (late application). ST= applied seed treatment; PROP= propiconazole; AZO= azoxystrobin;
FLUO= fluopyram; EPO= epoxiconazole; PYR= pyraclostrobin. Least significance difference (LSD)
according to Bonferroni test: LSD= 1.1 (p<0.05); LSD=1.22 (p<0.01).

Results
128
In the last assessment on 8 October, the highest levels of severity were observed on the
upper leaf L+1 (3.3%), followed by leaves L0 (3.0%) and L+2 (2.9%) (Figure 64). Lower
leaves, L-1 and L-2, registered an infected leaf area of less than 1%. Separating the middle
(L0) and upper leaves (L+1 and L+2) from the lower leaves (L-1 and L-2) provided a
statistically significant difference.
Fig. 64. Inzing 2014. E. turcicum infected leaf area on maize variety NK Silotop according to the leaf
position on the plant at three growth stages - flowering, fruit development, ripening. L0= main ear leaf;
L-1 and L-2= two leaves below main ear leaf; L+1 and L+2= two leaves above main ear. Data
obtained from control and different fungicide applications sprayed at different times. Least significance
difference (LSD) according to Bonferroni test: LSD= 0.96 (p<0.05); LSD= 1.08 (p<0.01).
3.4.3. Kabatiella eyespot in Ostenfeld 2013 and 2014
In 2013, the first disease assessment was performed on 7 August (BBCH 63: flowering). At
this time, the first symptoms of Kabatiella eyespot were widespread in the location but
without significant differences among treated and non-treated plots according to the LSD test
as shown in Figure 65. In the second assessment, performed on 11 September (BBCH 79:
end of the fruit development), a slightly higher infected leaf area (1.3%) was recorded in the
non-treated variant, while the treated plots remained at an infected leaf area of less than 1%
(Figure 63). Nevertheless, the differences here were not significant. A third assessment was
carried out on 2 October (BBCH 83-85: ripening). At this point, the infected leaf area showed
differences among treatments, with the control reaching the highest value of 5.9%. This was
significantly different to all treatments (p<0.01). Among treated variants, the early season
application (BBCH 33: vegetative stage) was not as effective as later applications at
tasseling (BBCH 55) and flowering (BBCH 63). The early season application (BBCH 33:
vegetative stage) reduced the infected leaf area by 2.5%, whereas later applications at

Results
129
flowering (BBCH 55) and tasseling (BBCH 63) reduced the infected leaf area by 4.3% and
5.3%, respectively.
Fig. 65. Ostenfeld 2013. K. zeae infected leaf area on maize variety Ronaldinio at three growth stages
– flowering, fruit development, ripening. Comparison of control and different fungicide applications at
different times. 33 (BBCH)= applied at vegetative stage (early application); 55 (BBCH)= applied at
tasseling (middle-late application); 63 (BBCH)= applied at flowering (late application). PROP=
propiconazole; AZO= azoxystrobin; FLUO= fluopyram; PROT= prothioconazole CAR= carbendazim
FLUS= flusilazole. Least significance difference (LSD) according to Bonferroni test: LSD= 1.1
(p<0.05); LSD= 1.22 (p<0.01).
As shown in Figure 66, in the first and second assessments on 7 August (BBCH 63:
flowering) and 11 September (BBCH 79: end of the fruit development), respectively, the
infected leaf area remained under 1% and did not differ significantly among leaf positions.
The infected leaf area was slightly higher in the lower leaves (L-2 & L-1). By the last
assessment on 2 October, the disease had spread to the upper leaves L+1 and L+2. These
leaves exhibited a slightly higher infected leaf area (2.4-3.2%). The infected leaf area on the
upper leaf L+2 was significantly different from leaf L-2, L-1, L0 (p<0.01) and L+1 (p<0.05).

Results
130
Fig. 66. Ostenfeld 2013. K. zeae infected leaf area on maize variety Ronaldinio according to the leaf
position on the plant at three growth stages - flowering, fruit development, ripening. L0= main ear leaf;
L-1 and L-2= two leaves below main ear leaf; L+1 and L+2= two leaves above main ear. Data
obtained from control and different fungicide applications sprayed at different times. Least significance
difference (LSD) according to Bonferroni test: LSD= 0.79 (p<0.05); LSD= 0.89 (p<0.01).
In 2014, in the first and second disease assessments on 12 August (BBCH 65; flowering)
and 4 September (BBCH 75, fruit development), respectively, the infected leaf area produced
by Kabatiella eyespot remained under 1% for all treatments and significant differences
among treated variants and the non-treated control were still not observable, as shown in
Figure 67. After two weeks, on 17 September (BBCH 85: beginning of the ripening), an
infected leaf area of 3.7% was achieved in the non-treated control. Compared to the non-
treated control, all the applied treatments significantly reduced the infected leaf area but no
significant differences were obtained among different treatments. Large differences between
repetitions (blocks) were recorded, reflected by the large LSD range.

Results
131
Fig. 67. Ostenfeld 2014. K. zeae infected leaf area on maize variety Kalvin at three growth stages –
flowering, fruit development, ripening. Comparison of control and different fungicide applications at
different times. 32 (BBCH)= applied at vegetative stage (early application); 55 (BBCH)= applied at
tasseling (middle-late application); 63 (BBCH)= applied at flowering (late application). PROP=
propiconazole; AZO= azoxystrobin; Least significance difference (LSD) according to Bonferroni test:
LSD= 2.64 (p<0.05); LSD= 2.98 (p<0.01).
Although no significant differences were observed at the three assessed stages across the
season, the disease was slightly more prevalent in the ear and upper leaves in the final
disease assessment (Figure 68).
Fig. 68. Ostenfeld 2014. K. zeae infected leaf area on maize variety Kalvin according to the leaf
position on the plant at three growth stages - flowering, fruit development, ripening. L0= main ear leaf;
L-1 and L-2= two leaves below main ear leaf; L+1 and L+2= two leaves above main ear. Data
obtained from control and different fungicide applications sprayed at different times. Least significance
difference (LSD) according to Bonferroni test: LSD= 1.40 (p<0.05); LSD= 1.57 (p<0.01).

Results
132
3.4.4. Effect of fungicide treatments on yield in Mittich 2013 and Inzing 2014
In 2013 in Mittich, although significant differences were observed in the infected leaf area
among treated and non-treated plots, none of the fungicides provided significant benefits to
the yield compared with the non-treated control (Figure 69). Although statistically non-
significant, all treatments had a slightly positive effect on yield compared to the non-treated
control, except for epoxiconazole + pyraclostrobin applied at BBCH 32, which had a lower
yield than the control. High data variation was observed among repetitions within the same
treatment.
Fig. 69. Mittich 2013. Mean maize grain yield of variety Zidane. Comparison of control and different
fungicide applications sprayed at different times to control Turcicum leaf blight. PROP =
propiconazole; AZO= azoxystrobin; EPO= epoxiconazole; PYR= pyraclostrobin; 32 (BBCH)= applied
at vegetative stage (early application). 63 (BBCH)= applied at flowering (late application). Error bars
(p<0.05) represent the Bonferroni’s standard error.
In 2014, no significant difference between the control with and without seed treatment was
observed (Figure 70). Furthermore, no significant effects were observed between the two
non-treated variants (control, control + seed treatment) and all fungicide applications.
Nevertheless, the application of propiconazole + azoxystrobin at flowering (BBCH 65)
obtained a significantly higher yield compared to the non-treated control without seed
treatment, increasing the average grain yield by approx. 15 dt/ha.

Results
133
Fig. 70. Inzing 2014. Mean maize grain yield of variety NK Silotop. Comparison of control and different
fungicide applications sprayed at different times to control Turcicum Leaf Blight. ST= applied seed
treatment; PROP= propiconazole; AZO= azoxystrobin; FLUO= fluopyram; EPO= epoxiconazole;
PYR= pyraclostrobin. 51 (BBCH) = applied at tasseling (middle-late application); 65 (BBCH)= applied
at flowering (late application). Error bars (p<0.05) represent the Bonferroni’s standard error.
3.4.5. Effect of fungicide treatments on yield in Ostenfeld 2013 and 2014
In 2013 in Ostenfeld, fungicide treatments applied at tasseling (BBCH 55) and flowering
(BBCH 63) resulted in higher yields compared with the non-treated control (Figure 71). With
respect to the control (192.8 dt/ha), propiconazole + azoxystrobin applied at flowering
provided the highest yield (213 dt/ha), with an approximate increase of 20 dt/ha (10%).
Conversely, the same mixture (propiconazole + azoxystrobin) applied at the vegetative stage
(BBCH 55) yielded 12 dt/ha less (201 dt/ha). No increase in yield with respect to the control
was observed when propiconazole + azoxystrobin was applied at the early vegetative stage
BBCH 33. Fluopyram + protioconazole and carboxamin + flusilazole, both applied at
BBCH 55, increased the yield by approx. 7 dt/ha (4%) and 14 dt/ha (7%), respectively.
Significant effects among treatments and with respect to the control were not observed. High
data variation was observed among repetitions within the same treatment.

Results
134
Fig. 71. Ostenfeld 2013. Mean maize grain yield of variety Ronaldinio. Comparison of control and
different fungicide applications sprayed at different times to control Kabatiella eyespot. PROP=
propiconazole; AZO= azoxystrobin; FLUO= fluopyram; PROT= prothioconazole CAR=carbendazim
FLUS= flusilazole. 33 (BBCH)= applied at vegetative stage (early application); 55 (BBCH)= applied at
tasseling (middle-late application); 63 (BBCH)= applied at flowering (late application). Error bars
(p<0.05) represent the Bonferroni’s standard error.
In 2014, biomass yield in the non-treated control was not significantly different from the
fungicide treatments (Figure 72). An increase in the yield (3 dt/ha) was only obtained with the
application of propiconazole + azoxystrobin applied at BBCH 55 (219 dt/ha).
Fig. 72. Ostenfeld 2014. Mean maize grain yield of variety Kalvin. Comparison of control and different
fungicide applications sprayed at different times to control to control Kabatiella eyespot. PROP=
propiconazole; AZO= azoxystrobin. 32 (BBCH) = applied at vegetative stage (early application); 55
(BBCH)= applied at tasseling (middle-late application); 63 (BBCH)= applied at flowering (late
application). Error bars (p<0.05) represent the Bonferroni’s standard error.

Results
135
3.4.6. Statistical correlation between yield and disease
Inzing 2014
The data for Inzing 2014 (Figure 73) showed a significant negative effect of the infected leaf
area on yield (p<0.05). The negative regression reveals that for each percentage point
increase in the infected leaf area, a yield loss of 1.59 dt/ha occurs, on average. The 95% CI
indicates that the yield reduction could fall within the range of -0.02 to -3.15 dt/ha.
Fig. 73. Relationship between yield and infected leaf area with Turcicum leaf blight on maize variety
NK Silotop in Inzing 2014. *Linear model significant (p<0.05). ▬ = regression (144.8 -1.59x). ▬ = 95%
confidence limits. •= observations (n=24) from yield (y) and corresponding percentage of leaf area
infected (x) per plot in the trial.
Mittich 2013
Although common rust was also present, only the effect of the Turcicum leaf blight was
considered for the regression analysis for yield losses (Figure 74). The reasoning here is that
the formation of Turcicum leaf blight lesions on the leaf was much greater and common rust
was of secondary importance in terms of damage. Although a similar infected leaf area was
recorded for both diseases in accordance with the different scales used to carry out the
rating in the field, 6% of common rust is not comparable to 6% of Turcicum leaf blight due to
the large difference in the size of the lesions. Nevertheless, a negative relationship between
yield and infected leaf area could not be confirmed, possibly due to the high yield data
variation. The regression coefficient of 0.2 implies the infected leaves actually had a positive
effect on yield. This is counterintuitive. However, taking the lower 95% CI limit of the
regression coefficient “– 1.95 (red dotted line)”, we might assume a negative influence.

Results
136
Fig. 74. Relationship between yield and infected leaf area with Turcicum leaf blight on maize variety
Zidane in Mittich 2013. ns= linear model was not significant. •••= regression (114.12 + 0.20x).
•••= lower limit of confidence interval (95%), which shows a negative influence •= computed
observations (n=19) from yield (y) and corresponding percentage of leaf area infected (x) per plot in
the trial.
Ostenfeld 2013
The tendency of a negative relation between yield and infected leaf area was found (Figure
75). The regression coefficient, with a p-value of 0.15, carries a certainty of 85%, but not
95%. At this lower level of significance, there might be a certain degree of yield loss
occurring between the range of 1.18 and 2.8 dt/ha per percentage point of infected leaf area.
The red dotted line indicates the upper 95 % CI limit of the regression coefficient.

Results
137
Fig. 75. Relationship between yield and infected leaf area with Kabatiella eyespot on maize variety
Ronaldinio in Ostenfeld 2013. ns= linear model not significant. •••=regression (204.39 -1.18x) •••=
upper limit of confidence interval (95%), which shows a negative influence •= computed observations
(n=20) from yield (y) and corresponding percentage of leaf area infected (x) per plot in the trial.
Ostenfeld 2014
The number of data and their distribution do not permit a conclusion to be drawn about the
relation between yield and infected leaf area. According to the linear regression, the disease
did not have any influence on yield. The obtained certainty of p>0.2 for the regression
coefficient and the corresponding CI limit states that there was no effect of diseased leaves
on the yield.
Fig. 76. Relationship between yield and infected leaf area with Kabatiella Eyespot on maize variety
Ronaldinio in Ostenfeld 2013. ns= linear model not significant. •••=obtained regression (216.9 + 1.11x)
•••= upper limit of confidence interval (95%), which shows a negative influence •= computed
observations (n=15) from yield (y) and corresponding percentage of leaf area infected (x) in the trial.

Results
138
3.4.7. Theoretical thresholds
As part of the control strategy with fungicides, economic damage thresholds are used to
establish the lowest severity level of the disease (% infected leaf area) that will cause
economic damage, i.e. the point at which the cost of fungicide application is equal to the
expected economic loss caused by the respective leaf disease at a certain percentage of
infected leaf area. Thus, if the economic losses associated with a certain percentage of
infected leaf area are higher than the cost of fungicide application, an application would be
economically justified. As shown above, a negative correlation between disease and yield
only occurred in Inzing in 2014 for E. turcicum and in Ostenfeld in 2013 for K. zeae, of which
only Inzing 2014 was statistically significant (p>0.05). Therefore, the economic threshold was
only calculated for these two experiments. Data for the calculation are summarised in Table
37.
Tab. 37. Data for calculation of economic thresholds for fungicide application
Price of silage maize* 32 €/t
Price of grain maize* 160 €/t
Cost of fungicide application** 67.5 €/ha
Loss per 1% infected leaf area of E. turcicum 1.59-3.15 dt/ha (0.159-0.315 t/ha)
Loss per 1% infected leaf area of K. zeae 1.18-2.80 dt/ha (0.118-0.280 t/ha)
* Maize price in regions with high technological production (actual market rate April 2016)
** Fungicide application Quilt Excel (azoxystrobin + propiconazole)= 52 €/ha.
Agricultural labour costs: 13.50 €/ha. (Tractor, sprayer and driver remunerations)
Fuel: 2 €/ha (Agricultural Chamber Nordrhein-Westfalen 2015).
In order to calculate the threshold, the average and maximum possible yield losses (dt/ha)
obtained from the confidence intervals in the regression analysis for Inzing 2014 and
Ostenfeld 2013 were taken. The average and maximum values allowed a calculation of two
possible thresholds, where the maximum represents the upper limit of the confidence
interval, i.e. the highest value within a range of possible outcomes. It should be noted that
taking the minimum value (lower limit) for yield losses, i.e. the lowest value within a range of
possible outcomes, would lead to yield losses which are equal or very close to zero. This
would imply that no fungicide application is necessary and does not allow a threshold to be
calculated.
These average and maximum values for yield losses were converted into t/ha and multiplied
by the product price in order to estimate the monetary loss per 1% of infected leaf area. Note
that the product price depends on the type of maize used in the respective locations, i.e.
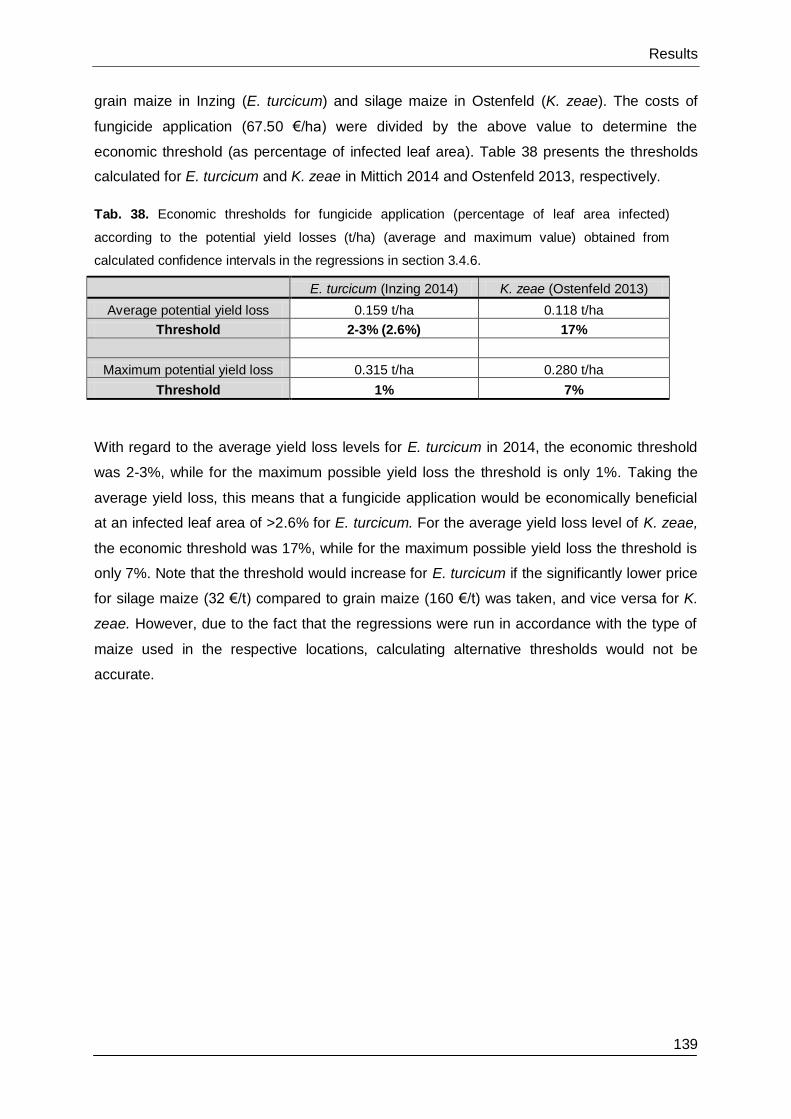
Results
139
grain maize in Inzing (E. turcicum) and silage maize in Ostenfeld (K. zeae). The costs of
fungicide application (67.50 €/ha) were divided by the above value to determine the
economic threshold (as percentage of infected leaf area). Table 38 presents the thresholds
calculated for E. turcicum and K. zeae in Mittich 2014 and Ostenfeld 2013, respectively.
Tab. 38. Economic thresholds for fungicide application (percentage of leaf area infected)
according to the potential yield losses (t/ha) (average and maximum value) obtained from
calculated confidence intervals in the regressions in section 3.4.6.
E. turcicum (Inzing 2014) K. zeae (Ostenfeld 2013)
Average potential yield loss 0.159 t/ha 0.118 t/ha
Threshold 2-3% (2.6%) 17%
Maximum potential yield loss 0.315 t/ha 0.280 t/ha
Threshold 1% 7%
With regard to the average yield loss levels for E. turcicum in 2014, the economic threshold
was 2-3%, while for the maximum possible yield loss the threshold is only 1%. Taking the
average yield loss, this means that a fungicide application would be economically beneficial
at an infected leaf area of >2.6% for E. turcicum. For the average yield loss level of K. zeae,
the economic threshold was 17%, while for the maximum possible yield loss the threshold is
only 7%. Note that the threshold would increase for E. turcicum if the significantly lower price
for silage maize (32 €/t) compared to grain maize (160 €/t) was taken, and vice versa for K.
zeae. However, due to the fact that the regressions were run in accordance with the type of
maize used in the respective locations, calculating alternative thresholds would not be
accurate.

Discussion
140
4. Discussion
Despite the increase in the acreage of maize in Central Europe in recent years, there
continues to be a lack of knowledge about associated fungal pathogens and their increasing
presence in the region’s maize fields. A monitoring of fungal maize leaf diseases in selected
Central European regions was therefore deemed necessary to gain a greater understanding
of the occurrence and severity of these diseases and the climatic conditions that determine
their epidemiological pattern.
Based on the level of severity and the timing of the appearance of the disease, decisions can
be made about the application of fungicides. As results in this work and related studies have
confirmed, diseases such as Kabatiella eyespot and Turcicum leaf blight have the potential
to cause yield losses. In this case, the application of fungicides can be an effective control
method. The possible reasons for differences among variants of treated and untreated plots
in the field trials carried out in this work are discussed here, as well as decisions regarding
timing of application and the suitability of fungicide applications in relation to disease
severity. The potential economic benefits of fungicide application and the calculation of
thresholds are also evaluated. Of course, decisions regarding fungicide application should be
considered within an integrated management of the disease, where decisive epidemiological
factors such as inoculum pressure correlated with climatic conditions in the field need to be
considered. This is discussed based on the results obtained via spore trapping in three
locations. Potential latent periods are also looked at in greater depth in this context.
4.1. Occurrence of leaf pathogens on maize in Central Europe
4.1.1. Monitoring and prevalence of diseases in 2012 and 2013
Main diseases E. turcicum and K. zeae
The maize leaf spot pathogens Exserohilum turcicum and Kabatiella zeae dominated across
the different monitored regions and are the causal agents of the Turcicum leaf blight and
Kabatiella eyespot.
E. turcicum is described in the literature to be most damaging at temperatures varying
between 18 and 27°C, with an optimum of 20-25°C (Berger 1970, White 2010). This
correlates with the observations made during the monitoring in 2012 and 2013, where the
main regions in which E. turcicum is widespread are situated in southern Germany (Bavaria,
alpine foreland), northern Austria (alpine foreland) and southern France8. In these regions,
8 Southern France was not visited but information was obtained via observations from Mainka (2012, pers.
comm., September).
Discussion
141
higher temperatures are recorded in summer compared with northern regions of Germany
(Schleswig-Holstein, northern part of Lower Saxony), where plants infected with E. turcicum
were scattered.
The other main pathogen, K. zeae, was found to be widespread in northern regions of
Germany (Schleswig-Holstein, northern part of Lower Saxony) and the Netherlands due to it
being favoured by lower temperatures (14-17°C) (Reifschneider & Arny 1980a). Thus, the
temperature is the decisive factor which separates the regional occurrence of these two main
pathogens. Both pathogens also need extended periods of high humidity for their
development, and while it is of secondary importance in relation to the temperature, it
remains essential.
The interaction between climatic conditions and E. turcicum and K. zeae will be analysed in
greater depth in section 4.3.
Phoma spp.
Several pathogenic and saprophytic Phoma species, or other pathogens related to this
genus, can occur on maize. In this work, morphological analyses revealed different Phoma
species. Further molecular analysis could not provide sufficient information to confirm the
species of most of the obtained isolates. Furthermore, three representative isolates, 13.2B
(considered saprophytic), 12.20 (pathogenic) and 12.13 (saprophytic) were sent to the CBS-
KNAW Fungal Diversity Center in Utrecht for molecular analysis. Following these analyses
and comparisons with internal sequence databases, the three isolates were confirmed as
three putative new species within the genus Peyronellaea (syn. Didymella; anamorph related
to the genus Phoma).
Prior to this, a first attempt to accurately identify these species turned out to be difficult due to
the numerous micromorphological characters of Phoma species which had to be taken into
account. A comparison of these morphological features with descriptions in the literature was
not very helpful either. This is probably because Phoma species tend to vary greatly among
different in vitro growth conditions (Aveskamp et al. 2010), making morphological
comparisons extremely difficult for some species.
Pathogenic Phoma spp.
The lesions formed by the pathogenic isolates analysed in this work were very similar to
those described for Ph. zeae-maydis in the literature (Arny & Nelson 1971; Punithalingam
1990; White 2010) and those produced by the isolate Ph. zeae-maydis (CBS 586.95) in the
greenhouse after spray inoculations. Nevertheless, micromorphological observations
revealed differences between Ph. zeae-maydis (CBS 586.95) and the pathogenic isolates
obtained during the monitoring.

Discussion
142
In Phoma spp., conidial shape and size are considered to be two of the most useful
parameters for identification up to species level (Aveskamp et al. 2008). The size of the
spores of Ph. zeae-maydis (CBS 586.95) is much larger when compared with other species.
In fact, until reclassification by Aveskamp et al. (2010) and Chen et al. (2015), it was
classified within Phoma section Macrospora. Species included in this section are
characterised by the production of large conidia, both in vivo and in vitro (Boerema et al.
2004). According to the first description of Ph. zeae-maydis by Arny & Nelson (1971) (at the
time as Phyllosticta maydis), while the spore size could vary considerably between 8-20 x 3-
7.5 µm, most spores fell within the range of 12-15 x 4-6 µm. These measurements clearly
represent larger conidia than those of the pathogenic strains isolated in this work (4.1-7.9 x
1.5-3.2 µm).
Variations in morphological characters can occur in Phoma spp., depending on the in vitro
culture conditions (Boerema et al. 2004). Therefore, in vivo descriptions may resemble the
initial morphology of fungi more accurately. Due to the large amount of Phoma isolates
obtained during the monitoring and the extensive descriptions required for identification, an in
vivo description was impractical. Thus, whether or not a variation in spore size could have
occurred was not investigated further. Nevertheless, the in vitro descriptions for the
pathogenic reference isolate Ph. zeae-maydis (CBS 586.95) coincided with those described
in the literature in vivo by Arny & Nelson (1971) and by Punithalingam (1990). This is an
indication that conidia of Ph. zeae-maydis also remain characteristically large under in vitro
conditions.
Further Phoma species occurring on maize for which a smaller conidia size is reported are
not extensively described in the literature. One of these species, Phoma zeae (described as
Phyllosticta zeae), was described by Stout (1930) from samples collected in Illinois (USA).
The size for conidia of Ph. zeae (4.5-7.5 x 2-3.5 µm) described by Stout (1930) matches
those obtained from our isolates. On the contrary, the shape of the conidia differs. Although
pathogenicity tests are not reported, the symptoms described by Stout (1930) are similar to
those described for Ph. zeae-maydis. This species has also been reported in the Czech
Republic (Saccas 1952, Cejp 1967 cited by Arny & Nelson 1971) and Romania (cited by
Scheifele & Nelson 1971). McFeeley (1971) and Frezzi (1972) also considered Ph. zeae (at
that time Phyllosticta zeae) as causal agent of the yellow leaf blight on maize in Ohio, USA
and Argentina, respectively. However, Frezzi (1972) mentions that although descriptions of
the lesions and other observations coincided with those described by Stout (1930) for
Ph. zeae, the spores were larger in size (8 8 to 16.5 x 3,5 to 8.5 µm). Thus, this report still
causes some confusion. It is therefore possible that the Phoma described by Frezzi (1972)
was, in fact, the new pathogen Ph. zeae-maydis described by Arny and Nelson (1971)
months earlier, which had a greater conidial size. A further mention about the presence of

Discussion
143
Phyllosticta zeae G.L. Stout (later classified in the genus Phoma) was recently updated in a
checklist of Phyllosticta species in China (Zhang et al. 2015). The descriptions and size of
the conidia for the specimen studied (4 to 7 x 2 to 2.6 µm) were similar to our isolates.
A further Phoma species reported on maize by Stout (1930), which is also similar in shape
and size to some of the isolated samples in this work, is Ph. zeicola (Ellis & Everh.).
Unfortunately, only descriptions for the size and shape are given by the author (similar to
those described for Ph. zeae). Further comparisons were therefore not possible. Confirming
whether the pathogenic Phoma isolates correspond to the description of Ph. zeae or
Ph. zeicola will be difficult to prove because specimens of these species are not easily
accessible and DNA sequences are not available in the sequence databases.
In the monitoring, pseudothecia resembling those from Mycosphaerella zeae-maydis. (syn.
Didymella maydis) described by Mukunya & Boothroyd (1973) were also found in one
location. This teleomorph corresponds with the anamorph Ph. zeae-maydis. This fact would
support the initial hypothesis that the pathogen corresponds to Ph. zeae-maydis, although
molecular analysis contradicted this.
Other related teleomorphs for similar Phoma species on maize have been also reported in
the literature such as M. zeicola, (Stout 1930), M. maydis (Pass.) Lobik, and M. zeae (Sacc.)
(Mukunya & Boothroyd 1973).
Additional pathogenic Phoma-related species reported on maize such as the possible
disease complex Phaeosphaeria maydis and Ph. sorghina (syn. Epiccocum sorghinum) were
disregarded. These differ from the descriptions of symptoms and morphological
characteristics given in this work and are mostly reported in tropical regions (Do Amaral
2004; Gonçalves et al. 2013).
Non-pathogenic Phoma species
In this work, Phoma species which were considered non-pathogenic on maize such as
Ph. pomorum (syn. Didymella pomorum), Ph. subherbarum (syn. D. subherbarum),
Ph. glomerata (syn. D. glomerata) and Ph. tropica (syn. Allophoma tropica) are also reported
to be present on maize (Payak et al. 1987; De Gruyter et al. 1993; Demirci & Kordali 2000;
Cervelatti et al. 2002; Sørensen et al. 2010). While the representative isolate 12.13 (this also
implies isolates similar to 12.13) is very similar to Ph. subherbarum, this species is only
reported in North and South America. Furthermore, the analyses by the CBS confirmed that
isolate 12.13 does not correspond to either of these species or any of the others mentioned.
Isolates 12.36 and 12.37 show very similar in vitro characters to Phoma pomorum isolate
CBS (838.84). This coincides with the molecular analysis carried out in this work, where both

Discussion
144
isolates (12.36 and 12.37) showed 100% similarity with Phoma pomorum. Phoma pomorum
was reported to be isolated from Danish maize by Sørensen et al. (2010).
Due to the high diversity of Phoma species occurring on maize confirmed in this work, further
phylogenetic and possibly in vivo morphological analyses are required. These are necessary
in order to discover related species of the putative new species and clarify the Phoma
complex (Didymella complex) of unidentified pathogenic and saprophytic species occurring in
maize. This clarification could be helpful in understanding more about the phytosanitary state
of maize in Central European regions, the importance of the Phoma spp., and comparisons
with other maize-growing regions worldwide.
Bipolaris zeicola
The pathogen was found on a scattering of plants in northern and southern locations. Due to
limited distribution of the pathogen across all locations, it was not possible to establish a
primary region of occurrence. A race 3 isolate was found in central Czech Republic
(characterised by a warm and dry climate in summer). Other isolates which produced similar
spots to those described for race 2 were found in several locations with differing climatic
conditions, e.g. southern and northern Germany and the Netherlands.
According to the literature, optimal temperatures favouring race 3 are generally cool,
evidenced by several reports from regions with cool and mild temperatures in the summer
(White 2010; Liu et al. 2015). In contrast, races 1 and 2 favour warm conditions (White
2010). This could not be confirmed, however, as race 2 was found in several locations with
differing climatic conditions such as southern and northern Germany and the Netherlands.
Unlike other races or pathotypes of B. zeicola, the virulence and increased prevalence of
race 3 has been observed in temperate regions (Xiao et al. 1992; Welz et al. 1993; Zitter
2012), as well as recently being considered an important limiting factor to corn production in
hilly and mountainous areas of China (Liu et al. 2015). This race produces host-selective
toxins called BZR-cotoxins I-IV, which facilitate the colonisation of the plant tissue and make
it the determinant factor of virulence and host selectivity (Xiao et al. 1992). B. zeicola race 3
is also reported to be of pathogenic importance in rice plantations (Xiao et al. 1991), which is
another example of the importance of its virulence.
The importance of race 3 in the literature coincides with the results of the pathogenicity test
in the greenhouse, where the isolate described as race 3 showed the highest virulence of all
isolates tested. It was able to cover large areas of the leaf tissue with long lesions, which led
to an early ripening of the leaves that other isolates could not produce.
Discussion
145
B. zeicola is considered to behave more prevalently as necrotroph than other Bipolaris spp.,
sporulating abundantly until maturing of the leaf tissue (White 2010). This could also explain
the importance of the pathogen as a saprophyte but not as a main pathogen in the regions.
Two other Bipolaris spp. were found in leaves originating from the Czech Republic. These
could not be classified as B. zeicola because their morphological characteristics differed in
vivo and in vitro. Some authors (Hooker et al. 1973; Levic & Pencic 1980) have reported that
the medium could have an effect on the conidial morphology of new pathotypes of B. zeicola,
and atypical conidia of B. zeicola could be formed in agar. In this study, spores were similar
when isolated from initial leaves and the in vitro medium. These Bipolaris spp. isolates were
able to infect maize leaves and produce some tiny chlorotic spots which developed into
lesions. In terms of virulence, however, these isolates were less virulent than the isolates
confirmed as B. zeicola. Therefore, the behaviour of these Bipolaris spp. could be
predominantly saprophytic and remain less virulent than B. zeicola. Further comparisons
between these Bipolaris spp. and B. zeicola with different hybrid varieties and lines of maize
under controlled climatic conditions are necessary to confirm this.
A confirmation of the species of these two isolates was not possible through morphological
analysis. Besides B. zeicola, several Bipolaris spp. are reported to be pathogenic on maize.
Parallel to B. zeicola, the most important is B. maydis (White 2010; Singh & Srivastava
2012). Based on the descriptions for B. maydis by White (2010), this possibility was
disregarded due to the clearly distinguishable leaf symptoms of Bipolaris maydis (elongated
or oval, pale lesions delimited along the veins) and its morphology (increased width and
length of up to 160 µm) and more pronounced curvature compared to B. zeicola, which
sometimes stretches out towards the bottom, resembling a long tail. The unidentified conidia
are smaller and darker than B. zeicola and mostly not curved.
Other Bipolaris spp. which are less frequent, but also described in the literature as producers
of typical spot blotch symptoms on maize leaves, are B. spicifera (Mendes et al. 1998; Li et
al. 2016) and B. sorokiniana (Iftikhar et al. 2009). Although the spores of
B. spicifera are smaller (15-32 x 9.9 -12.4) (Li et al. 2016) than those of B. zeicola (25-100 x
7-18 µm) (White 2010) and lighter in colour towards the terminal cells, resembling the
unidentified isolates, other parameters such as three-septate, rounded ends and clustering of
the conidia (resembling the form of a bottlebrush) in B. specifera (Navi et al. 1999) exclude
this pathogen as a causal agent. B. sorokiniana, in contrast, exhibits more similar
characteristics to both unidentified isolates (12.8 and 12.9), including curved or straight,
conidia shape, black and bright to brown olivaceous in colour, with a characteristically
spindle-shaped form, terminal and subhyaline cells (Warham et al. 1997).

Discussion
146
Further morphological and pathological comparisons with confirmed B. sorokiniana isolates
from the same regions, but possibly isolated from different crops, could provide more
information. Nevertheless, the possibility of other Bipolaris species affecting maize leaves
cannot be ruled out. Due to the high number of Bipolaris spp. described in the literature,
molecular analysis could more accurately identify the species.
P. sorghi
During the monitoring, P. sorghi was observed in Holland, central Germany and Eastern
Europe (Poland, Czech Republic), but the primary locations affected were situated in
southern Bavaria. The affinity of the pathogen to moderate-high temperatures and high
humidity, also necessary at night, could explain the higher prevalence in the southeast of
Bavaria (Passau district). Summers are moderately warm (19°C avg.) and rainy, with
frequent periods of dew formation at night and in the morning.
In the literature, a range of temperatures is described for the development of common rust,
but sporulation of P. sorghi is higher at 20-25°C than at lower temperatures of around 15°C,
and more common at a relative humidity of at least 98% (Hooker 1985). Night temperatures
are also important for the development of the disease because low temperatures (approx.
8°C) prolong the latent period (Headrick & Pataky 1986).
C. graminicola
In the monitoring, C. graminicola was found in southern France, where average temperatures
in the summer of 2012 (July, August, September) varied between 19 and 22°C (max.
average of 24-28°C)9, explaining the presence of the pathogen in accordance with the
literature. Nevertheless, the pathogen was also found in northern areas of Lower Saxony
(Nordholz) and Holland (Princepeel), where, on average, moderate temperatures of 14 to
18°C (max. average 19 to 24°C)10 are assumed to retard the development of the disease.
These unfavourable climatic conditions could explain the limited presence of the pathogen in
the locations.
Although the fungal pathogen C. graminicola has been reported in various temperate,
tropical and subtropical areas, it is particularly established and severe in warm, humid
conditions (Wheeler et al. 1973; Gatch & Munkvold 2002; Jackson-Ziems et al. 2014; Da
Costa et al. 2014; Zhang et al. 2014; Wise 2015). Furthermore, high temperatures (30°C) are
considered optimal for lesion elongation and dew periods (Leonard & Thompson 1976; White
2010).
9-10Data obtained from climatic database of Syngenta GmbH.
Discussion
147
After pathogenicity tests in the greenhouse in this work, the ability to infect both varieties of
maize in only a few days (lesions observed after five to seven days), the high virulence, and
the ability to produce stalk rot (also in the greenhouse) showed that C. graminicola could be
one of the most devastating maize leaf pathogens if optimal conditions of high temperatures
are present.
The pathogen is usually easy to recognise due to the acervuli produced on the leaves. These
structures are reported to be produced on infected maize residues in the field (Bergstrom &
Nicholson 1999). Nevertheless, other fungal organisms like Menispora ciliata Corda also
colonise debris (CBS 2015), producing similar acervuli. This was observed in maize debris in
the northern location of Ostenfeld. This could lead to a false identification of the pathogen in
the debris.
Fusarium spp.
Fusarium species are described as frequently occurring pathogens in maize, primarily
causing stalk and ear rots, reducing yield and producing mycotoxins (Bottalico 1998; D’Mello
et al. 1999; De Venter 2000; Munkvold et al. 2000, 2003; Desjardins 2006; White 2010;
Eckard et al. 2011; Antonissen et al. 2014). However, infection on maize leaves producing
symptomatic foliar spots or lesions is less common.
In this work, the isolates were obtained from leaf lesions produced by other pathogens or
from Fusarium lesions produced on stalk and corn husks (tan spots with black border and
pink to white sporulation in the centre, necrosis on the leaf sheath) or from maize residues
from the previous season. Although the spraying of spore suspensions on the leaves did not
produce any symptoms for any of the isolates tested in this work, some evidence that the
pathogen can produce lesions on maize leaves is available in the literature.
Moya-Elizondo et al. (2013) reported F. sporotrichoides to cause circular, white to brown
spots and necrotic tissue on the margins and tips of leaves in maize fields in Chile. In order
to fulfil Koch’s postulates, the author inoculated the leaves of healthy plants through spraying
of spore suspensions and was able to confirm the capability of one Fusarium species to
colonise the inner maize leaf tissue and produce lesions.
Further studies evaluating the role of Fusarium spp. on maize leaves were carried out by
Nguyen (2014), who tested different leaf inoculation methods. The author showed that while
coating fungal inoculum of several Fusarium species on the fourth leaf did not produce
symptoms, dropping of inoculum into the whorl, combined with coating of the developed
fourth leaf produced symptoms on the new emerging leaves (6th and 7th). The capacity of the
pathogen to penetrate unfolded leaves of the whorl was also described by Schieber and
Müller (1968) in plants infected with F. moniliforme. In their experiments, plants developed

Discussion
148
water-soaked spots with brown border, inhibiting further opening of the unfolded leaves and
a downward turning of the leaf tip very similar to those described by Nguyen (2014). This is
possibly due to accumulated water in the whorl leaves of the plant, favouring the infection.
Therefore, the inability to produce lesions on leaves could be more influenced by non-optimal
conditions (e.g. low humidity) than the inability of the pathogen to infect different structures
per se. Non-optimal conditions would restrict the colonisation of certain tissues, thus allowing
the plant more time to respond (Oren et al. 2003).
Other fungi colonising maize leaves
Two of the most frequently found fungi in maize leaf microflora in all the sampled locations
were species belonging to the Alternaria genus and Epiccocum nigrum. Both of these are
also reported in the literature as belonging to the most frequent fungi isolated from maize
leaves and kernels, along with Cladosporium and Fusarium species (Müller 1991; Fisher et
al. 1992; Broggi et al. 2007; Remesova et al. 2007; Gonçalves et al. 2013).
In this work, one E. nigrum isolate and two Alternaria spp. isolates were tested through
inoculation on maize leaves and no symptoms were produced. Thus, the fungi could not be
considered capable of infecting healthy leaves.
While E. nigrum is considered to be an endophyte in several crops besides maize
(Remesova et al 2007; Martini et al. 2009; Favaro et al. 2011), there is a lack of reliable
evidence that it plays a parasitic role on maize leaves (Yoshizawa et al. 1994). The Alternaria
species A. alternata and A. tenuissima have been reported as the most frequent on maize
leaves (Müller 1991). A. alternata is considered a “weak pathogen” of maize, which is only
capable of producing leaf blight after injury in optimal temperatures (20°C) in the absence of
prolonged dry periods (>24 hours) and during senescence (Trainor & Martinson 1981). This
is also likely to be the case for E. nigrum, which is mainly considered an endophyte and can
also colonise the maize tissue under certain conditions of wounding.
Disease incidence in 2012 and 2013
In the monitoring results, it is notable that disease incidence in 2013 was higher compared to
2012. Looking at the weather data in more detail provides further insight into the reasons for
this occurrence. Here, the weather data for the respective northern and southern German
locations will be taken as representative as the vast majority of samples originated from here
(especially in 2013). This allows for an in-depth comparison between the two years.
Furthermore, the northern and southern German locations exhibited the highest pressure for
the respective diseases that frequently occur in these regions (i.e. Turcicum leaf blight and
common rust in the south, and Kabatiella eyespot in the north).

Discussion
149
Looking first at the weather data for the Mittich/Inzing region (southern Germany), it
immediately becomes apparent that a severe lack of precipitation in July 2013 appears to
have inhibited the development of the diseases during the vegetative to reproductive stage of
the plant. This value of 23.7 mm was considerably lower than in July 2012 (78.9 mm).
Furthermore, while E. turcicum and P. sorghi theoretically flourish at higher temperatures
(20-25°C), a 1.3°C temperature difference between July 2012 (19°C) and July 2013 (20.3°C)
could also have played a role, albeit a less important one.
Regarding the northern region and taking the weather data for Ostenfeld (northern Germany)
as a reference, the severe reduction in precipitation in July 2013 (55.4 mm) compared to July
2012 (145.5 mm) again appears to have inhibited the development of the pathogen K. zeae.
Additionally, July 2013 was considerably warmer (18.1°C) than July 2012 (16.4°C). This,
along with the low level of precipitation, is likely to have greatly inhibited the development of
K. zeae as it is a pathogen which thrives in lower temperatures (14-17°C) (Reifschneider &
Arny 1980).
4.1.2. Aspects of isolation and inoculum production
The maize leaves presented a rich fungal spectrum, which, in some cases, made the
targeted isolation of certain pathogens difficult. K. zeae, for example, occasionally required
several isolation techniques. Of these, the Waring Blendor technique is a reliable option
when there is a small amount of lesions on the leaf. This was the case as the pathogen had
not colonised the leaf tissue to a sufficient extent to provoke slimy masses of sporulation on
the leaf surface. Also, due to the slow growth of K. zeae and the production of short
conidiophores, saprophytes can easily grow in abundance over K. zeae colonies, rendering
the isolation of the pathogen difficult. The Waring Blendor technique allows the pathogen to
grow separately from other fungi in agar medium in the first days. By contrast, pathogens
belonging to the Helminthosporium species such as E. turcicum and Bipolaris spp. have their
conidia attached to long conidiophores. This separates the pathogen from saprophytes that
could potentially inhibit sporulation and thus its isolation.
Another difficulty was that some fungi hardly sporulated in vitro. Phoma species and
C. graminicola are able to produce pycnidia after various subcultures on solid medium.
However, other organisms like E. turcicum lost their ability to sporulate after subcultures.
This, in addition to the loss of pathogenicity during subsequent subcultures, has been
reported for E. turcicum by several authors (Robert 1952; Hooker 1973; Chang & Fan 1986).
Some K. zeae isolates presented low sporulation on agar and also in the liquid medium for
spore production described by Reifschneider (1979). To date, the modification and
completion of this latter method by Algermissen (2014, pers. comm., 24 March) is the most

Discussion
150
successful (lower quantities of required materials, economical, reliability) for the production of
spores in vitro.
Another aspect to clarify with respect to the in vitro growth of K. zeae is that although the
formation of sectors with both dark and light colours frequently occurs, subcultures of these
sectors resulted in normal colonies, indicating the absence of mutations (Chinchilla 1985).
The darkening of an initially light-coloured colony was also observed on the leaves after
incubation in a humidity chamber. According to the descriptions of Dingley (1973), the
pigmentation of the colony is also observed on leaf samples when it grows within epidermal
cells.
4.1.3. Preservation techniques
The preservation of the isolated fungal species should guarantee not only their survival, but
also maintain virulence and capacity to sporulate.
A simple method like autoclaved water and glycerol guarantees survival, virulence and
capacity to sporulate for several years for Phoma spp. Nevertheless, for the rest of the fungi
isolated and analysed (K. zeae, Bipolaris spp., C. graminicola, Fusarium spp.), this method
did not ensure their survival. Consequently, an additional method based on preservation in
silica gel granules with a skim milk solution (Perkins 1962; Vaillancourt Laboratory 1995
modified from Tuite & Lutrell 1969) was used for K. zeae, C. graminicola and Bipolaris spp.
This method allows for the preservation of the fungal organisms within a solid medium,
inhibiting the further development of the spores and therefore degradations or possible
mutations produced in liquid medium. Nonetheless, some K. zeae and Bipolaris spp. could
not be obtained from the silica gel granules after several months. This was probably due to
the low survival rate of the species or, alternatively, because only a proportion of the
granules were impregnated with the spore suspension. Thus, for the purpose of further
selection and incubation on solid medium, the filter paper method described by Formento
(2015) was more accurate when it came to identifying the part of the material in which the
spores were situated. The continuous difficulties involved with storage reflect the specificity
and difficulty of selecting the correct preservation method for any of the fungi. The simple
method of fungal preservation in water is not recommended for any of these organisms. This
contrasts with the scarce information for K. zeae in the literature, where preservation in water
at 4°C should be a suitable method (Camochena 2009). A further step of testing the
virulence before and after storage over several years should help establish the most
adequate method for the preservation of each organism.

Discussion
151
4.2. Development of E. turcicum and K. zeae across seasons (2011-2014)
The development of the associated disease is dependent on a combination of several
climatic conditions, namely temperature, precipitation and humidity. None of these should be
looked at in isolation, but rather in combination with the other factors to ascertain the reason
for lower or higher prevalence of a disease.
K. zeae is favoured by mild (14-17°C) and humid weather (Narita & Hiratsuka 1959; Arny et
al. 1970). Besides the temperature, long periods of high humidity favour the infection and
sporulation (Narita & Hiratsuka 1959; Arny et al. 1970). If we compare this to the results in
this work, several conclusions can be drawn. As observed during the monitoring in 2012 and
2013, K. zeae was also the most prevalent pathogen in the Ostenfeld fungicide trials in
seasons 2013 and 2014. Nevertheless, the disease pressure was lower than in 2012 and
especially 2011, where an epidemic outbreak occurred11. In line with the literature, it can be
assumed that this noted outbreak in 2011 was caused by lower temperatures in July (16.4°C)
and extremely high levels of precipitation in both July and August (355.5 mm in total)
compared to 2013 (100.3 mm) and 2014 (145.7 mm). While the disease established itself in
the field to a certain extent in 2012, where the average temperature for July was identical
and precipitation was actually higher (145.5 mm as opposed to 110.7 mm in 2011), the lack
of subsequent precipitation in August (60.2 mm) might not have favoured further
development of the disease as did the high level of precipitation in 2011 (244.8 mm). Slightly
higher temperatures in August 2012 (17.2°C) compared to 2011 (16.5°C) may also have
played a role here. In 2015, the situation was rather similar; while in July a higher level of
precipitation was recorded (186.6 mm) than in 2011 (110.7 mm), the level fell drastically in
August (56.5 mm) compared to 2011 (244.8 mm). Furthermore, the average temperatures in
July 2011 and July 2015 only varied slightly, while the average temperature in August 2015
(18.2°C) was higher than in August 2011 (16.5°C). Despite 2012 and 2015 following a similar
pattern when compared to 2011, the warmer conditions in August 2015 (avg. temperature
18.2°C) inhibited the development of the disease to a much larger extent than they did in
August 201212 (avg. temperature 17.2°C). This, coupled with the possibility of accumulation
of inoculum in 2013 and 2014 being insufficient for the initial appearance (and subsequent
establishment) of the disease in the field in the early season, led to the absence of K. zeae in
2015. In this context, the reverse applies to 2012, where the epidemic in 2011 seemingly
provided high amounts of inoculum for 2012. In fact, it is possible that the presence of
sufficient inoculum in 2012 (and the absence thereof in 2015) could have played a more
important role than the aforementioned temperature difference in August.
11
2011 observations: Prof. Schlüter and Dr. Ute Kropf, personal communication, FH Kiel Ostenfeld (Lindenhof) trial location 12
2012: own observations made during monitoring (without rating data).

Discussion
152
With regard to E. turcicum, the temperatures at which the pathogen is favoured can range
from 15 to 30°C, with an optimum between 20 and 25°C (Casselman & Berger 1970;
Malaguti & Subero 1971, Berger 1973; Levy & Cohen 1983; Díaz et al. 2012; De Rossi et al.
2015). As is the case for other pathogens like K. zeae, the interaction of the temperature with
other climatic factors such as precipitation and humidity needs to be considered (Berger
1970; Levy & Cohen 1983). For example, in 2010, where an outbreak was recorded in the
studied location of Mittich in southern Germany (Urban 2012), the average temperature in
July (16.8°) was significantly lower than in subsequent years (19°C to 21°C from 2012 to
2015), as well as the long-term average (18.7°C). Initially, this may seem counterintuitive as
E. turcicum is generally favoured by higher temperatures. However, precipitation in July 2010
was significantly higher (172 mm) than in all other years and the long-term average (112
mm). Rain and high humidity (>90%) is considered to play a decisive role in the development
of epidemics of E. turcicum, whereas the extended range of temperatures (15 to 30°C)
probably plays a secondary role if inoculum is present in the location (Berger 1973; Levy &
Cohen 1983). In line with this, although the average temperature (19.2°C) and precipitation
(105.3 mm) were optimal in July 2014, for example, further development of the disease was
probably principally inhibited by infrequent rain, and secondly by comparatively low
temperatures in August (16.7°C)
4.3. Epidemiological studies through spore trapping
Management of fungal maize leaf diseases is based on the use of resistant varieties, tillage
practices, crop rotation and, in recent years, application of fungicides. The latter should be
regarded as a last option when the other measures are not sufficient or cannot be included
as a suitable method for management of the crop. According to Van der Plank (1963), the
application of fungicides should be part of an integrated management, in which the
epidemiology determines the adequate strategy.
The method of estimation for the latent periods for E. turcicum in Inzing and Göttingen is
discussed in detail in this section. No latent periods could be determined for K. zeae in either
location and will be discussed separately in section 4.3.2.
4.3.1. Estimation of the latent period of E. turcicum
Analysis of weather factors (humidity and temperature), increases in the infected leaf area,
and spore release revealed a correlation among these variables for E. turcicum in Inzing
(2014) and Göttingen (2015). In general, forecasting of weather conditions combined with
spore trapping can be effective in predicting when the pathogen is present and when the

Discussion
153
prerequisite conditions for an epidemic are met. In this way, a fungicide application can be
made at the appropriate time (Manners 1993).
Among other factors, the appropriate time for application is correlated with the development
of the pathogen based on its latent period. This latent period comprises the time from when
the spore lands on the leaf surface to the manifestation of symptoms and sporulation (Rapilly
1991). This latent period should provide the time frame on which the application of fungicides
can be based. This should not be confused with the incubation period, which comprises the
period (days) from infection until the manifestation of the first symptoms.
Despite some differences in the development of Turcicum leaf blight and the origin of
inoculum (natural vs. artificial), the latent periods estimated for E. turcicum turned out to be
very similar for both locations.
Analysis of the latent period through spore trapping is based on the time of spore release
(detachment of a spore or related propagule from the parent tissue), which can be correlated
with weather conditions. Spore release is based on two mechanisms, passive and active.
When the spore is attached to a conidiophore, the active mechanism is predominantly
caused by extreme variations in relative humidity, which permits separation of the spore from
its supporting tissue (in this case the conidiophore). This is produced by a gaseous phase in
the lower part of the conidiophores, which first bends and then quickly straightens when the
bubble reaches the top of the conidiophore (Rapilly 1991). Although this detachment
mechanism is also considered for E. turcicum in the literature (Meredith 1963; Leach et al
1976), the mechanism of passive force based on wind, humidity and rain is much more
relevant for the spore release and dispersal. These climatic conditions ensure the
dissemination of inoculum across larger distances (Casselman & Berger 1970; Rapilly 1991).
In this work, wind or rain were generally clear causes of spore release. In some cases,
however, the decrease or increase in humidity was notable and this option was also
considered.
The calculation of latent periods is not without its difficulties. Complications exist when
lesions increase in size and the area of spore production expands (Van der Plank 1967).
This was the case for E. turcicum in our trials. Nonetheless, while the expansion of the lesion
provides large potential areas of inoculum, this inoculum is not responsible for the lesion
itself; thus it cannot be directly considered for the calculation of the latent period. Therefore,
according to the concept proposed by Van der Plank (1967):
A lesion must be considered as a whole which can be traced back to the spore from
which it started; and one must measure the latent period of all parts of the lesion from
a single zero time: the time the lesion started from the spore (1967; p. 84).
Discussion
154
The concept of latent periods provided by van der Plank (1967) was also applied to the
results in this work - the first day of spore release in the infection period under consideration
is probably closer to the day of first sporulation (i.e. the initial detection of spores) than the
highest peak of spore release.
Favourable conditions for the development of E. turcicum were considered to be high relative
humidity (henceforth RH) of 100%, frequent rain (Berger 1970; Casselman and Berger 1970;
Leach et al. 1976) and temperatures in the range of 15°C-25°C (Casselman & Berger 1970;
Malaguti & Subero 1971, Berger 1972; Levy & Cohen 1983; Diaz et al. 2012; De Rossi et al.
2015).
Inzing
In Inzing, although notable precipitation was registered in July, this was only concentrated on
a few days. A favourable day for the development of Turcicum leaf blight in the field occurred
on 22 July, when 17 hours of 100% RH occurred. On these days, while some spores were
trapped, no lesions were observed in the trial. The existence of inoculum, which probably
originated from other fields in the region, revealed the presence of the pathogen in the area.
Nevertheless, due to the constantly low number of spores registered in the subsequent
weeks, it is likely that weather conditions were not favourable enough to maintain the chain
of secondary re-infections.
Several authors state that germination, penetration and infection could occur within five to 18
hours at a temperature range of 15-30°C. However, if the latent period is considered
(infection and sporulation) the complete cycle will take longer. A minimum of 11-14 hours of
dew is required for abundant sporulation, which is responsible for epidemic outbreaks
(Berger 1973; Levy & Cohen 1983). Therefore, it is likely that several favourable days have
to pass during summer in order for these requirements to be met.
At the beginning of August, the first scattered lesions with sporulation were observed in the
field. These lesions appeared after a prolonged, relatively favourable period for infection at
the end of July and beginning of August. This consisted of several days of high humidity and
rainfall. Although this fulfilled the requirements for further development of the disease, further
infection cycles are required to provoke higher infection rates and abundant spore release.
This was reflected by the low disease severity observed in the location (<1%) and the low
quantity of trapped conidia. Considering the days which elapsed between the favourable
conditions for infection (starting from 30 July) and the first symptoms of the disease in the
field with sporulation (approx. 7 August), eight days elapsed. This could represent the first
latent period diagnosed in the season although the spore trap could not confirm an increase
in sporulation during this period (see Figure 77, point A). Furthermore, on proceeding days, a

Discussion
155
dry and warm period (max. 26-30°C) probably inhibited further possibilities for additional
sporulation during the following weeks. This was correlated with the low number of trapped
spores.
Fig. 77. Fluctuation of trapped conidia of E. turcicum during the sampling period in Inzing 2014.
A-H: Periods of spore release discussed in this section correlated with latent periods.
With the onset of the late season, favourable conditions of high humidity and moderate
temperatures were more regularly recorded and spore release was detected at a high
incidence. Peaks of spore release occurred after rainy periods, combined with at least 29
hours of 100% RH. For example, after a notable period of favourable weather conditions
from 28 August to 2 September, the number of trapped spores progressively increased
during the following days. This culminated in a single, albeit small, peak on 10 September,
probably favoured by heavy rainfall on the preceding day. From the day when the most
favourable conditions for sporulation were recorded (30 August – Figure 77, point B) to the
peak on 10 September (Figure 77, point C), 11 days elapsed. These 11 days could represent
the latent period, with some slight variation possible with regard to the actual point of spore
release. This could have occurred between the 9 and 10 September (10-11 days), or even
slightly earlier. Considering that the release of spores into the atmosphere is dependent on
favourable weather conditions, the recorded spore release can be separated from the point
at which spore formation occurred by several days (Casselman & Berger 1970). At this time,
the infected leaf area was still lower than 1%.
The spore release on the 9-10 September coincided directly with a period of high humidity
from 11 to 14 September, where 87 hours of 100% RH greatly favoured germination and
infection. While, in theory, this prolonged period of high humidity was almost certainly
sufficient for high rates of infection and further sporulation, this process could have been
inhibited by the coinciding low temperatures (avg. 12-16°C). This was reflected by the low
number of trapped conidia (Figure 77, point D). Levy and Cohen (1980) maintain that at low
temperatures, the length of the sporulation period could be prolonged for E. turcicum by

Discussion
156
several days. Consequently, the increase in the amount of trapped conidia 14 days later (24-
26 September) should be considered.
Nevertheless, another option would be to consider the small peak of spore release on 18
September (Figure 77, point E). Assuming that these spores originated from the first
sporulation of the lesions, the period between 11 September (first day of favourable
conditions for infection) and the day of slight spore release (18 September) could be
considered as the latent period, i.e. approx. seven days. In this case, the peaks of abundant
sporulation from 24 to 26 September (Figure 77, point F) would not be a result of a first
sporulation but rather of massive sporulation in existing lesions, i.e. lesions which had
already formed beforehand caused by prior spore release. The abundant sporulation was
evidently favoured by the relatively warm (15-18°C) temperatures and high humidity on
preceding days (19-23 September).
Thus, it is possible that the peaks of abundant spore release on 24 to 26 September
represent the closest period to sporulation. In this case, 13 days elapsed from the first day of
favourable conditions on 11 September to the first release of spores on 24 September.
These 13 days (as opposed to seven) could instead be considered as the latent period. This
would also be supported by the fact that favourable conditions for spore release occurred on
the days before (19 to 23 September) and an increase in spore numbers was not registered
until 24 September.
From the 24-26 September, masses of spores were again deposited on the leaves, and the
cycle of infection was repeated once again. On the days following the peak to the 1-2
October, a progressive increase in the number of spores was observed (Figure 77, point G).
In this case, an accurate analysis of the subsequent latent period becomes difficult because
some older lesions could have sporulated again under favourable conditions, overlapping
with spore release from new lesions. Based on the fact that new lesions were observed on
the days immediately thereafter, the spores detected at the beginning of the new release
period can be considered the first spores produced after a latent period of seven to eight
days, which culminated in an abundant spore release on 3 and 4 October (Figure 77, point
H). These last infection periods were reflected by an increase in the infected leaf area (3%).
Göttingen
In Göttingen, the Turcicum leaf blight epidemic followed a different pattern than in Inzing.
This was due to the artificial conditions that provoked a much earlier epidemic than in Inzing
under natural conditions.
Following artificial inoculation of the plants at the end of tasseling (BBCH 59-63), plots were
covered with plastic, providing a saturated atmosphere (100% RH) to favour the first

Discussion
157
establishment of the pathogen in the plant. After 24 hours, the first small chlorotic spots were
visible on the plant, confirming the successful germination and penetration of the pathogen in
the leaf tissue. By contrast, in Inzing in 2014, the establishment of the first natural inoculum
of E. turcicum took several weeks due to the low quantities of inoculum and absence of rain
and favourable RH (100%) over prolonged periods.
Once the pathogen had been established on the leaf, the plastic cover was removed (after
two days) and the subsequent development of the fungus occurred under natural climatic
conditions. Following the removal of the plastic cover, first conidia were trapped. However,
these initial and inconsiderable quantities of conidia (1-4) were directly related to the sprayed
inoculum. First lesions were observed after, on average, 12 days and were produced by the
initially induced establishment of the pathogen. Thus, this time can be considered as the
incubation period (time from germination to lesion formation) but not the latent period.
A dry and warm period occurred at the end of July and beginning of August. The existing
lesions expanded markedly, covering large areas of the leaves (8% avg. infected leaf area).
However, at this stage, sporulation in the lesions was still not observed. This mechanism of
prominent expansion of lesions was described by Bergamin Filho & Amorim (1996), and is a
variation of the classical concept for epidemics described by Van der Plank (1963). The
theory put forward by Bergamin Filho & Amorim (1996) is based on differences in infection
cycles between tropical and temperate pathosystems. Temperate pathosystems present a
clockwise infection chain with so-called “sites”, i.e. potential areas of infection. These are
defined as “healthy sites, latently infected sites (both with no symptoms), lesions (infectious
sites), removed lesions (non-infectious sites)” (Van der Plank 1963, cited in Kranz 2003,
p.63).
The tropical pathosystem defined by Bergamin Filho and Amorim (1996) provides an
alternative method of infection, namely an anti-clockwise infection chain. This is based on a
high rate of lesion expansion, which allows the pathogen to counteract the unfavourable
conditions in tropical climates. Through this mechanism, the infected sites can generate new
infectious sites without the need for production of new spores. This mechanism has been
observed for E. turcicum by several other authors (Berger 1970; Vitti et al. 1995; Bergamin
Filho & Amorim 1996; De Rossi 2015). According to Vitti et al. (1995), the increase in the
lesions could reach a rate of >43 mm2 day-1. A prominent manifestation of this mechanism
was also observed personally during visits to various maize growing regions of Argentina in
2015 in the scope of this work. Here, plants presented lesions which were expanded across
the length the leaf. In this case, the establishment of the pathogen in the early season was
probably favoured by high amounts of rainfall which occurred in 2015 (caused by the “El
Niño” weather phenomenon), with interjecting periods of dry and warm weather.

Discussion
158
In Göttingen, favourable conditions for the first stages of infection were artificially provoked.
In Inzing, the high humidity and precipitation (as well as sufficient inoculum) required for the
initial establishment of E. turcicum was absent, reflected by the scarcity of lesions. This
counteracted the warm and dry weather which could have favoured the enlargement of
lesions at the beginning of the season. Given the fact that high levels of humidity and dew
are generally rare in the early season in the region of Inzing, it can be surmised that it is
unlikely the mechanism described above plays an important role here.
After the dry and warm period at the end of July and beginning of August which promoted the
enlargement of the lesions in Göttingen, favourable conditions increased during the middle of
August. This was confirmed by the sporulation observed on the leaf lesions in the trial on 17-
18 August. It is likely, however, that some lesions were already sporulating as the first peak
of notable conidia release was detected on 13 August (see Figure 78, point A). Considering
the concept of latent periods, which end upon the commencement of sporulation, in this case
it took around 30 days (13 July to 13 August) due to the aforementioned dry and warm
period. The subsequent amounts of conidia which could be counted daily from 16-22 August
(Figure 78, point B) are probably attributable to the continuous, abundant sporulation on the
large blighted leaf area. This was caused by high RH (90-100%) and a high amount of
precipitation. The highest peak of the season (recorded on 23 August – Figure 78, point C) is
probably attributable to the favourable temperature and RH which occurred during the
previous days, leading to a massive sporulation of the blighted area.
Fig. 78. Fluctuation of trapped conidia of E. turcicum during the sampling period in Göttingen 2015.
A-I: Periods of spore release discussed in this section correlated with latent periods.
Towards the end of August and at the beginning of September (27 August- 2 September),
the daily conidial release corresponded with the fluctuations in the relative humidity, although
only one day reached the minimum level of 90% RH (daily average) required for sporulation.
Nonetheless, it is possible that dew periods in the subsequent days of at least 5-9 hours (at

Discussion
159
night) were sufficient for sporulation in this case. As Levy and Pataky (1992) argue, if the
hours of 100% RH are not sufficient for the development of the conidia, the subsequent
morning dew permits the completion of the formation of these conidia.
The peaks produced in the middle of August (Figure 78, points A & B) could be considered to
be the first outbreak of the epidemic which led to the subsequent cycle of infection
commencing on 27 August (Figure 78, point D). The peak on 27 August is the first of an
ascending curve and could be considered a direct product of the latent period, which
probably commenced with the first sporulation between 13-16 August, i.e. 11-14 days. The
culmination of the curve in a peak of abundant sporulation (1 September – Figure 78, point
E) can be considered the result of substantial secondary sporulation on expanded lesions
after a period in which RH increased.
From this period to the next notable spore release, an ascending curve similar to that of the
last two periods of spore release was not observed. This was probably attributable to
unfavourable weather conditions of frequently low humidity, coinciding with a plateau in
conidial release (Figure 78, point F). The fourth peak of abundant conidial release on 12-13
September (Figure 78, point G) coincided with a five-day period of favourable conditions. In
this case, different possibilities exist for this massive sporulation. The peak could be the
product of new lesions formed, for example, as a result of the spore release on 1 September
(11-day latent period). In contrast, the peak could also be a product of massive sporulation
on the older lesions, produced by an overlapping of these preceding infection cycles.
In the fifth period of spore release, a similar pattern to that of the second and third periods
was observed, i.e. an ascending curve of spore release. Initially low spore release from 18-
21 September (Figure 78, point H) was followed by a sharp peak of abundant spore release
on 22 September (Figure 78, point I). This is in line with the hypothesis outlined above: the
initial release of spores is the product of first sporulation after lesion formation, while the
large peak represents secondary spores produced in abundance on the previously formed
lesions. In this case, six to 10 days elapsed from the last period of abundant release (12
September) to the next (18-22 September).
Comparison of spore release pattern from Inzing and Göttingen
The latent periods ranged from seven to 13 days for Inzing and six to 14 days for Göttingen.
This is more or less in line with the literature, which states a latent period for
E. turcicum of eight to 14 days that can vary depending on the maize cultivars or climatic
conditions (Malaguti & Subero 1971, De Rossi et al. 2015, Diaz et al. 2012). It is possible
that the six or seven-day latent periods estimated in some cases are too short and the actual

Discussion
160
time frame was closer to the maximum range calculated, e.g. 10 days (12-22 September) as
opposed to 6 days (12-18 September) in Göttingen.
In both locations, the initial sporulation and subsequent spore release occurred after a long
period of unfavourable weather conditions. The development of the disease in Inzing was
especially retarded, with the first noticeable spore release not registered until September. In
Göttingen, on the other hand, the first noticeable spore release occurred in the middle of
August and a pronounced second mechanism of lesion expansion compensated for the
unfavourable conditions. Furthermore, in Göttingen the artificial inoculation was carried out at
a time (mid-July) when natural inoculum is usually not present at such a high level. This
resulted in an infected leaf area of 46% by the end of the season, as opposed to only 2.8% in
Inzing under natural conditions.
As discussed in the introduction to this section, latent periods can vary by several days
depending on the estimation method used. Complications also exist when lesions increase in
size and the zone of spore production expands (Van der Plank 1967), which was especially
pronounced in Göttingen.
A number of other factors can also have an impact on the latent period. Carson (2005) found
that varieties resistant to Turcicum leaf blight tend to be effective in prolonging latent periods.
The opposite also applies: susceptible varieties advance the development of the disease,
providing more inoculum and shortening the latent periods (Rapilly 1991). This argument can
be tentatively applied to Göttingen as the variety used was susceptible and in the last
infection cycle, the final latent period (six to 10 days) was shorter than in the first infection
cycles (11-14 days). In this context, the length of the latent period is linked to partial
resistance (Carson 2005). Furthermore, the latent period can also depend on variations in
the resistance of the plant between the early and late stages (Kranz 2003).
Climatic conditions can also have a large impact on the latent period. This is one of the most
plausible explanations for the shorter latent periods at the end of the season in both Inzing
and Göttingen, where more favourable weather conditions such as 100% RH and dew
periods for the pathogen occurred. Related to this, the duration of the incubation and latent
periods of necrotrophic fungal pathogens can also be affected by the concentration of
inoculum present (Rapilly 1991). The author presents the case of Dreschlera teres on barley,
which is also considered within the “Helminthosporium complex”, where higher
concentrations of inoculum are correlated with shorter latent periods, and vice versa. This is
in line with our results in Göttingen and Inzing, where higher concentrations of inoculum in
the late season coincided with shorter latent periods.
With regards to the pathogen itself, the parasitic fitness could also play a role in the higher
concentration of the spores. In a study by Levy (1991), isolates from different regions varied

Discussion
161
in infection efficiency, sporulation and lesion size. While the development of Turcicum leaf
blight in Inzing was limited to the natural inoculum in the region, in Göttingen different
isolates (of different races) from several European regions (southern and western France,
Hungary and Germany)13 were inoculated. These pathogens had diverse levels of
aggressiveness and the purpose of their combined use as inoculum was an attempt to
achieve compatible interaction between the plant and the pathogen, as well as the
adaptation of the pathogen to various conditions based on their origin. This might be another
explanation for the larger amount of spores registered by the spore trap compared with
Inzing under natural inoculum.
Overall, it is difficult to attribute the length of the latent period for E. turcicum to one single
factor. Factors such as variety susceptibility, inoculum concentration and favourable climatic
conditions all have an influence in this regard. The method of evaluation can also have an
impact, and further studies could be carried out by focusing on newly formed lesions instead
of the evaluation of the whole blighted area.
Based on the data obtained, spore trapping helped to understand the development of the
disease across the season. As part of an integrated pest management, in combination with
weather forecasting, spore trapping can be very useful in evaluating inoculum pressure
during the season. This could help to decide whether a fungicide application to control
Turcicum leaf blight is required and even the timing of the application.
4.3.2. Interpretation of K. zeae results
In contrast to E. turcicum, spore trapping did not reveal fluctuations within a season in
Ostenfeld in 2013 and 2014 (natural inoculum) or in Göttingen in 2015 (artificial inoculation).
Conidia of K. zeae are hyaline, normally non-septate and relatively small in size (average 3 x
27 µm). These characteristics hindered the recognition of spores among the mass of other
material and spores found on the spore trap samples. This was even the case on the artificial
spore trap tapes as the spores blended in with the vaseline on the tape.
In this case, DNA detection techniques become crucial. The protocol to extract DNA from the
sampling tape followed in this work is based on the method described by Kaczmarek et al.
(2009). The author also encountered difficulties with L. maculans and L. biglobosa as it was
impossible to distinguish between trapped ascospores of the two species by microscopy.
13
These isolates were obtained from a monitoring of E. turcicum races carried out in 2012 as part of the doctoral project of Hendrik Hanekamp (“Population structure of the pathogen Exserohilum turcicum and spatial efficacy of race specific resistances“) at the Division of Plant Pathology and Plant Protection, Georg-August-University, Göttingen.

Discussion
162
Nevertheless, the analysis through qPCR could not reveal seasonal fluctuations of K. zeae in
any of the locations analysed. This failure in the detection of K. zeae through spore trapping
and analysis of DNA from the samples via qPCR could be a result of an insufficiently
optimised qPCR method. For possible future development of the qPCR method, further
analyses are required in order to improve detection by testing possible inhibitions in the
presence of non-target DNA and investigating the irregularity of the the melting curve of
amplification. Furthermore, non-specific amplifications should also be considered. In this
work, non-specific amplifications of the genetically related fungi K. caulivora DNA were
obtained with the selected primers for K. zeae. Nevertheless, this may not affect the
specificity of the test to a large degree because the pathogen is mostly described as infecting
red clover (this is assuming that its presence is relatively low in maize fields). Nevertheless,
other genetically related fungi to K. zeae, such as Aerobasidium pullulans, which is a
ubiquitous fungus, should be tested.
On the other hand, the low levels of the disease observed in Ostenfeld during the 2013 and
2014 seasons could reflect a lack of inoculum in the field. The subsequently low number of
K. zeae spores was probably insufficient for detection, both via microscopy and qPCR.
Similar levels of disease to Ostenfeld in 2013 were registered in Göttingen at the end of
August. This equally explains the absence of peaks in spore release in Göttingen. However,
with the onset of the late season, a decrease in temperature favoured the development of the
disease, with an infected leaf area of 20% being reached in Göttingen. This sharp increase in
the infected leaf area was probable caused by two days of rain on 13 and 14 September,
providing sufficient inoculum to be detected by the spore trap. In fact, this was the only point
at which a positive amplification via qPCR assay was registered at this location.
Nevertheless, the failure of the spore trap to detect inoculum could explain a decisive factor
related to the development of epidemics of K. zeae, i.e. the primary transport mechanism is
based on rain and not wind. While some authors (Arny et al. 1970; Smiljakovic & Pencic
1971) refer to the possible distribution and dispersal of the pathogen via air currents, this
theory has never been tested scientifically. This probably reflects the difficulty of analysing
the infection cycle of K. zeae focusing solely on wind dispersal. Rapilly et al. (1975) studied
the dispersion of K. zeae spores via splashing produced by rain and sprinkler irrigation. This
was achieved by using a device designed for the collection of water and estimating the time
at which the pathogen sporulated based on the number of spores collected per ml of water.
To our knowledge, this is the only report that analysed the sporulation and dispersal of
K. zeae with quantifiable data.
Rapilly et al. (1975) concluded that K. zeae can sporulate in high quantities on a water film
on the leaf. However, the sporulation of K. zeae appeared to be inhibited by the sensibility of

Discussion
163
the spores to conditions of high UV radiation and desiccation. The impact of a droplet of
water onto the colony of a fungus ensures the dispersion of numerous pathogens, in
particular those in which the conidia are produced on short conidiophores or are integrated in
a mucilaginous matrix (Rapilly 1991). This is explained by the spreading of the water soluble
substances of the mucilaginous matrix with the film of water which is formed. However,
successive impacts of droplets of water lead to an exhaustion of the fructification. While the
conidia attached to long conidiophores are exhausted faster (reflected during the first
impacts), as is the case with species of the Helminthosporium complex (e.g. E. turcicum)
Rapilly et al. (1975) found that this exhaustion process through rain is almost impossible in
the case of K. zeae colonies. This is due to the abundant sporulative capacity of K. zeae and
the short period of time necessary for the formation of new spores (5-6 hours). Observations
made in the field also lend support to the theory that K. zeae largely depends on droplets of
water for its dispersion. In the field, the disease is usually unevenly distributed, probably
because the droplets of water are distributed from one plant to another when there is contact
between their respective leaves. This uneven distribution pattern could be observed in both
Ostenfeld and Göttingen, especially when the first infections occurred.
An optimised qPCR assay might demonstrate the importance of wind in K. zeae epidemics,
rejecting or accepting its role in the dispersal of the pathogen.
4.3.3. Further considerations for qPCR and PCR assays
The possibility of a molecular biological detection of E. turcicum propagules was investigated
in order to accelerate the assessment. Molecular methods based on spore detection have
been described in the literature for maize leaf pathogens such as P. polysora and P. sorghi
(Crouch & Szabo 2006), as well as for several fungal pathogens of other crops (Kaczmarek
et al. 2009, Rogers et al. 2009; Vogelzang 2011, Meitz-Hopkins et al. 2014).
Performance conditions, limit of detection, specificity and reference microscopy were
evaluated. The qPCR method permitted the detection and quantification of E. turcicum DNA
and the data from the qPCR assay were positively correlated with the spore counts for
seasonal fluctuation of conidial release by visual microscopy. The qPCR assay offered the
detection of E. turcicum DNA at quantities of picograms. Nevertheless, lower concentrations
were not always amplified. This was the case for several samples from Göttingen.
Some samples in which no spores were counted through microscopy were positive via
qPCR, and vice versa. Nevertheless, most of these samples had low numbers of conidia
(0<x≤10). Possible explanations for this discrepancy could be a visual limitation in
recognising the presence of a spore due to it being degraded, in the early formation stages

Discussion
164
(where the septa are not yet formed), or hidden under other biological material on the tape.
False amplification of non-target pathogens or material could be also discussed. In this work,
non-specific Alternaria spp. amplifications were obtained. Nevertheless, extremely high
amounts of DNA (100 pg µl-1) need to be present to obtain positive amplifications. Such high
amounts of DNA are improbable, however. On the other hand, although a specific test with
13 other fungi was carried out, the possibility that other fungi or biological material were
amplified cannot be ruled out.
Regarding some samples in which spores were counted through microscopy but not
detected through qPCR, possible inhibitions through other material not tested in this work
could have limited further detections, such as high amounts of non-target DNA. These
negative results mostly occurred for samples with a low number of spores. One exception
was a sample with 152 spores counted through microscopy resulting in no amplification via
qPCR. This was probably due to errors during the extraction method: as spore trap tapes
were measured daily and one spore trap was situated in each location, only one sample per
day was available for further analysis. Daily repetitions did not exist in this case.
According to the correlation between DNA yield and number of spores obtained from
samples from Inzing and the artificial spore trap tapes, it was estimated that each spore
contains about 1.15 - 1.24 pg DNA, whereas the same correlation resulted in 4.6 pg per
spore for samples from Göttingen. This discrepancy could be explained by the presence of
other inoculum (e.g. conidiophores) which was not counted by visual microscopy. This is
most likely due to the close proximity of the spore trap to the plants. This was especially
noticeable in Göttingen, where large amounts of similar conidiophores to those described for
E. turcicum were observed on the tapes. This could have lead to a higher DNA yield (conidia
and conidiophores) than that calculated for one spore through qPCR.
The most important purpose of the qPCR test, i.e. to differentiate between seasonal
fluctuations of spore release, was achieved. Further optimisation of the method could
improve its reliability. Therefore, the adapted protocol from Kaczmarek et al. (2009) could
support integrated pest management programs by saving time and effort in the monitoring of
the E.turcicum inoculum pressure. This would be more efficient for future modelling and
forecasting of Turcicum leaf blight.
4.4. Application of fungicides
Management of fungal maize leaf diseases is based on the use of resistant varieties, tillage
practices, crop rotation and, in recent years, application of fungicides. The latter should be
regarded as a feasible option when the other measures are not sufficient or cannot be
included as a suitable method for management of the crop.

Discussion
165
To date, a lack of knowledge and information about the dynamic of the disease correlated
with the use of fungicides on maize leads to confusion among organisations and farmers with
regard to their correct use in Germany. Two foliar fungicides composed of mixes of QoI and
DMI fungicide compounds were permitted in 2014. Nevertheless, their application in maize
fields remains uncommon due to several factors limiting the necessity for their use: I) in
some areas, the disease pressure is too low to benefit from an application, II) it is not defined
at which level of disease severity the fungicide should be applied (thresholds are not
defined), III) lack of knowledge about the dynamic of the diseases (latency period and further
development mechanisms), which is important for the timing of application, and IV) the
efficacy against different target diseases has not been sufficiently tested.
The fact that severe epidemics occur only sporadically, e.g. 2010 for Turcicum leaf blight and
2011 for Kabatiella eyespot (Urban 2012), makes it difficult to gain sufficient knowledge
about the dynamic of the diseases in the field, and, in turn, the optimal management of these
diseases through fungicides.
4.4.1. Fungicide effects on infected leaf area
In Mittich in 2013, foliar fungicides significantly (statistically) decreased the infected leaf area
caused by Turcicum leaf blight and common rust compared with the untreated control. This
reduction ranged between 3% and 4.7% for Turcicum leaf blight and 2.9% and 4.6% for
common rust, demonstrating that the different applications were similarly effective against
both pathogens.
The literature indicates that when a fungicide is applied to a plant infected with common rust,
the pustules are eradicated and new infectious areas can no longer be produced (Berger et
al. 1997). In contrast, Turcicum leaf blight is characterised by a fifteen-fold faster lesion
expansion rate than common rust (Bergamin & Amorim 1996). Thus, combating the disease
through fungicides may be much more difficult, or in some cases ineffective, once it is
established in the field (Diaz et al. 2012; Couretot et al. 2013).
In the trials in Mittich, however, Turcicum leaf blight had yet to develop to a significant level in
the field (less than 1%) when the fungicide was applied. This is likely to be the reason that a
similar reduction in infected leaf area could be achieved for both Turcicum leaf blight and
common rust.
In contrast to 2013, in 2014 only Turcicum leaf blight was assessed, while pressure of
common rust was low. Here, a less consistent protection effect between treated and non-
treated plots was observed, probably due to the low level of Turcicum leaf blight in the field.
Only one treatment significantly reduced the infected leaf area (1.2% reduction) compared
with the untreated plots.

Discussion
166
For Kabatiella eyespot, statistically significant differences between treated and untreated
plots were observed in Ostenfeld in 2013 and 2014 in terms of infected leaf area. This is in
line with trials carried out in Denmark, which have found fungicides to be very effective
against Kabatiella eyespot, especially at higher levels of disease severity. Treatment is not
necessary every year, however (Jørgensen 2012).
4.4.2. Disease development
Protection of leaves that contribute most to the corn cob filling needs to be taken into account
when applying foliar fungicides to maize. Pataky (1992) reported that leaves L-1, L0 and L+1
are an important production source for assimilates, which explain 30% of the corn cob filling.
The author also noted that when severity in the upper 75% of the canopy was less than 8%,
yield was not affected. This could explain the lack of a positive yield response in Inzing in
2014, where the highest levels of infected leaf area with Turcicum leaf blight were registered
on the upper leaves of the plant, probably due to the late appearance of the disease. This
can also be applied to Ostenfeld, where in both 2013 and 2014, Kabatiella eyespot was
registered at higher levels on the upper leaves. Nevertheless, this hypothesis does not
explain the results from Mittich in 2013, where the most affected leaves were situated in the
middle of the plant (L-1; L0; L+1).
Common rust was also present in Mittich but the higher levels of infected leaf area (6%) were
registered in the upper canopy. Therefore, due to the lower damage to the leaves and its
location in the upper canopy, common rust was of secondary importance in terms of having a
negative effect on yield in 2013 compared to Turcicum leaf blight. As explained in section
3.4.1, while common rust had a similar infected leaf area, the differences between the rating
scales and the size of the lesions mean that the same percentage of common rust is not
identical to Turcicum leaf blight. Adding the percentage of infected leaf area of both diseases
together is a highly questionable method due to this discrepancy. In this case, a so-called
“green rating” (a rating exposing the leaf area that is still not infected) may have been the
most reliable option. Green ratings are commonly used when various diseases are present in
the field as it is difficult to differentiate between the damage produced by each respective
disease. However, green ratings fail to recognise the importance of the different foliar
diseases on maize and the efficacy of fungicides against each specific disease. Furthermore,
if the capacity of all foliar diseases to infect the leaf area were to be treated the same, the
potential yield losses caused by each disease would be indeterminable, thus making it
impossible to establish specific thresholds for each disease. This complicates the issue of
finding a sustainable strategy for managing foliar diseases. Nevertheless, green ratings are

Discussion
167
very reliable when other external factors, e.g. a “greening effect”, have to be evaluated. This
will be explained in more depth below.
4.4.3. Timing of application
The efficacy of a fungicide depends to a large extent on the timing of application (Munkvold
1997; Ward et al. 1997). If severe defoliation is produced by the disease before or during the
grain-filling period (two-three weeks after pollination, BBCH 71-87), the reduced
photosynthetic area will translate into a reduction in the supply and assimilation of nutrients
to the cell. This leads to a subsequent reduction in the grain yield (Tuleen & Frederiksen
1977; Agrios 2004). Therefore, fungicide application should provide a control effect during
this critical period. Therefore, the most important stage in this context could be considered
from tasseling to flowering (BBCH 65). Early applications reduce an initial early appearance
of the pathogen, avoiding infections in the early stages where the plant tends to be more
susceptible. An early application may also inhibit further infections which could continue to
develop until the aforementioned critical stages.
Among treatments analysed in this work, no significant differences were observed between
different timings of application for Turcicum leaf blight in 2013 and 2014. By contrast,
significant disease control of common rust was observed when propiconazole + azoxystrobin
was applied at flowering (BBCH 63). Regarding Kabatiella eyespot, a significantly superior
level of control was only achieved in 2013 when treatments were applied at mid-late stages,
i.e. from tasseling to flowering (BBCH 55 to 63). This result was achieved despite a relatively
low severity of the disease in the untreated control (5.9%). Significant differences among
timings of application could not be observed in 2014, however, probably due to the lower
level of the disease (3.7%) compared to 2013. Urban (2012) investigated the effect of
fungicides with early and late applications against Turcicum leaf blight and Kabatiella
eyespot during the 2010 and 2011 seasons in the same regions as those studied in this
work. For Turcicum leaf blight, significant differences between early and late applications
could only be confirmed in 2010, when the disease severity was high (44%, non-treated
control). The disease severity in 2011 (7%) reported by Urban (2012) was similar to that of
2013 (8%) and was not sufficient for differences to be registered among application timings.
Similarly, Urban (2012) could only confirm significant differences among application timings
when a high level of Kabatiella eyespot was recorded (2011, 19.8%).
It is important to note that the residual period for fungicides (i.e. the amount of time it
provides control) is approximately 14-21 days. Most of the fungicides used in these trials
contained two active ingredients, one of which was a triazole and the other a strobilurine.

Discussion
168
While strobilurines offer protective control against sporulation, germination and penetration,
propiconazoles offer curative protection.
Taking into account the latent periods for E. turcicum estimated in this work for 2013 (see
section 4.3.1) and those provided in the literature (De Rossi et al. 2015), the first infection by
the pathogen could have commenced 10-14 days prior to the first observation of the
symptoms in the field (31 July). This date falls within the time range in which the fungicide
applied at an early stage was still effective (application 3 July, growth stage: stem
elongantion of the plant, BBCH 32). This would explain the efficacy reflected by the final
results and implies that the early application was successful in providing effective protection
against the initial cycles of infection. Nevertheless, this can be difficult to achieve as there is
a progressive loss of efficacy of the fungicide, i.e. it is less effective 20-21 days after
application compared to the days immediately following the application. Considering a
window of efficacy of approx. 21 days, an early application on 3 July would imply a loss of
efficacy around 24 July. Thus, while this was sufficient to cover the initial infection caused by
primary inoculum, secondary infections (re-infection) which occurred in Mittich after this date
would no longer have been controlled. Thus, while the late application would not have
controlled against the initial infection cycle, this was probably compensated for by controlling
these secondary infections. Unfortunately, this could not be confirmed in 2013 as there was
no significant difference between early and late applications, likely owing to the low severity
of the disease.
In general, however, secondary infections are considered more damaging in these regions
as the diseases are favoured by more optimal conditions in the late season (higher humidity,
moderate temperatures). Therefore, a late application should be more effective in seasons
where the level of disease severity is sufficiently high. As stated above, the results for 2013
and 2014 in Mittich/Inzing and Ostenfeld were not convincing in this regard. However, Urban
(2012) found that late applications (BBCH 51/55) were responsible for a significant reduction
in the infected leaf area of Turcicum leaf blight in 2010 and Kabatiella eyespot in 2011, years
in which the respective disease pressure was high.
4.4.4. Disease yield loss relationships
Although the infected leaf area was significantly reduced through a fungicide application in
2013 and 2014 for Kabatiella eyespot, as well as in 2013 for Turcicum leaf blight and
common rust, this did not convert into a significant benefit in yield (in terms of biomass or
grain production). Wise and Mueller (2011) maintain that the efficacy of a fungicide is
dependent on the severity of the disease that is present in the field, with a low disease
severity resulting in inconsistent yield responses. Nevertheless, this unpredictable correlation

Discussion
169
has also been reported in some cases for high disease pressure. Bradley and Ames (2010),
for example, found significant differences between treated and non-treated plots in terms of
disease severity but without significant differences in yield for grey leaf spot (Cercospora
zeae-maydis). The authors concluded that this could have been due to the high disease
severity which was also present in the treated plots due to a late fungicide application.
In the trials conducted in Mittich and Ostenfeld, the lack of a positive yield response to a
fungicide application may instead be related to the late occurrence of the disease. A
noticeable increase in the infected leaf area only occurred when the plant was in the ripening
stage and grain and biomass yield had almost formed (BBCH 85). This infers that although a
statistically significant reduction in the infected leaf area was recorded at the end of
September, this is not necessarily a driving factor or representative for yield losses. Despite
a significant impact on the infected leaf area, Jørgensen et al. (2015) also reported no
significant yield increases from fungicide treatments due to the minor severity and late arrival
of the diseases in maize fields in Denmark. Thus, at late stages of plant development, the
outbreak of the disease has to be severe enough to have a significant impact on yield. This is
also supported by Urban (2012), who found that the outbreak of Turcicum leaf blight which
occurred in the late season (BBCH 85-89) in 2010 led to significant losses in grain yield. For
Kabatiella eyespot, the level of infected leaf area recorded at the end of September (≤6%) in
our trials in 2013 and 2014 were recorded by Urban (2012) one month earlier in 2011, with a
noticeable increase in the infected leaf area in September resulting in significant yield losses.
Another explanation for the results of our trials could be closely related to the resistance of
the respective hybrid used. Hybrids with moderate resistance against Turcicum leaf blight, as
was the case for the variety NK Silotop in 2014, can counteract the impact of the disease to a
greater extent. Although higher levels of disease severity were registered in the untreated
control compared to the treated plots, yield was not significantly affected. This explanation is
less plausible for Inzing in 2013 as the sown variety, Zidane, is classified as susceptible. In
this case, however, the low levels of disease are unlikely to have been sufficient to have a
significant negative effect on yield, even with a susceptible hybrid. This reasoning also
applies to the tested varieties in Ostenfeld in 2013 and 2014, Ronaldinio and Kalvin, which
are considered moderately susceptible to Kabatiella eyespot (levels of resistance in
commercial hybrids are not published). Significant yield losses were not observed here
either. Despite the inconsistency of these results, likely owing to the aforementioned low
disease severity, the importance of hybrids and variation in their susceptibility to leaf
diseases should not be underestimated. Several authors report significant differences in
performance among hybrids with respect to resistance levels for Turcicum leaf blight
(Guiomar 2011; Khot et al. 2006). Furthermore, information about the susceptibility of the
regional varieties sown is frequently provided by the regional body responsible for plant

Discussion
170
protection and private companies (Hiltbrunner et al. 2015). For Kabatiella eyespot, significant
differences in disease severity have also been reported among different maize hybrids
(Prończuk 2004; Formento et al. 2014).
An additional reason for the inconsistencies between infected leaf area and yield response in
our trials is related to the high variation in the data among repetitions of the same treatment.
Although repetitions were analysed separately in the linear regression, the high variation in
the data did not allow a significant negative relationship between yield and infected leaf area
to be established in three of the four field trials. The trial in which a significant negative
correlation was obtained (Inzing 2014) presented relatively harmonious results for repetitions
of the same treatment, with lower standard deviations than the other trials in general. Thus,
despite the fact that disease pressure was lower in 2014, a negative correlation between
yield and infected leaf area could be determined due to the consistency of the data. At the
same time, the high data variation could be due to external factors. In a field trial, these can
include the soil, water supply and fertilisation, factors which can never be completely uniform
(Schuster and Geidel 1978). In addition, for the trials in Ostenfeld, the distribution of
Kabatiella eyespot in the field was inconsistent. This was especially evident in 2014, where
certain areas of the trial were more infected than others. This was caused by external factors
unrelated to the effect of the fungicide.
For example, higher levels of humidity may have been concentrated in certain zones of the
trial due to its north-south orientation. Due to the height of the maize plant, prolonged
radiation (from higher exposure to sunlight) in the first blocks of repetitions (southern end of
the trial) would have caused a lower level of humidity. As a result, the plants dried out at a
quicker rate than in other areas of the trial. In these blocks, the severity of the disease was
noticeably lower. Thus, the orientation of field trials could be an important factor.
Finally, a potential, so-called “greening effect” could also have had an influence on the
correlation. In addition to the control of pathogens through inactivation, fungicides from the
strobilurine and triazole groups have secondary effects, stimulating physiological activity in
the plants to which they are applied. The “greening effect” refers to an increase in
photosynthetic activity through the higher production of chlorophyll, retarding the senescence
of the plant and producing a higher yield (Gerhard & Habermeyer 1998; Bryson et al. 2000;
Venancio et al. 2003; Häuser-Hahn et al. 2004). While an inhibition of the ethylene
biosynthesis is reported for triazoles, which leads to a delayed senescence (Siefer &
Grossmann 1996), strobilurins improve nitrogen metabolism, maintaining the green leaf area
for longer (Häuser-Hahn et al. 2004).
A potential example of the above phenomenon is the trial in Ostenfeld in 2013. Here, two
treatments applied at the vegetative stage (BBCH 55), namely fluopyram + prothioconazole

Discussion
171
and carbendazim + fluxilazole, provided a better control against Kabatiella eyespot than
propiconazole + azoxystrobin applied at flowering (BBCH 63) in terms of infected leaf area,
yet propiconazole + azoxystrobin provided a yield increase which was 6 dt/ha higher, on
average. A delay in the ripening could be observed in Inzing in 2014, where plots sprayed
with propiconazole + azoxystrobin applied at flowering (BBCH 65) were notably greener than
the other plots (Figure 79). Nonetheless, the infected leaf area recorded for all plots (non-
treated and treated) was similar. This result could not be methodically confirmed because
quantitative data on the green leaf area (green leaf area rating) were not registered.
Fig. 79. Mittich 2013. Example of greening effect observed between non-treated control and treated
with propiconazole + azoxystrobin applied at flowering (BBCH 63).
4.4.5. Economic thresholds
There is a lack of consensus in the literature with regard to economic thresholds and their
reliability in the decision-making process of applying fungicides to control maize leaf
diseases. To date there are no clear thresholds established for individual diseases (Wise and
Mueller 2011), making it difficult to quantitatively determine a level of disease severity at
which fungicide application is profitable (Munkvold et al. 2001). For example, while Paul et al.
(2011) established a difference between severity levels above and below 5% in relation to
economic benefits of application, the authors themselves maintained that the results were
unclear in terms of establishing fungicide thresholds. Studies such as these, however, may
be useful for further research on calculating thresholds. In Europe, despite some studies on
the relationship between yield and fungicide application, no thresholds have been developed

Discussion
172
due to the variation in the severity of diseases like Turcicum leaf blight and Kabatiella
eyespot across seasons, as well as the lack of research on fungicide application in general
(Jørgensen 2012). Some research on thresholds has been done in other countries such as
Argentina, establishing disease levels of 1.5% for common rust (P. sorghi) for a late
application (Carmona et al. 2011), while an application is recommended for Turcicum leaf
blight at a level of 1-5% (De Rossi 2015). In this case, the low thresholds are due to the
optimal climatic conditions (e.g. high humidity) which exist in certain regions of Argentina for
the development of foliar diseases, as well as favourable agricultural measures (e.g. non-
tillage, late sowing) (Diaz et al. 2012, Couretot et al. 2013).
Smith (2015) maintains that while a threshold can be a useful tool in order to understand the
disease levels which could be considered severe, the decision whether or not apply a
fungicide is dependent on a number of other factors. These include an analysis of the
symptoms in the field, susceptibility of the variety to the disease, prevailing weather
conditions and history of the disease in the specific location. For Turcicum leaf blight,
analysis of the initial symptoms is most important in the lower leaves as the disease can be
passed on to the ear leaves, which have the largest impact on yield. For Kabatiella eyespot,
on the other hand, Smith (2015) argues that management of the disease should involve the
use of resistant varieties and tillage (debris management). Significant yield losses are only
likely if the disease reaches levels above 50% and fungicide application may not be cost
effective if no other diseases are present. Robertson et al. (2007) state that fungicide
applications were rare until 2007 due to a lack of profitability, finding that the use of resistant
hybrids was an effective control method for Grey leaf spot and common rust.
The overwhelming consensus is that while fungicide applications on maize are effective in
increasing yields, this does not mean that there will always be a clear economic benefit. For
example, while there was a positive impact on yield for approximately 80% of 472 fungicide
treatments analysed in the US from 2008-2010, only 48% of these treatments resulted in a
positive economic benefit (Wise and Mueller 2011). Robertson et al. (2007) report similar
results, with a positive impact on yield for 77% of the studied locations, yet only a positive
economic benefit in 27% of the locations. As stated in section 3.4.7 regarding the calculation
of the threshold, the decision to apply a fungicide is dependent on whether the improvement
in yield and associated monetary benefit is sufficient to offset the costs of the fungicide
product and its application (Liu et al. 2015). The price of maize also has to be taken into
account here. As the maize price decreases, the threshold increases, and vice versa. For
example, taking the average yield loss of 0.118 t/ha for K. zeae from our calculations in
section 3.4.7, the threshold at a silage maize price of €32/t was 17%, while it would rise to
19% at a maize price of €30/t. On the other hand, an increase in the maize price to €36/t
would reduce the threshold to 15%. This is intuitive - if the price the farmer is receiving for his

Discussion
173
maize is higher, he can justify the expense of a fungicide application at lower levels of
disease severity. In fact, fungicide use on hybrid maize has risen in the US in recent years
due to, among other factors, an increase in the market price of maize (Wise and Mueller
2011). As an example, while Liu et al. (2015) found that fungicide applications provided an
overall economic benefit, this result was sensitive to the maize price used. The price (grain
maize) used for their calculations was an average price over a number of years (2009-2012)
and was higher ($5.24 / bushel)14 than recent US market prices (approx. $4 / bushel)15. At
this recent market price, the application of one of the fungicides used in their study would no
longer have been economically beneficial.
This lack of a clear economic benefit is especially noticeable at lower severity levels of the
disease. For an analysis of fungicide trials in 14 US states from 2002-2009, Paul et al. (2011)
concluded that there was a higher probability of a fungicide application having a positive
economic effect when disease severity was greater than 5% (the diseases present were grey
leaf spot, Turcicum leaf blight and common rust). Based on their results, a fungicide
application when disease severity was low (<5%) could not be recommended as the
probability of a fungicide application returning an economic benefit was less than 50%. In
addition, application at higher disease levels was economically beneficial if the maize price
was relatively high, application costs were low, and it could be determined with some
certainty that yields would be low without treatment. Furthermore, studies conducted in 2009
and 2010 found that only 3% of fungicide treatments resulted in a significant yield gain when
the disease severity of Turcicum leaf blight was, on average, less than 1% and no other
disease was present (Wise and Mueller 2011).
The above is pertinent for the fungicide trials carried out in 2013 and 2014 in Ostenfeld and
Mittich/Inzing. As the disease pressure was low in both locations, it was only possible to
obtain a negative correlation between disease and yield in Inzing 2014 (E. turcicum) and
Ostenfeld (K. zeae), of which only Inzing 2014 was statistically significant. Consequently, it is
debatable whether these were ideal years to draw conclusions about the suitability of a
fungicide application from an economic perspective, as well as the accuracy of the
associated thresholds calculated.
It is also argued that the decision to apply fungicides is made with factors other than
combating fungal diseases in mind, e.g. the increase in photosynthetic activity through
production of higher chlorophyll content, the so-called “greening effect”. This is known to
delay the senescence of the plant and produce higher yields (Venancio et al. 2003; Häuser-
14
This corresponds to a price of $206.29 per ton (price per bushel x 39.36825 = metric ton price; CME Group 2014). 15
This corresponds to a price of $157.47 per ton (CME Group 2014). Price used for calculations in this work (grain maize) was €160.

Discussion
174
Hahn et al. 2004). While it has been established that this can increase yields, it does not
necessarily provide an economic benefit. The delayed senescence can lead to a later
harvest date, which is problematic when harvesting large fields and can also become an
issue if bad weather in the late season has an adverse effect on the harvest. Furthermore,
the delayed senescence may require the harvesting of maize with high moisture content,
which can have a negative economic impact due to drying costs (Wise and Mueller 2011).
The benefit of the “greening effect” will depend on whether the associated monetary gain
from the increase in yield is sufficient to cover the cost of fungicide application.
To conclude, while there is a relatively clear positive relationship between yield and fungicide
applications, the economic benefit of an application is significantly less obvious, especially at
low disease levels. The use of economic thresholds to justify the application of fungicides
needs to be considered with caution, with a lack of specific thresholds for individual diseases
to date (Wise and Mueller 2011). Furthermore, overemphasis on economic thresholds may
understate the importance of factors such as variety susceptibility, cultural practices (e.g.
tillage) and climatic conditions. In the European context, while there is some research on the
relationship between fungicide application and yield losses, there is a distinct lack of
information on the economic decision-making process and thresholds related to the
application of fungicides. Future research is needed here in order to gain a greater
understanding of these relationships.

Discussion
175
4.4.6. Recommendations for application of fungicides on maize
Based on the points discussed above and the results in this study and related literature, a
number of recommendations with regard to effective fungicide application can be made for
the analysed regions (southern and northern Germany):
1) The use of resistant varieties and phytosanitary measures (tillage practices, crop
rotation) are effective methods to control the development of Turcicum leaf blight and
Kabatiella eyespot. If these measures are not sufficient or cannot be incorporated into
the management of maize, the use of fungicides becomes a feasible option.
2) If a resistant variety is being used, it is recommended to wait until early flowering to
ascertain whether the disease has developed to a sufficient level to apply a fungicide.
Hence, end of July is a key date in which to make an application decision (middle-late
application).
3) In most cases, an early application can be omitted as a viable option in southern and
northern Germany. However, an application at flowering is more complicated due to the
increased height of the plants.
4) An increase in infected leaf area in the late season (September) only produces
significant yield losses in severe cases. Currently, the likelihood of this occurring in
Germany is relatively low.
5) Compared to Turcicum leaf blight, the infected leaf area of Kabatiella eyespot will need
to be considerably higher to cause yield losses as the lesions are noticeably smaller and
cause less damage to the leaf.
6) The potential yield benefits of a fungicide application do not necessarily convert into
economic profit. This will depend on additional costs associated with application
compared to the monetary gain from yield increase (dependent on the maize price).
7) It is difficult to establish economic thresholds for individual maize leaf diseases due to a
number of factors which vary on a case-by-case basis such as hybrid susceptibility, level
of inoculum and climatic conditions. This illustrates the importance of a regional warning
service such as those in several regions in Germany. The use of spore traps could be
useful here to determine whether a fungicide application is necessary in the region and,
if so, the optimal timing of application based on spore dispersal/inoculum pressure.

Summary
176
Summary
In the last decade, there has been a progressive increase in the acreage of maize in Central
Europe due to its high yield and diverse uses such as food, feed and bio-energy. This has
led to more intense maize cultivation in many regions with narrowed crop rotations,
coinciding with an increased presence of certain maize leaf diseases. The knowledge about
the occurrence and significance of fungal pathogens and their epidemic development in
maize fields in Central Europe is however still limited. In order to gain a broader overview of
the phytosanitary state of maize crops in Central Europe, a qualitative monitoring of
potentially leaf infecting pathogens in maize was carried out in selected fields in Germany,
the Netherlands, Czech Republic, Austria, France and Poland in 2012 and 2013. Fungal
isolates obtained from collected leaf samples were analysed morphologically. For a number
of isolates, pathogenicity tests were conducted in the greenhouse by inoculating healthy
plants with spore suspensions prepared from single-spore cultures in order to fulfil Koch’s
postulates. The studies revealed that seven isolates of Kabatiella zeae (Kabatiella eyespot),
five isolates of Bipolaris zeicola (northern corn leaf spot), two unidentified isolates of Bipolaris
spp., two isolates of Colletotrichum graminicola (anthracnose) and six isolates of Phoma spp.
(Phoma leaf spot) fulfilled Koch´s postulates. The resulting disease symptoms were
described in detail. For three representative Phoma isolates (one pathogenic, two
saprophytic) which could not be clearly identified through morphological analysis, a
taxonomical assignment was carried out by the CBS-KNAW Fungal Biodiversity Centre
(Utrecht, the Netherlands). Following this analysis and comparisons with internal sequence
databases, the three isolates were confirmed as putative new species within the genus
Peyronellaea. Turcicum leaf blight and Kabatiella eyespot were confirmed as the most
important diseases in the monitored regions. In 2012 and 2013, a higher pressure of
Turcicum leaf blight was observed in southern regions of Germany (Bavaria, alpine foreland)
and northern Austria (alpine foreland). K. zeae was particularly widespread in fields of the
Netherlands and northern Germany (northern and western Lower Saxony and Schleswig-
Holstein). The importance of common rust was also confirmed in southern Germany.
The application of fungicides is considered an effective control method against the most
common leaf diseases Turcicum leaf blight (causal agent E. turcicum), common rust (causal
agent P. sorghi), and Kabatiella eyespot (K. zeae). Thus, a second part of the project
involved an analysis of the impact of various fungicide compounds: propiconazole +
axoxystrobin (Quilt Excel®), epoxiconazole + pyraclostrobin (Opera®), fluopyram +
prothioconazole (Propulse®) and carbendazim + flusilazole (Harvesan®). These were tested
under conditions of natural infection in two regions in Germany where the diseases are
prevalent, namely Mittich (2013) and Inzing (2014) in southern Germany and Ostenfeld
(2013 and 2014) in Northern Germany. For Turcicum leaf blight in (Mittich and Inzing),

Summary
177
statistically significant differences in disease severity between treated and untreated plots
were only registered in 2013. A statistically significant reduction of the infected leaf area was
also observed for common rust. In 2014, probably due to the low level of disease pressure in
the field, only one treatment (epoxiconazole + pyraclostrobin), applied at the early stage,
significantly reduced infected leaf area compared with the untreated control. Among
treatments, timing of application did not produce significant differences in infected leaf area
in both years. For Kabatiella eyespot in Ostenfeld, significant differences among all variants
of treated fungicide plots and untreated plots were registered in 2013 and 2014. Although
significant differences among timing of application was not registered in both years, a
tendency for optimal application at middle to late stages of maize plants was observed in
2013, i.e. tasseling to flowering (BBCH 51-BBCH 65). Statistically significant differences in
infected leaf area between treated and untreated plots did not translate into significant
positive yield responses. This was probably due to the low level of diseases in both years
and the high variation in data among repetitions.
In addition, linear regressions were run to determine the relationship between infected leaf
area and yield losses. A significant negative correlation between infected leaf area and yield
was only observed for Turcicum leaf blight in Inzing in 2014. Based on the regression
equations, economic thresholds were calculated to evaluate the minimum percentage of
infected leaf area which is necessary for a fungicide application to have a monetary benefit.
These results were discussed with regard to published thresholds and should be interpreted
with caution due to the difficulty of obtaining accurate thresholds for individual diseases. This
is especially pertinent at low levels of disease severity, which prevailed in the trials.
Spore dispersion patterns were analysed using a Burkard spore trap in Inzing in 2014
(E. turcicum, natural infection), Ostenfeld in 2013 and 2014 (K. zeae, natural infection) and
Göttingen in 2015 (E. turcicum und K. zeae, artificial inoculation). For E. turcicum, the daily
amount of spores was examined via microscopy and real-time qPCR. The number of spores
counted on tapes through microscopy was, on average, positively correlated with the DNA
yields obtained from tapes and analysed with qPCR. Hence, qPCR is a reliable alternative to
microscopic assessment for the evaluation of inoculum pressure and dispersal. On the
contrary, the detection of K. zeae presented difficulties via microscopy and qPCR, hampering
further analysis.
For E. turcicum, the data obtained from the spore trap correlated with disease development
in the field and favourable weather conditions. Moderate temperatures and high humidity
favoured sporulation in Inzing, while in Göttingen high temperatures and dry weather
promoted the expansion of lesions on the leaves. Based on the results of spore trapping in
Inzing and Göttingen and the estimation of the latent period, the epidemic of
E. turcicum was analysed in detail. Despite differences in the development of Turcicum leaf

Summary
178
blight and the origin of the inoculum (natural vs. artificial), the latent periods estimated for
E. turcicum turned out to be very similar in both locations (6/7-14 days) and similar to those
calculated in the literature (8-14 days). Furthermore, the latent period was shorter at the end
of the season, possibly due to the increased concentration of inoculum as the season
progressed.
Overall, the spore trap helped in gaining a more in-depth understanding of the development
of Turcicum leaf blight throughout the season. Thus, spore trapping can be very useful in
evaluating inoculum pressure during the season as part of an integrated pest management.
This could help to decide whether a fungicide application to control the disease is required
and, if so, the optimal timing of application.
References
179
References
Abadi, R., Levy, R.S. & Levy, Y. 1993. Mating types of Exserohilum turcicum in Israel.
Phytoparasitica, 21 (4), 315-20.
Adipala, E., Lipps, P.E. & Madden, L.V. 1993. Occurrence of Exserohilum turcicum on maize
in Uganda. Plant Disease, 77, 202-05.
AGES. 2016. Verzeichnis der in Österreich zugelassenen/genehmigten Pflanzenschutzmittel.
Austrian Agency for Health and Food Safety, Vienna, viewed 12 January 2016, <http://pmg.ages.at/pls/psmlfrz/pmgweb2$.Startup>
Agrinex. 2015. Registered pesticides in Hungary. Agrinex BT, Budapest, viewed 23
February, <http://www.neoland.hu/engedelyezett_novenyvedo_szerek_e.html>. Agrios, G.N. 2005. Plant Pathology. 5th. ed, Elsevier Academic Press, Burlington, MA. Alcorn, J.L. 1988. A new species of Exserohilum. Transactions of the British Mycological
Society, vol. 90 (1), 146-48.
Ali, M.E.K. & Warren, H.L. 1992. Anthracnose of sorghum. In W.A.J. De Milliano, R.A.
Frederiksen & G.D. Bengston (eds), Sorghum and Millets Diseases: A Second World Review, International Crops Research Institute for the Semi-Arid Tropics, Patancheru, Andhra Pradesh, 203-08.
Antonissen, G., Martel, A., Pasmans, F., Ducatelle, R., Verbrugghe, E., Vandenbroucke, V.
Li, S., Haesebrouck, F., Van Immerseel, F. & Croubels, S. 2014. The impact of Fusarium mycotoxins on human and animal host susceptibility to infectious diseases. Toxins, 6 (2), 430–52.
APS. 2012. Crazy top on corn. American Pathological Society, St. Paul, MN, viewed 16
February 2016, <http://www.apsnet.org/publications/imageresources/Pages/Iw000015.aspx>
Arny D.C., Smalley, E.B., Ullstrup, A.J., Worf, G.L. & Ahrens, R.W. 1970. Eyespot of maize, a
disease new to North America. Phytopathology, 61 (1), 54-57.
Arny, D.C. & Nelson, R.R. 1971. Phyllosticta maydis species nova, the incitant of Yellow Leaf
Blight of maize. Phytopathology, 61 (10), 1170-72.
Arthur, J. C. & Bisby, G.R. 1918. An annotated translation of the part of Schweinitz's two
papers giving the rusts of North America. Proceedings of the American Philosophical Society, 57 (3), 173-292.
Arvalis 2012. Maladies du mais: le point sur le rhizoctone et la rouille. Choisir Mais 2012.
Arvalis Institut du vegetal, Paris, pp. 61-67. Aveskamp, M.M., de Gruyter, J. & Crous, P.W. 2008. Biology and recent developments in
the systematics of Phoma, a complex genus of major quarantine significance. Fungal Diversity, 31, 1-18.
Aveskamp, M.M., de Gruyter, J., Woudenberg, J.H.C., Verkley, G.J.M. & Crous, P.W. 2010.
Highlights of the Didymellaceae: A polyphasic approach to characterise Phoma and related pleosporalean genera. Studies in Mycology, 65, 1–60.

References
180
Bamadhaj, H.M., Chan, G.F. & Rashid, N.A.A. 2016. Aureobasidium. In M. Rusell, M.
Paterson & N. Lima (eds), Molecular Biology of Food and Water Borne Mycotoxigenic and Mycotic Fungi, CRC Press, Boca Raton, FL, pp. 187-96.
Bartlett, D.W., Clough, J.M., Godfrey, C.R.A., Godwin, J.R., Hall, A.A., Heaney, S.P. &
Maund, S.J. 2001. Understanding the strobilurin fungicides. Pesticide Outlook, 12
(4), 143-48. Bartlett, D.W., Clough, J.M., Godwin, J.R., Hall, A.A., Hamer, M. & Parr-Dobrzanski, B. 2002.
The strobilurine fungicides. Pest Management Science, 58 (7), 649–62.
Beck, J.J. 1997. Detection of maize fungal pathogens using the polymerase chain reaction.
Patent No. 6,071,698. Becker, W.F., Von Jagow, G., Anke, T. & Steglich, W. 1981. Oudemansin, strobilurin A,
strobilurin B and myxothiazol: new inhibitors of the bc1 segment of the respiratory chain with an E-β-methoxyacrylate system as common structural element. FEBS Letters, 132 (2), 329–33.
Behr, M., Humbeck, K., Hause, G., Deising, H.B. & Wirsel, S.G. 2010. The hemibiotroph
Colletotrichum graminicola locally induces photosynthetically active green Islands but globally accelerates senescence on aging maize leaves. Molecular Plant-Microbe Interactions, 23 (7), 879-92.
Bello, O. B., Ganiyu, O.T., Wahab, M.K.A., Azeez, M.A., Abdulmaliq, S.Y., Ige, S.A.,
Mahmood, J., Oluleye, F. & Afolabi, M.S. 2012. Yield and disease reactions of quality protein maize varieties in the Southern Guinea Savanna agro-ecology of Nigeria. International Journal of Agriculture and Forestry, 2 (5), 203-209.
Bergamin Filho, A. & Amorim, L. 1996. Doenças de Plantas Tropicais: Epidemiologia e
Controle Econômico. Ed. Agronômica Ceres Lda, São Paulo.
Berger, R.D. 1970. Forecasting Helminthosporium turcicum attacks in Florida sweet corn.
Phytopathology, 60 (9), 1284.
Berger, R.D. 1973. Helminthosporium turcicum lesion numbers related to numbers of trapped
spores and fungicide sprays. Phytopathology, 63 (7), 930-33.
Berger, R.D., Bergamin Filho, A., & Amorim, L. 1997. Lesion expansion as an epidemic
component. Phytopathology, 87 (10), 1005-13.
Bergstrom, G.C. & Nicholson, R.L. 1999. The biology of corn anthracnose: knowledge to
exploit for improved management. Plant Disease, 83 (7), 596-608.
Bergstrom, G. 2014. Corn and soybean diseases in the northeastern U.S. Northwest Crop,
Soil and Dairy Meeting, UVM Extension, St.Albans, VT, January 21. Bills, G.F., González Menéndez, V. & Platas, G. 2012. Kabatiella bupleuri sp. nov.
(Dothideales), a pleomorphic epiphyte and endophyte of the Mediterranean plant Bupleurum gibraltarium (Apiaceae). Mycologia, 104 (4), 962-73.
Birch, C.J., Hammer, G.L. & Rickert, K.G. 1998. Temperature and photoperiod sensitivity of
development in five cultivars of maize (Zea mays L.) from emergence to tassel initiation. Field Crops Research, 55 (1-2), 93-107.

References
181
Bleicher, J., Balmer, E. 1993. A Grimpa model spore trap for Exserohilum turcicum conidia and its relationship between climatic conditions and capture of conidia. Summa Phytopathologica, 19 (2), 118-22.
Boerema, G.H. & Dorenbosch, M.M.J. 1973. The Phoma and Ascochyta species described
by Wollenweber and Hochapfel in their study on fruit-rotting. Studies in Mycology, 3, 1-50.
Boerema, G.H. 1997. Contributions towards a monograph of Phoma (Coelomycetes) V.
Subdivision of the genus in sections. Mycotaxon, 64, 321-33. Boerema, G.H., de Gruyter, J., Noordeloos, M. E. & Hamers, M.E.C. 2004. Phoma
Identification Manual. Differentiation of Specific and Intra-specific Taxa in Culture. CABI Publishing, Wallingford, UK.
Bonzani, R.M. & Oyuela-Caycedo, A. 2006. The gift of the variation and dispersion of maize:
social and technological context in Amerindian societies. In J. Staller, R. Tykot & B. Benz (eds), Histories of Maize: Multidisciplinary Approaches to the Prehistory, Biogeography, Domestication, and Evolution of Maize, Elsevier Academic Press,
New York, pp. 343-56. Borcean, A., David, G. & Nita, S. 2012. Study concerning the behavior of the fungus
Helminthosporium turcicum during 2009-2011 in the climate of Bozovici. Research Journal of Agricultural Science, 44 (2), 9-13.
Borchardt, D. S., Günter Welz, H. & Geiger, H.H. 1998. Molecular marker analysis of
European Setosphaeria turcica populations. European Journal of Plant Pathology, 104 (6), 611-17.
Bornemann, L. 2015. Blattkrankheiten im Mais – Den Pflanzenbau optimieren.
Landwirtschaftskammer Niedersachsen, Bremervörde, viewed 25 February, <http://www.lwk-niedersachsen.de/index.cfm/portal/2/nav/506/article/27571.html>
Bottalico, A. 1998. Fusarium diseases of cereals: Species complex and related mycotoxin
profiles in Europe. Journal of Plant Pathology, 80 (2), 85–103.
Bradley, C.A., Esker, P.D., Paul, P.A. & Robertson, A.E. 2010. Foliar fungicides for corn:
Targeting disease. Michigan State University, East Lansing, MI, viewed 30 April 2016, <http://www.fieldcroppathology.msu.edu/wp-content/uploads/2012/10/Foliar-Fungicides-for-Corn1.pdf>
Bradley, C.A. & Ames, K.A. Effect of foliar fungicides on corn with simulated hail damage.
Plant Disease, 94 (1), 83-86.
Brandfass, C. & Karlovsky, P., 2008. Upscaled CTAB‐based DNA extraction and real‐time
PCR assays for Fusarium culmorum and F. graminearum DNA in plant material with reduced sampling error. International Journal of Molecular Sciences, 9, 2306–21.
Brewbaker, J.L. 1979. Diseases of maize in the wet lowland tropics and the collapse of the
classic Maya civilization. Economic Botany, 33 (2), 101-18.
Broggi, L.E., González, H.H.L., Resnik, S.L. & Pacin, A. 2007, Alternaria alternata
prevalence in cereal grains and soybean seeds from Entre Ríos, Argentina. Revista Iberoamericana de Micología, 24 (1), 47-51.

References
182
Brown, J.K.M., Hovmøller, M.S., Wyand, R.A. & Yu, D.Z. 2002. Oases in the desert: dispersal and host specialization of biotrophic fungal pathogens of plants. In J.M. Bullock, R.E. Kenward & R.S. Hails (eds), Dispersal Ecology, Blackwell Science, Oxford, pp. 395-409.
Brunelli, K.T. 2004. Cercospora zeae-maydis: Esporulação, Diversidade Morfo-Genética e
Reação de Linhagens de Milho. PhD Thesis, USP/ESALQ, Piracicaba, São Paulo. Bryson, R. J., Leandro, L. & Jones, D. R. 2000. The physiological effects of kresoximmethyl
on wheat leaf greenness and the implication for crop yield. Proceedings of the Brighton Crop Protection Conference – Pest & Diseases, Brighton, 13 – 16
November, British Crop Protection Council, Farnham, UK, pp. 739-746. Bubák, F., & Kabát, J.E. 1907. Mykologische Beiträge IV. Hedwigia, 46, 288-98.
Bunker, R.N. & Mathur, K. 2006. Host range of leaf blight pathogen (Exserohilum turcicum)
of sorghum. Indian Phytopathology, 59 (3), 370-72.
Bunkoed, W., Supot, K., Chaijuckam, P., Yhamsoongnern, J. & Prathuangwong, S. 2014.
Sexual reproduction of Setosphaeria turcica in natural corn fields in Thailand. Kasetsart Journal - Natural Science, 48 (2), 175-82.
Bussay, A. 2015. Crop monitoring and yield forecasting – MARS activities in Eastern
European neighbourhood. GLOBCAST dissemination event, European Commission, Brussels, 30 September.
BVL. 2016. Verzeichnis zugelassener Pflanzenschutzmittel. Bundesamt für
Verbraucherschutz und Lebensmittelsicherheit, Braunschweig, viewed 15 February 2016, <https://apps2.bvl.bund.de/psm/jsp/index.jsp>
Cambra, M. & Bernal, I. 1996. Sclerospora macrospora (Sacc.) Thirum., Shaw y
Narasimhan. Cabeza loca. Fichas de diagnóstico en laboratorio de organismos nocivos de los vegetales. Ficha 70, MAPA, Madrid.
Cammack, R. H. 1959. Studies on Puccinia polysora Underw. III. Description and life cycle of
P. polysora in West Africa. Br. Mycol. Soc. Trans., 42, 55-58. Camochena, R.C. 2009. Reação de genótipos de milho à mancha ocular e caracterização do
agente causal. Dissertation. Universidade Tecnológica Federal do Paraná, Pato Branco.
Canhua L., Yixin, W., Honhing, H., Zichao, M. & Yueqiu, H. 2014. Identification of races and
mating types of Cochliobolus carbonum from corn in the Yunnan province in China. Journal of Phytopathology, 162 (5), 313–21.
Carmona, M., Sautua, F., Quiroga, M., Diaz, C. & Fernandez, P. 2011. Umbral de daño
económico (UDE) como herramienta para el manejo integrado de la roya común del maíz (Puccinia sorghi). Enfermedades Maiz – 2011, Aapresid, pp. 69-72.
Carson, M.L. 2005. Yield loss potential of Phaeosphaeria leaf spot of maize caused by
Phaeosphaeria maydis in the United States. Plant Disease, 89 (9), 986-88.
Carson, M.L. & Goodman, M.M. 2004. Pathogenicity, aggressiveness, and virulence of three
species of Cercospora associated with gray leaf spot of maize. Maydica, 51 (1), 89-
92.

References
183
Casela, C., Renfro, R.B. & Krattiger, A.F. 1998. Diagnosing maize diseases in Latin America.
ISAAA Briefs no. 9, ISAAA, Ithaca, NY & EMBRAPA, Brasilia, p. 57. Casselman, T.W. & Berger, R.D. 1970. An improved, portable automatic sampling spore
trap. Proceedings of the Florida State Horticultural Society, 83, 191-195. Cassini, R. 1973. Present state of maize diseases in France. Possibilities of control.
Workshop on phytosanitary problems of maize (diseases and pests). Rev. Pl. Pathol., 52, 646.
CBS. 2015. Fungi strains, 2015-12-06. Fungal Biodiversity Centre (CBS), Utrecht, viewed 8
April 2016, <http://www.gbif.org/occurrence/1212926150 on 2016-04-08>. Cervelatti, E.P., Paiva, E., Meirelles, W.F., Casela, C.R., Fernandes, F.T., Teixera, F.F. &
Paccola-Eirelles, L. 2002. Characterisation of fungal isolates from pycnidia and pseudothecia from lesions of Phaeosphaeria leaf spot in maize. Revista Brasileira de Milho e Sorgo, 1 (3), 30-37.
Chang, H.S., & Fan, K.C. 1986. Comparative studies on some biology and pathology of corn
and broom corn isolates of E. Turcicum (Pass) Leonard & Suggs. Botanic Bulletin of Academia Sinica, 27, 209-18.
Chen, Q., Jiang, J.R., Zhang, G.Z., Cai, L. & Crous, P.W. Resolving the Phoma enigma.
Studies in Mycology, 82, 137-217.
Chiang, M.S. & Hudon, M. 1990. Inheritance of resistance to Kabatiella eyespot of maize.
Phytoprotection, 71 (3), 107-12.
Chinchilla, L.C.M. 1985. Pathogen survival and host resistance in the eyespot disease of
maize caused by Kabatiella zeae Narita and Hiratsuka. Retrospective Theses and Dissertations. Paper 7827. Iowa State University, Ames, IA, viewed 30 November 2015, <http://lib.dr.iastate.edu/rtd/7827>
Chinchilla, C.M. 1987. Survival of Kabatiella zeae Narita and Hiratsuka in maize residues.
Turrialba,
37 (4), 311-16. Cooke, B. 1962. A taxonomic study in the “black yeasts”. Mycopathologia et mycologia
applicata, 17 (1), 1-43.
Couretot, L. 2011. Principales enfermedades del cultivo de maíz. Actas de VI Jornada de
Actualización Técnica de Maíz, Pergamino, Argentina, 9 August. Couretot, L., Parisi, L., Ferraris, G. & Magnone, G. 2012. Efecto de fungicidas foliares y
momento de aplicación sobre la severidad de tizón foliar y enfermedades de raíz y tallo en maíz. XIV Jornadas Fitosanitarias Argentina, San Luis, 3-5 October.
Couretot, L., Parisi, L., Hirsch, M., Suarez, M., Ferraris, G. & Magnone, G. 2013. Principales
enfermedades del cultivo de maíz en las últimas campañas y su manejo. Actas de VIII Jornada de Maíz, Pergamino, Argentina, 29 August.
Covas, G. 2011. Carbón común del maíz. Instituto Nacional de Tecnología Agropecuaria,
Estación Experimental Agropecuaria Anguil, La Pampa, Argentina.

References
184
Cramptom, B.G. 2014. Northern corn leaf blight in maize and sorghum – piecing together the puzzle. Dupont Plant Breeding Symposium 2015, Pretoria, 29 September.
Crouch, J. A. & Szabo, L. J. 2011. Real-time PCR detection and discrimination of the
southern and common corn rust pathogens Puccinia polysora and Puccinia sorghi. Plant Disease, 95 (6), 624-32.
Culqui Recalde, D.G. 2015. Estudio de la variabilidad patogénica de poblaciones de
Exserohilum turcicum y caracterización de la resistencia de variedades locales de maíz (Zea mays L.) de Cotacachi y Saraguro. Thesis, Central University of Ecuador, Quito.
CYMMIT. 2004. Enfermedades del maíz: una guía para su identificación en el campo. 4th
ed. CYMMIT, México, D.F. D’Mello, J.P.F., Placinta, C.M. & Macdonald, A.M.C. 1999. Fusarium mycotoxins: a review of
global implications for animal health, welfare and productivity. 80 (3-4), 183–205. Da Costa, F. M. 2007. Curvas de progresso de doenças foliares do milho, sob diferentes
tratamentos fungicidas. Master Thesis, São Paulo State University, Jaboticabal. Da Costa, R.V., Cota, L.V., da Silva, D.D., Parreira, D.F., Casela, C.R., Landau, E.C. &
Figueiredo, J.E.F. 2014. Races of Colletotrichum graminicola pathogenic to maize in Brazil. Crop Protection, 56, 44–49.
Darino, M.A., Rochi, L., Lia, V.V., Kreff, E.D., Pergolesi, M.F., Ingala, L.R., Dieguez, M.J.,
& Sacco, F. 2016. Virulence characterization and identification of maize lines resistant to Puccinia sorghi Schwein. present in the Argentine corn belt region. Plant Disease, 100 (4), 770-76.
De Gruyter, J., Noordeloos, M.E. & Boerema, G.H. 1993. Contributions towards a
monograph of Phoma (Coelomycetes) — I-2. Section Phoma: Additional taxa with very small conidia and taxa with conidia up to 7 µm long. Persoonia, 15 (3), 369–400.
De Gruyter, J. 2002. Contribution towards a monagraph of Phoma (Coelomycetes) – IX:
Section Macrospora. Persoonia, 18 (1), 85-102. De Hoog, G.S., Zalar, P., Urzì, C., de Leo, F., Yurlova, N.A. & Sterflinger, K. 1999.
Relationships of dothideaceous black yeasts and meristematic fungi based on 5.8S and ITS2 rDNA sequence comparison. Studies in Mycology, 43, 31–37.
Dekalb. 2015. Managing corn plant health to help maximize yield potential. Winnipeg,
Manitoba, viewed 15 December 2015, <https://www.dekalb.ca/eastern/en/agronomic-info/725-managing-corn-plant-health-to-help-maximize-yield-potential>
Demirci, E. & Kordali, S. 2000. Fungi isolated from corn kernels in the Eastern Black Sea
Region. Journal of Turkish Phytopathology 29 2/3 79-84.
De Rossi, R., Plazas, M., Brucher, E., Ducasse, D. & Guerra, G. 2010. El Tizón del Maíz
(Exserohilum turcicum): presencia e impacto en el centro norte de Córdoba durante
tres campañas agrícolas. Actas IX Congreso Nacional de Maíz, Rosario, Argentina, 17-19 November.

References
185
De Rossi, R. L., Merlo Reis, E. & Brustolin, R. 2012. Detecção e quantificação da infecção natural de Exserohilum turcicum em sementes de milho e milho pipoca. XXIX
Congresso Nacional De Milho E Sorgo, Águas de Lindóia, São Paulo, 26-30 August. De Rossi, R. L., Reis, E. M. & Brustolin, R. 2015. Morfologia de conídios e patogenicidade
de isolados de Exserohilum turcicum da Argentina e do Brasil em milho. Summa Phytopathologica, 41 (1), 58-63.
De Rossi, R. 2015. E. Turcicum. Jornadas maize workshop, INTA Pergamino, Argentina, 26-
28 February. De Rossi, R. L. & Reis, E.M. 2014. Semi-selective culture medium for Exserohilum turcicum
isolation from corn seeds. Summa Patopathologica, 40 (2), 163-67. De Rossi, R.L., Guerra, F.A., Plazas, M.C., Labaque, M. & Guerra, G.D. 2014.
Cercosporiosis del maíz (Cercospora zeae-maydis) en la región centro norte de Córdoba y en las localidades de Santiago del Estero y Chaco. X Congreso Nacional de Maíz, Rosario, Argentina, 3-5 September.
De Venter, T.V. 2000. Emerging food-borne diseases: a global responsibility. Food Nutr.
Agric., 26, 1–13.
Desjardins, A.E. 2006. Fusarium Mycotoxins: Chemistry, Genetics, and Biology, APS, St.
Paul, MN. Dey, U., Harlapur, S.I., Dhutraj, D.N., Suryawanshi, A.P., Badgujar, S.L., Jagtap, G.P. &
Kuldhar, D.P. 2012. Spatiotemporal yield loss assessment in corn due to common rust caused by Puccinia sorghi Schw. African Journal of Agricultural Research, 7
(37), 5265-69. Dey, U., Harlapur, S.I., Dhutraj, D.N., Suryawanshi, A.P. & Bhattacharjee, R. 2015.
Integrated disease management strategy of common rust of maize incited by Puccinia sorghi Schw. African Journal of Microbiology Research, 9 (20), 1345-51.
Diaz, C.G. 2011. Sintomatología y manejo de enfermedades del maiz en region noa.
National University of Tucumán, Argentina, viewed 15 January, <http://www.maizar.org.ar/documentos/sintomatologia%20y%20manejo%20de%20enfermedades%20del%20maiz%20en%20region%20noa.pdf>
Díaz, C.G., De Rossi, R.L., Couretot, L., Sillón, M. & Ploper, L.D. 2012. Efecto global del
fungicida: Azoxystrobina + Ciproconazolen el control de enfermedades foliares del maíz en Argentina. XXIX Congresso Nacional De Milho E Sorgo, Águas de Lindóia, São Paulo, 26-30 August.
Dill-Mackey, R. & Jones, R.K. 2000. The effect of previous crop residues and tillage on
Fusarium head blight of wheat. Plant Disease, 84 (1), 71-76.
Dingley, J. M. 1973. Eye Spot disease of maize in New Zealand. New Zealand Journal of
Agricultural Research, 16 (3), 325-28.
Diodato, N. & Bellocchi, G. 2008. Drought stress patterns in Italy using agro-climatic
indicators. Climate Research, 36, 53–63.
DMK. 2015. Fakten. Deutsches Maiskomitee e.V, Bonn, viewed 20 December 2016,
<http://www.maiskomitee.de/web/public/Fakten.aspx>

References
186
Do Amaral, A.L., de Carli, M.L., Barbosa Neto, J.F. & Dal Soglio, F.K. 2004. Phoma sorghina, a new pathogen associated with phaeosphaeria leaf spot on maize in Brazil. Plant Pathology, 53 (2), 259.
Dodd, J.L. & Hooker, A.L. 1990. Previously undescribed pathotype of Bipolaris zeicola on
corn. Plant Disease, 74 (7), 530. Dolezal, W.E. 2011. Corn rusts: Common rust, Southern rust & Tropical rust. Field Crops
Rust Symposium, San Antonio, TX, 14 December. Dos Santos I., da Silva, A. & Malagui, G. 2007. Occurrence of maize eyespot caused by
Kabatiella zeae in Paraná and Santa Catarina state, Brazil. Fitopatologia Brasileira,
32, (4), 359. Draper, M.A., Langham, M. A., Clay, S.A. & Ruden, B.E. 2009. Corn diseases in South
Dakota. In D.E. Clay, S.A, Clay, & K.D. Reitsma (eds), Best Management Practices for Corn Production in South Dakota, South Dakota State University, Brookings, SD,
pp. 59-69. Dubreuil P., Warburton, M. Chastanet, M., Hoisington, D. & Charcosset, A. 2006. More on
the introduction of temperate maize into Europe: Large-scale bulk SSR genotyping and new historical elements. Maydica, 51, 281-91.
Dunhin, B.J., Pretorius, Z.A., Bender, C.M., Kloppers, F.J. & Fletp, B.C. 2004. Description of
spore stages of Puccinia sorghi in South Africa. South African Journal of Plant and Soil, 21 (1), 48-52.
Eckard, S., Wettstein, F. E., Forrer, H.R. & Vogelgsang, S. 2011. Incidence of Fusarium
species and mycotoxins in silage maize. Toxins, 3 (8), 949-67.
Ellis, M.B. 1971. Dematiaceous Hyphomycetes, CABI Publishing, Wallingford, Oxfordshire.
Ellis, M.B. 1976. More Dematiaceous Hyphomycetes, CABI Publishing, Wallingford,
Oxfordshire. EPPO Guidelines. 2011. Foliar Diseases on Maize. Efficacy evaluation of fungicides. EPPO
Bulletin 41. European and Mediterranean Plant Protection Organization, Paris. EPPO. 2016. Global Database. European and Mediterranean Plant Protection Organization,
Paris, viewed 22 January 2016 <https://gd.eppo.int/> Esker, P. 2010. Standard area diagrams –Norther corn leaf blight. viewed 20 March 2016.
http://fyi.uwex.edu/fieldcroppathology/files/2011/03/Diagrams_NCLB_Corn.pdf Esteves, A. 1984. Incidência de doenças, sob condições de campo, em cultivares de milho
(Zea mays), em Dourados. Fitopatologia Brasileira, 9 (1), 155-160.
Esteves, M.C.F. 1989. Reações a Exserohilum turcicum (Pass.) Leonard & Suggs em milho
(Zea mays L.) e variabilidade do patógeno. Master Thesis, USP/ESALQ, Piracicaba,
São Paulo. Fantin, G.M. & Duarte, A.P. 2009. Manejo de doenças na cultura do milho safrinha. Instituto
Agronomico de Campinas, São Paulo.

References
187
FAO. 2013. Agriculture and trade background policy note: Ukraine. WTO commitments and support to Russian agriculture: issues and possible solutions. FAO, Kazan, Russia, 29-31 January
FAO. 2014. FAOSTAT Database Crops. FAO, Rome, viewed 20 March 2015, <
http://faostat.fao.org/site/567/DesktopDefault.aspx#ancor> FAO. 2015. Crop water information: maize. FAO Water Development and Management Unit,
Rome, viewed 20 December 2015, <http://www.fao.org/nr/water/cropinfo_maize.html>.
Favaro, L.C.L., De Melo, F. L., Aguilar-Vildoso, C. I. & Araújo, W.L. 2011. Polyphasic
analysis of intraspecific diversity in Epicoccum nigrum warrants reclassification into separate species. PLOS One, 6, 1-18.
Federal Statistical Office of Germany. 2015. Feldfrüchte und Grünland. Wiesbaden, viewed
21 January 2016, <https://www.destatis.de/DE/ZahlenFakten/Wirtschaftsbereiche/LandForstwirtschaftFischerei/FeldfruechteGruenland/Tabellen/FeldfruechteZeitreihe.html>
Fernández-Ortuño, D., Torés, J. A., De Vicente, A. & Pérez-García, A. 2010. The QoI
fungicides, the rise and fall of a successful class of agricultural fungicides. In O. Carisse (ed.), Fungicides, InTech, Rijeka, pp. 203-220.
Finch, H.J.S., Samuel, A.M. & Lane, G.P.F. 2014. Lockhart & Wiseman’s Crop Husbandry
Including Grassland, Woodhead Publishing / Elsevier, Cambridge.
Fisher, P.J., Petrini, O. & Lappin Scott, H.M. 1992. The distribution of some fungal and
bacterial endophytes in maize (Zea mays L.). New Phytologist, 122 (2), 299-305.
Formento A.N., Novelli, L.E., Pioli, R.N. & Ploper, L.D. 2014. Comportamiento de híbridos de
maíz a la mancha ocular (Kabatiella zeae) y al tizón foliar común (Exserohilum turcicum). X Congreso Nacional de Maíz, Rosario, Argentina, 3-5 September.
Formento, A.N., Velazquez, P.D., Carmona, M.A. & Scandiani, M.M. 2012. Manifestación de
las enfermedades foliares del maíz (Zea mays) según diferentes ambientes durante el ciclo agrícola 2011/12. XIV Jornadas Fitosanitarias Argentinas, INTA, Potrero de los Funes, San Luis, Argentina, p.161.
Formento, A.N. 2010. Enfermedades foliares reemergentes del cultivo de maíz: Royas
(Puccinia sorghi y Puccinia polysora), Tizón foliar (Exserohilum turcicum) y Mancha ocular (Kabatiella zeae). INTA Paraná, Argentina, viewed 30 January 2016,
<http://inta.gob.ar/sites/default/files/script-tmp-inta-enfermedades-foliares-reemergentes-del-cultivo-d.pdf>
Fowler, M. 1985. Diseases of maize in New Zealand. Maize: Management to market
symposium, Agronomy Society of New Zealand, Hamilton, August 1984, pp. 59-64. FRAC. 2016. Mode of action of fungicides. Fungicide Resistance Action Committee, viewed
24 February 2016, <http://www.frac.info/docs/default-source/publications/frac-mode-of-action-poster/frac-moa-poster-2016.pdf?sfvrsn=2>
Frederiksen, R.A. & Renfro, B. L. 1977. Global Status of Maize Downy Mildew. Annual
Review of Phytopathology, 15 (1), 249-75.

References
188
French Ministry of Agriculture. 2015. e-phy: Le catalogue des produits phytopharmaceutiques et de leurs usages des matières fertilisantes et des supports de culture homologués en France. French Ministry of Agriculture, Paris, viewed 19 February 2016, <http://e-phy.agriculture.gouv.fr/>
Frezzi, M. J. 1972. Mancha ocular del maíz (Kabatiella zeae) y tizón amarillo de la hoja del
maíz (Phyllosticta zeae) en la Argentina. Revista de Investigaciones Agropecuarias,
9 (2), 101-109. Garcés Fiallos, F.R., Aguirre Calderón, A. J., Carbo Morán, J.J. & Liubá Delfin, G.A. 2011.
Severidad de curvularia en 67 líneas autofecundadas S4 de maíz amarillo. Ciencia y Tecnología, 4 (2), 39-44.
Gatch, E.W. & Munkvold, G.P. 2002. Fungal species composition in maize stalks in relation
to European corn borer injury and transgenic insect protection. Plant Disease, 86
(10), 1156-62. Gates, L.F. & Mortimore, C.G. 1969. Three diseases of corn (Zea mays) new to Ontario:
crazytop, a Phyllosticta leaf spot and eyespot. Canadian Plant Disease Survey, 49
(4), 128-131. Gäumann, E. 1959. Die Rostpilze Mitteleuropas. Beiträge zur Kryptogamenflora der
Schweiz, 12, 1-1409.
Gerhard, M., & Habermeyer, J. 1998. Der Greening-Effekt. Getreidemagazin, 4 Jg. (2), 86-
90. Gonçalves, R.M., Figueiredo, J.E.F., Pedro, E.S., Meirelles, W.F., Leite Junior, R.P., Sauer,
A.V. & Paccola-Meirelles, L.D. 2013. Etiology of Phaeosphaeria leaf spot disease of maize. Journal of Plant Pathology, 95 (3), 559-69.
González, A.J. & González Varela, G. 2007. Ensayo in vitro de fungicidas frente a
Exserohilum turcicum, agente causal de tizón norteño del maíz, en Asturias. Boletín de Sanidad Vegetal. Plagas, 33 (2), 289-96.
Gostincar, C., Ohm, R.A., Kogej, T., Sonjak, S., Turk, M., Zajc, J., Zalar, P., Grube, M., Sun,
H., Han, J., Sharma, A., Chiniquy, J., Ngan, C.Y., Lipzen, A., Barry, K., Grigoriev, I.V. & Gunde-Cimerman, N. 2014. Genome sequencing of four Aureobasidium pullulans varieties: biotechnological potential, stress tolerance, and description of new species. BMC Genomics, 15 (1), 549.
Guiomar, P.M.C.N. 2011. Avaliação do comportamento de cultivares de milho na presença
da helmintosporiose causada por Exserohilum turcicum (Pass.) Leonard & Suggs.
Master Thesis. ISA, Lisbon. Hack, H., Bleiholder, H., Buhr, L., Meier, U., Schnock-Fricke, U., Weber, E. & Witzenberger,
A. 1992. Einheitliche Codierung der phanologischen Entwicklungsstadien mono- und dikotyler Pfl anzen - Erweiterte BBCH-Skala, Allgemein. Nachrichtenbl. Deut. Pflanzenschutzd, 44, 265-70.
Halseth, D.E., Pardee, W.D. & Viands, D.R. 1991. Inheritance of resistance to
Helminthosporium carbonum race 3 in maize. Crop Science, 31 (3), 612-17. Hanhart, H. 2012. Diese Pilze schädigen. Top Agrar, October, pp. 62-63.

References
189
Harlapur. S.I. 2005. Epidemiology and management of Turcicum leaf blight of maize caused
by Exserohilum turcicium (Pass.) Leonard and Suggs. Doctoral Thesis. Dharwad University of Agricultural Sciences, Dharwad, India.
Häuser-Hahn, I., Baur, P., & Schmitt, W. 2004. Prothioconazole - a new dimension DMI:
Biochemistry mode of action, systemics effects. Pflanzenschutz Nachrichten Bayer,
57 (2), 237-48. Headrick, J. M. & Pataky, J. K. 1986. Effects of night temperature and mist period on
infection of sweet corn by Puccinia sorghi. Plant Disease, 70, 950-953.
Heitefuss, R. Pflanzenschutz: Grundlagen der praktischen Phytomedizin. 3rd ed. Georg
Thieme Verlag, Stuttgart. Hermanides-Nijhof, E.J. 1977. Aureobasidium and allied genera. Studies in Mycology, 15,
141-77. Higuera-Gundy, A. 1991. Antillean vegetational history and paleoclimate reconstructed from
the paleolimnological record of Lake Miragoane, Haiti. PhD Thesis, University of Florida, Gainesville, FL.
Hiltbrunner J., Buchmann, U. & Pignon, P. 2015. Ergebnisse Bonituren Exserohilum turcicum
2014-2015. Resultatheft 29 December 2015, Hrsg. Agroscope, Reckenholz.
Holliday, P. 1980. Fungus Diseases of Tropical Crops. Cambridge University Press,
Cambridge. Hooker, A.L. 1973. Maize. In R. R. Nelson (ed.), Breeding Plants for Disease Resistance:
Concepts and Applications, Pennsylvania State University Press, Harrisburg, pp.
135-40. Hooker, A.L. 1985. Corn and sorghum rusts. In A.P. Roelfs & W.R. Bushnell (eds),The
Cereal Rusts: Diseases, Distribution, Epidemiology, and Control. Volume 2.
Academic Press, London, pp. 207-36. HSE. 2016. Pesticides register of UK authorised products. Health and Safety Executive,
Bootle, UK, viewed 25 February 2016, <https://secure.pesticides.gov.uk/pestreg/default.asp>
Iftikhar, S., Asad, S., Munir, A., Sultan, A. & Ahmad, I. 2009. Hosts Of Bipolaris sorokiniana,
the major pathogen of spot blotch of wheat in Pakistan. Pak . J. Bot., 41(3), 1433-36.
Jackson, T.A. 2008. Rust diseases of corn in Nebraska. G08-1680. Paper 2815. University of
Nebraska-Lincoln Extension, Lincoln, NE. Jackson-Ziems, T.A., Rees, J.M. & Harveson, R.M. 2014. Common stalk rot diseases of
corn. EC1898. University of Nebraska-Lincoln Extension, Lincoln, NE. Jeffers, D. & Chapman, S.C. 1994. Yield losses associated with E. Turcicum and P. Sorghi in
high disease incidence environments. In D.C. Jewell, S.R. Waddington, J.K. Ransom & K.V. Pixley (eds), Maize Research for Stress Environments. Proceedings of the fourth Eastern and Southern Africa Regional Maize Conference, Harare,
Zimbabwe, pp. 157-59.

References
190
Jeffers, D. 1994. Maize pathology research for the subtropics and highlands. In M.S.
Bjarnason (ed.), The Subtropical, Midaltitude, and Highland Maize Subprogram, Maize Program Special Report, CYMMIT, Mexico, pp. 63-69.
Jimenez-Diaz, R.M. & Boothroyd, C.W. 1976. Suscept-pathogen relationship in maize
affected by Yellow Leaf Blight. Phytopathology, 66 (10), 1169-73.
Jimenez-Diaz, R.M. & Boothroyd, C.W. 1979. Role of ascospores of Mycosphaerella zeae-
maydis in the epidemics of yellow leaf blight of maize. Phytopathologia Mediterranea, 18, 3-9.
Jinjikhadze, Z. 2001. Maize cultivation and production in Georgia. In M. Srinivasan, M.
Karabayev & D. Bedoshvili (eds), Maize Production and Improvement in Central Asia and Caucasus, CIMMYT, Almaty, Kazakhstan, pp. 25-28.
Jørgensen, L.N. 2012. Significant yield increases from control of leaf diseases in maize – an
overlooked problem?!. Outlooks on Pest Management, 23 (4), 162-65.
Jørgensen, L.N., Nielsen, B.J., Jensen, P.K., Kudsk, P., Mathiassen, S.K., Hartvig, P. &
Kristensen, M. 2015. Applied Crop Protection 2014. DCA Report No. 058, April
2015. Danish Center for Food and Agriculture, Aarhus University, Slagelse. Juliatti, F.C., Juliatti, F.C., Juliatti, B.C.M. & Jaccoud-Filho, D.S. 2013. Technology of
pesticide application in corn – nozzles, sprays volume, economic analysis and diseases control. In M. Nita (ed.), Fungicides – Showcases of Integrated Plant Disease Management from Around the World, InTech, Rijeka, pp. 99-116.
Jurca Grigolli, J.F. 2009. Doenças do milho safrinha. In Tecnologia e Produção: Milho
Safrinha e Culturas de Inverno, Fundação MS, Maracaju, Mato Grosso do Sul, pp. 90-104.
Kaczmarek, J., Jędryczka, M., Fitt, B.D.L., Lucas J.A. & Latunde-Dada, A.O. 2009. Analyses
of air samples for ascospores of Leptospheria maculansand L.biglobosa by light microscopy and molecular techniques. Journal of Applied Genetics, 50 (4), 411-19.
Kellermann, W.A. 1906. Uredinospores culture experiments with Puccinia sorghi, 1905. 12
(1), 9-11. Kenny, G.J. & Harrison, P.A. 1992. Thermal and moisture limits of grain maize in Europe:
model testing and sensitivity to climate change. Climate Research, 2 (2), 113-29.
Khot, G. G., Harer, P. N., Deokar, A. T., Ankalkhope, M. N. & Teli, V.S. 2006. Performance of
maize hybrids against Turcicum blight incited by Exserohilum turcicum (Pass) Leonard & Suggs. Karnataka Journal of Agricultural Sciences, 19 (3), 722-23.
Kinyua, Z.M., Smith, J.J., Kibata, G.N., Simons, S.A. & Langat, B.C. 2010. Status of grey leaf
spot disease in Kenyan maize production ecosystems. African Crop Science Journal, 18 (3), 183-94.
Kleckzewski, N. 2014. Anthracnose leaf blight and stalk rot of corn. University of Delaware
Cooperative Extension, Newark, DE, viewed 12 December 2015,
<http://extension.udel.edu/factsheets/anthracnose-leaf-blight-and-stalk-rot-of-corn/> Kranz, J. 2003. Comparative Epidemiology of Plant Diseases. Springer-Verlag, Berlin.

References
191
Kreisel, H. & Scholler, M. 1994. Chronology of phytoparasitic fungi introduced to Germany and adjacent countries. Botanica Acta, 107 (6), 369-472.
Krishna, K.R. 2013. Maize Agroecosystem: Nutrient Dynamics and Productivity. Apple
Academic Press, Oakville, ON. Kropf, U. & Schlüter, K. 2013. Mais: Verluste durch Kabatiella. Top Agrar Magazin,
September, pp. 44-49.
Kumar S., Pardurange Gowda, K.T., Pant, S.K., Shekhar, M., Kumar, B., Kaur, B., Hettiara
Chchi, K., Singh, O.N. & Parsanna, B.H. 2011. Sources of resistance to Exserohilum turcicum (Pass.) and Puccinia polysora (Underw.) incitant of turcicum leaf blight and polysora rust of maize. Archives of Phytopathology and Plant Protection, 44, 528-36.
Kumar, S., Kumar, P., Bana, J.K., Shekhar, M., Sushil, D.N., Sinha, A.K., Asre, R., Kapoor,
K.S., Sharma, O.P., Bhagat, S. Sehgal, M., Boopathi, T. Amaresan, N., Chattopadhyay, C., Satyagopal, K. & Jeyakumar, P. 2014. Integrated Pest Management Package for Maize. NCIPM, New Delhi.
Lambotte, J.B.E. & Fautrey, F. 1894. Espèces nouvelles ou rares de la Côte d'Or. Revue
Mycologique Toulouse, 16, 159-163.
Lane, C.S., Horn, S.P., Orvis, K.H. & Mora, C.I. 2008. The earliest evidence of ostionoid
maize agriculture from the interior of Hispaniola. Caribbean Journal of Science, 44
(1), 43-52. Leach, C.M. 1975. Influence of relative humidity and red-infrared radiation on violent spore
release by Drechslera turcica and other fungi. Phytopathology, 65 (11), 1303-12.
Leach, C.M., Fullerton, R.A. & Young, K. 1977. Northern leaf blight of maize in New Zealand:
Release and dispersal of conidia of Drechslera turcica. Phytopathology, 67 (3), 380-
87. Leonard, K.J. 1973. Polymorphisms for lesion type, fungicide tolerance, and mating capacity
in Cochliobolus carbonum isolates pathogenic to corn. Canadian Journal of Botany,
56 (15), 1809-15. Leonard, K.J. & Suggs, E.G. 1974. Setosphaeria prolata, the ascigerous state of
Exserohilum prolatum. Mycologia, 66 (2), 281-97. Leonard, K. J. & Thompson, D.L. 1976. Effects of temperature and host maturity on lesion
development of Colletotrichum graminicola on corn. Phytopathology, 66 (5), 635-39. Leonard, K.J. & Leath, S. 1990. Genetic diversity in field populations of Cochliobolus
carbonum on corn in North Carolina. Phytopathology, 80 (11), 1154-59.
Leslie, J. F. & Summerell, B. A. 2006. The Fusarium Laboratory Manual. Blackwell
Publishing, Oxford. Levic, J. & Pencic, V. 1980. New isolates of Helminthosporium spp. from maize. Proceedings
of the 5th Congress of the Mediterranean Phytopathological Union. 5, 115-17.
Levy, Y. & Cohen, Y. 1980. Sporulation of Helminthosporium turcicum on sweet corn: Effects of temperature and dew period. Canadian Journal of Plant Pathology, 2, 65-69.

References
192
Levy, Y. & Cohen, Y. 1983. Biotic and environmental factors affecting infection of sweet corn with E. turcicum. Phtopathology, 73 (5), 722-25.
Levy, Y. 1984. The overwintering of Exserohilum turcicum in Israel. Phytoparasitica, 12 (3),
177-82. Levy, Y. 1991. Variation in fitness among field isolates of Exserohilum Turcicum in Israel.
Plant Disease, 75 (2), 163-66.
Levy, Y. & Pataky, J.K. 1992. Epidemiology of Northern leaf blight on sweet corn.
Phytoparasitica,
20 (1), 53-66. LfL. 2015. Blattfleckenkrankheiten an Mais. Bayerische Landesanwalt für Landwirtschaft,
Freising, viewed 20 November 2015, < http://www.lfl.bayern.de/ips/blattfruechte/030221/>
LWK NRW. 2012. Landessortenversuche Körnermais 2012. Landwirtschaftskammer
Nordrhein-Westfalen, Münster, viewed 30 January 2013, <https://www.landwirtschaftskammer.de/landwirtschaft/ackerbau/mais/koernermais-sv-2012.htm>
Li, G.F. K. X. Liu, S. Q. Xiao, Y. Y. Lu. & C. S. Xue. 2016. First report of leaf spot of maize
(Zea mays) caused by Bipolaris spicifera in China. Plant Disease, 100 (4), 855.
Linares, A. & Martinez, Y.C. 1971. Mancha amarilla del maíz (Kabatiella zeae). Boletín de
Divulgación Técnica 10, INTA EEA Pergamino, Argentina. Lipps, P.E. 1983. Survival of C. graminicola in infested corn residues in Ohio. Plant Disease,
67 (1), 102-04. Lipps, P.E. 1997. Interaction of Ht and partial resistance to E. turcicum in maize. Plant
Disease, 81 (3), 277-82. Lipps, P.E. 1998. Gray Leaf Spot: A Global Threat to Corn Production. APSnet Features.
American Pathological Society, St. Paul, MN, viewed 8 December 2015, <http://www.apsnet.org/publications/apsnetfeatures/Pages/GrayLeafSpot.aspx>
Lipps, P.E. & Mills, D.R. 2001. Factsheet: Northern Leaf Spot of Corn. Ohio State University
Extension, Columbus, OH. Liu, Y., Langemeier, M. & Wise, K. 2015. Economic benefits of fungicide use in corn
production. Conference Paper. Southern Agricultural Economics Association’s Annual Meeting, Atlanta, GA, January 31 – February 3.
Liu, M., Gao, J., Yin, F., Gong, G., Cheng, Q., Ye, K., Zhang, M., Sun, X., Zhou, Y. & Zhang,
Y. 2015. Transcriptome analysis of maize leaf systemic symptom infected by Bipolaris zeicola. PLoS One, 10 (3).
Lundell, C.L. 1937. The Vegetation of Petén. Carnegie Institution of Washington,
Washington, D.C. Luttrell, E.S. 1958. The perfect stage of Helminthosporium turcicum. Phytopathology, 48 (5),
281-87.

References
193
McFeeley, J.C. 1971. Comparison of isolates causing yellow leaf-blight in Ohio. Plant Disease Reporter, 55, 12.
Mahindapala, R. 1978. Occurrence of maize rust, Puccinia sorghi, in England. Transactions
of the British Mycological Society, 70 (3), 393-99.
Mainka, C., Ortega, V. & Schulte, M. 2012. Breeding for Helminthosporium turcicum leaf
disease resistance in early maize. 58. Deutsche Pflanzenschutztagung "Pflanzenschutz – alternativlos", Braunschweig, 10-14 September.
Malaguti, G. & Subero, L. 1971. El tizon de las hojas del maiz causado por
Helminthosporium maydis en Venezuela. Agronomía Tropical, 21 (4), 299-312.
Malaguti, G. 2000. Enfermedades del maíz en Venezuela. In H. Fontana & C. González
(eds), El maíz en Venezuela, Fundacion Polar, Caracas.
Martin, T. 2011. Setosphaeria turcica, fungal mating and plant defence. Doctoral Thesis,
Swedish University of Agricultural Sciences, Uppsala. Martini, M., Musetti, R., Grisan, S., Polizzotto, R., Borselli, S., Pavan, F. & Osler, R. 2009.
DNA-dependent detection of the grapevine fungal endophytes Aureobasidium pullulans and Epicoccum nigrum. Plant Disease, 93 (10), 993-98.
Mateescu, E., Smarandache, M., Jeler, N. & Apostol, V. 2013. Drought conditions and
management strategies in Romania. Initiative on “Capacity Development to support National Drought Management Policy” (WMO, UNCCD, FAO and UNW-DPC),
Country Report, viewed 15 December 2015, <http://www.ais.unwater.org/ais/pluginfile.php/548/mod_page/content/75/ Romania_CountryReport.pdf>
Matsuoka, Y., Vigouroux, Y., Goodman, M.M., Sanchez, J., Buckler, G.E. & Doebley, J.
2002. A single domestication for maize shown by multilocus microsatellite genotyping. Proceedings of the National Academy of Sciences of the USA, 99 (9), 6080–84.
Mauler-Machnik, A., Rosslenbroich, H.J., Dutzmann, S., Applegate, J. & Jautelat, M. 2002.
JAU 6476 - a new dimension DMI Fungicide. The BCPC conference Pests and Diseases, BCPC, Farnham, UK, pp. 389-394.
McDevitt, J.J., Lees, P.S.J., Merz, W.G. & Schwab, K.J. 2007. Inhibition of quantitative PCR
analysis of fungal conidia associated with indoor air particulate matter. Aerobiologia,
23, 35–45. Meitz-Hopkins, J.C., von Diest, S.G., Koopman, T.A., Bahramisharif, A. & Lennox, C.L. 2014.
A method to monitor airborne Venturia inaequalis ascospores using volumetric spore traps and quantitative PCR. European Journal of Plant Pathology, 140 (3),
527–41. Mendes, M.A.S., da Silva, V.L., Dianese, J.C., Ferreira, M.A.S.V., Santos, C.E.N., Gomes
Neto, E., Urben, A.F. & Castro, C. 1998. Fungos em Plants no Brasil. Embrapa-SPI/Embrapa-Cenargen, Brasilia.
Mercer, P. & Gilliland, T. 1999. Occurrence of Puccinia sorghi on maize in Northern Ireland.
EPPO Bulletin, 29 (1-2), 203-04. Milatovic, I. 1976. Diseases of maize in 1976. Biljna Zaztita, 21 (1), 26-28.

References
194
Minrol. 2016. Online database on plant protection products. Poland Ministry of Agriculture
and Rural Development, Warsaw, viewed 20 February 2016, <http://www.minrol.gov.pl/eng/Ministry/Online-database-on-plant-protection-products>
Moya-Elizondo, E.A., Arismendi, N., Montalva, C. & Doussoulin, H. 2013. First report of
Fusarium sporotrichioides causing foliar spots on forage corn in Chile. Plant Disease, 97 (8), 1113.
Mubeen, S., Rafique, M., Munis, M.F.H. & Chaudhary, H.J. 2015. Study of southern corn leaf
blight (SCLB) on maize genotypes and its effect on yield. Journal of the Saudi Society of Agricultural Sciences, viewed 20 December 2015 http://www.sciencedirect.com/science/article/pii/S1658077X15000272
Muiru, W.M. 2008. Histological studies and characterization of races of Exserohilum turcicum
the causal maize agent of northern leaf blight of maize in Kenya. PhD Thesis. Muis, A., Pakki, S. & Nonci, N. 2010. Major corn diseases in Palu Valley of Indonesia and
their control. In P.H. Zaidi, M. Azrai & K.V. Pixley (eds), Maize for Asia: Emerging Trends and Technologies. Proceedings of the 10th Asian Regional Maize Workshop, Makassar,
Indonesia, 20 - 23 October. Mukunya, D.M. & Boothroyd, C.W. 1973. Mycosphaerella zeae-maydis sp. n., the sexual
stage of Phyllosticta maydis. Phytopathology, 63 (4), 529-32.
Müller, M. 1991. Alternaria infestation of corn silage and hay. Zentralblatt für Mikrobiologie,
146 (7-8), 481-88. Multani, D.S., Meeley, R.B., Paterson, A.H., Gray, J., Briggs, S.P. & Johal, G.S. 1998. Plant–
pathogen microevolution: Molecular basis for the origin of a fungal disease in maize. Proceedings of the National Academy of Sciences of the USA, 95 (4), 1686–91.
Munkvold, G.P. & Hellmich, R.L. 2000. Genetically modified, insect resistant maize:
Implications for management of ear and stalk diseases. APSnet Features. American Pathological Society, St. Paul, MN, viewed 1 April 2016, <http://www.apsnet.org/publications/apsnetfeatures/
Pages/InsectResistantCorn.aspx> Munkvold, G. P., Martinson, C. A., Shriver, J. M. & Dixon, P. M. 2001. Probabilities for
profitable fungicide use against gray leaf spot in hybrid maize. Phytopathology, 91,
477-84. Munkvold, G. & Martinson, C. 2001. Eyespot of Corn. Iowa State University Extension,
Ames, IA, viewed 8 December 2015, <https://store.extension.iastate.edu/Product/pm963-pdf.>
Munkvold, G.P. 2003. Epidemiology of Fusarium diseases and their mycotoxins in maize
ears. European Journal of Plant Pathology, 109, 705-13. Mycobank. 2016. Database. CBS-KNAW, Utrecht, viewed 14 April 2016,
<http://www.mycobank.org/ Biolomics.aspx?Table=Mycobank>

References
195
Narita, T. & Hiratsuka, Y. 1959. Studies on Kabatiella zeae n. sp., the causal fungus of a new leaf spot disease of corn. Annals of the Phytopathological Society of Japan, 24 (3),
147-53. Navi, S.S., Bandyopadhyay, R., Hall, A.J., & Bramel-Cox, P.J. 1999. A pictorial guide for the
identification of mold fungi on sorghum grain. Information Bulletin no. 59. International Crops Research Institute for the Semi-Arid Tropics, Patancheru, Andhra Pradesh, p. 118.
Neergard, P. 1969. Seed-borne diseases. Inspection for quarantine in Africa. In Handbook
for Phytosanitary Inspectors in Africa. Lagos, Nigeria, pp. 380-93
Nelson, R.R. 1959. Cochliobolus carbonum, the perfect stage of Helminthosporium
carbonum. Phytopathology, 49, 807-10.
Nelson, R.R. 1982. Cochliobolus carbonum. EPPO Bulletin, 12 (1), 37–40. Neuhaus, W. 1970. Verbreitung und jahreszeitliches Auftreten des Maisrostes (Puccinia
sorghi Schweinitz) in der DDR und den benachbarten Ländern. Nachrichtenblatt des Deutschen Pflanzenschutzdienstes, 24 (12), 229-31.
Newsom, L. A. & Deagan, K.A. 1994. Zea mays in the West Indies: The archaeological and
early historic record. In S. Johannessen and C. A. Hastorf (eds), Corn and Culture in the Prehistoric New World, Westview Press, Boulder, pp. 203-17.
Nguyen, T.T.X. 2014. Comparative studies on the infection and colonization of maize leaves
by Fusarium graminearum, F. proliferatum and F. verticillioides. PhD Thesis, University of Bonn.
Niaz, I. & Dawar, S. 2009. Detection of seed borne mycoflora in maize (Zea mays L.).
Pakistan Journal of Botany, 41 (1), 443-51.
Nicholson, R.L. & Moraes, W.B.C. 1980. Survival of Colletotrichum graminicola: Importance
of the spore matrix. Phytopathology, 70 (3), 255–61.
Nwanosike, M. R., Mabagala, R.B. & Kusolwa, P.M. 2015. Disease intensity and distribution
of Exserohilum turcicum incitant of northern leaf blight of maize in Tanzania. International Journal of Pure and Applied Bioscience, 3 (5), 1-13.
Nyvall, R.F. & Martinson, C.A. 1997. Controlling corn diseases in conservation tillage. Iowa
State University Extension, Ames, IA, viewed 15 December 2015, <http://store.extension.iastate.edu/Product/Controlling-Corn-Diseases-in-Conservation-Tillage-PDF.>
Ogliari, J.B., Guimaraes, M.A., Geraldi, I.O. & Camargo, L.E.A. 2005. New resistance genes
in the Zea mays L. - Exserohilum tucicum pathosystem. Genet Mol Biol, 28, 435-
439. Ohm, R.A., Feau, N., Henrissat, B., Schoch, C.L., Horwitz, B.A. Barry, K.W., Condon, B.J.,
Copeland, A.C., Dhillon, B., Glaser, F., Hesse, C.N., Kosti, I. LaButti, K., Lindquist, E.A., Lucas, S., Salamov, A.A., Bradshaw, R.E., Ciuffetti, L. Hamelin, R.C., Kema, G.H., Lawrence, C., Scott, J.A., Spatafora, J.W., Turgeon, B.G., de Wit, P.J., Zhong, S., Goodwin, S.B. & Grigoriev, I.V. 2012. Diverse lifestyles and strategies of plant pathogenesis encoded in the genomes of eighteen Dothideomycetes fungi. PLoS Pathogens, 8 (12), 1-26.

References
196
Oren, L., Ezrati, S., Cohen, D. & Sharon, A. 2003. Early events in the Fusarium verticillioides-maize interaction characterized by using a green fluorescent protein-expressing transgenic isolate. Applied and Environmental Microbiology, 69 (3), 1695–1701.
Pagán Jiménez, J.R., Rodríguez López, M.A., Chanlatte Baik, L.A., & Narganes Storde, Y.
2005. La temprana introducción y uso de algunas plantasdomésticas, silvestres y cultivos en Las Antillas precolombinas. Una primera revaloración desde la perspectiva del “arcaico” de Vieques y Puerto Rico. Diálogo antropológico, 3 (10),
7-33. Paliwal, R.L. 2001. El maíz en los trópicos: mejoramiento y producción. Food and Agriculture
Organization of the United Nations (FAO), Rome. Pataky, J.K. 1992. Relationships between yield of sweet corn and northern leaf blight caused
by Exserohilum turcicum. Phytopathology, 82, 370-75. Pataky, J.K. & Eastburn, D.M. 1993. Comparing partial resistance to Puccinia sorghi and
applications of fungicides for controlling common rust on sweet corn. Phytopathology, 83 (10), 1046-51.
Pataky, J.K. & Snetselaar, K.M. 2006. Common smut of corn. APS, St. Paul, MN,
viewed 3 December 2015, <http://www.apsnet.org/edcenter/intropp/ lessons/fungi/Basidiomycetes/Pages/CornSmut.aspx>
Pataky, J.K. & Tracy, W. 1999. Widespread occurrence of common rust, caused by Puccinia
sorghi, on Rp-resistant sweet corn in the midwestern United States. Plant Disease, 83 (12), 1177.
Pataky, J.K., Plaisted, D.C., Scholten, D. & de Durand, H.F. 2001. Puccinia sorghi virulent on
sweet corn with the Rp1-D gene in southern France. Plant Disease, 85 (5), 560.3.
Paul, P.A. & Munkvold, G.P. 2005. Influence of temperature and relative humidity on
sporulation of Cercospora zeae-maydis and expansion of gray leaf spot lesions on maize leaves. Plant Disease, 89 (6), 624-30.
Paul, P. A., Madden, L. V., Bradley, C. A., Robertson, A. E., Munkvold, G. P., Shaner, G.,
Wise, K. A., Malvick, D. K., Allen, T. W., Grybauskas, A., Vincelli, P. & Esker, P. 2011. Meta-analysis of yield response of hybrid field corn to foliar fungicides in the U.S. Corn Belt. Phytopathology, 101,1122-32.
Payak, M.M. Sharma, R.C. & Rao, S.R. 1987. Aflatoxin in India II. In M.S. Zuber, E.B. Lillehof
& B.L. Renfro (eds), Aflatoxin in Maize. A Proceedings of the Workshop. CIMMYT, Mexico D.F., p. 349.
Perkins, D.D. 1962. Preservation of neurospora stock cultures with anhydrous silica gel.
Canadian Journal of Microbiology, 8 (4), 591-94. Pinto, N.F.J. 2004. Controle químico de doenças foliares em milho. Revista Brasileira de
Milho e Sorgo, 3 (1), 134-38. Pringle, R.B. 1971. Amino acid composition of the host-specific toxin of Helminthosporium
carbonum. Plant Physiology, 48 (6), 756–59.

References
197
Pringle, R.B. & Scheffer, R.P. 1967. Isolation of the host-specific toxin and a related substance with nonspecific toxicity from Helminthosporium carbonum. Phytopathology, 67, 1169-72.
Prończuk, M., Bojanowski, J. & Warzecha, R. 2004. Effect of leaf infection by Kabatiella zeae
on stalk rot prevalence and grain yield of maize hybrids. Journal of Phytopathology, 152, 410–415.
Punithalingam, E. 1990. Mycosphaerella zeae-maydis. C.M.I. Descriptions of Pathogenic
Fungi and Bacteria, 1015. Mycopathologia, 112 (1), 49-50. Rapilly, F., Bonnet, A. & Foucault, B. 1975. Realisation d'un appareil permettant l'etude au
champ de la dispersion de spores de champignons par des gouttes d'eau; application a Kabatiella zeae, Septoria nodorum et Fusarium roseum. Ann. Phytopathol.,7 (1), 45-50.
Rapilly, F. 1991. L'épidémiologie en pathologie végétale. Mycoses aériennes. INRA, Paris.
Rayner, R.W. A Mycological Colour Chart. Commonwealth Mycological Institute, Kew,
Surrey. Rebourg, C., Gouesnard, B. & Charcosset, A. 2001. Large scale molecular analysis of
traditional European maize populations. Relationships with morphological variation.
Heredity, 86 (5), 574-87.
Reifschneider, F.J.B. 1979. A liquid medium for the production of Kabatiella zeae conidia. Canadian Journal of Microbiology. 25 (9), 1100-02.
Reifschneider, F.J.B. & Arny, D.C. 1979. Seed infection of maize (Zea mays) by Kabatiella
zeae. Plant Disease Reporter, 63 (5), 352-54.
Reifschneider, F.J.B. & Arny, D.C. 1980a. Cultural and morphological variability of Kabatiella
zeae. Transactions of the British Mycological Society, 75 (2), 239-41.
Reifschneider, F.J.B. & Arny, D.C. 1980b. Host range of Kabatiella zeae, causal agent of
eyespot of maize. Phytopathology, 70 (6), 485-87. Reifschneider, F.J.B. 1983. Yield loss of maize caused by Kabatiella zeae. Phytopathology,
73 (4), 607-09. Reis, E.M., Baruffi, D., Remor, L. & Zanatta, M. 2011. Decomposition of corn and soybean
residues under field conditions and their role as inoculum source. Summa Phytopathologica, 37 (1), 65-67.
Remesova, J., Kolařík, M & Prášil, K. 2007. Microfungi on the kernels of transgenic and non-
transgenic maize damaged by the European corn borer. Czech Mycology, 59 (2), 205–13.
Renfro, B.L. & Ullstrup, A.J. 1973. A comparison of maize diseases in temperate and in
tropical enviornments. Symposium on Contrasting Problems in Plant Pathology of Food Crops grown under Tropical and Temperate Climates - Second International Congress of Phytopathology. Minneapolis, MN, September 5-12.
Robert, A.L. 1952. Cultural and pathogenic variability in single-conidial and hyphal-tip
isolates of H. turcicum Pass. Technical Bulletin no. 1058, USDA, Washington, D.C.

References
198
Robert, A.L. 1953. Some of the leaf blights of corn. In Plant Diseases: The Yearbook of Agriculture 1953, USDA, Washington, D.C., pp. 380-85.
Robertson, A., Abendroth, L. & Elmore, R. 2007. Yield responsiveness of corn to foliar
fungicide application in Iowa. Iowa State University Agronomy Extension, Ames, IA, viewed 20 April 2016, <http://www.agronext.iastate.edu/corn/production/foliarfungicide.html>
Rouse, I. 1992. The Tainos: Rise and Decline of the People who Greeted Columbus. Yale
University Press, New Haven, CT. Rogers, S.L., Atkins, S.D. & West, J.S. 2009. Detection and quantification of airborne
inoculum of Sclerotinia sclerotiorum using quantitative PCR. Plant Pathology, 58 (2), 324–31.
Sanoja Obediente, M. 1989. from foraging to food production in northeastern Venezuela and
the Caribbean. In D.R. Harris & G.C. Hillman (eds), Foraging and Farming: The Evolution of Plant Explotation, Unwin Hyman, London, pp. 523-537.
Savile, D.B.O. 1984. Taxonomy of the cereal rust fungi. In W.R. Buschnell & A.P. Roelf
(eds), The Cereal Rusts: Origins, Specificity, Structure, and Physiology. Volume 1.
Academic Press, Orlando, FL. Scheifele, G.L., Nelson, R. R. & Koons, C. 1969. Male sterility cytoplasm conditioning
susceptibility of resistant inbred lines of maize to yellow leaf blight caused by Phyllosticta zeae. Plant Disease Reporter, 53, 8.
Schieber, R. & Muller, A.S. 1968. A leaf blight of corn (Zea mays) incited by Fusarium
moniliforme. (Abst). Phytopathology, 58, 554.
Schlüter, K. 2012, Maiskrankheiten in Mais, Getreide und Mais Jahreskreis, March 2013
Schneider, R. & Krüger, W. 1972. Kabatiella zeae Narita et Hiratsuka als Erreger einer
Blattfleckenkrankheit an Mais in Deutschland. Journal of Phytopathology,
74 (3), 238–48. Schuster W., Geidel H. 1978. Der landwirtschaftlich-technische Assistent, Ed Ulmer,
Stuttgart. SEGES. 2016. Approved pesticides in Denmark (positive list). Danish Agriculture and Food
Council, Aarhus, viewed 21 February 2016, <https://www.middeldatabasen.dk/positiveList.asp>
Segovia, S., Yanely, J. & Alfaro, J. 2009. El maíz: un rubro estratégico para la soberanía
agroalimentaria de los venezolanos. Agronomía Trop., 59(3), 237-47.
Señerez Arcibal, S. M. 2013. Integrated management of southern corn rust and northern
corn leaf blight using hybrids and fungicides. Master Thesis, University of Georgia, Athens, GA.
Shah, D.A. & Dillard, H.R. 2006. Yield loss in sweet corn caused by Puccinia sorghi: A meta-
analysis. Plant Disease, 90 (11), 1413-18.
Shang, H. 1980. Overwintering of Helminthosporium turcicum in the summer corn region of
Shensi Province. Acta Phytopathologica Sinica, 10 (1), 29-36.

References
199
Shree, M.P. & Luke, P. 1983. Inability of Exserohilum turcicum (Pass.) Leo. et Sug., to survive as a saprophyte in soil in situ. Plant and Soil, 74 (1), 141-44.
Siefer, F. & Grossmann K. 1996. Nichtfungizide Nebenwirkungen von Trialzolverbindungen
am konkreten Beispiel des Triazolfungizides Epoxiconazol. Gesunde Pflanzen, 48,
224-31. Sillón, M. 2012. Caracterización y control químico de las enfermedades foliares en el cultivo
de maíz: tendencias en el ciclo agrícola 2011/2012. Revista Agromercado,
Cuadernillo Clásico: Maíz, no. 169, June. Singh, R. & Srivastava, R.P. 2012. Southern corn leaf blight- an important disease of maize.
Extension Fact Sheet. Indian Research Journal of Extension Education, Special Issue (vol 1).
Sivanesan, A. 1987. Graminicolous species of Bipolaris, Curvularia,
Drechslera, Exserohilum and their teleomorphs. Mycological Papers no. 158, 1-261.
Smiljakovic, H. & Pencic, V. 1971, Kabatiella zeae Narita et Hiratsuka, agent of corn disease
in Yugoslavia, Zastita bilja.
Smith, D. 2015. Corn Diseases 2015 and Should I Spray Fungicide?. University of Wisconsin Extension, Lancaster, WI, viewed 19 April, <http://fyi.uwex.edu/fieldcroppathology/2015/07/13/corn-diseases-of-2015-and-should-i-spray/>
Sood S., Flint-Garcia, S., Willcox, M.C. & Holland, J.B. 2014. Mining natural variation for
maize improvement: selection on phenotypes and genes. In R. Tuberosa, A. Graner, E. Frison (eds), Genomics of Plant Genetic Resources, Springer, Dordrecht, pp. 615-49.
Sørensen, J.L., Aveskamp, M. M., Thranea, U. & Andersen, B. 2010. Chemical
characterization of Phoma pomorum isolated from Danish maize. International Journal of Food Microbiology, 36 (3), 310–17.
Staller, J. 2010. Maize Cobs and Cultures: History of Zea mays L. Springer-Verlag, Berlin. Stanković, S., Lević, J. & Ivanović, D. 2007. Genetic variability of maize pathogens in Serbia.
Genetika, 39 (2), 227-40. State Statistics Service Ukraine 2015. Economic statistics. Kiev, viewed 20 May 2015,
<https://ukrstat.org/en/operativ/menu/menu_e/cg.htm> Sterflinger, K. 2006. Black yeasts and meristematic fungi: Ecology, diversity and
identification. In G. Peter & C. Rosa (eds), The Yeast Handbook: Biodiversity and Ecophysiology of Yeasts. Springer-Verlag, Heidelberg, pp. 501-14.
Stout, G.L. 1930. New fungi found on the Indian corn plant in Illinois. Mycologia, 22 (6), 271-
87. Sukno, S.A., García, V. M., Shaw, B.D. & Thon, M.R. 2007. Root infection and systemic
colonization of maize by Colletotrichum graminicola. Applied and Environmental Microbiology, 74 (3), 823–32.

References
200
Tenuta, A. & Zhu, X. 2012. Disease survey of seed and commercial corn in Ontario and Quebec 2012. Crop advances: Field crop Reports. Ontario Soil and Crop Improvement Association, Guelph, ON, viewed 8 February 2016, <http://www.ontariosoilcrop.org/wp-content/uploads/2015/07/v9crpadv_cor2-2012_disease_survey_of_seed_and_commercial_ corn_in_ontario_and_quebec.pdf>
Trainor, M.J. & Martinson, C.A. 1981. Epidemiology of Alternaria leaf blight of maize.
Phytopathology, 71, 262.
Trdan, S. & Celar, F.A. 1999. Outbreak of maize downy mildew (S. macrospora) in Slovenia
in 1999. Poljoprivreda (Agriculture), 6 (2), 62-66.
Treikale, O., Javoisha, B., Pugacheva, E., Vigule, Z. & Feodorova-Fedotova, L. 2014.
Northern leaf blight Helminthosporium turcicum on maize in Latvia. Communications in Agricultural and Applied Biological Sciences, 79 (3), 481-85.
Tuleen, U.M. & Frederiksen, R.A. 1977. Characteristics of resistance to Exserohilum
turcicum (Helminthosporium turcicum) in Sorghum bicolor. Plant Disease Reporter,
61 (8), 657-61. UNL Extension. 2014. 2014 Guide for Weed Management in Nebraska. EC130. University of
Nebraska-Lincoln, Lincoln, NE. Urban, K. 2012. Befalls- und Ertragskontrolle von Maispathogenen (Kabatiella zeae,
Setosphaeria turcica, Fusarium spp.) im Rahmen einer überregionalen,
mehrjährigen Untersuchung. PhD Thesis, University of Kiel. Vaillancourt Laboratory. 1995. Storage of fungi on silica gel. Department of Plant Pathology,
University of Kentucky, Lexington, KY, viewed December 10 2012, <http://www2.ca.uky.edu/agcollege/plantpathology/vaillanc/storag.htm>
Van der Aa, H.A. & Vanev, S. 2002. A Revision of the Species Described in Phyllosticta.
Centraalbureau voor Schimmelcultures (CBS), Utrecht, The Netherlands. Van der Plank, J.E. 1963. Plant Diseases: Epidemics and Control. Academic Press, London.
Van der Plank, J.E. 1967. Epidemiology of fungicidal action. In D.C. Torgeson (ed.),
Fungicides: An Advanced treatise. vol. 1. Academic Press, NY, pp. 63-92.
Van der Plank, J.E. 1975. Principles of Plant Infection. Academic Press, New York.
Venancio, W. S., Rodrigues, M., Begliomini, E. & de Souza, N. L. 2003. Physiological effects
of strobilurin fungicides on plants. Publ. UEPG Exact Soil Sciences, Agrarian Science & Engineering, 9 (3), 59-68.
Venard, C. & Vaillancourt, L. 2007. Penetration and colonization of unwounded maize tissues
by the maize anthracnose pathogen Colletotrichum graminicola and the related nonpathogen C. sublineolum. Mycologia, 99 (3), 368-77.
Vitti, A.J., Bergamin Filho, A., Amorim, L. & Fegies, N.C. 1995. Comparative epidemiology of
common maize rust and northern corn leaf blight. I. Effect of environment on monocyclic parameters. Summa Phytopathologica, 21,127-30.
Vizvary, M.A. & Warren, H.L. 1982. Survival of C. graminicola in soil. Phytopathology, 72 (5),
522-25.

References
201
Vogelzang, B.K. 2011. Spore trapping coupled with quantitative PCR: Potential for
application to biosecurity surveillance, Doctoral Thesis, University of Adelaide, Adelaide, SA.
Walsh, E., Longfellow, J., Chung, C.L., Poland, J. & Nelson, R. 2008. How do disease
resistance QTLs affect the development of northern leaf blight in maize?. 50th Maize Genetics Conference, Washington, D.C.
Walton, J.D. 2006. HC-toxin. Phytochemistry, 67 (14), 1406–13. Walton, J.D., Earle, E.D. & Gibson, B.W. 1982. Purification and structure of the host-specific
toxin from Helminthosporium carbonum race 1. Biochem Biophys Res Commun, 107(3), 785-94.
Wang, X., Zhang, Y., Xu, X., Li, H., Wu, X., Zhang, S. & Li, X. 2014. Evaluation of maize
inbred lines currently used in Chinese breeding programs for resistance to six foliar diseases. The Crop Journal, 2 (4), 213-22.
Warham, E.J., Buttler, L.D. & Sutton, R.C. 1997. Ensayos para la semilla de maíz y de trigo:
Manual de laboratorio. CYMMIT, Mexico, D.F.
Warren, H. L. 1977. Survival of Colletotrichum graminicola in corn kernels. Phytopathology,
67 (2), 160-62. Watanabe, T. 2010. Pictorial Atlas of Soil and Seed Fungi: Morphologies of Cultured Fungi
and Key to Species. CRC Press, Boca Raton, FL. Watson, A. & Napier, T. 2006. Managing northern leaf blight in processing sweet corn. NSW
Department of Primary Industries. Project No: VG02115. Horticultural Australia Ltd, Sydney.
Welz, H.G. & Geiger, H.H. 1995. Occurrence of Cochliobolus carbonum race 3 on corn in
China, Nigeria, and Germany. Plant Disease, 79 (4), 424.
Welz, H.G., Leath, S. & Leonard, K.J. 1993. Sporulation by races 0,2 and 3 of Cochliobolus
carbonum on synthetic medium and sterilized corn leaves. Plant Disease, 77 (11), 1153-57.
Wheeler H., Politis, D.J. & Poneleit, C.G. 1973. Pathogenicity, host range, and distribution of
Colletotrichum graminicola on corn. Phytopathology 64 (3), 293-96.
White, T. J., Bruns, T., Lee, S. & Taylor, J. 1990. Amplification and direct sequencing of
fungal ribosomal RNA genes for phylogenetics. In M.A. Innis, D.H. Gelfand, J.J. Sninsky & T.J. Whiste (eds), PCR Protocols: a Guide to Methods and Applications,
Academic Press, New York, pp. 315-22. White, D.G. 2010. Compendium of Corn Diseases. 3rd ed. APS Press, St. Paul, MN.
Willey, G.R. & Shimkin, D.B. 1973. The Maya collapse: A summary view. In T.E. Culbert
(ed.), The Classic Maya Collapse, University of New Mexico Press, Albuquerque,
pp. 457-502. Wise, K. 2010. Diseases of corn: Common and southern rusts. BP-82-W. Purdue University
Extension, West Lafayette, IN.

References
202
Wise, K. & Mueller, D. 2011. Are fungicides no longer just for fungi? an analysis of foliar fungicide use in corn. APSnet Features, St. Paul, MN, viewed 20 April 2016, <http://www.apsnet.org/publications/apsnetfeatures/Pages/fungicide.aspx>
Wise, K. 2013. Diseases of corn: Corn disease loss estimates from the United States and
Ontario, Canada - 2013. BP-96-13-W. Purdue University Extension, West Lafayette, IN.
Wise, K. 2014. Diseases of corn: Corn disease loss estimates from the United States and
Ontario, Canada - 2014. BP-96-14-W. Purdue University Extension, West Lafayette, IN.
Wise, K. 2015. Diseases of corn: Fungicide efficacy for control of corn diseases. BP-160-W.
Purdue University Extension, West Lafayette, IN. Xiao, J.Z., Tsuge, T., Doke, N., Nakatsuka, S., Tsuda, M. & Nishimura, S. 1991. Rice-specific
toxins produced by Bipolaris zeicola, race 3; evidence for role as pathogenicity factors for rice and maize plants. Physiological and Molecular Plant Pathology, 38
(1), 67–82. Xiao, J.Z., Tsuge, T. & Doke, N. 1992. Further evaluation of the significance of BZR-toxin
produced by Bipolaris zeicola race 3 in pathogenesis on rice and maize plants. Physiological and Molecular Plant Pathology, 40 (5), 359-70.
Xu, X., Dong, H. & Jiang, Y. 2000. Preliminary studies on the northern anthracnose disease
in maize. Journal of Shenyang Agricultural University, 2000-05.
Yoshizawa, A., Shimokouji, H., Tanaka, F. & Kodama, F. 1994. Purple leaf spot of corn (Zea
mays L.) caused by Epicoccum purpurascens and its varietal difference (JE). J.Hokkaido Grassl. Sci, 28, 38-41.
Zalar, P., Gostinčar, C., de Hoog, G.S., Uršič, V., Sudhadham, M. & Gunde-Cimerman, N.
2008. Redefinition of Aureobasidium pullulans and its varieties. Stud. Mycol., 61, 21-38.
Zellner, M. 2012. Blattfleckenkrankheiten an Mais. Mais, March, pp. 123-125.
Zhang, J.X. Wu, Y.X., Ho, H.H. Lu, C.H. He, Y.Q. 2013. Cultural characteristics and
pathogenic variations among Cochliobolus carbonum isolates in Yunnan Province of China. Journal of Plant Pathology and Microbiology, 4 (10), 210.
Zhang, Q.F. & Branch, H. 2014. The corn northern anthracnose. Science and Technology of
West China, 2014-01. Zitter, T.A. 2012. Northern corn leaf blight and Common rust in fresh market sweet corn.
Cornell University, Ithaca, NY, viewed 8 December 2015, http://vegetablemdonline.ppath.cornell.edu/NewsArticles/Corn%20NCLB_Rust%20Combo%20March%202013.pdf>
ZMP. 2008. Agrarmärkte in Zahlen – Europäische Union 2008. Zentrale Markt- und
Preisberichtstelle, Bonn. Zogg, H. & Scherrer, G. 1945. Zur Frage des Zwischenwirtes der Puccinia sorghi Schw.
Berichte der Schweizerischen Botanischen Gesellschaft, 55, 278-280.

References
203
Zogg, H. 1949. Untersuchungen über die Epidemiologie des Maisrostes Puccinia sorghi Schw. Schw. Phytopathol. Z, 15, 143-92.
Zscheischler, J., Estler, M.C., Staudacher, W., Groß, F., Burgstaller, G., Streyl, H. &
Rechmann, T. 1990. Handbuch Mais: Umweltgerechteter Anbau. Wirtschaftliche Verwertung, DLG-Verlage, Munich.

Appendix
204
Appendix
Tab. A1. Phytosanitary measures in field trials of 2013 and 2014.
Field trial/season
Mittich (2013)
Inzing (2014)
Ostenfeld (2013)
Ostenfeld (2014)
Seed treatment
Insecticides Fungicides
Mesurol FLO 500 FS Aatiram 65 FS
Mesurol FLO 500 FS Aatiram 65 FS
+ Maxim Quattro1
Mesurol FLO 500 FS
TMTD
Herbicides
Laudis® OD
2 L/ha
17.05.2013
Terano® WG
0,7 kg/ha
25 g/kg Metosulam
600g/kg Flufenacet
25.04.2014
Calaris® SC
0,75 l/ha
70g/l Mesotrione
330g/l Terbuthylazin
BBCH 11-12; 17.05.2013
Calaris® SC
0,5 l/ha
70g/l Mesotrione
330g/l Terbuthylazin
16.05.2014
Gardo Gold® SC 3 L/ha
312,5g/l Metolachlor
187g/l Terbuthylazin
17.05.2013
Gardo Gold® SC 2 L/ha
312,5g/l Metolachlor
187g/l Terbuthylazin
25.04.2014
Dual-S-Gold® EC 1 L/ha
915g/l S-metolachlor
BBCH 11-12; 17.05.2013
Dual-S-Gold® EC 1 L/ha
915g/l S-metolachlor
16.05.2014
Trend® 90 SL (adjuvant) 0,3 L/ha
BBCH 11-12; 17.05.2013
Milagro Forte® OD 0,2 L/ha
60g/l Nicosulfuron
16.05.2014
Peak® WG 16g/ha
750g/kg Prosulfuron
BBCH 11-12
17.05.2013
Peak® WG 16g/ha
750g/kg Prosulfuron
BBCH 15-16
10.06.2014
1Maxim Quattro: Thiabendazole + metalaxyl-M, fluodioxonil and azoxystrobin. Seed- and soil-borne diseases protection (providing good effect against Fusarium
species)

Appendix
205
Tab. A2. Sowing and management in field trials of 2013 and 2014.
Fertilisers
Mittich ( 2013)
Inzing (2014)
Ostenfeld
(2013)
Ostenfeld
(2014)
Fertilisers I
Liquid manure 9 m
3/ha
(45 kg N/ha) 25.04.2013
Liquid manure 25 m
3/ha
(45 kg N/ha) 20.03.2014
Alzon 46
(64 kg N/ha) 141 kg/ha 2.04.2014
NP 20+20+0+4 22.04.2013
Others:
Excello Basis 2.65% Cu; 3% Zn
0.18% Fe; 0.16% Mn 0.04% B; 53%
CaCO3 27% MgCO3
1.20 dt/ha
22.04.2016
NP
20+20+0+4
1.50 dt/ha
16.05.2014
Fertilisers
II
NP
Underground
1.) 30 kg/ha
27.04.2013/
2.) 108 kg/ha
15.05.2013
NPMg
40+10+10
187 kg/ha
21.04.2014
NPK
15+9+20+2+4
23.04.2013
Others:
Kieserit granulate
25% MgO;
20% S
1.60 dt/ha
23.04.2016
NPK
17+6+18+2
+6
7.65 dt/ha
19.05.2014
Other Non-pathogenic Phoma Isolates
Isolate 13.2d
Growth rates of the colony between 53 and 59 mm in size (fast growing) after seven days,
with a regular border. Production of aerial mycelium absent or scarce with flat/effuse and
scattered, white to salmon areas. Pycnidia are produced in abundance and homogeneously
distributed on the plate, situated on/ in the medium, either solitary or coalescing with other
pycnidia. Pycnidia are cream to dark brown, pyriform and flask-shaped, with one to two
conspicuous papillate ostioles and 75-200 x 100-400 µm in diameter. They are glabrous, in
some cases developing hyphal outgrowths, with pseudoparenchymatous cell wall structure.
Conidial matrix rosy-white-yellow and abundant. Conidia are extruded in very typical cirri.
Conidia are ellipsoidal, single-celled, hyaline, typically biguttulate with small, polar guttules.
Conidia size: 3-4.2 x 1.3-2 µm (average 3.56 x 1.55 µm).

Appendix
206
Fig. A1. Isolate 13.2a. A. Pycnidia on the agar medium surface. B. Globose to subglobose pycnidia.
C. Irregular pycnidia. D. Conidia. Scale bars B-C=100 µm; C=10 µm.
Isolate 12.27
Growth rates of the colony between 49 and 52 mm after seven days with a regular border
regular border. Aerial mycelium, sparse, in some cases absent, white, effuse and scattered
in some areas. Mycelium are immersed and brown. Pycnidia are produced in abundance and
evenly distributed on the plate, both on/in the medium. Pycnidia are brown to black, globose
to subglobose, glabrous or with hyphal outgrowths, with pseudoparenchymatous cell wall
structure. Size of the pycnidia range between 50-125 x 75-150 µm and are either solitary or
confluent with other pycnidia. Pycnidia with a single ostiole, non or slightly papillate. Conidial
matrix white, containing conidia in abundance. Conidia are ellipsoidal, single-celled, hyaline,
non- or biguttulate with polar and medium-sized guttules. Size of the conidia: 3.4-4.7 x 1.3-
1.9 µm (average 3.8 x 1.6 µm) with a few large conidia.
Fig. A2. Isolate 12.27. A. Pycnidia on the agar medium surface. B. Pycnidia. C. Conidia. Scale bars
C=25 µm; D=10 µm.
Isolate 12.28
Growth rates between 45 and 47 mm after seven days with a regular border. Aerial mycelium
sparse, white or salmon, flat to effuse. Immersed mycelium salmon. Pycnidia are produced in
abundance, evenly distributed on the plate and disposed on both the agar surface and in the
agar. Pycnidia are brown to black, globose to subglobose, glabrous, with
pseudoparenchymatous cell wall structure. Size of the pycnidia within the range of 75-150 x
A B C D
A B C

Appendix
207
75-150 µm either solitary or confluent with other pycnidia. Presence of mycropycnidia.
Pycnidia present a single, slightly papillate ostiole. In some cases, ‘necks’ were developed.
Conidial matrix whitish to yellow containing conidia in abundance. Conidia are ellipsoidal,
single-celled, hyaline, non- mono- or biguttulate, polar and small-medium size guttules. Size
of the conidia: 3.1-4.6 x 1.5-2.4 µm (average: 3.9 x 1.7 µm). Chlamydospores present.
Fig. A3. Isolate 12.28. A. Pycnidia and conidial matrix on the agar medium surface. B. Presence of
mycropycnidia structures within pycnidia. C. Mycropycnidium. D. Conidia. Scale bar=10 µm.
Isolate 12.31
Growth rates between 49 and 52 mm after seven days with a regular border. Aerial
mycelium, sparse, white, flat to effuse. Immersed mycelium salmon. Pycnidia are produced
in a noticeably large quantity compared with other similar isolates. Pycnidia are
homogenously distributed on the plate and located on both the surface of the medium and in
the medium. Pycnidia are black, with globose, subglobose and irregular shape, glabrous,
with pseudoparenchymatous cell wall structure. Size of the pycnidia falls within the range of
75-200 x 75-200 µm, either solitary or confluent with other pycnidia. Pycnidia present one or
two slightly papillate ostioles. ‘Necks’ also frequently developed. Conidial matrix whitish to
yellow, containing conidia in abundance. Conidia are ellipsoidal, single-celled, hyaline, non-
mono- or biguttulate with polar and medium-sized guttules. Size of the conidia: 3.1-6.3 x 1.3-
2 µm (average 3.90 x 1.73 µm). Large conidia were also observed.
Fig. A4. Isolate 12.31. A. Pycnidia on the agar medium surface. B. Conidia.Scale bar=10 µm.
A B C D
A B

Appendix
208
Isolate 13.37
According to the obtained data from the DNA sequencing: Phoma pomorum (syn. Didymella
pomorum). Growth rates between 45 and 51 mm after seven days with a regular border.
Moderate to abundant production of green/olivaceous buff, dark cyan floccose to wooly aerial
mycelium with floccose white tufts. Under UV light, the culture develops a felty black centre
and more frequently compacted white, grey, green/olivaceous aerial mycelium. Pycnidia are
produced in abundance both on and in medium. Pycnidia are brown to black, globose to
subglobose, solitary and confluent, glabrous with pseudoparenchymatous wall. Single and
multiple ostioles could be developed from a single pycnidia. The pycnidia present a hyaline-
pinkish matrix with abundant production of conidia. Conidia are ellipsoidal single-celled,
hyaline, with two to four polar, small-sized guttules. Size of the conidia: 3.8-6 x 1.9-3.1 µm
(average 5 x 2.5 µm). Identified as Ph. pomorum according to morphological
characterisation.
Fig. A5. Isolate 13.37. A. Pycnidia on the agar medium surface. B. Conidia. Scale bar =10 µm.
Isolate 13.47
Growth rates between 65 and 70 mm after seven days with regular border. Aerial mycelium
sparse, and in some cases absent, white effuse and scattered in some areas. Immersed
mycelium brown. Pycnidia are produced in abundance, evenly distributed on the plate and
disposed both on and in the medium. Pycnidia are solitary or confluent, brown to black,
globose to subglobose and glabrous. The cell wall structure could not be clearly defined.
Size of the pycnidia falls within the range of 75-200 x 100-200 µm. Pycnidia present 1 to 3,
slightly to conspicuously papillate ostioles with possible development of ‘necks’. Conidial
matrix hyaline to pinkish, containing conidia in abundance. Conidia are ellipsoidal, single-
celled, hyaline, either without or with one to two guttules polar and small in size. Size of the
conidia: 3.4- 4.6 x 1.4-2.3 µm (average 3.9 x 1.8 µm).
A B

Appendix
209
Fig. A6. Isolate 13.47. A. Pycnidia on agar medium surface. B. Pycnidia. C. Conidia.
Scale bar= 10 µm.
Isolate 13.48
Growth rates between 60 and 73 mm after seven days with a regular border. Aerial mycelium
sparse, and in some cases absent, white effuse and scattered in some areas. Immersed
mycelium, brown to red/vinaceous. Pycnidia are produced in abundance, evenly distributed
on the plate and disposed on and in the medium. Pycnidia are solitary, confluent or in chains,
brown to black, globose to subglobose, glabrous and with pseudoparenchymatous cell wall
structure. The size of the pycnidia range between 100-200 x 125-250 µm. Pycnidia present
one to three, slightly to conspicuously papillate ostioles. Conidial matrix hyaline to pinkish,
containing conidia in abundance. Conidia are ellipsoidal, single-celled, hyaline, either without
guttules or one to two polar small guttules. Size of the conidia: 2.7- 4.1 x 1.5- 2.2 µm
(average 3.5 x 1.7 µm). Large spores were also present.
Fig. A7. Isolate 13.48. A. Pycnidia on the agar medium surface. B. Conidia. Scale bar= 10 µm.
Isolate 12.10
Growth rates between 39 and 43 mm after seven days, regular, presenting a scarce
production of grey to brown flat/effuse, felty immersed dark mycelium, as well as black
pycnidia which are produced in abundance. Both give the impression of dark discolouration
of the agar medium. Pycnidia are globose to subglobose, glabrous, in some cases
developing hyphal outgrowths, with pseudoparenchymatous cell wall structure. Size of the
pycnidia ranges from 50-125 x 45-150 µm, either solitary or confluent with other pycnidia. In
A B C
A B

Appendix
210
every pycnidium, a single, slightly papillate ostiole was observed. Pycnidia present a white
matrix with moderate production of conidia. Conidia are ellipsoidal to irregular, single-celled,
hyaline, presenting one to five polar, small-sized guttules. Size of the conidia: 2.8-4.6 x 1.3-2
µm. Large spores were also observed.
Fig. A8. Isolate 12.10. A. Pycnidia on the agar medium surface. B. Pycnidia. C. Conidia. D.
Chlamydospores (63x). Scale bars B=50 µm; C=10 µm.
Fig. A9. Length of several Phoma and Didymella isolates investigated in this work. Red columns
represent pathogenic isolates after pathogenicity tests. Blue columns represent isolates considered
non-pathogenic after pathogenicity tests.
A B C D

Appendix
211
Tab. A3.: results obtained from NCBI database using BLAST analysis based on ITS 4 and ITS 5
sequences.
Isolate Some of the resulted CBS species
from BLAST Score Query
covery E.
number %
similarity
12.18 Didymella heteroderae CBS 109.92 835 87% 0.0 98%
Phoma pomorum CBS 838.84 835 87% 0.0 98%
Didymella maydis CBS 588.69 824 87% 0.0 97%
12.20 Didymella heteroderae CBS 109.92 880 86% 0.0 99%
Didymella nigricans CBS 444.81 876 88% 0.0 99%
Didymella subherbarum CBS 305.79 876 88% 0.0 99%
Didymella maydis CBS 588.69 857 88% 0.0 99% 13.2C Didymella pinodella CBS 110.32 905 98% 0.0 99%
Didymella heteroderae CBS 109.92 878 94% 0.0 99%
Didymella nigricans CBS 444.81 874 94% 0.0 99%
Didymella subherbarum CBS 305.79 874 94% 0.0 99%
Phoma aliena CBS 379.93 872 94% 0.0 99%
Didymella maydis 857 94% 0.0 99%
13.2P Didymella heteroderae CBS 109.92 880 86% 0.0 99%
Didymella nigricans CBS 444.81 876 86% 0.0 99%
Didymella subherbarum CBS 305.79 876 86% 0.0 99%
Didymella maydis 857 86% 0.0 99%
13.2B Didymella pinodella CBS 110.32 963 99% 0.0 99%
Phoma macrostoma var. incolorata CBS 300.36 937 95% 0.0 99%
Didymella subherbarum CBS 305.79 893 89% 0.0 99%
Phoma pomorum CBS 838.84 891 89% 0.0 99%
Didymella dimorpha 885 89% 0.0 99%
Didymella americana 885 89% 0.0 99%
12.13 Didymella protuberans CBS 381.96 891 88% 0.0 99%
Didymella dimorpha CBS 346.82 891 88% 0.0 99% Didymella pinodella CBS 318.90 880 88% 0.0 99%
Didymella subherbarum CBS 250.92 880 88% 0.0 99%
12.19 Didymella pinodella CBS 110.32 1000 98% 0.0 99%
Didymella protuberans CBS 381.96 891 87% 0.0 99%
Didymella dimorpha CBS 346.82 891 87% 0.0 99%
Didimella subherbarum CBS 305.79 885 87% 0.0 99%
Didymella maydis 874 87% 0.0 99%
12.36 Phoma pomorum CBS 838.84 896 88% 0.0 100%
Didymella pinodella CBS 110.32 977 100% 0.0 99%
12.37 Phoma pomorum CBS 838.84 896 88% 0.0 100%
Didymella pinodella CBS 110.32 976 88% 0.0 99%

Appendix
212
Phoma sequences forward + reverse primers
Isolate 13.2B
AAAATCGTAACAAGGTTTCCGTAGGTGAACCTGCGGAAAGATCATTACCTAGAGTTGTAGGCTTTGCCTGCTATCTCTTACC
CATGTCTTTTGAGTACCTTCGTTTCCTCGGCGGGTCCGCCCGCCGATTGGACAATTTAAACCATTTGCAGTTGCAATCAGCG
TCTGAAAAAAACTTAATAGTTACAACTTTCAACAACGGATCTCTTGGTTCTGGCATCGATGAAGAACGCAGCGAAATGCGAT
AAGTAGTGTGAATTGCAGAATTCAGTGAATCATCGAATCTTTGAACGCACATTGCGCCCCTTGGTATTCCATGGGGCATGCC
TGTTCGAGCGTCATTTGTACCTTCAAGCTCTGCTTGGTGTTGGGTGTTTGTCTCGCCTCTGCGCGTAGACTCGCCTCAAAAC
AATTGGCAGCCGGCGTATTGATTTCGGAGCGCAGTACATCTCGCGCTTTGCACTCATAACGACGACGTCCAAAAGTACATT
TTTACACTCTTGACCTCGGATCAGGTAGGGATACCCGCTGAACTTAAGCATTTAA
Isolate 13.2C only forward
ATGTCATTACCTAGAGTTGTAGGCTTTGCCTGCTATCTCTTACCCATGTCTTTTGAGTACCTTCTGTTTCCTCGGCGGGTCC
GCCCGCCGATTGGACAATTTAAACCATTTGCAGTTGCAATCAGCGTCTGAAAAAAATTAATAGTTACAACTTTCAACAACGG
ATCTCTTGGTTCTGGCATCGATGAAGAACGCAGCGAAATGCGATAAGTAGTGTGAATTGCAGAATTCAGTGAATCATCGAAT
CTTTGAACGCACATTGCGCCCCTTGGTATTCCATGGGGCATGCCTGTTCGAGCGTCATTTGTACCTTCAAGCTCTGCTTGGT
GTTGGGTGTTTGTCTCGCCTCTGCGTGTAGACTCGCCTCAAAACAATTGGCAGCCGGCGTATTGATTTCGGAGCGCAGTAC
ATCTCGCGCTTTGCATTCAGAACGACGACGTCCAAAAGTACATTTTTACACTCTTGACCTCGGATCAGGTAGGGATACCCGC
TGAACTTAAGCATATCAAATG
Isolate 13.2P
TTGGAAAGTAAAAAATCGTAACAAGGTTTCCGTAGGTGAACCTGCGGAAGGATCATTACCTAGAGTTGTAGGCTTTGCCTGC
TATCTCTTACCCATGTCTTTTGAGTACCTTCTGTTTCCTCGGCGGGTCCGCCCGCCGATTGGACAATTTAAACCATTTGCAG
TTGCAATCAGCGTCTGAAAAAAATTAATAGTTACAACTTTCAACAACGGATCTCTTGGTTCTGGCATCGATGAAGAACGCAG
CGAAATGCGATAAGTAGTGTGAATTGCAGAATTCAGTGAATCATCGAATCTTTGAACGCACATTGCGCCCCTTGGTATTCCA
TGGGGCATGCCTGTTCGAGCGTCATTTGTACCTTCAAGCTCTGCTTGGTGTTGGGTGTTTGTCTCGCCTCTGCGTGTAGAC
TCGCCTCAAAACAATTGGCAGCCGGCGTATTGATTTCGGAGCGCAGTACATCTCGCGCTTTGCATTCAGAACGACGACGTC
CAAAAGTACATTTTTACACTCTTGACCTCGGATCAGGTAGGGATACCCGCTGAACTTAAGCATATCAAA
Isolate 12.13
AAAAGCGTAACAAGGTTTCCGTAGGTGAACCTGCGGAAGGATCATTACCTAGAGTTGTAGGCTTTGCCTGCTATCTCTTACC
CATGTCTTTTGAGTACCTTCGTTTCCTCGGCGGGTTCGCCCGCCGATTGGACAATTTAAACCATTTGCAGTTGCAATCAGCG
TCTGAAAAAACTTAATAGTTACAACTTTCAACAACGGATCTCTTGGTTCTGGCATCGATGAAGAACGCAGCGAAATGCGATA
AGTAGTGTGAATTGCAGAATTCAGTGAATCATCGAATCTTTGAACGCACATTGCGCCCCTTGGTATTCCATGGGGCATGCCT
GTTCGAGCGTCATTTGTACCTTCAAGCTCTGCTTGGTGTTGGGTGTTTGTCTCGCCTCTGCGCGTAGACTCGCCTCAAAAC
AATTGGCAGCCGGCGTATTGATTTCGGAGCGCAGTACATCTCGCGCTTTGCACTCAGAACGACGACGTCCAAAAGTACATT
TTTACACTCTTGACCTCGGATCAGGTAGGGATACCCGCTGAACTTAAGCATACTAA
Isolate 12.18
AAAAAACGTAACAAGGTTTCCGTAGGTGAACCTGCGGAAGGATCATTACCTAGAGTTGTAGGCTTTGCCTGCTATCTCTTAC
CCATGTCTTTTGAGTACCTTCTGTTTCCTCGGCGGGTCCGCCCGCCGATTGGACAATTTAAACCATTTGCAGTTGCAATCAG
CGTCTGAAAAAAATTAATAGTTACAACTTTCAACAACGGATCTCTTGGTTCTGGCATCGATGAAGAACGCAGCGAAATGCGA
TAAGTAGTGTGAATTGCAGAATTCAGTGAATCATCGAATCTTTGAACGCACATTGCGCCCCTTGGTATTCCATGGGGCATGC
CTGTTCGAGCGTCATTTGTACCTTCAAGCTCTGCTTGGTGTTGGGTGTTTGTCTCGCCTCTGCGTGTAGACTCGCCTCAAAA
CAATTGGCAGCCGGCGTATTGATTTCGGAGCGCAGTACATCTCGCGCTTTGTTTTTTTTTGACGACGTCCAAAAGTACATTT
TTACACTCTTGACCTCGGATCAGGTAGGGATACCCGCTGAACTTAAGCATATCATAAGCCG
Isolate 12.19
TAAAAAGTCGTAACAAGGTTTCCGTAGGTGAACCTGCGGAAGGATCATTACCTAGAGTTGTAGGCTTTGCCTGCTATCTCTT
ACCCATGTCTTTTGAGTACCTTCGTTTCCTCGGCGGGTTCGCCCGCCGATTGGACAATTTAAACCATTTGCAGTTGCAATCA
GCGTCTGAAAAAACTTAATAGTTACAACTTTCAACAACGGATCTCTTGGTTCTGGCATCGATGAAGAACGCAGCGAAATGCG
ATAAGTAGTGTGAATTGCAGAATTCAGTGAATCATCGAATCTTTGAACGCACATTGCGCCCCTTGGTATTCCATGGGGCATG
CCTGTTCGAGCGTCATTTGTACCTTCAAGCTCTGCTTGGTGTTGGGTGTTTGTCTCGCCTCTGCGCGTAGACTCGCCTCAA
AACAATTGGCAGCCGGCGTATTGATTTCGGAGCGCAGTACATCTCGCGCTTTGCACTCAGAACGACGACGTCCAAAAGTAC
ATTTTTACACTCTTGACCTCGGATCAGGTAGGGATACCCGCTGAACTTAAGCATATCAAAAAT
Isolate 12.20
AAAAAATCGTAACAAGGTTTCCGTAGGTGAACCTGCGGAAGGATCATTACCTAGAGTTGTAGGCTTTGCCTGCTATCTCTTA
CCCATGTCTTTTGAGTACCTTCTGTTTCCTCGGCGGGTCCGCCCGCCGATTGGACAATTTAAACCATTTGCAGTTGCAATCA
GCGTCTGAAAAAAATTAATAGTTACAACTTTCAACAACGGATCTCTTGGTTCTGGCATCGATGAAGAACGCAGCGAAATGCG
ATAAGTAGTGTGAATTGCAGAATTCAGTGAATCATCGAATCTTTGAACGCACATTGCGCCCCTTGGTATTCCATGGGGCATG

Appendix
213
CCTGTTCGAGCGTCATTTGTACCTTCAAGCTCTGCTTGGTGTTGGGTGTTTGTCTCGCCTCTGCGTGTAGACTCGCCTCAAA
ACAATTGGCAGCCGGCGTATTGATTTCGGAGCGCAGTACATCTCGCGCTTTGCATTCAGAACGACGACGTCCAAAAGTACA
TTTTTACACTCTTGACCTCGGATCAGGTAGGGATACCCGCTGAACTTAAGCATATCAAGGG
Isolate 12.36
TAAAAATCGTAACAAGGTTTCCGTAGGTGAACCTGCGGAAGGATCATTACCTAGAGTTGTAGGCTTTGCCTGCTATCTCTTA
CCCATGTCTTTTGAGTACCTTCGTTTCCTCGGCGGGTCCGCCCGCCGATTGGACAATTTAAACCATTTGCAGTTGCAATCAG
CGTCTGAAAAAACTTAATAGTTACAACTTTCAACAACGGATCTCTTGGTTCTGGCATCGATGAAGAACGCAGCGAAATGCGA
TAAGTAGTGTGAATTGCAGAATTCAGTGAATCATCGAATCTTTGAACGCACATTGCGCCCCTTGGTATTCCATGGGGCATGC
CTGTTCGAGCGTCATTTGTACCTTCAAGCTCTGCTTGGTGTTGGGTGTTTGTCTCGCCTCTGCGCGTAGACTCGCCTCAAAA
CAATTGGCAGCCGGCGTATTGATTTCGGAGCGCAGTACATCTCGCGCTTTGCACTCATAACGACGACGTCCAAAAGTACAT
TTTTACACTCTTGACCTCGGATCAGGTAGGGATACCCGCTGAACTTAAGCATACAA
Isolate 12.37
TAAAAAATCGTAACAAGGTTTCCGTAGGTGAACCTGCGGAAGGATCATTACCTAGAGTTGTAGGCTTTGCCTGCTATCTCTT
ACCCATGTCTTTTGAGTACCTTCGTTTCCTCGGCGGGTCCGCCCGCCGATTGGACAATTTAAACCATTTGCAGTTGCAATCA
GCGTCTGAAAAAACTTAATAGTTACAACTTTCAACAACGGATCTCTTGGTTCTGGCATCGATGAAGAACGCAGCGAAATGCG
ATAAGTAGTGTGAATTGCAGAATTCAGTGAATCATCGAATCTTTGAACGCACATTGCGCCCCTTGGTATTCCATGGGGCATG
CCTGTTCGAGCGTCATTTGTACCTTCAAGCTCTGCTTGGTGTTGGGTGTTTGTCTCGCCTCTGCGCGTAGACTCGCCTCAA
AACAATTGGCAGCCGGCGTATTGATTTCGGAGCGCAGTACATCTCGCGCTTTGCACTCATAACGACGACGTCCAAAAGTAC
ATTTTTACACTCTTGACCTCGGATCAGGTAGGGATACCCGCTGAACTTAAGCATACAAG

214
Acknowledgements
I would like to thank Prof. Andreas von Tiedemann for providing me with the opportunity to
work on this project and the confidence he has placed in me over the last few years. His
support, encouragament and guidance is greatly appreciated.
I am also thankful to Prof. Petr Karlovsky for accepting the role as second reviewer, and also
to Prof. Stefan Vidal for his contribution as third reviewer.
Special thanks to Syngenta GmbH for the financial and professional support throughout this
project, especially to Dr. Martin Schulte and Dr. Christoph Mainka for their practical advice.
I would like to thank Dr. Birger Koopman for his patience and help, especially with regard to
molecular analysis!
Many thanks to Prof. Schlüter, Dr. Ute Kropf, Werner Banck and the rest of the team at the
University of Applied Sciences in Kiel for dedicating so much of their time and effort to my
trials and spore trap. Their support greatly enriched the project.
Thanks also to Hetterich Feldversuche for their collaboration, especially to Gisela for sharing
her time in Bavaria. I am also very grateful to Erwin Stadler and Ernst Grömer for their
continuous support with the spore trap in Mittich and Inzing.
A big thank you to Dagmar, Isabel, Jutta, Evelin, Dr. Mavridis and Dr. Schröder for all their
advice and support over the years. Special thanks to Anke for all her help, encouragement
and our discussions in Spanish. Also, many thanks to all my fellow PhD students and other
colleagues from the Division of General Plant Pathology and Crop Protection. Also to Maik,
Hubertus and Frank for all their technical support.
Thanks to Khushwant Singh for making the molecular work in the laboratory easier to
understand and enjoyable. Thanks to the student assistants who have helped me throughout
the project, and also to Jakob for his enthusiasm during his bachelor project.
To Analía Perelló and the University of La Plata, as well as Norma Formento, Juan Carlos
Petoyán and Julio Muriel for making my research stay an invaluable and thoroughly
fascinating experience. Thank you to the family and friends of Analía for making me feel so
welcome and at home.
A very special mention to Scott for supporting me personally and his willingness to learn
about the world of plant pathology. Thank you for having the patience to endure the ups and
downs and put up with me and the pathogens!
Gracias a mis padres, Carmen and Jose Luis por confiar en mí y en mis decisiones y
apoyarme en la distancia. A mi hermana Ana por animarme siempre.

215
DECLARATIONS
1. I, hereby, declare that this Ph.D. dissertation has not been presented to any other
examining body either in its present or a similar form.
Furthermore, I also affirm that I have not applied for a Ph.D. at any other higher school of
education.
Göttingen, 26.05.2016.
.......................................................................
Lucia Ramos Romero
2. I, hereby, solemnly declare that this dissertation was undertaken independently and
without any unauthorised aid.
Göttingen, 26.05.2016.
.......................................................................
Lucia Ramos Romero

216
CURRICULUM VITAE (EDUCATION)
Personal Details
Name: Lucia Ramos Romero
Date of birth 12.03.1984
Place of birth Granada, Spain
Nationality Spanish
EDUCATION
June 2012 – July 2016 Georg-August-University, Göttingen
Division of Plant Pathology and Crop Protection
Ph.D.
Apr. 2009 – Oct. 2011 Georg-August-University, Göttingen
Master of Science in Agricultural Sciences; Area of specialisation: Crop Science
Double diploma:
- Sept. 2004 – Sept. 2008 University of Applied Sciences Osnabrück „Diploma-Engineer” in Agricultural Sciences; Area of specialisation: Horticulture
- Oct. 2002 – Sept. 2008 University of Almeria, Spain Engineer in Agricultural Sciences (B.Sc); Area of specialisation Horticulture/ fruit growing
ADDITIONAL RESEARCH
Febr. 2015 Research stay in Argentina
In collaboration with the National University of La Plata (UNLP), Syngenta Agro Argentina & Instituto Nacional Agropecuario (INTA) Focus: Maize leaf diseases in Argentina
Sept. 2008 Research course in Florida and Georgia (USA)
University of Applied Sciences Osnabrück and University of Florida, Gainesville FL Focus: Land use in summer humid subtropics
Febr. 2007 Research course in the Dominican Republic
University of Applied Sciences Osnabrück and Universidad ISA, Santiago de los Caballeros Focus: Land use in wet and dry tropics