occupational choice of return migrants in moldovaftp.iza.org/dp5207.pdf · iza discussion paper no....
TRANSCRIPT

DI
SC
US
SI
ON
P
AP
ER
S
ER
IE
S
Forschungsinstitut zur Zukunft der ArbeitInstitute for the Study of Labor
Occupational Choice of Return Migrants in Moldova
IZA DP No. 5207
September 2010
Daniela BorodakMatloob Piracha

Occupational Choice of
Return Migrants in Moldova
Daniela Borodak Groupe ESC-Clermont
and CERDI, Clermont-Ferrand
Matloob Piracha University of Kent
and IZA
Discussion Paper No. 5207 September 2010
IZA
P.O. Box 7240 53072 Bonn
Germany
Phone: +49-228-3894-0 Fax: +49-228-3894-180
E-mail: [email protected]
Any opinions expressed here are those of the author(s) and not those of IZA. Research published in this series may include views on policy, but the institute itself takes no institutional policy positions. The Institute for the Study of Labor (IZA) in Bonn is a local and virtual international research center and a place of communication between science, politics and business. IZA is an independent nonprofit organization supported by Deutsche Post Foundation. The center is associated with the University of Bonn and offers a stimulating research environment through its international network, workshops and conferences, data service, project support, research visits and doctoral program. IZA engages in (i) original and internationally competitive research in all fields of labor economics, (ii) development of policy concepts, and (iii) dissemination of research results and concepts to the interested public. IZA Discussion Papers often represent preliminary work and are circulated to encourage discussion. Citation of such a paper should account for its provisional character. A revised version may be available directly from the author.
IZA Discussion Paper No. 5207 September 2010
ABSTRACT
Occupational Choice of Return Migrants in Moldova* This paper analyses the occupational choice of return migrants. Using the CBSAXA data on different aspects of migration in Moldova, we find that those who stayed illegally in the host country tend to go in wage employment on return to the home country. We also show that relatively better educated tend not be in formal employment, i.e., appear not to participate in the labour market whereas those with relatively lower skills or who obtained worse than expected outcome in the host country are more likely to be wage employed in the home country on return. We discuss intuition of these paradoxical results in the paper. JEL Classification: C35, F22, J24 Keywords: occupational choice, return migration, sample selection, Moldova Corresponding author: Matloob Piracha School of Economics Keynes College University of Kent Canterbury, Kent CT2 7NP United Kingdom E-mail: [email protected]
* We would like to thank Florin Vadean for comments on an earlier draft. The usual disclaimer applies.

2
1. Introduction
Migration and development are linked in many ways – through the livelihood and survival
strategies of individuals and households; through large and often well–targeted remittances; and
through the use, in the home country, of investment and skills acquired while abroad. Migration,
therefore, may have a significant impact on poverty reduction in all developing, migrant sending
countries, and Moldova is no exception. The current data, for instance, shows that almost 20
percent of the population in Moldova lives outside the country at any given time. This level of
mass migration, which is mostly temporary in nature, has indeed many elements and not only
economic but political, social and demographic aspects as well; with significant impacts on
growth and development process of the country.
In recent years, the idea of migration and remittances as means to enhance development
and reduce poverty has gained importance, especially because of the concerns about a potential
brain drain from the sending countries. For many developing countries remittances and savings by
returning migrants are nowadays a more important source of external financing than development
aid or foreign direct investment. However, an important element not analysed widely in the
literature is the impact of return migration, especially in countries which have a significant level of
temporary migration, not only on migrants themselves, but the sending country’s labour market as
well.1
This paper helps to fill the gap by analysing the activity choice of return migrants in
Moldova. Since most of the migration from Moldova is short-term, the occupational choice of
return migrants is an important aspect to determine the overall impact on the labour market and
consequently on the growth and development prospects of the country. This paper thus adds to the
existing literature, which mostly used the data from more traditional (long-term) migration
countries, on the activity choice of return migrants. For instance Dustmann and Kirchkamp (2002)
looked at the occupations of returning Turkish migrants from Germany by analysing the choice
between non-participation, wage employment and self-employment. They found a positive
relationship between schooling and self-employment activities. On the other hand McCormick and
Wahba (2001) and Ilahi (1999) showed that relatively higher skilled returnees to Egypt and
Pakistan, respectively, exhibit a greater propensity for wage employment over self-employment as
they command higher wages in the labour market.
The economic adjustment mechanism after return is important in understanding the role of
migration in developing labour markets in the sending countries.
1 One recent exception is Piracha and Vadean (2010) who analysed the occupational choice of return migrants in Albania. The present analysis builds on that paper.

3
Piracha and Vadean (2010), using Albanian data, reconcile the contradictory findings of
the above mentioned papers by separating the self-employed into own-account business owners
(who do not hire non-household labour) and entrepreneurs (who hire workers from outside the
household). They show that relatively lower skilled tend to set up own-account businesses
whereas those with secondary or tertiary education are the ones who have the ability and/or means
to establish as entrepreneurs. Another key feature of Piracha and Vadean, as well as this paper, is
the analysis of occupational choice within the context of short-term migration.
Short-term migrants are able to use their newly acquired skills which, in our context,
include exposure to working in a capitalist/entrepreneurial environment, relatively quickly in the
home country. Also, since there is high incidence of circular migration from some East European
countries like Moldova, non-participation in the labour market, upon return to the home country,
is also an option. This is built on the idea that due to preference for consumption at home,
migrants often increase work effort abroad with the view to enjoy leisure and consumption of
goods in the home country.2 And in case of Moldova, as explained in the next section, there is
another reason, namely tax avoidance. The Moldovan tax structure compels a large group of
economically active people to work in the informal sector, resulting in some of them appearing in
the data as non-participants.3 This is quite significant for the labour market evaluation of return
migrants and non-migrants alike. Therefore, based on this, we use the possibility of three activity
choices in Moldova: non-participation, wage employment and self-employment.4
We conduct the analysis using the CBSAXA data set collected by the International
Organisation for Migration (IOM) in 2006. Our results show that better educated Moldovans are
more likely to migrate and, compared to being non-participants, are less likely to be in wage
employment on return. This is true for both men and women, though women non-migrants are
more likely to be in wage employment than the other categories. Having a dual citizenship,
especially Bulgarian or Romanian, significantly increases the odds of being a non-participant than
a wage employee. Finally, those who receive monetary remittances are more likely to be in wage
employment than either self-employed or non-participants. Further discussion is provided in
Section 4, where we also present some intuitions for the results obtained.
2 See Stark (1991) and Hill (1987). 3 It is not the personal income tax, which is not that high in Moldova, but rather the social contribution (at 29%) of both employers and employees which is the problem (Council of Europe, 2007). Though a substantial portion (24%) is paid by the employer, the employment negotiations are based on net wages. This almost always results in employee indirectly sharing the tax burden equally with the employer. 4 Unfortunately data does not permit us to separate own-account work from entrepreneurship. In addition, the way the data was collected, self-employed are mostly farmers.

4
2. Background and Data
Since 1990 Moldova has experienced a number of economic shocks. First it lost control of
its main energy and industrial plants because of a territorial conflict with the separatist province of
Transnistria. This conflict caused a significant disruption to monetary and financial structure of
the economy as well as its education and health care systems (IOM, 2004). Second, an indirect,
though significant impact on Moldovan economy resulted from the 1998 Russian economic crisis.
As a result of this the country’s industrial output fell by 25 per cent, agricultural output by 20
percent and exports decreased by almost half in 1998-99. Partly as a result of a sharp decline in
GDP in 1999 the unemployment increased considerably – from 57,800 in 1999 to 62,300 in 2003
– resulting in high poverty rates in an already beleaguered economy. Even for some of the
employed the wages are not high enough to fulfil the needs of a nuclear family.
In the backdrop of this, the main avenue open to the unemployed or those on very low
wages is to look for employment abroad. Almost 70% of the migration from Moldova is to Russia
and tends to be temporary in nature either because the migrants choose to be abroad for a short
time only or because it is mostly on a short-term contract and seasonal in nature. Another nearly 5
percent of those who migrate move to Italy, though that is relatively for long-term, usually at least
one year, but mostly 3 to 5 years with the intention to stay permanently. Overall, it is estimated
that approximately 17 percent of the population is outside the country at any given time with about
near 44 percent of 18 to 40 years old intending to migrate for a short spell abroad (European
Training Foundation, 2007).
The main reason for migration is high unemployment rate and/or low wages in Moldova.5
5 The impact of the recent global economic crisis has taken a further toll on the labour market in the country through various channels, with huge implications for unemployment in the country, partly as a result of returning migrants − according to the Labour Force Survey from National Bureau of Statistics, 16,000 migrants returned in the last quarter of 2008. Viitorul Institute for Development and Social Initiatives predicted that another 100,000 to 150,000 Moldovans working abroad could return home over 2009, especially from the Russian Federation.
According to ETF (2007), the employment rate, at 47 percent in 2007, is among the lowest in the
Central and Eastern European (CEE) group of countries. Paradoxically, migration has indeed
contributed to a very low employment rate as many recipients of remittances are not willing to
work at low-wage jobs as long as they get a constant flow of funds from relatives living abroad. In
addition, a high non-participation rate in the labour market also includes those who work abroad,
mostly on temporary/short-term work permits and spend their time in Moldova living off on
remittances sent to the family and/or on retained savings brought back on return.

5
In terms of the economic structure, the informal sector is quite significant in the economy
with an approximate share of 49 percent of the GDP in 2003. This sector in turn counts for about a
third of total employment in Moldova. The rate of informal employment differs significantly
between rural (46%, mainly agriculture) and urban (19%, mainly retail trade) areas while there is
hardly any difference between men and women (35.4% and 31.5% respectively). High-skilled
individuals are also involved in informal occupations, albeit less frequently, with the main reason
for this being the avoidance of taxes.6
The data used in the paper is from a national representative household survey conducted by
CBSAXA in July and August 2006 to study the impact of migration and remittances on Moldovan
households. The date is based on a representative survey of 3940 households which generated a
total sample of 14,068 people, including 4,481 (31.85%) with migration experience abroad. The
dataset contains detailed information about individual and household characteristics, and some
community characteristics.
7 In order to measure the socio-economic conditions in the origin
communities we use a dataset from Roscovan and Galer (2006) with three synthetic indicators:
economic development index (EDI), social development index (SDI) and infrastructure
development index (IDI).8
A migrant is defined as a person who migrated abroad for at least one month, for non-
family visits, since turning age 15. Return migrants are defined as people who had returned home
at the time the survey was conducted. Starting from the original sample of 14,068 people, a
screening selection for valid answers on migration duration and legal status led us to a final
sample of 5,278 people which includes 629 return migrants and 4649 non-migrants, aged between
16 and 65.
Table 1 shows the summary statistics of our variables for the entire sample, non-migrant
and returnees, sorted by the variable categories including household characteristics, poverty
perception variables, network variables and community variables. The individual’s main
6 See European Training Foundation (2007). 7 See Lücke et al. (2007) for a more in-depth description of the survey. 8 These indicators are produced for the needs of the National Centre for Human Settlements “Habitat Moldova Centre”. The Centre was established in December 2005 as part of the UNDP “Mesmerizing Moldova” Project framework. For more information on index methodology and analysis, see Roscovan and Galer (2006). The economic development index combines normalized measures of: 1) average nominal monthly salary per employee; 2) volume of industrial and agricultural production per inhabitant; 3) volume of services per inhabitant; 4) number of SMEs per inhabitant; 5) rate of urbanization. The social development index combines normalized measures of: 1) number of physicians per 10000 inhabitants, 2) number of hospital beds per 10000 inhabitants; 3) number of infant deaths per 1000 live births; 4) number of students per teacher. The infrastructure development index combines normalized measures of: 1) number of cars in private ownership (per 1000 inhabitants); 2) dwelling stock per inhabitant; 3) public passenger transportation; 4) number of telephones per 100 inhabitants; 5) length of public roads per inhabitant; 6) length of water piping per inhabitant; 7) sewerage system length per inhabitant.

6
occupation contains the following categories: farmer or peasant household; employed and non-
occupied. The non-occupied are people officially unemployed or keeping an occupation abroad
during their stay in Moldova. Return migrants are significantly more likely to be employed (17%)
compared to the non-migrants (9%). Also, return-migrants are less likely to be non-occupied
compared to non-migrants − 64% and 72% respectively.
As can be seen in Table 1, women are under-represented in the return migrants’ sample.
Return migrants are on average three years younger than non-migrants and significantly less
educated: university and post-university education rates are respectively 6 and 4 percentage points
lower, whereas college education rate is 9 percentage points higher. Surprisingly, return migrants
have more often Moldovan citizenship only, whereas non-migrants have more often dual
citizenships, Moldovan and Romanian or Moldovan and Ukrainian. Furthermore, return migrants
have significantly lower proportion of un-married individuals and those with immediate families
have relatively more children.
The household subjective economic status in 1998 and 2006 is similar for return migrants
and non-migrants. The mean number of migrants in returnees’ households is 3, including the
returnee, and the household tends to have a ‘social capital’.9
In terms of intentions, nearly 55 percent of return migrants do not intend to re-emigrate.
Only 5 percent of returnees claim that their return to Moldova was due to the difficulty in finding
a job abroad, and 13 percent explain their return by the difficulty of being far from their family.
Return migrants are more likely to be
located in small rural locations, with lower economic development level, but better social and
infrastructure development levels.
Table 2 presents the descriptive statistics according to occupation type. Both return- and
non-migrant non-participants are on average younger than those in the other two categories.
Paradoxically, there is a higher proportion of non-migrants with a university degree in non-
participants category, though consistent with other countries, a very small proportion of highly
educated are farmers. Also, a higher proportion of those with network abroad are self-employed
and non-participants compared to wage employees. In addition, a high proportion of return-
migrants who receive remittances are in wage employment than the other two categories.
9 Social capital here captures the affirmative reply to the following question in the survey: “Other than people from this household, do you know any people from the RM who have migrated abroad?”

7
3. Empirical Approach
As in Piracha and Vadean (2010), the occupational choice is assumed to be determined by
a pairwise comparison of the indirect utilities of the given alternatives:
• non-participation: ,N W N SU U U U> > ,
• wage employment: ,W N W SU U U U> > ,
• self-employment: ,S N S WU U U U> > , (1)
were N, W and S stand for not working, wage employment and self-employment respectively.10
ijijij xU εβ +=
We use the random utility model (see Greene, 2002) to represent these unordered utility rankings,
which is given by
(2)
where ijU is the indirect utility of choice j for individual i, ix a vector of characteristics which
affect the occupational choice, and jβ a vector of choice-specific parameters.
Assumptions about the disturbances ( ijε ) determine the nature of the model and the
properties of its estimator. We assume that ijε are independent and identically distributed with
type I extreme value distribution, which leads to the multinomial logit model (see Greene, 2002;
McFadden, 1973). The probability of choosing alternative j is given by:
( )∑ =
==SWNk
x
x
i ik
ij
eejy
,,
Pr β
β
(3)
Not all jβ are identified and we normalize by setting 0=Wβ .
One has to be careful when looking at a model of occupational choice as migrants are more
likely to be self-selected and therefore their choice is likely to be linked to some unobserved
characteristics, like having lower risk aversion compared to the non-migrants. Therefore a higher
likelihood for self-employment may be linked to their attitudes towards risk or perhaps some
accumulation of (informal) skills while working abroad. Therefore, since it is likely that return
10 The main reason for considering non-participation as an occupational choice is the fact that migrants, due to preference of consumption at home (see for example Stark, 1991; Hill, 1987), often increase work effort abroad and have consumption of leisure and goods at home. Therefore, the observed non-participation at home may be a choice linked to the work activity abroad (see also Dustmann and Kirchkamp, 2002).
8
migrants may not be a random sample from the total population it is important to address this
issue before estimating the model. There are two ways to deal with it: either one can treat this as
an endogeneity problem or a sample selection problem. Based on the model developed in Piracha
and Vadean (2010) and de Coulon and Piracha (2005), we analyse our model under the
assumption that the problem presented above is one of sample selection, i.e., we expect the
estimated coefficients for returnees and non-migrants to be significantly different.
We employ an exogeneity test in which in the first step a probit model estimates the
selection into return migration while in the second test the generalized residual estimated is
introduced as a right hand side in the multinomial logit model, along with all the endogenous
variables as well as the vector of characteristics affecting the occupational choice ( ix ).
A valid test for exogeneity is the insignificance of the generalized residual coefficient in
the occupational choice model. If it holds, then we can conclude that the unobservable effects are
not correlated with the decision to migrate and return and we can estimate the occupational choice
of return migrants separate from that of non-migrants.
4. Estimation Results
Following de Coulon and Piracha (2005), who found that returnees and non-migrants in
Albania obtain different labour market returns to their individual characteristics, we expect the
estimated coefficients for returnees and non-migrants in Moldova to be significantly different. We
apply a Chow test to compare the differences in the coefficients of the two groups. First, eq. (3) is
estimated with interactions of all right hand side variables with the dummies for non-migrants and
return migrants respectively, and allowing each group to have its own intercept. Then, we compare
the coefficients of the variables interacted with the non-migrant dummy to that of the return
migrant dummy.
The null hypothesis of similar coefficients is not rejected; the chi-square value of 2737.32
being higher than the 95 percent level critical value. The estimated coefficients for returnees and
non-migrants in Moldova are significantly not similar. The effects of individual, household and
community characteristics on occupational choice are not the same for returnees and non-
migrants. Return migration could have a slope effect on the occupational choice.
Furthermore, we conduct tests on the variables that identify the selection into return
migration. We consider following variables as selection instruments: the post-university education
level dummy; separated/divorced or widowed or cohabiting dummy and number of migrants in the
household. Because of the economic structure of the country, the most educated have fewer
opportunities in Moldova and, comparatively, can expect a higher return on their skills in the

9
foreign, relatively developed, countries. Separated/divorced or those having other migrants in the
household can have lower “psychological” costs and therefore more potential to migrate.
We expect the instrument to affect the migration decision and to be uncorrelated with the
error term in the occupational choice equation. All of our instruments are significant in the
selection equation and insignificant in the occupational choice equations and, thus, we use them to
identify the model. We further test for sample selection bias (see Table 3). The generalised
residual from the sample selection probit is not significant in the multinomial logit equation.
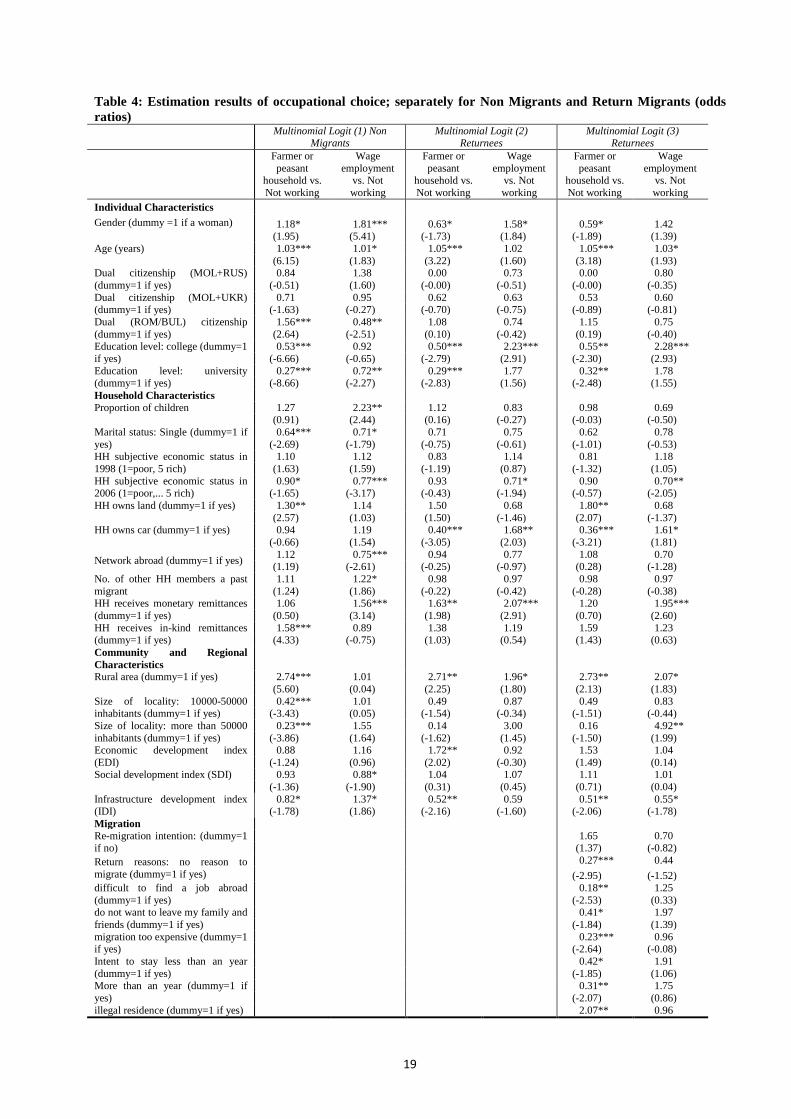
The odds ratios, when occupations of returnees are considered alternative to the occupations of
non-migrants are presented in Table 4. If we compare the results of Multinomial Logit (1) for Non
Migrants and Multinomial Logit (2) for Returnees, we see that a lot of variables have similar
impact on the occupation choice. The exceptions are gender and Infrastructure development index
(IDI). Women non-migrants have approximately 15 percent less chances of not participating
compared to being wage employed, whereas women returnees have about 69 percent more
chances of not participating instead of being wage employed.11
In the same vein, non-migrants from regions with better infrastructure have approximately
15 percent less possibility to not participate compared to being a farmer, whereas returnees have
about 72 percent more chances not to work instead of being a farmer. Women have higher chances
to be wage employed instead of being a farmer than men for both non- and return-migrants.
12
Each additional year increases the odds of being a wage employee compared to a non-
participant by about 3 percent among non-migrants and by about 5 percent among return migrants.
Only in the case of return migrants, those with dual Russian citizenship have no possibility to
work as a wage employee as opposed to being not working. Anecdotal evidence suggests that in
communities with individuals having dual citizenship (especially Russian), there is a strong
potential for doing unofficial, highly lucrative business, as they have better access to capital and
political connections.
Having a dual Romanian or Bulgarian citizenship does not affect the occupation choice of
return migrants but significantly affects the occupation choice of non-migrants. Having a double
Romanian or Bulgarian citizenship decreases one’s odds of not working versus being a farmer by
approximately 46 percent, increases one’s odds of not working instead of being wage employed
by 108 percent, and increases one’s odds of being a farmer instead of being wage employee by 69
percent. Gaining dual citizenship with these countries is an arduous task as it requires several trips
11 In our data “not work” is the aggregation of “officially unemployed” (a very small proportion) and “officially inactive”. 12 This confirms the observation of Trofimov (2008) who, using LFS data, also showed that at the national level women are more involved in non-agricultural activities than men.

10
to the countries and countless other administrative burdens. Since there are several benefits from
gaining the citizenship, not least of relatively more freedom to travel to other EU countries, most
people prefer to be in an informal setup, as opposed to wage employment, in order to have the
ability to fulfil administrative requirements.
For both return migrants and non-migrants, having college or university education versus
primary or secondary increases the odds of not working instead of being a farmer or a wage
employee, and decreases significantly the odds of being a farmer versus a wage employee. This
result contradicts the one found in a recent report by ETF (2009). However, it corresponds to the
conventional wisdom that the higher the education level, the more likely a person is to be
employed than being a farmer. However, one of the reasons why more educated are likely to
appear as not participating is more to do with the cost of formal employment as the tax structure
puts prohibitive pressure on people’s willingness to be employed in the formal sector.
The proportion of children in the household affects the choice of occupation only in the
case of non-migrants: the chances of being not working versus a farmer decreases by 65 percent.
Being single affects again only the occupation choice of non-migrants; they have higher chances
not to work versus being wage employed or being a farmer. People from richest households have
more chances not to work versus being a farmer, for both return migrants and non-migrants.
Again, this is most likely related to the rich being able to afford private insurance and hence do
not need to be formally employed due to high indirect taxation.
Receiving monetary and in-kind remittances affects mostly non-migrants’ occupation
choices. Those who receive in-kind remittances are more likely to be wage employees compared
to not working or being a farmer while those who receive monetary transfers are more likely to be
farmer compared to not working and at the same time they have more chances to be wage
employed instead of being a farmer. Returnees who receive monetary remittances are only more
likely to be farmers versus not-working. This is probably due to the fact that wages in the official
labour market are quite low in most sectors of the economy, so those who receive remittances can
afford to work in the official sector as they have less reasons for tax avoidance (see footnote 2),
while those who do not receive remittances are compelled to work in unofficial sector where net
wages can be higher.
Having network or siblings abroad do affect only the occupation choices of non-migrants.
Having a member of HH abroad increases the odds of being a farmer instead of not-working while
having a network (social capital; knowing someone other than HH member abroad) increases the
odds of non-participation instead of being a farmer and at the same time increases the odds of
being a farmer instead of being a wage employee.

11
Being from a rural area increases the odds of being a wage employee instead of not
participating, for both returnees and non-migrants, but returnees from rural area are more likely to
be farmers instead of not participating, whereas the rural non-migrants are more likely to be
farmers instead of being employees. The results seem quite intuitive but they do seem to
contradict the changes of rural-urban profile observed in ETF (2009).
Being from a small/medium city influences the occupation choices only for non-migrants
as they are more likely to not work versus being a wage employee, thus confirming the results
reported in ETF (2009). Since Moldova has a large rural population, it is no surprise that most of
the poor (about 70%) are also in the rural areas. However, the inhabitants of small towns in
Moldova have the highest risk of poverty either because of the absence of work opportunities in
the industrial sector or maybe because of poor remuneration of work; and the lack of land for
subsistence agriculture.
The results of Multinomial Logit (3) for Returnees in Table 4 indicate that returnees have
more chances not to work instead of being wage employed if they returned to Moldova for one of
the following reasons: (i) they did not have reasons to migrate, (ii) they had difficulties in finding
a job in the host country, (iii) they did not want to leave the families for long and (iv) migration
was too expensive to sustain. If they had precise intentions about the duration of stay (more or less
than a year) then they have also more chances not to work versus wage employment. Finally, and
quite interestingly, returnees who had illegal residence in destination country are more likely to be
wage employed versus not working when back in Moldova. This is perhaps because they are less
likely to migrate again and consider more permanent setup in Moldova.
5. Concluding Remarks
Using the CBSAXA data, we have explored the occupational choice of return migrants
compared to non-migrants. The results obtained conform to some of those obtained for other
countries in Eastern Europe as well (e.g., Piracha and Vadean, 2009 for Albania). For instance, we
showed that those who obtain less than expected outcome or stayed illegally in the host country
tend to go in wage employment on return to the home country. However, contrary to the result
found for Albania, better educated Moldovans are more likely to migrate and less likely to go in
wage employment on their return to the home country. This is likely to be because of the tax
structure in the country, which makes people work in the informal sector, in order to avoid myriad
taxes imposed, mainly the indirect cost of social security contributions, on those in the formal
sector. Since the negative aspect of not working in the formal sector is the loss of social security,

12
the relatively low skilled (poor) are more likely to be in formal jobs as they do not have funds to
buy, for instance, private health insurance etc.
Even with favorable development aspects in Moldova in recent years, migration will
remain an important avenue for many as the international wage differences are likely to remain
high. However, since many Moldovans work in relatively low-skilled jobs in the host countries,
migration trends are likely to be temporary in nature rather than permanent. This has benefits for
the receiving countries as it limits the stock of permanent migrants; and for Moldova as the short-
term migrants are able to use their newly acquired skills, which, in our context, include exposure
to working in a capitalist/entrepreneurship environment, relatively quickly in the home country
(see Leon-Ledesma and Piracha, 2004). However, to achieve this government of Moldova needs
to re-evaluate its tax structure, particularly the social security contributions of employers and
(indirectly) employees in order to promote the formal labour market.
Finally, data constraints did not allow us to explore non-farm self-employment which is
crucial for analysing the role of return migration in job creating activities in Moldova. We think
future research, perhaps with better data, should attempt to explore this avenue further.

13
References Center for Strategic Studies and Reforms (CISR) (2000). Republic of Moldova: Socio-Economic Situation and Labour Market Chisinau, Chişinău, 34 p., http://www.cisr-md.org/ Council of Europe (2007). “Employment Policy Review, Moldova”. Report prepared by the International Labour Office and the Council of Europe in 2005 and 2006, 88p. http://www.coe.int/t/dg3/socialpolicies/socialrights/source/EmploymentPolicyReviewMoldova.pdf. De Coulon, A. and M. Piracha (2005). “Self-Selection and the Performance of Return Migrants”. Journal of Population Economics, 18(4): 779-807 Dustmann, C. and O. Kirchkamp (2002). “The optimal migration duration and activity choice after re-migration”. Journal of Development Economics 67(2): 351-72. European Training Foundation (2009). Moldova Country Report, Working Dcoument, ENPI 08-14 Black Sea Labour Market Reviews, 122 p. European Training Foundation (2007). A Study of the Modovan Vocational Education and Training System and Its Relevance to Labour Market Needs. Green, W.H. (2002), Econometric Analysis, 5th edition, New Jersey: Prentice-Hall. Hill, J.K. (1987), “Immigrant decisions concerning duration of stay and migratory frequency”, Journal of Development Economics 25(1): 221-34. IOM (2004), “Return Migration: Policies and Practice in Europe”, Organisation Internationale pour les Migrations, Geneva, 402 pp. Ilahi, N. (1999), “Return Migration and Occupational Change”, Review of Development Economics 3(2): 170-86. Leon-Ledesma, M. and M. Piracha (2004). “Return Migration and the Role of Remittances in Eastern Europe”. International Migration, 42 (4):65–83. Lindauer D. L., (1999), “Labor and Poverty in the Republic of Moldova,” in Moldova: Poverty Assessment Technical Papers, World Bank Report 19846 MD (October 1999), Lindauer D. L. (1998), “Labor and Poverty in the Republic of Moldova,” Development Discussion Paper No. 635, May 1998, Harvard Institute for International Development, Harvard University Lücke, M., T. O. Mahmoud and P. Pinger (2007). “Patterns and Trends of Migration and Remittances in Moldova”, International Organization for Migration, Mission to Moldova, Chisinau, http://www.iom.md McCormick, B. and J. Wahba (2001), “Overseas Work Experience, Savings and Entrepreneurship amongst Return Migrants to LDCs”, Scottish Journal of Political Economy 48(2):164–78.

14
McFadden, D. (1973), “Conditional Logit Analysis of Qualitative Choice Behavior”, in P. Zarembka (ed.), Frontiers in Econometrics, New York: Academic Press. Piracha, M and F. Vadean (2010), “Return Migration and Occupational Choice: Evidence from Albania”, World Development, 38(8): 1141-1155. National Bureau of Statistics (2007), Forta de Munca in Republica Moldova - Ocupare si Somaj, Nota informativa, Chişinău, Statistica, 18 p., http://www.statistica.md National Bureau of Statistics, 2008, Labour Force in the Republic of Moldova, Employment and Unemployment, Chişinău, Statistica, 207 p., http://www.statistica.md Roscovan, M., L. Galer, 2006, Raitingul de dezvoltare a unitatilor administrativ-teritoriale ale Republicii Moldova, Moldova Urbana. nr.1. Rutkowski, J. (2004), Firms, Jobs and Employment in Moldova, World Bank Policy Research Working Paper 3253, 50 p. Stark, O. (1991), “The Migration of Labour”, Basil Blackwell, Oxford.
Trofimov, V. (2008), “Women and Men in the labor market of the Republic of Moldova, Analytical Report, Chişinău, Statistica, 102 p.

15
Table 1: Descriptive statistics by past migration experience Return
Migrants Non
Migrants
Mean value
Mean value
difference t-test (t value)
Individual Characteristics Gender (dummy =1 if a woman) 0.37 0.50 0.13 6.2095 *** Age 36.75 40.35 3.60 7.2100 *** Dual citizenship (MOL+RUS) (dummy=1 if yes) 0.04 0.05 0.01 1.0677 Dual citizenship (MOL+UKR) (dummy=1 if yes) 0.04 0.06 0.02 2.0919 *** Dual citizenship (BUL/ROM) (dummy=1 if yes) 0.03 0.06 0.03 3.5076*** Moldovan) citizenship only (dummy=1 if yes) 0.89 0.82 -0.07 -4.1682*** Education level: primary and secondary 0.37 0.35 -0.01 -0.5387 Education level: college 0.41 0.32 -0.09 -4.5595*** Education level: university 0.16 0.23 0.06 3.4516*** Education level: post-university 0.06 0.10 0.04 3.3678*** Occupation: farmer 0.19 0.19 -0.01 -0.3978 Occupation: employee 0.17 0.09 -0.08 -6.1866*** Occupation: unoccupied 0.64 0.72 0.09 4.4275*** Household Characteristics Proportion of children 0.19 0.13 -0.06 -8.0208*** Single 0.13 0.16 0.04 2.2736** Married 0.77 0.75 -0.02 -1.4378 Separated/divorced or widowed or cohabiting 0.10 0.09 -0.01 -0.6939 HH subjective economic status in 1998 (1=poor, 5 rich)
2.78 2.80 0.02 0.7229
HH subjective economic status in 2006 (1=poor,... 5 rich)
2.93 2.95 0.02 0.7038
HH owns land (dummy=1 if yes) 0.58 0.54 -0.4 -1.6777** HH owns car (dummy=1 if yes) 0.26 0.28 0.02 0.9260 Network abroad (dummy=1 if yes) 0.74 0.65 -0.10 -5.3675*** Number of other HH members a migrant 2.23 0.14 -2.09 -69.0294*** HH receives monetary remittances (dummy=1 if yes) 0.45 0.18 -0.28 -16.5992*** HH receives non-monetary remittances (dummy=1 if yes) 0.17 0.17 0.002 0.1553 Community and Regional Characteristics Rural area 0.69 0.61 -0.09 -3.9593*** Size of locality: 10000-50000 inhabitants 0.17 0.09 -0.08 -6.0311*** Size of locality: more than 50000 inhabitants 0.11 0.25 0.14 7.9557*** Economic development index (EDI) 0.34 0.55 0.23 5.0973*** Social development index (SDI) 1.40 0.71 0.69 7.0771*** Infrastructure development index (IDI) 0.36 0.21 0.15 4.814*** Migration Re-migration intention: (dummy=1 if yes) 0.44 Re-migration intention: (dummy=1 if no) 0.55 Return reason: no reason to migrate (dummy=1 if yes)
0.17
Return reason: difficult to find a job abroad (dummy=1 if yes)
0.05
Return reason: do not want to leave my family and friends (dummy=1 if yes)
0.14
migration too expensive (dummy=1 if yes) 0.09 Return reason: other reasons (dummy=1 if yes) 0.65 Intent to stay less than an year (dummy=1 if yes) 0.74 Intent to stay more than an year (dummy=1 if yes) 0.20 No residence permit (dummy=1 if yes) 0.40 Observations 629 4649 Notes: ** significant at 5%; *** significant at 1%. The sample included is the potential labor force (i.e. not enrolled in education, not retired, not handicapped, and not in military service) aged 16 to 64.

16
Table 2: Descriptive statistics by occupational choice: return migrants (mean values) and non-migrants (mean values) non-migrants return migrants
Farmer or peasant household
Wage employment Not working Farmer or peasant household
Wage employment Not working
Individual Characteristics Gender (dummy =1 if a woman) 0.50 0.63 0.49 0.27 0.46 0.38 Age 43.62 41.20 39.40 39.07 38.49 35.59 Dual citizenship (MOL+RUS) (dummy=1 if yes) 0.01 0.09 0.05 0.00 0.04 0.05 Dual citizenship (MOL+UKR) (dummy=1 if yes) 0.04 0.07 0.07 0.02 0.04 0.05 Dual citizenship (BUL/ROM) (dummy=1 if yes) 0.08 0.03 0.06 0.02 0.03 0.03 Education level: college 0.26 0.35 0.33 0.36 0.56 0.39 Education level: university 0.07 0.22 0.26 0.07 0.20 0.18 Household Characteristics Proportion of children 0.13 0.14 0.12 0.19 0.18 0.19 Marital status: Single (dummy=1 if yes) 0.09 0.11 0.18 0.08 0.08 0.15 HH subjective economic status in 1998 (1=poor, 5 rich) 2.74 2.81 2.82 2.71 2.76 2.80 HH subjective economic status in 2006 (1=poor,... 5 rich) 2.85 2.88 2.99 2.85 2.86 2.97 HH owns land (dummy=1 if yes) 0.78 0.47 0.49 0.71 0.53 0.55 HH owns car (dummy=1 if yes) 0.25 0.32 0.28 0.17 0.35 0.27 Network abroad (dummy=1 if yes) 0.68 0.56 0.64 0.74 0.73 0.76 No. of other HH members a past migrant 0.20 0.18 0.12 2.51 2.21 2.16 HH receives monetary remittances (dummy=1 if yes) 0.22 0.21 0.16 0.48 0.56 0.42 HH receives monetary non-remittances (dummy=1 if yes) 0.24 0.13 0.16 0.19 0.18 0.16
Community and Regional Characteristics Rural area 0.93 0.50 0.54 0.91 0.69 0.63 Size of locality: 10000-50000 inhabitants 0.03 0.09 0.11 0.09 0.14 0.20 Size of locality: more than 50000 inhabitants 0.01 0.37 0.29 0.01 0.15 0.12 Economic development index (EDI) -0.06 0.87 0.69 0.18 0.37 0.39 Social development index (SDI) 0.02 2.01 1.69 0.18 0.90 0.82 Infrastructure development index (IDI) -0.06 0.58 0.44 0.04 0.18 0.27
Migration
Re-migration intention: (dummy=1 if no) 0.48 0.53 0.58
Return reasons: no reason to migrate 0.11 0.09 0.20
Difficult to find a job abroad (dummy=1 if yes) 0.03 0.05 0.05
Do not want to leave my family and friends (dummy=1 if yes) 0.08 0.22 0.13
Other reasons (dummy=1 if yes) 0.06 0.08 0.10
Intent to stay less than an year (dummy=1 if yes) 0.77 0.76 0.73
More than an year (dummy=1 if yes) 0.12 0.20 0.22
Illegal residence (dummy=1 if yes) 0.25 0.15 0.14

17
Table 3: Sample selection test Probit Multinomial Logit Return migration
vs. non migration Farmer or peasant household vs. Not
working
Not working Wage employment
vs. Not working Individual Characteristics Gender (dummy =1 if a woman) 0.78*** 1.13 1.75*** (-3.77) (1.47) (5.66) Age 0.97*** 1.03*** 1.01** (-10.04) (6.71) (2.45) Dual citizenship (MOL+RUS) (dummy=1 if yes) 0.97 0.71 1.30 (-0.19) (-1.00) (1.39) Dual citizenship (MOL+UKR) (dummy=1 if yes) 1.01 0.68* 0.91 (0.06) (-1.91) (-0.47) Dual citizenship (BUL/ROM) (dummy=1 if yes) 0.68** 1.64*** 0.55** (-2.37) (3.07) (-2.24) Education level: tertiary college 1.23*** 0.53*** 1.07 (2.70) (-7.26) (0.62) Education level: university 1.08 0.27*** 0.82 (0.80) (-9.13) (-1.48) Household Characteristics Proportion of children 1.08 1.16 1.80** (0.39) (0.61) (2.02) Marital status: Single (dummy=1 if yes) 0.74*** 0.64*** 0.72* (-2.89) (-2.87) (-1.85) HH subjective economic status in 1998 (1=poor, 5 rich) 1.01 1.06 1.13* (0.25) (1.05) (1.86) HH subjective economic status in 2006 (1=poor,... 5 rich) 0.92* 0.92 0.77*** (-1.79) (-1.45) (-3.69) HH owns land (dummy=1 if yes) 0.93 1.33*** 1.08 (-1.04) (3.02) (0.68) HH owns car (dummy=1 if yes) 0.90 0.90 1.27** (-1.53) (-1.21) (2.34) Network abroad (dummy=1 if yes) 1.19** 1.14 0.76*** (2.50) (1.49) (-2.79) HH receives monetary remittances (dummy=1 if yes) 1.22*** 1.17 1.71*** (2.68) (1.62) (4.49) Community and Regional Characteristics Rural area 0.90 2.88*** 1.17 (-0.94) (6.37) (0.90) Size of locality: 10000-50000 inhabitants 1.24* 0.49*** 0.91 (1.77) (-3.31) (-0.48) Size of locality: more than 50000 inhabitants 0.65*** 0.22*** 1.75** (-2.60) (-4.16) (2.29) Economic development index (EDI) 1.11 0.98 1.12 (1.32) (-0.25) (0.84) Social development index (SDI) 0.98 0.94 0.93 (-0.63) (-1.32) (-1.27) Infrastructure development index (IDI) 1.02 0.76*** 1.12 (0.24) (-2.67) (0.78) Selection Controls Education level: post-university 0.60*** (-3.49) Separated/divorced or widowed or cohabiting 1.46*** (3.67) Number of other HH members a migrant 2.66*** (30.16) Generalized Residual (selection eq.) 0.97 1.07 (-0.25) (0.55) Return Migrant (dummy) 1.22 2.04*** (1.24) (3.82)

18
Probit Multinomial Logit Return migration
vs. non migration Farmer or peasant household vs. Not
working
Not working Wage employment
vs. Not working Constant 0.76 0.05*** 0.06*** (-1.17) (-9.08) (-7.30) Observations 5278 5278 Chi2 1964.71*** 1157.94*** BIC 2079.71 7544.79 Note : * p<0.10, ** p<0.05, *** p<0.01
19
Table 4: Estimation results of occupational choice; separately for Non Migrants and Return Migrants (odds ratios) Multinomial Logit (1) Non
Migrants Multinomial Logit (2)
Returnees Multinomial Logit (3)
Returnees
Farmer or peasant
household vs. Not working
Wage employment
vs. Not working
Farmer or peasant
household vs. Not working
Wage employment
vs. Not working
Farmer or peasant
household vs. Not working
Wage employment
vs. Not working
Individual Characteristics Gender (dummy =1 if a woman)
1.18* 1.81*** 0.63* 1.58* 0.59* 1.42 (1.95) (5.41) (-1.73) (1.84) (-1.89) (1.39)
Age (years)
1.03*** 1.01* 1.05*** 1.02 1.05*** 1.03* (6.15) (1.83) (3.22) (1.60) (3.18) (1.93)
Dual citizenship (MOL+RUS) (dummy=1 if yes)
0.84 1.38 0.00 0.73 0.00 0.80 (-0.51) (1.60) (-0.00) (-0.51) (-0.00) (-0.35)
Dual citizenship (MOL+UKR) (dummy=1 if yes)
0.71 0.95 0.62 0.63 0.53 0.60 (-1.63) (-0.27) (-0.70) (-0.75) (-0.89) (-0.81)
Dual (ROM/BUL) citizenship (dummy=1 if yes)
1.56*** 0.48** 1.08 0.74 1.15 0.75 (2.64) (-2.51) (0.10) (-0.42) (0.19) (-0.40)
Education level: college (dummy=1 if yes)
0.53*** 0.92 0.50*** 2.23*** 0.55** 2.28*** (-6.66) (-0.65) (-2.79) (2.91) (-2.30) (2.93)
Education level: university (dummy=1 if yes)
0.27*** 0.72** 0.29*** 1.77 0.32** 1.78 (-8.66) (-2.27) (-2.83) (1.56) (-2.48) (1.55)
Household Characteristics Proportion of children
1.27 2.23** 1.12 0.83 0.98 0.69 (0.91) (2.44) (0.16) (-0.27) (-0.03) (-0.50)
Marital status: Single (dummy=1 if yes)
0.64*** 0.71* 0.71 0.75 0.62 0.78 (-2.69) (-1.79) (-0.75) (-0.61) (-1.01) (-0.53)
HH subjective economic status in 1998 (1=poor, 5 rich)
1.10 1.12 0.83 1.14 0.81 1.18 (1.63) (1.59) (-1.19) (0.87) (-1.32) (1.05)
HH subjective economic status in 2006 (1=poor,... 5 rich)
0.90* 0.77*** 0.93 0.71* 0.90 0.70** (-1.65) (-3.17) (-0.43) (-1.94) (-0.57) (-2.05)
HH owns land (dummy=1 if yes) 1.30** 1.14 1.50 0.68 1.80** 0.68 (2.57) (1.03) (1.50) (-1.46) (2.07) (-1.37) HH owns car (dummy=1 if yes) 0.94 1.19 0.40*** 1.68** 0.36*** 1.61* (-0.66) (1.54) (-3.05) (2.03) (-3.21) (1.81)
Network abroad (dummy=1 if yes) 1.12 0.75*** 0.94 0.77 1.08 0.70 (1.19) (-2.61) (-0.25) (-0.97) (0.28) (-1.28)
No. of other HH members a past migrant
1.11 1.22* 0.98 0.97 0.98 0.97 (1.24) (1.86) (-0.22) (-0.42) (-0.28) (-0.38)
HH receives monetary remittances (dummy=1 if yes)
1.06 1.56*** 1.63** 2.07*** 1.20 1.95*** (0.50) (3.14) (1.98) (2.91) (0.70) (2.60)
HH receives in-kind remittances (dummy=1 if yes)
1.58*** 0.89 1.38 1.19 1.59 1.23 (4.33) (-0.75) (1.03) (0.54) (1.43) (0.63)
Community and Regional Characteristics Rural area (dummy=1 if yes)
2.74*** 1.01 2.71** 1.96* 2.73** 2.07* (5.60) (0.04) (2.25) (1.80) (2.13) (1.83)
Size of locality: 10000-50000 inhabitants (dummy=1 if yes)
0.42*** 1.01 0.49 0.87 0.49 0.83 (-3.43) (0.05) (-1.54) (-0.34) (-1.51) (-0.44)
Size of locality: more than 50000 inhabitants (dummy=1 if yes)
0.23*** 1.55 0.14 3.00 0.16 4.92** (-3.86) (1.64) (-1.62) (1.45) (-1.50) (1.99)
Economic development index (EDI)
0.88 1.16 1.72** 0.92 1.53 1.04 (-1.24) (0.96) (2.02) (-0.30) (1.49) (0.14)
Social development index (SDI)
0.93 0.88* 1.04 1.07 1.11 1.01 (-1.36) (-1.90) (0.31) (0.45) (0.71) (0.04)
Infrastructure development index (IDI)
0.82* 1.37* 0.52** 0.59 0.51** 0.55* (-1.78) (1.86) (-2.16) (-1.60) (-2.06) (-1.78)
Migration Re-migration intention: (dummy=1 if no)
1.65 0.70 (1.37) (-0.82)
Return reasons: no reason to migrate (dummy=1 if yes)
0.27*** 0.44 (-2.95) (-1.52)
difficult to find a job abroad (dummy=1 if yes)
0.18** 1.25 (-2.53) (0.33)
do not want to leave my family and friends (dummy=1 if yes)
0.41* 1.97 (-1.84) (1.39)
migration too expensive (dummy=1 if yes)
0.23*** 0.96 (-2.64) (-0.08)
Intent to stay less than an year (dummy=1 if yes)
0.42* 1.91 (-1.85) (1.06)
More than an year (dummy=1 if yes)
0.31** 1.75 (-2.07) (0.86)
illegal residence (dummy=1 if yes) 2.07** 0.96

20
Multinomial Logit (1) Non Migrants
Multinomial Logit (2) Returnees
Multinomial Logit (3) Returnees
Farmer or peasant
household vs. Not working
Wage employment
vs. Not working
Farmer or peasant
household vs. Not working
Wage employment
vs. Not working
Farmer or peasant
household vs. Not working
Wage employment
vs. Not working
(2.38) (-0.11) Constant
0.05*** 0.08*** 0.07*** 0.07*** 0.19 0.04*** (-8.70) (-6.20) (-2.79) (-2.97) (-1.48) (-2.79)
Observations 4649 629 629 Observations by occupation (%) 72.25 63.75 16.85 63.75 16.85 Predicted probability (%) 81.72 78.94 17.33 79.54 16.52 chi2 1067.16*** 153.45*** 197.53*** bic 6455.70 1288.15 1352.62 Note : * p<0.10, ** p<0.05, *** p<0.01