occasional paper series - european central bank · occasional paper series since 2009 130 ... gr...
TRANSCRIPT

Occas iOnal PaPer ser i e snO 113 / j une 2010
energy markets
and the eurO area
macrOecOnOmy
Task Force of the Monetary Policy Committeeof the European System of Central Banks

In 2010 all ECB publications
feature a motif taken from the
€500 banknote.
OCCAS IONAL PAPER SER IESNO 113 / JUNE 2010
ENERGY MARKETS AND
THE EURO AREA
MACROECONOMY
This paper can be downloaded without charge from http://www.ecb.europa.eu or from the Social Science
Research Network electronic library at http://ssrn.com/abstract_id=1622607.
NOTE: This Occasional Paper should not be reported as representing
the views of the European Central Bank (ECB) or other
Eurosystem central banks.
The views expressed are those of the authors
and do not necessarily reflect those of the ECB
or other Eurosystem central banks.
Task Force of the Monetary Policy Committee
of the European System of Central Banks

© European Central Bank, 2010
AddressKaiserstrasse 29
60311 Frankfurt am Main, Germany
Postal addressPostfach 16 03 19
60066 Frankfurt am Main, Germany
Telephone+49 69 1344 0
Internethttp://www.ecb.europa.eu
Fax+49 69 1344 6000
All rights reserved.
Any reproduction, publication and reprint in the form of a different publication, whether printed or produced electronically, in whole or in part, is permitted only with the explicit written authorisation of the ECB or the authors.
Information on all of the papers published in the ECB Occasional Paper Series can be found on the ECB’s website, http://www.ecb.europa.eu/pub/scientifi c/ops/date/html/index.en.html
ISSN 1607-1484 (print)
ISSN 1725-6534 (online)

3ECB
Occasional Paper No 113
June 2010
CONTENTS
EXECUTIVE SUMMARY 7
INTRODUCTION 10
1 OVERVIEW OF ENERGY MARKETS 12
1.1 Energy production
and dependence 12
1.1.1 Energy production 12
1.1.2 Energy dependence 15
1.2 Energy consumption
and intensity 20
1.2.1 Consumption patterns 20
1.2.2 Energy intensity 23
1.3 Energy market structure
and regulation 25
1.3.1 Evolution of EU energy
market regulation 26
1.3.2 Openness and competition
in EU energy markets 27
1.3.3 Other elements of the EU
energy policy framework 30
1.4 Future trends 37
2 THE IMPACT OF ENERGY PRICES ON
ECONOMIC ACTIVITY 40
2.1 Impact on economic activity –
conceptual considerations 40
2.2 Impact on economic activity –
empirical evidence 42
2.3 Long-run impact on output 51
2.4 Summary of impact on output 55
3 THE IMPACT OF ENERGY PRICES ON
INFLATION 56
3.1 Conceptual framework 56
3.2 Direct fi rst-round effects 57
3.2.1 Consumer liquid
fuel prices 57
3.2.2 Consumer non-oil
energy prices 64
3.2.3 Summary of the direct fi rst-
round effects of a change in
oil prices on HICP energy 73
3.3 Indirect effects via the
production chain 74
3.3.1 An analysis based on input-
output tables 74
3.3.2 An analysis based on
small-scale structural models 76
3.3.3 Results from large-scale
macroeconometric models 79
3.4 Conclusion on the impact of
energy prices on infl ation 84
ANNEXES 87
1 Detailed cross-country charts
and tables 87
2 Technical annexes 105
2.1 Technical annex to Box 2:
security of energy supply 105
2.2 Oil price shocks and
euro area output in the
Blanchard-Gali (2007)
framework 111
2.3 Comparison of weekly
Oil Bulletin and HICP data 112
2.4 Econometric assessment
of oil price pass-through
into consumer liquid fuel
prices 113
2.5 Gas and electricity price
levels (HICP index vs.
price level data) 115
2.6 Econometric assessment
of the impact of the
liberalisation of electricity
and gas markets on
consumer prices 116
2.7 Input-output tables 118
REFERENCES 121
EUROPEAN CENTRAL BANK
OCCASIONAL PAPER SERIES SINCE 2009 130
LIST OF BOXES:
Drivers of international 1
oil price developments 16
The security of energy supply 2
in the euro area 31
Greenhouse gas emissions 3
and climate change policies 34
Energy prices and external imbalances 4 45
Micro evidence on transport 5
fuel prices in France 63
Monetary policy response to energy 6
price changes and the role of infl ation
expectations 82
CONTENTS

4ECB
Occasional Paper No 113
June 2010
COUNTRIES NL Netherlands
BE Belgium AT Austria
DE Germany PT Portugal
IE Ireland SI Slovenia
GR Greece SK Slovakia
ES Spain FI Finland
FR France UK United Kingdom
IT Italy JP Japan
CY Cyprus CH Switzerland
LU Luxembourg US United States
MT Malta
OTHERS
CO2 carbon dioxide
CO2-e carbon dioxide equivalent
DSGE dynamic stochastic general equilibrium
ECB European Central Bank
EIA Energy Information Administration
EMU Economic and Monetary Union
ESCB European System of Central Banks
ETS Emission Trading Scheme
EU European Union
EUR euro
GDP gross domestic product
GJ gigajoule
GHG greenhouse gas
HICP Harmonised Index of Consumer Prices
HICPX HICP excluding energy
HHI Herfi ndahl-Hirschman Index
IEA International Energy Agency
IMF International Monetary Fund
IOT input-output tables
kWh kilowatt hours
LNG liquefi ed natural gas
mb/d million barrels per day
MMBtu million British thermal units
Mt million tons
MWh megawatt hours
NACE statistical classifi cation of economic activities in the EU
NCB national central bank
OECD Organisation for Economic Co-operation and Development
OPEC Organization of the Petroleum Exporting Countries
PMR OECD Product Market Regulation database
PPI Producer Price Index
ppm parts per million
ppmv parts per million by volume
ABBREVIATIONS

5ECB
Occasional Paper No 113
June 2010
ABBREVIATIONS
S(VAR) (Structural) Vector AutoRegression
toe tons of oil equivalent
TWh terawatt hours
USD US dollar
In accordance with EU practice, the EU Member States are listed in this report using the alphabetical order of the country names in the national languages.

6ECB
Occasional Paper No 113
June 2010
TASK FORCE OF THE MONETARY POLICY COMMITTEE OF THE EUROPEAN SYSTEM OF CENTRAL BANKS
This report was drafted by an ad hoc Task Force of the Monetary Policy Committee of the European
System of Central Banks. The Task Force was chaired by Rolf Strauch. Aidan Meyler acted as
Secretary to the Task Force.
The full list of members of the Task Force is as follows:
European Central Bank Rolf Strauch (Chairman); Aidan Meyler (Secretary);
Sylvia Kelley/Claudia Sullivan (administrative assistance);
Roland Beck; Agostino Consolo; Riccardo Costantini;
Michael Fidora; Luca Gattini; Bettina Landau; Ana Lima;
David Lodge; Marco Lombardi; Ricardo Mestre;
Matthias Mohr; Moreno Roma; Frauke Skudelny;
Michal Slavik; Michel Soudan; Martin Spitzer;
Melina Vasardani
Nationale Bank van België/ Banque Nationale de Belgique Vanessa Baugnet; David Cornille
Deutsche Bundesbank Christin Hartmann; Ulf Slopek
Central Bank and Financial Services Authority of Ireland Derry O’Brien; Laura Weymes
Bank of Greece Zacharias Bragoudakis; Pinelopi Zioutou
Banco de España Ángel Estrada; María de los Llanos Matea; Noelia Jiménez;
Anton Nakov; Galo Nuño
Banque de France Erwan Gautier; Delphine Irac; Nicolas Maggiar
Banca d’Italia Ivan Faiella; Fabrizio Venditti
Central Bank of Cyprus Lena Cleanthous
Banque centrale du Luxembourg Muriel Bouchet; Amela Hubic
Central Bank of Malta Brian Micallef
De Nederlandsche Bank Guido Schotten
Oesterreichische Nationalbank Andreas Breitenfellner
Banco de Portugal João Amador
Banka Slovenije Monika Tepina
Národná banka Slovenska Mikulas Car; Milan Donoval

7ECB
Occasional Paper No 113
June 2010
EXECUTIVE
SUMMARYEXECUTIVE SUMMARY
Energy plays an important role in modern
society, touching almost every aspect of our
daily lives. It provides fuel for transport and
heating, power for domestic uses and affects
almost every business in industry, services and
agriculture. Indeed energy is so inextricably
interlinked with our modern lives that we
take it for granted until either a system failure
(e.g. blackouts or shortages) or large price
movements (as witnessed in the 1970s and again
since 1999) remind us of its importance. The
price gyrations over the last number of years
have been particularly dramatic. International
oil prices fl uctuated around USD 20 per barrel in
the 1990s, before rising, especially since 2004,
to reach an all time high of close to USD 150 per
barrel in mid-2008, and subsequently declining
to USD 30 per barrel by end-2008. Since then,
oil prices have rebounded and averaged around
USD 75 per barrel in the fi nal quarter of 2009.
Central banks, when facing energy price
fl uctuations, must understand their nature and
how they will propagate through the economy
to affect output and prices. The nature of
energy price fl uctuations refers to their driving
forces, whether they are driven by fundamental
demand, supply-side factors or fi nancial market
activity, and to their persistence. An increase in
international energy prices can, for example, be
a short-term phenomenon (as witnessed in 1990
during the Persian Gulf War) or a medium to
long-term change in the terms of trade driven
by structurally rising demand, as seems to have
been the case over the past decade. Energy
supply shocks, which have countervailing
impacts on infl ation and activity, pose particular
challenges for monetary policy-makers. The
propagation of shocks, on which most of this
report will focus, depends on the energy mix,
the energy dependency of a country and the
energy intensity of consumption and production
as well as the effective competition in energy
markets, which are generally characterised
by a high degree of complexity. Moreover,
the transmission of energy price shocks is
shaped by the real adjustments in the economy
in the short and medium to long run, as well
as structural determinants of the pass-through
to consumer prices. The combination of these
factors and the policy response of central banks
eventually explain the transmission of energy
price fl uctuations to overall infl ation.
Two key factors determine the vulnerability
of the euro area economy to large energy
price changes in international markets: energy
intensity and energy dependency. The energy
intensity of the euro area (i.e. energy used
per unit of output) has, in common with other
industrialised economies, generally fallen
over the past 50 years owing to technological
advances as well as sector shifts. On its own, this
trend, coupled with the increased diversifi cation
of energy sources, would have served to
attenuate the impact of international energy
price changes. However, despite an increase in
electricity generated within the euro area from
nuclear and renewable sources, the overall
energy dependency (i.e. the ratio of net energy
imports – including intra-euro area imports –
to energy consumption) of euro area countries
has remained high, with two-thirds of overall
energy consumption being imported, and oil
remaining the main component of fi nal energy
consumption. High energy dependency may also
have implications for energy security. In terms
of both intensity and dependency, substantive
diversity exists across markets and countries.
Country energy markets remain largely national
or regional in nature, although their integration
has increased. Further integration, in particular
in gas and electricity markets, would not only
have benefi cial impacts on security, but could
also help to cushion idiosyncratic energy price
changes and improve overall effi ciency and
competition in European energy markets.
Looking ahead, the main factors impacting on
the future of euro area energy markets point
to a further reduction in the degree of energy
intensity making the euro area economy
less vulnerable to price changes. However,
energy dependency is expected to remain
high and energy prices may remain volatile.
Energy supply may have been adversely affected

8ECB
Occasional Paper No 113
June 2010
by the downscaling of investment during the
crisis, and tightness in the global energy market
may re-emerge as global activity growth resumes.
In recent years the increasing “fi nancialisation”
of commodity markets, combined with high
global liquidity, may have had some impact on
commodity price volatility and, in perspective,
this factor is likely to continue to play a role.
Similarly, climate change policies, particularly
those related to greenhouse gas emissions, may
also infl uence price volatility. All in all, the
outlook for energy markets and prices remains
uncertain in the long run.
The impact of energy price changes depends
not only on their driving force, but also on
their persistence and how they are absorbed
by the economy, including the monetary
policy response. The adjustment costs are to a
signifi cant extent determined by the structure
and the fl exibility of the economy. In the
short run, they cannot be easily countered
by changes in the production process and
impact on fi rms’ costs or households’ real
income, thereby affecting investment and
consumption. These effects show strong
cross-country heterogeneity linked to the
degree of energy intensity in consumption and
production. However, the transfer of income
emerging from a deterioration of terms of trade
associated with higher international energy
prices may be counteracted to some extent by
the degree to which countries benefi t from
higher demand from energy-exporting countries.
In this respect, countries that are favourably
positioned in terms of export specialisation,
historical ties and geographical proximity
are better able to compensate the moderation
in domestic demand through higher exports.
There are some indications that the overall
impact of energy fl uctuations on activity may
have moderated compared with the 1970s and
early 1980s, owing not only to decreased energy
intensity, but also to the evolution of other
factors including wage-setting institutions and
monetary policy.
In the long run, increases in the relative price
of energy may lead to substitution effects and
to a reduction in the overall energy intensity
of production and consumption. Therefore the
impacts of long-run relative price changes are
stronger the more energy intensive the economy
and the less fl exible the production process.
In addition, the losses of output and labour input
into the production process are less pronounced
if wages and prices allow for a more speedy
adjustment process.
Wage and price-setting behaviour and credibility
of monetary policy are key determinants of how
energy prices feed into infl ation over a medium-
term horizon. The pass-through of energy
prices can be broken down into direct and
indirect fi rst-round and second-round effects.
Direct fi rst-round effects refer to the impact on
consumer energy prices. The indirect fi rst-round
effect captures the impact of energy prices on
producer and distribution costs which then feeds
into consumer prices. Second-round effects arise
when energy prices impact on wages, profi t
margins and infl ation expectations. First and
second-round effects are interlinked and diffi cult
to disentangle empirically, yet conceptually
different. Monetary policy can do little about
the fi rst-round effects of energy price shocks, in
particular international oil price changes, but it
shapes second-round effects.
The direct pass-through of changes in
international oil prices to consumer prices
for liquid fuels is very quick (mainly within
two to three weeks), complete and, at the
aggregate level, there is little evidence of
substantial asymmetry. For gas prices the
pass-through takes longer, approximately six to
nine months; for electricity prices an estimate
of the pass-through is more diffi cult because
of price regulation, cost structures and market
arrangements. Owing to the full pass-through
into pre-tax prices for liquid fuels and natural
gas, as well as the important role of excise taxes
and the broad constancy of production margins
in these sectors, the elasticity (percentage
response) of consumer energy prices with respect
to crude oil prices is larger the higher the level
of crude oil prices. The level of excise taxes also
impacts on the elasticity of consumer oil prices:
9ECB
Occasional Paper No 113
June 2010
EXECUTIVE
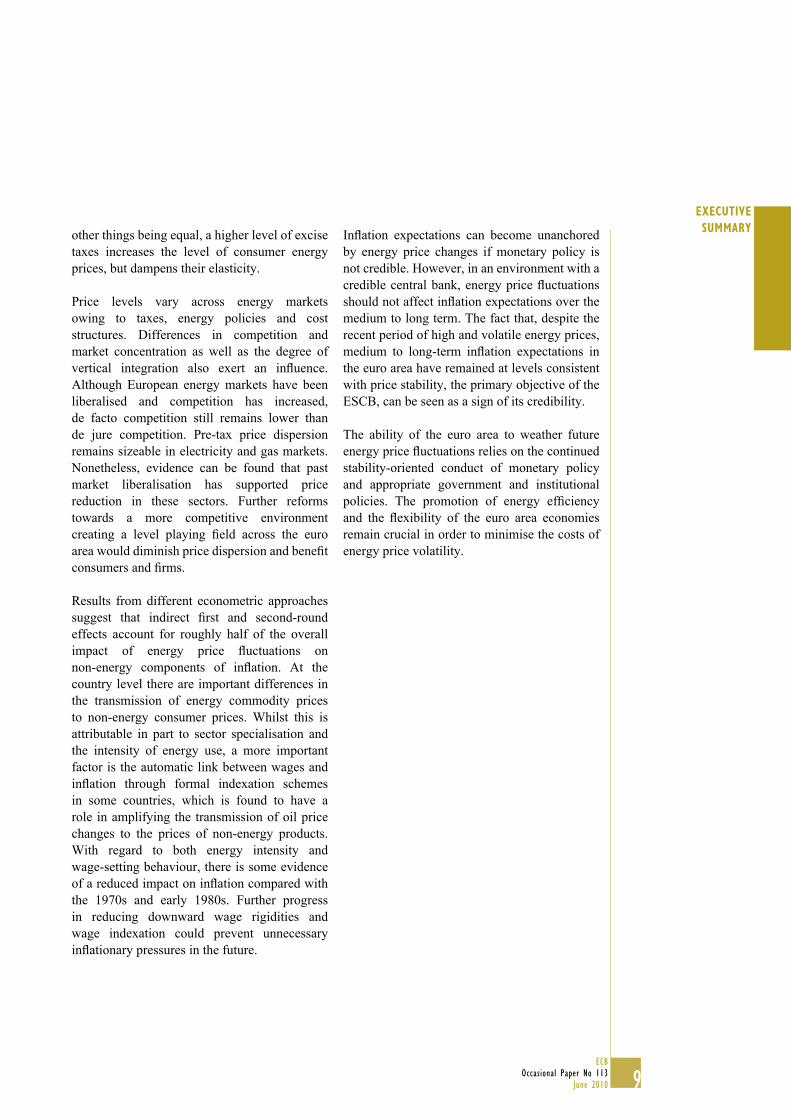
SUMMARYother things being equal, a higher level of excise
taxes increases the level of consumer energy
prices, but dampens their elasticity.
Price levels vary across energy markets
owing to taxes, energy policies and cost
structures. Differences in competition and
market concentration as well as the degree of
vertical integration also exert an infl uence.
Although European energy markets have been
liberalised and competition has increased,
de facto competition still remains lower than
de jure competition. Pre-tax price dispersion
remains sizeable in electricity and gas markets.
Nonetheless, evidence can be found that past
market liberalisation has supported price
reduction in these sectors. Further reforms
towards a more competitive environment
creating a level playing fi eld across the euro
area would diminish price dispersion and benefi t
consumers and fi rms.
Results from different econometric approaches
suggest that indirect fi rst and second-round
effects account for roughly half of the overall
impact of energy price fl uctuations on
non-energy components of infl ation. At the
country level there are important differences in
the transmission of energy commodity prices
to non-energy consumer prices. Whilst this is
attributable in part to sector specialisation and
the intensity of energy use, a more important
factor is the automatic link between wages and
infl ation through formal indexation schemes
in some countries, which is found to have a
role in amplifying the transmission of oil price
changes to the prices of non-energy products.
With regard to both energy intensity and
wage-setting behaviour, there is some evidence
of a reduced impact on infl ation compared with
the 1970s and early 1980s. Further progress
in reducing downward wage rigidities and
wage indexation could prevent unnecessary
infl ationary pressures in the future.
Infl ation expectations can become unanchored
by energy price changes if monetary policy is
not credible. However, in an environment with a
credible central bank, energy price fl uctuations
should not affect infl ation expectations over the
medium to long term. The fact that, despite the
recent period of high and volatile energy prices,
medium to long-term infl ation expectations in
the euro area have remained at levels consistent
with price stability, the primary objective of the
ESCB, can be seen as a sign of its credibility.
The ability of the euro area to weather future
energy price fl uctuations relies on the continued
stability-oriented conduct of monetary policy
and appropriate government and institutional
policies. The promotion of energy effi ciency
and the fl exibility of the euro area economies
remain crucial in order to minimise the costs of
energy price volatility.
10ECB
Occasional Paper No 113
June 2010
INTRODUCTION
This report aims to analyse euro area energy
markets and the impact of energy price changes
on the macroeconomy from a monetary
policy perspective. The core task of the
report is to analyse the impact of energy price
developments on output and consumer prices.
Nevertheless, understanding the link between
energy price fl uctuations, infl ationary pressures
and the role of monetary policy in reacting to
such pressure requires a deeper look at the
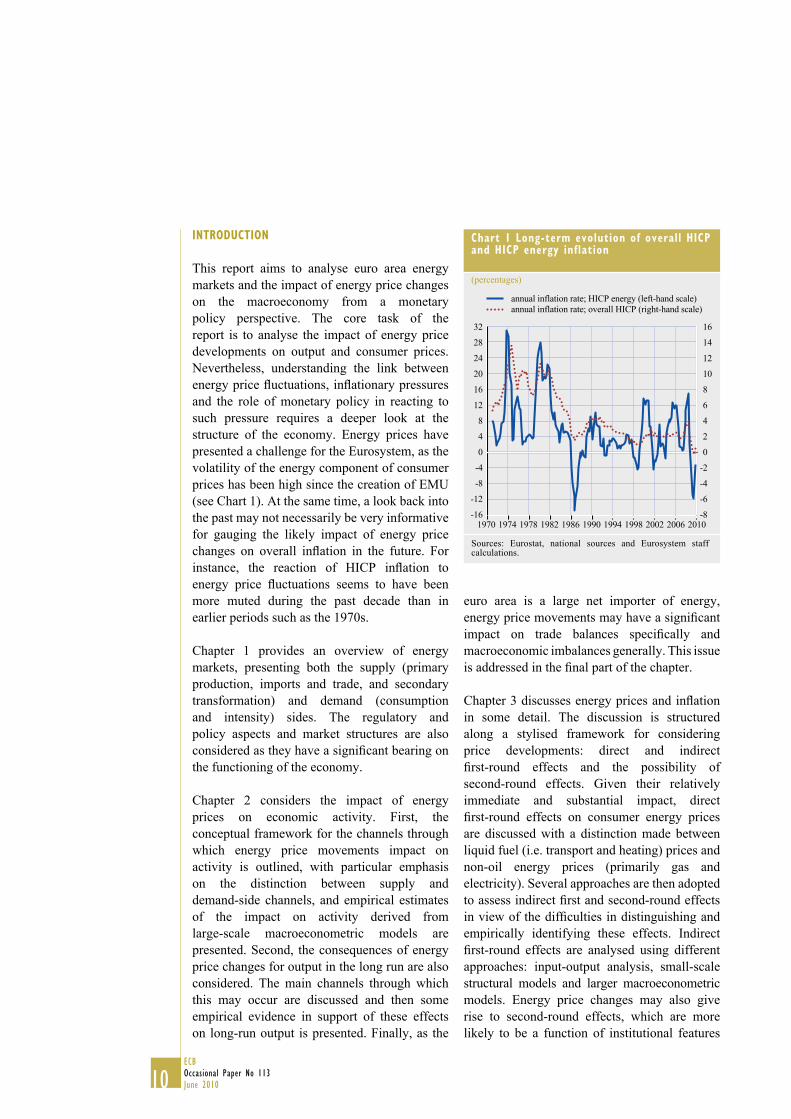
structure of the economy. Energy prices have
presented a challenge for the Eurosystem, as the
volatility of the energy component of consumer
prices has been high since the creation of EMU
(see Chart 1). At the same time, a look back into
the past may not necessarily be very informative
for gauging the likely impact of energy price
changes on overall infl ation in the future. For
instance, the reaction of HICP infl ation to
energy price fl uctuations seems to have been
more muted during the past decade than in
earlier periods such as the 1970s.
Chapter 1 provides an overview of energy
markets, presenting both the supply (primary
production, imports and trade, and secondary
transformation) and demand (consumption
and intensity) sides. The regulatory and
policy aspects and market structures are also
considered as they have a signifi cant bearing on
the functioning of the economy.
Chapter 2 considers the impact of energy
prices on economic activity. First, the
conceptual framework for the channels through
which energy price movements impact on
activity is outlined, with particular emphasis
on the distinction between supply and
demand-side channels, and empirical estimates
of the impact on activity derived from
large-scale macroeconometric models are
presented. Second, the consequences of energy
price changes for output in the long run are also
considered. The main channels through which
this may occur are discussed and then some
empirical evidence in support of these effects
on long-run output is presented. Finally, as the
euro area is a large net importer of energy,
energy price movements may have a signifi cant
impact on trade balances specifi cally and
macroeconomic imbalances generally. This issue
is addressed in the fi nal part of the chapter.
Chapter 3 discusses energy prices and infl ation
in some detail. The discussion is structured
along a stylised framework for considering
price developments: direct and indirect
fi rst-round effects and the possibility of
second-round effects. Given their relatively
immediate and substantial impact, direct
fi rst-round effects on consumer energy prices
are discussed with a distinction made between
liquid fuel (i.e. transport and heating) prices and
non-oil energy prices (primarily gas and
electricity). Several approaches are then adopted
to assess indirect fi rst and second-round effects
in view of the diffi culties in distinguishing and
empirically identifying these effects. Indirect
fi rst-round effects are analysed using different
approaches: input-output analysis, small-scale
structural models and larger macroeconometric
models. Energy price changes may also give
rise to second-round effects, which are more
likely to be a function of institutional features
Chart 1 Long-term evolution of overall HICP and HICP energy inflation
(percentages)
-16
-12
-8
-4
0
4
8
12
16
20
24
28
32
-8
-6
-4
-2
0
2
4
6
8
10
12
14
16
1970 1974 1978 1982 1986 1990 1994 1998 2002 2006 2010
annual inflation rate; HICP energy (left-hand scale)
annual inflation rate; overall HICP (right-hand scale)
Sources: Eurostat, national sources and Eurosystem staff calculations.

11ECB
Occasional Paper No 113
June 2010
INTRODUCTION
of the economy, in particular the structure of
product and labour markets, than of features of
the energy markets themselves. These effects are
mainly identifi ed using larger macroeconometric
models.
There are other highly relevant issues – such
as the international drivers of energy prices,
energy security and environmental issues –
which are not part of the core of this report.
They are nevertherless addressed in boxes,
since they clearly have repercussions on the
economic outlook for the euro area. In the same
way, the report highlights the role of infl ation
expectations in the conduct of monetary policy.

12ECB
Occasional Paper No 113
June 2010
1 OVERVIEW OF ENERGY MARKETS
This chapter provides the basis for further analysis. It describes the three main stages of euro area energy markets – primary energy extraction, fi nal energy production (in particular electricity generation) and energy consumption. In doing so, it presents evidence on the energy dependency and intensity of the production process and consumption. The main pattern and major trends in the energy mix of production and consumption provide the background to which later chapters will refer in explaining the macroeconomic impact of energy prices. Further, the chapter gives an account of energy market regulations and market structures, which are relevant for cross-country price differentials. To complete the picture on the economic policy setting, reference is also made to European energy policy focusing on energy security and climate change. Aspects of energy security and environmental impact, as well as the international drivers of energy prices are discussed in boxes.
1.1 ENERGY PRODUCTION AND DEPENDENCE
1.1.1 ENERGY PRODUCTION
Energy-related activities represented around 3%
of total euro area gross value added in 2005 (see
Chart 2) and this share has remained broadly
stable over the last 15 years. However, this broad
stability hides noteworthy composition effects.
There has been a decreasing trend in primary
energy production that was broadly compensated
by an increase in fi nal energy production.
In terms of employment, the energy sectors
accounted for over one million jobs in 2005,
corresponding to around 1% of employment in
the euro area (see Chart 3). Employment in the
energy sector has been declining both in relative
(1.3% of total employment in 1990) and in
absolute terms. Given this relatively small size,
the impact of the energy sector on the economy
derives primarily from the fact that it represents
a crucial production factor and consumption
component, rather than from its direct
contribution to value added and employment.
Chart 2 Share of energy sector in value added
(percentages)
0
1
2
3
4
5
6
7
8
0
1
2
3
4
5
6
7
8
1990 (*=1995)
2005
1 2 3 4 5 6 7 8 9 10 11 12 13 14 15 16 17
1 BE
2 DE
3 IE
4 GR
5 ES
6 FR
7 IT
8 CY*
9 LU
10 MT*
11 NL
12 AT
13 PT
14 SI*
15 SK*
17 euro area*
16 FI
Sources: EU KLEMS and Eurosystem staff calculations.
Chart 3 Share of energy sector in employment
(percentages)
0.0
0.5
1.0
1.5
2.0
2.5
3.0
3.5
0.0
0.5
1.0
1.5
2.0
2.5
3.0
3.5
1990 (*=1995)
2005
1 2 3 4 5 6 7 8 9 10 11 12 13 14 15 16 17
1 BE
2 DE
3 IE
4 GR
5 ES
6 FR
7 IT
8 CY*
9 LU
10 MT*
11 NL
12 AT
13 PT
14 SI*
15 SK*
17 euro area*
16 FI
Sources: EU KLEMS and Eurosystem staff calculations.

13ECB
Occasional Paper No 113
June 2010
I OVERVIEW
OF ENERGY
MARKETSPrimary energy production increased
substantially in the 1970s and early 1980s
and has remained fairly stable since then.
The change in the composition of primary
energy, by comparison, has been more
continuous. The share of solid fuels has declined
almost constantly, whilst natural gas and nuclear
emerged as key energy sources in the 1970s and
1980s respectively. More recently, the share of
renewable energy sources has started to grow to
more signifi cant proportions, stemming mainly
from combustible renewables and waste and,
to a lesser extent as yet, from wind and solar
energy. Before this most renewable energy was
derived from hydro sources. Nowadays, primary
energy production in the euro area comes mostly
from nuclear power, representing around 40%
of total production (see Chart 4, left panel).
The second largest primary energy product is
the category “other”, which includes renewable
primary energy production (hydroelectric,
solar, wind, geothermal, biomass) and waste.
This category represented 22% of total primary
energy production in 2007, while solid fuel
(coal and peat) and gas represented 16% and
18% respectively.
Primary energy production is very heterogeneous
across euro area countries (Chart 4, right panel).
Belgium, Germany, Spain, France, Slovenia,
Slovakia and Finland have large shares of nuclear
energy, while other countries have not adopted
this technology. Other relevant cases in terms of
energy production are associated with countries’
natural endowments, such as the Netherlands
with a sizeable production of gas and Greece
with a relevant contribution of solid fuels.
The evolution from 1990 to 2007 generally
matches the aggregate trend (see Chart A1 in
Annex 1) that solid fuels have decreased their
share in most euro area countries, while nuclear
and renewable energies increased in importance.
This pattern is especially important in Germany,
but is also visible in Belgium, Spain, France,
Slovenia and Slovakia.
Approximately 40% of the primary energy
supply, including own and imported primary
Chart 4 Share of primary energy production by fuel type
(in thousands; percentages) (shares of total – 2007; percentages)
200
250
300
350
400
450
500
1960 1968 1976 1984 1992 2000 20080
10
20
30
40
50
60
70
80
90
100
solid fuels
liquid fuels
natural gas
nuclear energy
renewables and waste
total (left-hand scale)
01 2 3 4 5 6 7 8 9 10 11 12 13 14 15 16 17
20
40
60
80
100
0
20
40
60
80
100
1 BE
2 DE
3 IE
4 GR
5 ES
6 FR
7 IT
8 CY
9 LU
10 MT
11 NL
12 AT
13 PT
14 SI
15 SK
17 euro area
16 FI
solid fuels
oil
gas
nuclear energy
other
Sources: Eurostat, IEA and Eurosystem staff calculations.

14ECB
Occasional Paper No 113
June 2010
energy, is used to generate electricity, which is a
key step in the transformation of primary energy
for fi nal consumption. Total electricity generated
in the euro area has grown by an average of
2.2% per annum from 1,630 TWh in 1990
to 2,319 TWh in 2007 (see Chart 5). This rate of
growth is broadly in line with average euro area
GDP growth over the same period. As electricity
is not easily stored supply must match demand
in real time or else the stability of the system
may be compromised. The average annual rate
of growth in electricity generated was lowest
in Germany and Slovakia at 0.9% per annum.
Ireland, Spain, Cyprus, Luxembourg and Malta
all had annual growth rates in excess of 4% per
annum – see Table A1 in Annex 1.
In 2007 the largest single source of energy for
electricity generation was nuclear fuel,
accounting for 31% at the aggregate euro area
level. All the so-called conventional thermal
power plants grouped together accounted for
52%. Among the conventional thermal power
plants, natural gas had the most weight, at 22%.1
Coal and lignite accounted for 15% and 10%
respectively. Hydropower plants and wind
turbines represented 10% and 4%. The share of
the latter has been increasing rapidly as has that
of biomass. Oil was used relatively sparingly
with a weight of 4%.2
In terms of trends since 1990, a number of
features are noteworthy. First, although nuclear
fuel remains the largest single source of input
fuel, its share has declined from a peak of 38%
in the early 1990s to 31% in 2007. Second, the
overall constancy of the share of non-renewable
conventional thermal power plants – around
50% – masks considerable shifts in the relative
share of different types of conventional fuels,
with an increase in natural gas and declines in
coal and oil.3 Third, the share of renewables
in electricity generation has increased from
around 15% in the early 1990s to 20% currently.
Electricity generated from renewable sources
has risen by an average of 4.4% per annum since
1990. The increasing importance of renewable
energy in electricity generation (which has
occurred notwithstanding some decline in the
share of hydropower) is mainly attributable to
substantial growth in recent years in the use of
sources such as biomass and wind turbines –
these have increased by 15% and 25% per
annum respectively over the last fi ve years.
The three countries with the most diversifi ed
portfolio of fuel types used in electricity
The preference for gas-fuelled power stations is motivated by 1
several factors. Gas power plants are more effi cient and can be
used to satisfy both intermediate and peak load demand; natural
gas combustion is also less carbon intensive. Gas-fi red power
stations provide the marginal supply of electricity.
Remaining fuel types (geothermal, derived gas, miscellaneous, 2
photovoltaic, solar, municipal solid waste, wood, biogas and
industrial waste) only had marginal shares in terms of overall
electricity generation.
Natural gas has almost tripled its share from 8% in 1990 to 3
22% in 2007. This development has occured in most euro area
countries. The share of coal has decreased from around 20% in
1990 to 15% in 2007, whilst that of lignite has remained broadly
constant at around 10%. In terms of climate change, lignite
and coal, in particular the former, result in signifi cantly higher
carbon emissions relative to, for example, natural gas. The fall
of the oil share from around 10% in the early 1990s to 4% has
been driven primarily by Italy, which reduced the share of oil
in electricity generation from around 50% in the early 1990s to
around 10% in 2007.
Chart 5 Evolution of electricity generated in euro area by fuel type
(TWh)
0
500
1,000
1,500
2,000
2,500
0
500
1,000
1,500
2,000
2,500
1990 1992 1994 1996 1998 2000 2002 2004 2006
renewables
nuclear
“fossil”
Sources: Eurostat and Eurosystem staff calculations.Notes: Renewables comprises hydropower, geothermal, biomass, wind turbines, photovoltaic, solar thermal, municipal solid waste, wood, biogas and industrial waste. “Fossil” denotes non-renewable conventional thermal and comprises coal, lignite, oil, gas and other thermal stations.

15ECB
Occasional Paper No 113
June 2010
I OVERVIEW
OF ENERGY
MARKETSgeneration were Germany, Spain and Finland
(see Table A1 in Annex 1 for an overview of key
individual country electricity characteristics).
Unsurprisingly, small countries tended to have
relatively undiversifi ed electricity generating
systems. Among the larger countries, France
is a notable exception as it derives the largest
share of its electricity from nuclear fuel.
Another key feature of electricity markets is the
relatively small amount of trade in comparison
with other more storable fuel types such as oil,
gas and coal. A progressive increase of trading
volumes since the 1970s has been a feature of
European economic integration. According to
fi gures from the Union for the Coordination of
Transmission of Electricity (UCTE), which
covered most of the euro area market, the
volume of electricity exchanged in the euro area
as a percentage of total electricity consumption
increased relatively steadily from 6% in 1975
(8% in 1985 and 10% in 1995) to 14% in 2007.4
In the euro area as a whole gross trade fl ows
(i.e. imports and exports) of electricity as a
percentage of domestic generation have even
increased progressively from 14% in 1990 to
19% in 2007. Net trade fl ows, on aggregate,
are close to balance at 1% of total domestic
electricity generation. This is also the case
across most countries with some exceptions.
France, and until recently Slovenia, have been
net exporters of electricity, whilst four countries,
namely Italy (16% of domestic generation on
average), Luxembourg (293%), the Netherlands
(16%) and Finland (13%) have been net
importers of electricity. Cross-border electricity
fl ows may run in both directions (i.e. a country
may be both an importer and exporter of
electricity depending on its situation at a given
point in time). Despite larger fl ows of electricity
within the EU, the overall volume remains
relatively small and most electricity markets are
still essentially “national”, partly owing to
remaining interconnection bottlenecks (see
European Commission 2007). This limits the
competitive pressure which can be exerted on
national electricity prices through international
fl ows and constrains the smoothing of electricity
supply in the euro area.
1.1.2 ENERGY DEPENDENCE
Europe’s primary energy production sector is
largely “undersized” compared with the amount
of energy required for fi nal consumption,
mainly owing to endowment reasons. Energy
dependence, defi ned as net imports – including
intra-euro area trade – as a percentage of total
gross inland consumption, of euro area countries
was 66.5% on average in 2007 (see Chart 6a).
This share is substantially above the energy
dependency observed for more fossil-energy-
rich countries, like the United States and the
United Kingdom, but below that of Japan.
Energy dependence is higher in the case of small
countries like Ireland, Cyprus, Luxembourg,
Malta and Portugal, but also Italy, with fi gures
above 80% (see Chart 6c). The Netherlands is the
euro area country least dependent on imported
energy, showing an energy dependency lower
than 40%.
Historically Europe was divided into fi ve regional networks 4
of electricity transmission system operators (TSOs). However,
on 1 July 2009 the European Network of Transmission System
Operators for Electricity (ENTSO-E) became operative merging
these regional associations.
Chart 6a Energy dependence – international comparison
(net imports as percentage of gross inland consumption)
-40
-20
0
20
40
60
80
100
120
-40
-20
0
20
40
60
80
100
120
euro area
Japan
United Kingdom
United States
1960 1968 1976 1984 1992 2000 2008
Sources: Eurostat, IEA and Eurosystem staff calculations.

16ECB
Occasional Paper No 113
June 2010
Overall energy dependency has remained
broadly unchanged, fl uctuating around a rate
of 60% since the early 1970s. However, these
aggregate data hide differences across products
and time (see Chart 6b). Dependence has always
been high for crude oil products. Whilst it was
low for solid fuel in the 1960s, it has increased
steadily over time owing mainly to declining
production. Dependence has also been steadily
increasing since the 1970s for natural gas,
mainly as the result of increased demand owing
to the move away from solid fuel power plants
and increased residential use, and now stands at
around 70%. Energy dependence by type of fuel
product hinges primarily on two key aspects.
First, countries’ endowments determine net
imports. Second, energy imports depend on the
technological choices related to the production
of fi nal energy for consumption, notably on
the production of electricity. The Netherlands
is the only euro area country with a negative
dependence (net exporter), which is located
in the gas segment and is associated with the
endowment of this natural resource.
Chart 6b Energy dependence – development in euro area by fuel type
(net imports as percentage of gross inland consumption)
0
20
40
60
80
100
120
0
20
40
60
80
100
120
euro area − overall
euro area − crude oil
euro area − gas
euro area − solid fuel
1960 1968 1976 1984 1992 2000 2008
Sources: Eurostat, IEA and Eurosystem staff calculations.
Chart 6c Euro area energy dependence by fuel type
(net imports as percentage of gross inland consumption; 2007)
-75
-50
-25
0
25
50
75
100
125
-75
-50
-25
0
25
50
75
100
125
solid fuel
oil
gas
overall
1 2 3 4 5 6 7 8 9 10 11 12 13 14 15 16 17
1 BE
2 DE
3 IE
4 GR
5 ES
6 FR
7 IT
8 CY
9 LU
10 MT
11 NL
12 AT
13 PT
14 SI
15 SK
17 euro area
16 FI
Sources: Eurostat, IEA and Eurosystem staff calculations.
Box 1
DRIVERS OF INTERNATIONAL OIL PRICE DEVELOPMENTS
The prices of energy commodities, particularly oil, have risen sharply over the past decade,
bringing oil and gas prices to new historical highs (both in nominal and real terms) in the
summer of 2008 (see Chart A). This rise was unprecedented over the course of the previous
40 years, both in terms of magnitude and duration. Real oil prices are also high by historical
standards, although still below the real price levels recorded from the mid-1970s to the mid-
1980s. The energy (and more general commodity) price boom came to an end in the second

17ECB
Occasional Paper No 113
June 2010
I OVERVIEW
OF ENERGY
MARKETShalf of 2008, and the subsequent price fall was
exacerbated by the onset of the fi nancial crisis
and the sharp decline in economic activity.
The decline in prices was sharp and fast, but
more recently prices have started to rebound.
In this box, we analyse the main drivers of
international oil price developments over the
last number of years, and try to assess their
potential impact on future developments.
Natural gas prices are closely linked to oil
prices, both because of indexation in long-term
contracts and competition between different
energy sources in power generation and
end-user markets. However, given that only a
relatively small share of natural gas is traded
on global markets, regional differences and
discrepancies can originate and persist. This
makes prices more sensitive to local factors
and disruptions.1
Causes and consequences of the oil price shocks of the 1970s
To understand the determinants and prospects of energy markets, we start by looking at the
background against which past oil price shocks took place. During the 1960s, the spare capacity
in the United States, which had to date been the marginal producer of oil, began to erode owing
to economic growth and the increasing demand for automobile fuels. Parallel to that, OPEC
started to test its newly acquired market power: the oil price shocks of 1973 and 1979 were
associated with signifi cant reductions in OPEC’s supply and operable capacity.
Higher prices had an impact on both supply and demand. Following the second oil
price shock, global demand declined markedly, especially in OECD countries, where
several measures were undertaken to reduce dependence on oil. At the same time, higher
prices generated incentives to increase supply, also by enhancing the viability of some
fi elds previously considered unprofi table. Capacity was expanded with new fi elds being
developed in several non-OPEC countries. The steady growth of non-OPEC supply, from
25 mb/d in 1973 to 38 mb/d in the late 1980s, eventually offset OPEC’s output cuts.
This weakened OPEC’s control on the marginal supply, and created greater incentives for the
cartel members to exceed the agreed quotas. Against this background, prices progressively
declined (Kaufmann et al. 2008).
More recent developments in oil demand and supply
After more than a decade of persistently low levels, from 1999, oil prices became substantially
more volatile and surged with increasing momentum between 2004 and mid-2008, rising by
1 See Section 3.2.2 for a short discussion of differences between the euro area and the United States.
Chart A Nominal and real oil and gas prices
(USD per barrel)
01970 1975 1980 1985 1990 1995 2000 2005
20
40
60
80
100
120
140
160
-4
-2
0
2
4
6
8
10
12
oil nominal (left-hand scale)
oil real (left-hand scale)
gas nominal (right-hand scale)
gas real (right-hand scale)
Sources: Energy Information Administration, IMF.Note: Real prices are expressed in 2005 USD. Last observation refers to June 2009.

18ECB
Occasional Paper No 113
June 2010
almost 400% in nominal USD terms. This hike in crude oil prices was triggered by increasing
demand from non-OECD emerging economies, particularly China and the Middle East
(see Chart B) (Hamilton 2008, Kilian 2009). Initially, both the failure of oil producers to anticipate
the fast growth of the emerging economies and the low levels of exploration investment owing
to low crude oil prices in the 1990s caused supply to lag behind growing demand. One indication
of increasing diffi culties was skyrocketing exploration costs. In turn, future supply prospects
increasingly became a matter of concern, as global crude oil production stagnated (see Chart C).
Given the fact that scope for increased non-OPEC production was constrained because of
geological restrictions especially in the more mature fi elds (e.g. in the North Sea and Mexico),
the only hope for meeting increasing demand was the oil production by OPEC countries. The low
level of spare capacity in OPEC countries added to market tightness and generated concerns that,
in the event of political instability and disruptions in some regions, the cartel would be unable to
match world oil demand (Hamilton 2008).
The oil price boom was disrupted by the slowing in economic growth during the fi rst half
of 2008. The fall in oil prices was exacerbated by the onset of the fi nancial crisis and the
subsequent very sharp decline in economic activity from the third quarter of 2008 onwards,
which also led demand to decline in emerging economies. The downward price adjustment was
particularly sharp and fast, with prices falling to around USD 37 per barrel in late December.
Since the beginning of 2009, however, as less pessimistic sentiments pervaded markets, prices
rebounded and stood at around USD 75 per barrel at the end of 2009, i.e. the same levels as
mid-October 2008. OPEC responded swiftly to the slowdown in global oil demand by announcing
a reduction in production quotas by a total of 4.2 mb/d, and member countries showed a
compliance rate well above historical averages. OPEC is now experiencing a revival of some of
its market power, as announced production cuts have now again been at least partly effective.
Chart C Global oil supply by producer
(millions of barrels per day)
101986 1990 1994 1998 2002 2006
20
30
40
50
60
10
20
30
40
50
60
OPEC
non-OPEC
Source: IEA.
Chart B Global oil demand changes by region
(year-on-year percentage changes)
-6
-4
-2
0
2
4
6
8
-6
-4
-2
0
2
4
6
8
OECD
non-OECD
total
1987 1990 1993 1996 1999 2002 2005 2008
Source: IEA.

19ECB
Occasional Paper No 113
June 2010
I OVERVIEW
OF ENERGY
MARKETSGlobal liquidity and the fi nancialisation of the oil market
The speed and size of the recent movements in prices have led many to argue that there has been
a disconnect between market prices and those warranted by fundamentals and to discuss the
potential role of other factors in driving price movements. Some evidence points to the impact
of exchange rate fl uctuations – in particular the USD/euro exchange rate – on crude oil prices
(Breitenfellner and Crespo Cuaresma 2008). While it appears that oil prices and the USD rate
have become increasingly correlated over the last decade, this correlation does not seem to be
stable across a longer span of time.
Theoretical results by Frankel (2006) suggest that interest rates play a role in determining
commodity prices. Based on this, there has been wide discussion on whether the accommodative
monetary policy stance deployed at the global level has somehow fuelled the oil price increases,
either via incentives for producers to postpone extraction, or via portfolio shifts into commodity
markets.
There is strong evidence of a sharp increase in the “fi nancialisation” of commodity markets,
particularly those for oil, during the last number of years: the volume of crude oil derivatives
traded on NYMEX (New York Mercantile Exchange) quintupled between 2000 and 2008.
Nevertheless, it is hard to fi nd clear-cut evidence that fi nancial activity can exert an impact on
physical oil prices, at least in the short term. It could also be argued that “speculation” speeds
up the price discovery mechanism in the market place and the response to changes in market
fundamentals. However, it is very diffi cult to measure its direct impact on prices owing to the
intrinsic diffi culties in clearly defi ning and identifying “speculators”. Empirical studies have
so far been unable to fi nd robust evidence of systemic causality between investment positions
held by non-commercial agents in oil futures markets and spot prices as well as their volatility
(Commodity Futures Trading Commission 2008; Haigh et al. 2005; International Monetary Fund
2006). Other studies examining the co-movement between future and spot prices or between
fi nancial market and oil market indicators do suggest that some overshooting of oil prices above
their fundamentally justifi ed equilibrium level took place at least temporarily (Khan 2009, Miller
and Ratti 2009, and Kaufmann and Ullman 2009). On the other hand, it is also important to keep
in mind that, as documented by the literature, oil demand and supply are not very sensitive to
prices, especially in the short term. This implies that relatively small changes in fundamentals
can exert a large impact on prices.2
In any event, it is crucial that market participants can operate on the basis of reliable data in
order to avoid undue uncertainty and thereby contain price volatility. Accordingly, it is important
to foster the compilation of appropriate supply, demand and, particularly, stock and inventory
statistics.
Medium and long-term prospects of energy markets
Looking ahead, in the medium term the supply and demand balance may turn out to be
tighter. As soon as the world economy recovers, oil demand is expected to start increasing
vigorously again in emerging economies. The IEA estimates that by 2014 up to 4 mb/d of
crude oil could be needed to match growing demand (International Energy Agency 2009a).
2 It has indeed been argued that the extent of the recent price gyrations is compatible with elasticities estimated in the literature
(International Energy Agency 2009a).

20ECB
Occasional Paper No 113
June 2010
1.2 ENERGY CONSUMPTION AND INTENSITY
1.2.1 CONSUMPTION PATTERNS
Energy consumption may be viewed in two
main ways: either in “gross” terms (i.e. the
combination of domestic primary production
and net imports) or in “fi nal” terms (i.e. after
the transformation of primary energy sources
into usable forms of energy). A key difference
between gross and fi nal consumption is the
transformation of primary energy sources
(nuclear, gas, solid fuels and oil) into electricity.
Both measures have their uses: the “gross”
measure is useful for understanding the
However, supply prospects have also been affected by the economic downturn, with investment
in upstream capacity and maintenance declining by almost 20% in 2009 (International Energy
Agency 2009b). As a consequence, around 2 mb/d of new capacity is estimated to have been
deferred since the inception of the crisis, and a further 4 mb/d may suffer delays of 18 months
or more. Overall, capacity is expected to grow by around 4 mb/d by 2014. All this increase is
projected to come from OPEC member countries, Saudi Arabia in particular. Hence, OPEC’s
production capability and policy are likely to be decisive in shaping future prices (Nakov and
Pescatori 2009). Saudi Arabia, despite representing only 12% of the total oil production, is the
only country with signifi cant spare capacity and hence has a crucial role as marginal supplier, so
its decisions can exert a signifi cant impact on prices (Nakov and Nuño 2009).
In the longer term, regardless of OPEC’s economic willingness to expand capacity, its physical
ability to do so depends on the resource base: should global oil production peak, no production
expansion will be possible, regardless of price.3 There is considerable uncertainty surrounding
the amount of oil left in the ground. The IEA and the US Energy Information Administration do
not envisage a peak in oil production until 2030, provided that the decline in currently producing
fi elds will be offset by new fi elds going on stream and those yet to be discovered.4 However,
even taking this into account, additional non-conventional sources will be required to match
growing demand. Indeed, the IEA estimates the use of unconventional oil sources to increase
four-fold by 2030, reaching 7.4 mb/d (International Energy Agency 2009b).
Besides oil sources that could be recovered at higher costs (e.g. using Enhanced Oil Recovery
techniques, or located in deep water and in Arctic zones), there are plenty of unconventional
oil sources.5 Among these, the geological resource base for heavy oil such as tar sands and oil
shale is quite considerable.6 However, even if estimated costs of production for tar sands are
comparable with current prices, they are subject to wide uncertainty, as it takes considerable
amounts of energy to recover alternative fuels and the energy return is considerably smaller than
for oil. Similar considerations apply to oil shale, with costs even higher and more uncertain.
Apart from environmental considerations, these new extraction technologies are highly capital
intensive, with long lead times of up to ten to 15 years. Finally, the uncertainty stemming
from the high volatility observed in oil prices in recent years and the increased risk aversion
in fi nancial markets may also have served to discourage or postpone investment in this sector,
although higher prices should stimulate to some extent investment in supply.
3 The case of the US mainland supply well illustrates this point: production has been steadily declining in the last 40 years despite
increasing prices.
4 There is however widespread debate among energy economists and geologists about the peak in oil production. Kaufmann and Shiers
(2008), for example, examine several possible scenarios, and place the oil peak somewhere between 2009 and 2031.
5 Here the focus is only on alternative fuels that can be used in the transportation sector, which according to the current technology have
to be in liquid form. Renewable resources such as biofuels should also be mentioned, but it is unlikely that they could replace oil:
converting the whole US corn crop into fuel would satisfy only 12% of demand for fuels.
6 Tar sands represent a form of heavy oil which is present in Canada and Venezuela. Similarly, oil shale is a type of rock containing oil,
a large resource base is available in the United States.

21ECB
Occasional Paper No 113
June 2010
I OVERVIEW
OF ENERGY
MARKETS
potential impact of raw energy commodity
prices whilst the “fi nal” measure is useful for
understanding their impact via consumption
patterns. Charts 7a and 7b respectively show
the evolution and breakdown of gross and fi nal
inland consumption of energy. Having increased
strongly between 1960 and 1973 at an annual
rate close to 10%, growth in overall energy consumption has since trended upward at an
average rate of around 1% per annum. However,
within overall energy consumption there have
been a number of signifi cant developments.
One of the major trends in the composition of
fi nal energy consumption has been the growing
share of natural gas and electricity, largely at the
expense of natural coal and peat. The share of
oil strongly increased until the end of the 1970s
but then stabilised. Currently, oil products are
the most important component of fi nal energy
consumption in the euro area, representing 44%
of the total. Gas products are the second largest
product of fi nal energy consumption (23%),
a share slightly higher than that of electricity
(22%). Taking a longer-term perspective, the
major trends are the growing shares of natural
Chart 7a Gross inland consumption by fuel
(toe / percentages)
300,000
400,000
500,000
600,000
700,000
800,000
900,000
1,000,000
1,100,000
1,200,000
1,300,000
1960 1966 1972 1978 1984 1990 1996 20020
10
20
30
40
50
60
70
80
90
100
renewables and waste
nuclear energy
natural gas
liquid fuels
solid fuels
total (left-hand scale)
Sources: Eurostat, IEA and Eurosystem staff calculations.
Chart 7b Final energy consumption by fuel
(toe / percentages)
200,000
250,000
300,000
350,000
400,000
450,000
500,000
550,000
600,000
650,000
700,000
750,000
800,000
850,000
900,000
0
10
20
30
40
50
60
70
80
90
100
renewables and wasteheatelectricity
natural gas
liquid fuelssolid fuelstotal (left-hand scale)
1960 1966 1972 1978 1984 1990 1996 2002
Sources: Eurostat, IEA and Eurosystem staff calculations.
Chart 7c Final inland consumption
(shares of total – 2007; percentages)
0
20
40
60
80
100
0
20
40
60
80
100
1 2 3 4 5 6 7 8 9 10 11 12 13 14 15 16 17
1 BE
2 DE
3 IE
4 GR
5 ES
6 FR
7 IT
8 CY
9 LU
10 MT
11 NL
12 AT
13 PT
14 SI
15 SK
17 euro area
16 FI
solid fuels
oil
gas
heat
electricity
other
Sources: Eurostat and Eurosystem staff calculations.

22ECB
Occasional Paper No 113
June 2010
gas and electricity. In almost all countries, oil,
gas and electricity account for more than 80%
of energy consumption (see Chart 7c)
It is also informative to analyse fi nal energy consumption according to the sector where it is
consumed. Compared with 1960, the transport
and services sectors have gained most in terms
of consumption, while industry has shown
some decline. Chart 8a reveals that in 2007 the
transport sector was the largest consumer of
energy in the euro area with a share of 33%,
followed by industry (28%) and households
(23%). Road transport, representing more than
80% of total transport-related consumption,
is by far the largest component within this
sector, followed by air transport with a share
of around 14%. Although detailed data are
lacking, approximately 50% of road transport
is accounted for by passenger cars with the
remainder accounted for by commercial transport.
The profi le of fuel consumption across these two
categories is very different. Approximately one-
third of passenger cars are diesel powered, with
most of the remainder petrol powered. On the
other hand, the commercial transport sector is
almost completely diesel powered. The current
sector distribution is broadly similar across
euro area countries. Nevertheless, the shares
of industry consumption are relatively larger in
Belgium, Slovakia and Finland, and relatively
smaller in Ireland, Greece, Cyprus, Luxembourg
and Malta (see Chart 8b).
An alternative perspective from which to analyse
fi nal energy consumption in the euro area is the
energy profi le of household and industry sectors.
Regarding households, the energy basket is
relatively diversifi ed, with substantial
heterogeneity between euro area countries
(see Chart 9). Gas represented around 40% of
households’ energy consumption in the euro
area in 2007, but as much as 72% in the
Netherlands, 57% in Italy and just 0.7%, 3.3%
Chart 8a Energy consumption by sector
(toe / percentages)
200,000
250,000
300,000
350,000
400,000
450,000
500,000
550,000
600,000
650,000
700,000
750,000
800,000
850,000
900,000
0
10
20
30
40
50
60
70
80
90
100
residential
industry
transport
commerce/public services
agriculture/fishing
other (including non energy)
total (left-hand scale)
1960 1966 1972 1978 1984 1990 1996 2002
Sources: IEA and Eurosystem staff calculations.
Chart 8b Energy consumption by sector
(shares of total – 2007; percentages)
0
20
40
60
80
100
0
20
40
60
80
100
industry
transport
households
agriculture
services
other sectors
1 2 3 4 5 6 7 8 9 10 11 12 13 14 15 16 17
1 BE
2 DE
3 IE
4 GR
5 ES
6 FR
7 IT
8 CY
9 LU
10 MT
11 NL
12 AT
13 PT
14 SI
15 SK
17 euro area
16 FI
Sources: Eurostat and Eurosystem staff calculations.

23ECB
Occasional Paper No 113
June 2010
I OVERVIEW
OF ENERGY
MARKETSand 6.8% in Finland, Greece and Portugal
respectively. Electricity occupied second
position in the euro area households’ energy
basket (25%), followed by oil products (20%).5
As for the energy profi le of the industry sector,
Chart 10 reveals that gas and electricity also
play the leading roles, with shares in the euro
area of 33% and 32% respectively. The shares of
solid fuels and oil as suppliers of energy to the
euro area industry sector decreased in the period
1990-2007 (see Chart A5 in Annex 1). The main
differences between the energy consumption
profi les of households and industry are the
higher weight of oil and gas for the former and
a higher weight of electricity and solid fuels for
the latter.
1.2.2 ENERGY INTENSITY
Energy intensity is a useful concept in the
analysis of countries’ energy developments, as
it links energy consumption to activity and is
a proxy measure for the effi ciency with which
energy resources in the economy are used.
It should be borne in mind that many factors
may impact on energy intensity including
living standards, economic structure, climatic
conditions, the age of the housing and capital
stocks, population density and transport
infrastructure. Not all of these are necessarily
linked to energy effi ciency per se.
After increasing in the 1960s and early 1970s,
energy intensity in the euro area has been on
a steadily declining path ever since, owing to
sector developments but also probably to the
occurrence of oil shocks and the progressive
adoption of energy-saving technologies.
At present, relative to other industrialised
economies, the euro area shows a lower energy
intensity than the United States, but higher
than that of Japan and the United Kingdom
(see Chart 11). Whilst the broad pattern of
euro area energy intensity is evident in other
economies, some convergence in energy
intensity has occurred over time in these
In terms of evolution, from 1990 to 2007 the consumption of 5
gas has gained share in most countries, while oil decreased its
relevance in the energy mix (see Chart A9 in Annex 1).
Chart 9 Household energy consumption
(shares of total – 2007; percentages)
0
20
40
60
80
100
0
20
40
60
80
100
solid fuels
oil
gas
heat
electricity
other
1 2 3 4 5 6 7 8 9 10 11 12 13 14 15 16 17
1 BE
2 DE
3 IE
4 GR
5 ES
6 FR
7 IT
8 CY
9 LU
10 MT
11 NL
12 AT
13 PT
14 SI
15 SK
17 euro area
16 FI
Sources: Eurostat and Eurosystem staff calculations.
Chart 10 Industry energy consumption
(shares of total – 2007; percentages)
0
20
40
60
80
100
0
20
40
60
80
100
solid fuels
oil
gas
heat
electricity
other
1 2 3 4 5 6 7 8 9 10 11 12 13 14 15 16 17
1 BE
2 DE
3 IE
4 GR
5 ES
6 FR
7 IT
8 CY
9 LU
10 MT
11 NL
12 AT
13 PT
14 SI
15 SK
17 euro area
16 FI
Sources: Eurostat and Eurosystem staff calculations.

24ECB
Occasional Paper No 113
June 2010
industrialised countries. In the 1960s the levels
of energy intensity were much higher in the
United States than in the euro area and Japan.
The reduction of energy intensity was much
stronger in the United States than in the euro
area, while Japan stabilised in the last decades.
The overall evolution in energy intensity
arises from the improvements recorded in each
sector of activity, together with the change of
share of the different sectors in total economy.
Chart 12 describes the evolution of the ratio
between the indices of energy consumption in
total economy, industry and services and the
respective indices of gross value added in the
euro area since 1990. This fi gure shows that the
improvement in energy effi ciency is common to
industry and services. However, as the degree
of energy intensity in services is lower than in
industry, the increase in the share of services
gives rise to a stronger reduction in overall
energy intensity.
Virtually all euro area countries stabilised or
reduced energy intensity from 1990 to 2007
(see Chart 13). Euro area energy intensity
declined notwithstanding an increase in gross
inland energy consumption of about 12%,
as overall activity (GDP) grew by around 66%.
While gas intensity remained broadly constant
over time, that of solid fuels and oil declined.
In summary, after increasing substantially in the
1960s, overall economy energy intensity in the
euro area has been on a declining trend since the
early 1970s. This should reduce the vulnerability
of the euro area economy to energy price
fl uctuations. There are two additional trends
in this direction. First, the share of industry in
fi nal energy consumption and industrial energy
intensity has fallen. Energy price fl uctuation
should therefore affect industrial production
less than in the past. Second, the energy mix has
become more diversifi ed with the rise of nuclear
power and renewables, although this has to be
Chart 12 Energy intensity by sector
(1990 = 100)
75
80
85
90
95
100
105
75
80
85
90
95
100
105
1990 1992 1994 1996 1998 2000 2002 2004 2006
euro area total
euro area industry
euro area services
Sources: Eurostat, IEA, European Commission (AMECO) and Eurosystem staff calculations.Note: The defi nition of the services sector in the energy statistics (used to calculate the numerator – energy consumption) is not completely aligned with that in the national account statistics (used to calculate the denominator – total output).
Chart 11 Energy intensity (1960-2007)
(toe / thousand 2000 USD)
0.00
0.05
0.10
0.15
0.20
0.25
0.30
0.35
0.40
0.45
0.50
0.00
0.05
0.10
0.15
0.20
0.25
0.30
0.35
0.40
0.45
0.50
Japan
United States
euro area
United Kingdom
1960 1966 1972 1978 1984 1990 1996 2002
Sources: Eurostat, IEA, European Commission (AMECO) and Eurosystem staff calculations.Note: The defi nition of the services sector in the energy statistics (used to calculate the numerator – energy consumption) is not completely aligned with that in the national account statistics (used to calculate the denominator – total output).

25ECB
Occasional Paper No 113
June 2010
I OVERVIEW
OF ENERGY
MARKETS
seen against the background of an increase in
total consumption of fossil fuels (particularly
natural gas) and high dependency rates.
1.3 ENERGY MARKET STRUCTURE
AND REGULATION
The degree of competition in energy markets
determines their functioning in several respects.
It affects the margins available to entrepreneurs
and therefore incentives to invest, which in turn
determine the capacity to innovate and attain
higher productivity. The degree of competition
also affects the need to react to price signals, as
highly regulated and non-competitive markets
tend to allow for larger margins and induce
frictions in the reaction of prices to changes
in input costs. In turn, the deregulation of
markets allowing consumers greater choice
and an appropriate return on investment tends
to have benefi cial effects on productivity as
well as consumer and producer prices. Market
competition increases investment incentives,
since companies must ensure service quality and
face a stronger pressure to increase productivity
to lower prices.
Implementing the appropriate degree of
deregulation may be more challenging in energy
sectors than in other industries since some
elements of the production process may justify
regulation or lead to centralised market
structures. First, the energy sector is more
capital intensive than many other industries,
requiring long-term investments (project
lifetimes can be as long as 20 and 45 years) and
substantial fi nancial commitments.6 The extent
and long-term nature of the fi nancial resources
and specifi city of energy infrastructures can lead
to bottlenecks if highly volatile prices or low
margins undermine investment incentives.
Second, whilst oil is relatively easily transported
and stored, natural gas and electricity have more
limited storage and distribution possibilities.7
Gas and electricity supply are therefore
characterised by the predominant role of
network infrastructures, confi guring a market
structure where the transmission of the energy
service by a single fi rm can under some
circumstances minimise costs and therefore
create “natural monopolies”. Finally, vertical
integration implies certain advantages in the
energy industries. It limits the technical
problems that can arise along the different stages
of the production chain (e.g. in the electricity
sector, where a continuous balance between
demand and supply is vital and where the energy
source is not storable). Vertical integration also
facilitates long-term commitments towards third
parties (e.g. the long-term take-or-pay contracts
signed with natural gas producers), and helps to
avoid “double marginalisation”, whereby every
stage requires an adequate margin.
According to IEA estimates, in 2000, investments in energy 6
infrastructures amounted to USD 413 billion, about 1.3% of
world GDP, with the power sector registering the highest ratio of
capital investment to unit of value added (IEA 2003).
Whilst liquefi ed gas can be transported, the process of 7
liquefaction and re-gasifi cation is costly in terms of energy
losses and the required infrastructures. According to the Energy
Information Administration (EIA 2003), the construction
of a liquefaction plant could cost USD 1.5 to 2.0 billion;
a re-gasifi cation terminal costs around USD 300 million.
Chart 13 Energy intensity
(toe/thousand 2,000 euro)
0.00
0.05
0.10
0.15
0.20
0.25
0.30
0.35
0.40
0.00
0.05
0.10
0.15
0.20
0.25
0.30
0.35
0.40
1990
2007
1 2 3 4 5 6 7 8 9 10 11 12 13 14 15 16 17
1 BE
2 DE
3 IE
4 GR
5 ES
6 FR
7 IT
8 CY
9 LU
10 MT
11 NL
12 AT
13 PT
14 SI
15 SK
17 euro area
16 FI
Sources: Eurostat, IEA and Eurosystem staff calculations.Notes: Data for the earlier time period for Malta refer to 1991 and for Slovakia to 1992. The data for Slovakia have been truncated for graphical purposes. The values are 1.16 for 1992 and 0.54 for 2007.

26ECB
Occasional Paper No 113
June 2010
Regulatory authorities in these sectors therefore
face the complicated task of maintaining
investment incentives and implementing
effi cient market structures to the benefi t of
consumers, which do not allow incumbent
fi rms to exploit their strategic advantage by
limiting competition. Regulatory instruments
shaping market structures and energy prices for
consumers cover a number of dimensions, most
prominently entry and access rules applicable to
fi rms, consumer rights and price regulations.
1.3.1 EVOLUTION OF EU ENERGY MARKET
REGULATION
Owing to some of the factors outlined above as
well as the strategic nature of energy and the
traditionally strong role of national governments
in setting energy policy, energy markets were
only brought within the remit of the Single
Market at a relatively late stage. Since the
middle of the 1990s, the EU, recognising that
certain segments of the market need not be
served by monopoly producers, pursued a more
differentiated policy of liberalisation and
de-verticalisation of gas and electricity markets.
Common rules for the EU markets in electricity
and gas were fi rst introduced in 1996 and 1998
respectively. They took the form of general rules
and principles and emphasised the need for
objective and transparent licensing or
authorisation procedures and non-discriminatory
technical and access rules governing
transmission and distribution systems.8
Although these directives were credited with
improving the functioning of markets, the
dominance of incumbent energy fi rms limited
access to energy networks for new entrants,
who also faced discriminatory tariffs, thus
impeding the emergence of competition. As a
result, stricter, more prescriptive legislation was
introduced in June 2003. In order to guarantee
non-discriminatory access to energy networks,
transmission and distribution systems were
to be legally and organisationally separated
(“unbundled”) from the other activities of
integrated energy companies (although they
could retain ownership) and endowed with their
own decision-making powers. Market opening
was speeded up by allowing all industrial and
household customers to choose their electricity
and gas suppliers by 1 July 2004 and 1 July 2007
respectively. Finally, the powers and remit of
national regulatory authorities were widened to
include responsibility for effective competition
and the effi cient functioning of national energy
markets.
European Commission monitoring of the energy
market during 2006 revealed that the emergence
of an EU-wide, integrated and competitive
energy market was still held back, owing, inter
alia, to persistently high market concentration
and insuffi cient unbundling, limiting effective
access to energy networks. According to many
institutional actors, including the Commission9,
ownership unbundling of network activity is the
only means to resolve the confl ict of interest that
arises when operators control the network and
compete in the upstream or downstream stage of
the energy business.10
New legislation was adopted in June 2009
and will apply from March 2011. Ownership
unbundling, requiring integrated energy fi rms to
divest their network assets, was introduced as a
To prevent cross-subsidisation of activities and the distortion 8
of competition, integrated energy companies were required to
keep separate accounts for each of their activities, although
ownership structures were allowed to remain unchanged.
High-volume customers were given the right to choose their
own gas and electricity suppliers and the relevant thresholds
were progressively lowered in order to increase the share of
the market subject to competition. Finally, Member States were
required to establish an independent regulatory authority with
dispute-settling powers.
See for example, Council of European Energy Regulators 9
(CEER) (2007); Kroes “[…] the European Commission sees full
ownership unbundling as the most effective option to solve the
problems of discrimination, and the distortion of incentives to
invest in connecting regional or national networks”. Europa press
release, SPEECH/07/63.
Furthermore, unbundling should stimulate the investments 10
needed to increase network capacity, which in turn can improve
effi ciency through the pressure of competition. Nevertheless,
fair and certain access to networks has been assessed in the
literature as a necessary – but not suffi cient – condition for the
development of competition in energy markets as long-term
(e.g. take-or-pay) contracts may also block effective gas sector
competition through vertical foreclosure or market segmentation
(Polo and Scarpa 2007, 2003 and Buchan 2009).

27ECB
Occasional Paper No 113
June 2010
I OVERVIEW
OF ENERGY
MARKETSgeneral principle.11 To increase the effectiveness
of regulatory oversight, the independence
and decision-making capacity of national
regulators has been strengthened further and
their powers harmonised. In addition, a separate
regulation establishes a European Agency for
the Cooperation of Energy Regulators (ACER)
to supplement, harmonise and coordinate
the work of national regulators, formalise
cross-border cooperation between transmission
system operators in European networks and
advise the European Commission as to how to
improve the functioning of EU energy markets.
To promote the integration of European energy
markets, the Commission also makes use of its
powers to enforce existing legislation. As the
implementation of the 2003 directives was
deemed insuffi cient, infringement procedures
were launched against 25 Member States
in 2009.
1.3.2 OPENNESS AND COMPETITION
IN EU ENERGY MARKETS
In the euro area, 99.5% and 96.2% of the
electricity and gas markets respectively were
open to competition in 2007, meaning that
consumers became completely free to choose
their energy supplier (see Table 1). However,
even if de jure competition is in place, de facto
competition is still generally lacking. The
market share of the three largest companies (C3)
in the euro area countries’ wholesale and retail
electricity and gas markets in 2007 remained
high: in the electricity market the C3 indicator
was close or above 75% on average and in the
wholesale and retail gas market above 70% and
60% (for an overview of C3 by country, see
Chart A6 in Annex 1). A similar picture emerges
looking at another indicator of market
concentration, the Herfi ndahl-Hirschman Index,
which was above 4,000 in euro area countries’
wholesale and retail electricity and gas markets
thus pointing to highly concentrated markets.12
Only a few euro area countries are characterised
by a moderately concentrated market: Ireland,
Spain, Italy and Austria in wholesale electricity,
Slovenia in retail electricity and Ireland in
wholesale gas. In all other cases the HHI was
above 1,800 (see Table 2).
Additional insight into market liberalisation
may be obtained by looking at the OECD
Product Market Regulation database.13 For the
gas sector, the market structure indicator ranges
from six (market share of the largest player in
the gas market bigger than 90%) to zero (market
share of the largest player in the gas market
less than 50%). This information is particularly
valuable because data are available back to
1975. Chart 14 reports both the level of the
indicator in 2007 and the progress made since
1990. Several countries (Greece, Luxembourg,
Portugal, Slovakia and Finland) made no
progress in terms of reduction in the dominant
However, as part of the compromise reached between the Council 11
of the European Union and the European Parliament, existing
integrated companies can, as an exception and under certain
conditions, continue to own such assets. In return, the directives
strengthen consumer rights, inter alia by facilitating the switching
of suppliers. The Commission is tasked with assessing the
competition effects of this exception.
The Herfi ndahl-Hirschman Index is defi ned as the sum of the 12
squared individual market shares. The HHI ranges from zero
(perfect competition) to 10,000 (monopoly).
See OECD 2006 and the Product Market Regulation section of 13
the OECD’S website at www.oecd.org.
Table 1 Indicators of market competition in the euro area electricity and gas markets
Euro area Market open to competition (%)
2007
Market share of three largest companies (C3, in %)
2007
HHI
2007 1)
Wholesale electricity market99.5
75.7 4,062.1
Retail electricity market 74.4 4,215.7
Wholesale gas market96.2
72.4 4,076.4
Retail gas market 63.6 4,078.3
Sources: NCBs, European Commisssion and Eurosystem staff calculations. The euro area is obtained by aggregating country data weighted by private consumption.1) Data for the gas market refer to 2006.

28ECB
Occasional Paper No 113
June 2010
position of the incumbent operator in the gas
market while other countries (Ireland, Spain,
France, Italy, the Netherlands and Austria) made
good progress over the same period.
It is worth mentioning that in some energy
markets nationwide indicators of competition
may not fully refl ect effective competition. Some
euro area countries (Germany, Spain and Austria)
were characterised by a decentralised energy
market structure originating historically from
regional monopolies. Germany, for example,
was dominated by regional monopolies in the
electricity and gas markets until 1998. Even after
liberalisation took place the gas transmission
network was segmented into 19 “market areas”
and gas suppliers had to negotiate entry and
exit conditions both between and within market
areas. Since 2007 access has been facilitated and
the number of market areas reduced, although
former incumbents retain dominant positions in
their original market areas.
One requirement for fully-fl edged liberalisation
is the creation of a level playing fi eld for new
entrants through fair and certain access to network
services. Despite progressively stricter regulation
(see previous section), ownership unbundling is
implemented only in half of the euro area
countries (Ireland, Spain, Italy, the Netherlands,
Portugal, Slovenia, Slovakia and Finland) in
electricity transmission 14 and the framework for
legal unbundling is considered by several
commentators to be generally insuffi cient and
weak (ERGEG 2008). In the gas market vertical
integration is very common and is evident to a
higher degree than in the electricity market
(OECD 2006). Only fi ve euro area countries
(Germany, Spain, Italy, the Netherlands and
Portugal) have at least one transmission system
operator (European Commission 2009).
See EC 2009. According to information provided by the 14
Deutsche Bundesbank, in Germany, a recent tendency towards
unbundling is apparently emerging, with some large electricity
providers agreeing to divest their transmission networks in
return for being spared anti-trust measures by the European
Commission.
Table 2 Herfindahl-Hirschman Index (HHI) – country breakdown
Market concentration (HHI) 1)
Wholesale electricity market
Retail electricity market
Wholesale gas market Retail gas market
Very highly concentrated
(HHI>5,000)
BE, GR, FR, LU, MT,
SI, SK
BE, GR, MT, PT, FI BE, GR, MT, NL,
SI, SK
BE, IE, MT, SI, SK
Highly concentrated
(HHI 1,800-5,000)
DE, NL, PT IE, ES, NL, AT, SK ES, IT ES, NL
Moderately concentrated
(HHI 750-1,800)
IE, ES, IT, AT SI IE
Sources: NCBs, European Commission and Eurosystem staff calculations.Note: The HHI takes into account the relative size and distribution of the fi rms in a market and is computed as the sum of the squared market share of each company operating in a market segment. 1) Latest available year – generally 2007/2008.
Chart 14 OECD market structure indicator for the gas market
-3
-2
-1
0
1
2
3
4
5
6
-3
-2
-1
0
1
2
3
4
5
6
1 ES
2 FR
progress since 1990
2007
3 IE
4 IT
5 NL
6 AT
7 euro area
8 BE
9 DE
10 GR
11 LU
12 SK
13 FI
14 PT
1 2 3 4 5 6 7 8 9 10 11 12 13 14
Sources: OECD and Eurosystem staff calculations.Note: A higher index indicates a larger market share of the largest incumbent company. The euro area is a simple average of available countries.
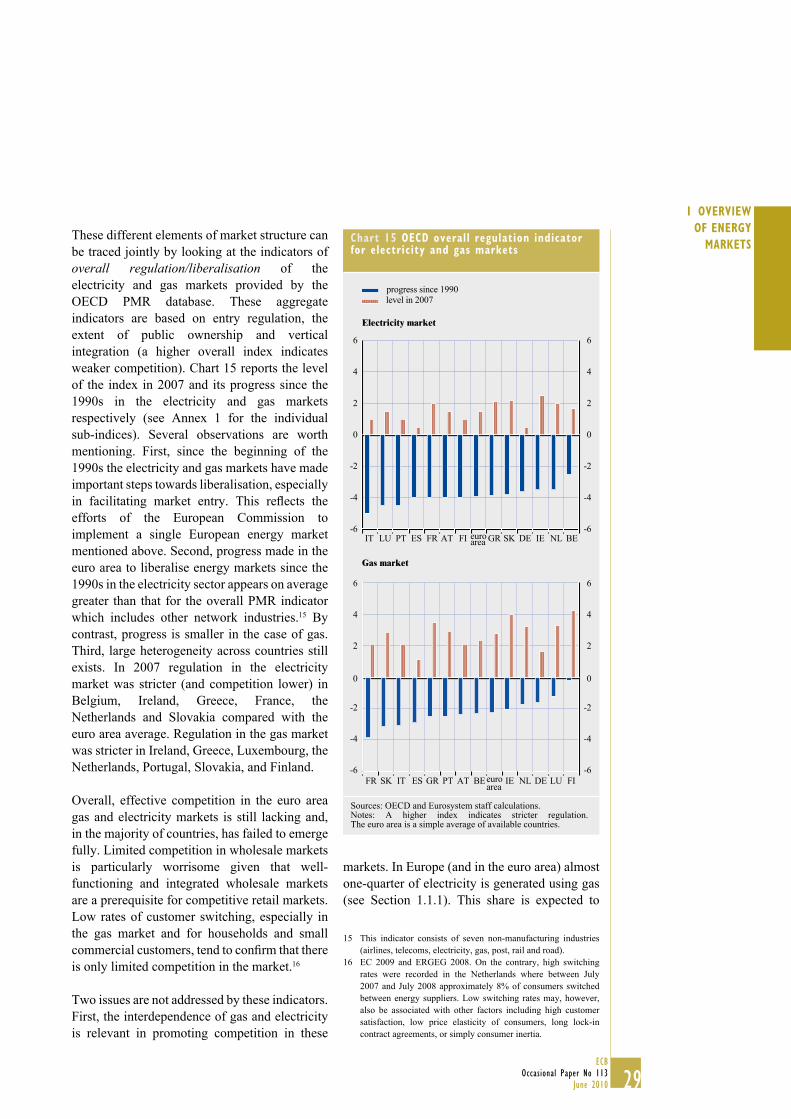
29ECB
Occasional Paper No 113
June 2010
I OVERVIEW
OF ENERGY
MARKETSThese different elements of market structure can
be traced jointly by looking at the indicators of
overall regulation/liberalisation of the
electricity and gas markets provided by the
OECD PMR database. These aggregate
indicators are based on entry regulation, the
extent of public ownership and vertical
integration (a higher overall index indicates
weaker competition). Chart 15 reports the level
of the index in 2007 and its progress since the
1990s in the electricity and gas markets
respectively (see Annex 1 for the individual
sub-indices). Several observations are worth
mentioning. First, since the beginning of the
1990s the electricity and gas markets have made
important steps towards liberalisation, especially
in facilitating market entry. This refl ects the
efforts of the European Commission to
implement a single European energy market
mentioned above. Second, progress made in the
euro area to liberalise energy markets since the
1990s in the electricity sector appears on average
greater than that for the overall PMR indicator
which includes other network industries.15 By
contrast, progress is smaller in the case of gas.
Third, large heterogeneity across countries still
exists. In 2007 regulation in the electricity
market was stricter (and competition lower) in
Belgium, Ireland, Greece, France, the
Netherlands and Slovakia compared with the
euro area average. Regulation in the gas market
was stricter in Ireland, Greece, Luxembourg, the
Netherlands, Portugal, Slovakia, and Finland.
Overall, effective competition in the euro area
gas and electricity markets is still lacking and,
in the majority of countries, has failed to emerge
fully. Limited competition in wholesale markets
is particularly worrisome given that well-
functioning and integrated wholesale markets
are a prerequisite for competitive retail markets.
Low rates of customer switching, especially in
the gas market and for households and small
commercial customers, tend to confi rm that there
is only limited competition in the market.16
Two issues are not addressed by these indicators.
First, the interdependence of gas and electricity
is relevant in promoting competition in these
markets. In Europe (and in the euro area) almost
one-quarter of electricity is generated using gas
(see Section 1.1.1). This share is expected to
This indicator consists of seven non-manufacturing industries 15
(airlines, telecoms, electricity, gas, post, rail and road).
EC 2009 and ERGEG 2008. On the contrary, high switching 16
rates were recorded in the Netherlands where between July
2007 and July 2008 approximately 8% of consumers switched
between energy suppliers. Low switching rates may, however,
also be associated with other factors including high customer
satisfaction, low price elasticity of consumers, long lock-in
contract agreements, or simply consumer inertia.
Chart 15 OECD overall regulation indicator for electricity and gas markets
level in 2007progress since 1990
Electricity market
-6
-4
-2
0
2
4
6
-6
-4
-2
0
2
4
6
BEIT LU PT ES FR AT FI euroarea GR SK DE IE NL
Gas market
-6
-4
-2
0
2
4
6
FI
-6
-4
-2
0
2
4
6
FR SK IT ES GR PT AT BE IE NL DE LUeuroarea
Sources: OECD and Eurosystem staff calculations.Notes: A higher index indicates stricter regulation. The euro area is a simple average of available countries.

30ECB
Occasional Paper No 113
June 2010
continue to rise (IEA 2008a), which suggests
that the interconnection between gas and
electricity price dynamics will be further
amplifi ed in the coming years. Thus, while
vertical integration may be diminishing, certain
forces may give rise to increased horizontal integration: electricity generators may seek to
manage gas input price risk, and multi-utility
companies might seek to exploit economies of
scope by providing a complete set of energy
services (gas and electricity) to their customers
(Finon and Glachant 2004).
Second, around 80% of EU consumers in
countries with end-user regulated electricity
and gas prices were being supplied at regulated
prices in 2008. Despite the opening up of energy
markets for households in 2007, regulated
end-user prices continued to exist in a large
number of countries. In fact, more countries
opened up markets with price regulation in
place than without. In the euro area, electricity
price regulation for households and businesses
continued in eight countries, and gas price
regulation in seven countries (ERGEG 2009).
With regard to the liquid fuel market, the
situation is somewhat different since the liquid
fuel distribution system is not characterised by
such strong network properties. Nonetheless,
although it is a relatively homogenous product
with a relatively large number of individual
retail outlets, there are a relatively small number
of large-scale retailer chains who tend to be
vertically integrated.17 A relatively common
trend across the euro area, potentially affecting
local level competition, is that the number of
petrol stations in the euro area has been declining
steadily since the early 1970s (from more than
200,000 in 1973 to around 80,000 in 2007).18
The number of stations per capita and per
passenger vehicle varies considerably across
countries refl ecting many factors including, inter
alia, market regulation, preferences, geographic
country characteristics and the number of
vehicles per inhabitant. While the declining
number of petrol stations might appear to have
negative implications for competition, it may at
the same time represent an improvement in
effi ciency and have, on balance, benefi cial
effects for consumers. The C3 indicator in the
euro area liquid fuel distribution market, which
was close to 48% in 2005 (see Chart A7 in
Annex 1), is clearly below the level of
concentration seen in the gas market.19 The C3
indicator varies substantially across countries,
ranging from 21% in France to 100% in Malta
and Slovenia. Vertical integration is a key issue
in the liquid fuel market, since local retailers are
often part of a large vertically integrated
company or have a contractual relationship.20
Moreover, vertically integrated companies tend
to have upstream activities in parts of the
production chain that are relatively concentrated,
such as refi ning. Petroleum companies frequently
share such upstream facilities, which may also
limit the degree of competition. On the other
hand, a growing phenomenon in some countries
is the entry of large supermarket chains into the
transport liquid fuel market. These supermarkets
often sell petrol relatively cheaply, relying either
on scale economies or loss-leading on a “known-
value item” such as petrol to attract customers.21
Nonetheless, the main players remain large
international companies in most markets, as
refl ected by the C3 indicator.
1.3.3 OTHER ELEMENTS OF THE EU ENERGY
POLICY FRAMEWORK
The scope of EU legislation has broadened
signifi cantly since the 1990s to encompass
For a detailed discussion of the issue of vertical integration in 17
petrol retailing, see OECD 2009.
A notable exception to this trend is the Spanish market which 18
was opened to competition in the 1990s.
An additional factor impacting on effective competition is fuel 19
tourism. This is particularly the case in small countries with
shared borders. Population density may also have an impact on
competition, ceteris paribus.
Generally there may be fi ve broad classes of petrol retailers: 20
(i) those owned and operated by a vertically integrated company,
(ii) those owned by a vertically integrated company but leased
to another company, (iii) those operated but not owned by
a vertically integrated company (iv) franchises issued by a
vertically integrated company, and (v) independent operators.
See Walsh and Whelan 1999 for a discussion of the concept of 21
known-value items (KVIs) and their pricing in an environment
where consumers lack complete knowledge of all prices
retailers offer. A 2007 study by the Australian Competition and
Consumer Commission found that increased market penetration
by supermarkets reduced retail prices for petrol, and was not at
the expense of increased prices for other items.

31ECB
Occasional Paper No 113
June 2010
I OVERVIEW
OF ENERGY
MARKETS
not only well-functioning energy markets,
but also energy security concerns and climate
change objectives. (Chart 16 provides a stylised
overview). The three pillars are seen as inter-
dependent and mutually reinforcing. The
piecemeal approach in the 1990s towards energy
and climate change/environmental problems has
progressively given way to an integrated EU
approach.
The aim of increasing the EU’s security of energy supply is pursued through a number of different,
but complementary, avenues. As part of the
short-term response to recent disruptions in the
supply of energy products, such as the January
2009 Russia-Ukraine gas crisis, existing
legislation on oil and gas is being revised. This
encompasses the harmonisation of minimum
stocks, enhanced monitoring and transparency,
as well as the development of detailed emergency
response procedures in the case of a major
disruption of oil or gas supplies, both
intra-EU and with major energy suppliers.22
Longer-term, additional investment in energy
infrastructure, in particular cross-border energy
interconnections – the physical backbone of an
integrated energy market – is key to enhancing
energy security. Initiatives have also been taken
to strengthen the external aspects of energy
security via the 2009 internal energy market
legislation and, in 2006, the establishment of the
“Energy Community” by the EU together with a
number of countries in south-eastern Europe.
Box 2 provides more conceptual and empirical
information on different aspects of energy
security in the EU, as well as an
international comparison.
A third area of EU legislation affecting the
functioning of energy markets aims to reduce
the carbon intensity of the European economy.
In April 2009 legislation was introduced that
commits the EU to ambitious targets to combat
climate change, increase the role of renewables
in energy production and improve energy
effi ciency, commonly known as the “20-20-20
agenda”. This plan aims to reduce CO2 emissions
in the EU by 20% compared with 1990, increase
energy effi ciency by 20% and increase the
contribution of renewable energies to 20% of
total energy consumption by 2020. These targets
are to be reached through a variety of means,
including emissions trading and the promotion
of renewable energy sources. Box 3 provides
more conceptual and empirical information
on different aspects of carbon emissions and
climate change policies.
Examples are the current proposal to revise the security of gas 22
supply directive (2004/67/EC) as well as the Memorandum on
an “Early Warning Mechanism” in the energy sector within the
framework of the EU-Russia dialogue signed in November 2009.
Chart 16 Stylised overview of EU energy policy
Regulationof monopolies
Primaryenergy sources
Reliabilityand quality
Capacity
Innovation andcompetitiveness
Low prices and efficiency
Naturepreservation
Climate change
Kyoto andpost-Kyoto
Inte
rnal
mar
ket
Security of supply
Lisbon agenda
Environment
Source: Drawn from European Commission (2007a).
Box 2
THE SECURITY OF ENERGY SUPPLY IN THE EURO AREA
The notion of energy security has short-term dimensions encompassing the risk of temporary
supply disruptions and the ability of the system to react to sudden changes in demand for energy
such as electricity, as well as longer-term dimensions such as the possible depletion of crude
oil and gas reserves (availability), and their geopolitical distribution and transportation via
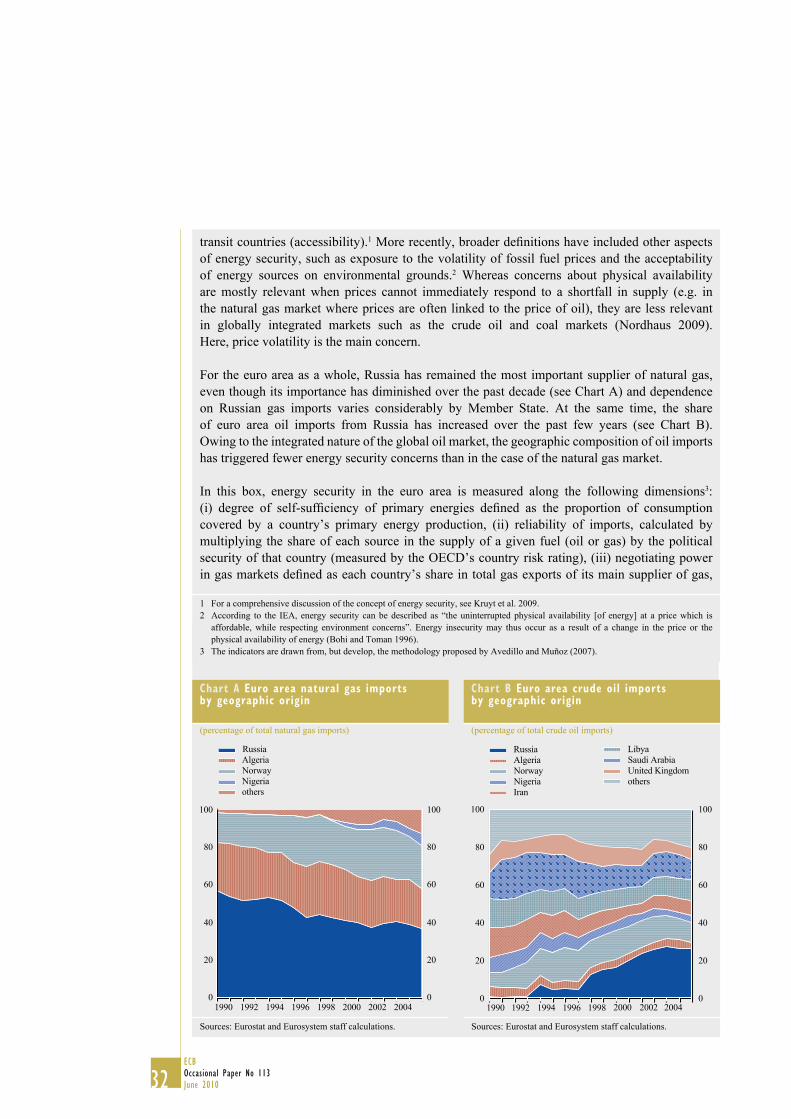
32ECB
Occasional Paper No 113
June 2010
transit countries (accessibility).1 More recently, broader defi nitions have included other aspects
of energy security, such as exposure to the volatility of fossil fuel prices and the acceptability
of energy sources on environmental grounds.2 Whereas concerns about physical availability
are mostly relevant when prices cannot immediately respond to a shortfall in supply (e.g. in
the natural gas market where prices are often linked to the price of oil), they are less relevant
in globally integrated markets such as the crude oil and coal markets (Nordhaus 2009).
Here, price volatility is the main concern.
For the euro area as a whole, Russia has remained the most important supplier of natural gas,
even though its importance has diminished over the past decade (see Chart A) and dependence
on Russian gas imports varies considerably by Member State. At the same time, the share
of euro area oil imports from Russia has increased over the past few years (see Chart B).
Owing to the integrated nature of the global oil market, the geographic composition of oil imports
has triggered fewer energy security concerns than in the case of the natural gas market.
In this box, energy security in the euro area is measured along the following dimensions3:
(i) degree of self-suffi ciency of primary energies defi ned as the proportion of consumption
covered by a country’s primary energy production, (ii) reliability of imports, calculated by
multiplying the share of each source in the supply of a given fuel (oil or gas) by the political
security of that country (measured by the OECD’s country risk rating), (iii) negotiating power
in gas markets defi ned as each country’s share in total gas exports of its main supplier of gas,
1 For a comprehensive discussion of the concept of energy security, see Kruyt et al. 2009.
2 According to the IEA, energy security can be described as “the uninterrupted physical availability [of energy] at a price which is
affordable, while respecting environment concerns”. Energy insecurity may thus occur as a result of a change in the price or the
physical availability of energy (Bohi and Toman 1996).
3 The indicators are drawn from, but develop, the methodology proposed by Avedillo and Muñoz (2007).
Chart A Euro area natural gas imports by geographic origin
(percentage of total natural gas imports)
0
20
40
60
80
100
0
20
40
60
80
100
Russia
Algeria
Norway
Nigeria
others
1990 1992 1994 1996 1998 2000 2002 2004
Sources: Eurostat and Eurosystem staff calculations.
Chart B Euro area crude oil imports by geographic origin
(percentage of total crude oil imports)
0
20
40
60
80
100
0
20
40
60
80
100
Libya
Saudi Arabia
United Kingdom
others
Russia
Algeria
Norway
Nigeria
Iran
1990 1992 1994 1996 1998 2000 2002 2004
Sources: Eurostat and Eurosystem staff calculations.

33ECB
Occasional Paper No 113
June 2010
I OVERVIEW
OF ENERGY
MARKETS(iv) imports of liquefi ed natural gas computed
as LNG imports as a proportion of total gas
imports 4, (v) degree of electrical connectivity
calculated as imports plus exports as a
fraction of electricity consumption, (vi) self-
suffi ciency in electricity production defi ned
as the proportion of total electricity that is
produced with domestic energy (renewable
and nuclear) and (vii) degree of diversifi cation
of primary energies defi ned as one minus the
Herfi ndahl index for primary energy sources.
These seven indicators are computed for
13 euro area Member States (see Annex 2.1).5
A euro area aggregate is computed in two
ways, namely (i) as an unweighted average and
(ii) as a composite aggregate, hypothetically
treating the euro area as a single integrated
energy market, excluding intra-euro area trade
in energy and electricity where relevant.
The main fi ndings from this analysis are
summarised in Charts C and D. In Chart C, all
indicators are aggregated into a single indicator
for energy security, using weights from a
principal factor analysis 6, whose evolution is
shown over time. Chart D compares the two
euro area aggregates with the United States
using the latest available information (2006) for
all seven indicators. As can be seen in Chart C,
energy security in the euro area has tended to
increase over the past decade. To a great extent,
this was a result of increases in the reliability
of euro area oil and gas imports, attributable to
the diversifi cation of some supplies to countries
with lower geopolitical risk. To a lesser extent,
other indicators have also improved, with the
exception of the degree of self-suffi ciency of
primary energies and the degree of electrical
connectivity, owing to physical endowment
and capacity constraints respectively. The
aggregate indicator also suggests that the euro
area might considerably benefi t from a closer
integration of energy markets and reach a level
of energy security comparable to that of the
4 During shortages of natural gas supply, countries with LNG infrastructure tend to be able to respond more fl exibly than countries
receiving natural gas through pipelines (see also Annex 2.1).
5 Due to a lack of data, Cyprus, Luxembourg and Malta are not included in the analysis.
6 Weights are chosen according to their contribution to the overall variance in the data. See Annex 2.1 for details.
Chart C Energy security index for the euro area and the United States
0.0
0.1
0.2
0.3
0.4
0.5
0.6
0.7
0.0
0.1
0.2
0.3
0.4
0.5
0.6
0.7
1993 1995 1997 1999 2001 2003 2005
euro area (aggregate)
United States
euro area (average)
Sources: EIA, Eurostat, Eurosystem staff calculations and OECD.Note: The principal factor applied to the seven indicators analysis yields one factor with eigenvalue greater than one, which explains 82% of the overall variance (see Annex 2.1 for details).
Chart D Indicators of energy security for the euro area and the United States (2006)
0.0
1.0
2.0
3.0
4.0
5.0
self-sufficiency
euro area (aggregate)
United States =1
imports
reliability
marketshare
naturalgas
electricinterconnections
liquefied naturalgas imports
self-sufficiency
in electricitygeneration
diversification
Sources: EIA, Eurostat, Eurosystem staff calculations and OECD.Note: The principal factor applied to the seven indicators analysis yields one factor with eigenvalue greater than one, which explains 82% of the overall variance (see Annex 2.1 for details).

34ECB
Occasional Paper No 113
June 2010
Box 3
GREENHOUSE GAS EMISSIONS AND CLIMATE CHANGE POLICIES
This box provides information about the main greenhouse gas emitting countries and sectors in
the euro area, the current European climate change policies and considerations related to other
possible ways to reduce carbon emissions, such as carbon taxes.
Since pre-industrial levels, the concentration of GHGs included in the Kyoto Protocol has
increased from 280 to 430 parts per million by volume of carbon dioxide equivalent, with a
rise in global mean surface temperature of 0.7°C. Under the “business as usual” scenario, GHG
concentration would continue to increase and global temperature could rise to a range between
2.4°C and 6.4°C (2090-99 relative to 1980-99). While a mild increase in temperature entailed by
CO2 concentration might have benefi cial effects in northern hemispheric countries (increasing
crop yields, reducing winter deaths and heating costs), elsewhere such a warming could lead to
more frequent extreme weather events, increasing stress on water resources and a major rise in
sea level that could endanger coastal areas.
The available estimates of climate change policies’ costs are uncertain, because of uncertainties
about, among other things, technological change, estimates of which often vary signifi cantly.
However, some recent estimates suggest that the costs of mitigation and adaptation could
reach around USD 200 billion to USD 300 billion (i.e. about 0.4% to 0.6% of world GDP) per
year by 2030 (UNFCC 2008). In the case of inaction some studies assess that global damage
from climate change would amount to a 5% loss of GDP each year at least; others estimate the
potential loss of a 2.5°C increase – with respect to the pre-industrial level – at about 1% of GDP
(see Stern 2007 and Tol 2008). In order to overcome the “greatest market failure” which climate
change constitutes, the Stern Review recommends three elements of policy for an effective
global response: the pricing of carbon, supporting low-carbon technologies and education about
energy-effi cient behaviour.
United States. At the Member State level, energy security has on average remained below the
level in the United States, barring notable exceptions, namely euro area countries in which either
nuclear power or renewables are important sources for electricity generation or where access to
the global LNG market is available.
Chart D suggests that with an integrated energy market, the euro area, compared to the
United States, might achieve particularly high scores with respect to electricity interconnections
(given the very low level of this indicator in the United States), LNG imports and the degree of
self-suffi ciency in electricity generation.
In the long term, energy security in the euro area might also be affected by the EU’s climate
change policies. Indeed, recent studies on a possible link between climate policies and energy
security fi nd that there may be a “double dividend” of global climate policies in terms of enhanced
energy security (see Criqui and Mima 2009). Work by the IEA (2007) suggests that the impact
of a reduction in CO2 emissions on energy security would depend on how it is implemented.
For example, an increase in end-use energy effi ciency and enhanced reliance on non-fossil
technologies (renewables and nuclear) are likely to have a positive impact on energy security.

35ECB
Occasional Paper No 113
June 2010
I OVERVIEW
OF ENERGY
MARKETSIn order to stabilise GHG concentrations in the atmosphere at a level that would prevent
dangerous anthropogenic interference with the climate system, there is wide agreement that
the overall global annual mean surface temperature increase should not exceed 2°C above pre-
industrial levels.1 In order to achieve this, the overall GHG concentration should not exceed 450
ppmv CO2-e, which means that the global emissions of GHGs should peak by 2020 and then
begin a sharp decline, if they are to be halved by 2050. According to the fourth assessment report
of the IPCC (2007), to achieve this, developed countries should at least reduce their emissions
by 80% compared with 1990 levels, whereas other countries should make a substantial deviation
from their baseline emissions.
GHG emissions in the euro area
Total GHG emissions, without international bunkers (aviation and maritime emissions) and
LULUCF (land use, land use change and forestry), represented around 3,364 million tons of
CO2-e in the euro area in 2007. They have decreased by only 1.6% since 1990 (see Table A).2
In 2007 euro area countries were responsible for 67% of the EU27’s total GHG emissions.
Unsurprisingly, the share of emissions is closely linked to country size, particularly in terms of
population.
In parallel with the decrease in the overall level of GHG emissions since 1990, the quantity per
unit of real GDP has also decreased owing to improvements in energy effi ciency, the change in
1 UN Climate Change Conference Copenhagen, 2009. “We underline that climate change is one of the greatest challenges of our time. …
To achieve the ultimate objective of the Convention to stabilize greenhouse gas concentration in the atmosphere at a level that would
prevent dangerous anthropogenic interference with the climate system, we shall, recognizing the scientifi c view that the increase in
global temperature should be below 2 degrees Celsius, on the basis of equity and in the context of sustainable development, enhance
our long-term cooperative action to combat climate change.”
2 The most important GHG by far is carbon dioxide, accounting for 83.5% of total euro area emissions in 2007 (excluding international
bunkers and LULUCF). In 2007 euro area CO2 emissions were around 2,809 Mt, 2.3% above the 1990 level.
Table A Total greenhouse gas (GHG) emissions in the euro area1)
GHG Shares (%) GHG per capita GHG per unit of outputMt CO2-e t CO2-e Kg CO2-e per GDP
1990 2000 2007 1990 2000 2007 1990 2000 2007 1990 2000 2007
BE 143.2 145.1 131.3 4.2 4.3 3.9 14.4 14.2 12.4 0.70 0.58 0.45
DE 1,215.2 1,008.2 956.1 35.5 29.9 28.4 15.4 12.3 11.6 0.69 0.49 0.43
IE 55.4 69.0 69.2 1.6 2.0 2.1 15.8 18.3 16.0 1.06 0.66 0.45
GR 105.6 127.1 131.9 3.1 3.8 3.9 10.4 11.7 11.8 0.98 0.93 0.73
ES 288.1 385.8 442.3 8.4 11.4 13.1 7.4 9.6 9.9 0.60 0.61 0.55
FR 562.6 556.8 531.1 16.5 16.5 15.8 9.9 9.5 8.6 0.47 0.39 0.32
IT 516.3 549.5 552.8 15.1 16.3 16.4 9.1 9.7 9.3 0.51 0.46 0.43
CY 5.5 9.3 10.1 0.2 0.3 0.3 9.5 13.5 13.0 0.86 0.95 0.80
LU 13.1 10.0 12.9 0.4 0.3 0.4 34.6 23.0 27.1 0.97 0.45 0.44
MT 2.0 2.6 3.0 0.1 0.1 0.1 5.8 6.8 7.4 0.79 0.65 0.67
NL 212.0 214.4 207.5 6.2 6.3 6.2 14.2 13.5 12.7 0.69 0.51 0.43
AT 79.0 81.1 88.0 2.3 2.4 2.6 10.3 10.1 10.6 0.49 0.39 0.37
PT 59.3 81.7 81.8 1.7 2.4 2.4 5.9 8.0 7.7 0.64 0.67 0.62
SI 18.6 18.9 20.7 0.5 0.6 0.6 9.3 9.5 10.3 1.21 1.02 0.83
SK 73.3 48.4 47.0 2.1 1.4 1.4 13.9 9.0 8.7 3.12 1.55 0.99
FI 70.9 69.5 78.3 2.1 2.1 2.3 14.2 13.4 14.8 0.65 0.53 0.48
euro area 3,420.1 3,377.4 3,364.1 100.0 100.0 100.0 11.4 10.9 10.4 0.61 0.50 0.44
EU27 5,564.0 5,053.6 5,045.4 11.8 10.5 10.2 0.74 0.55 0.47
Source: DG TREN (2010) “EU energy and transport in fi gures – Statistical pocketbook 2010”.1) Excluding international bunkers (international aviation and maritime transport) and LULUCF (land use, land use change and forestry) emissions.

36ECB
Occasional Paper No 113
June 2010
the fuel mix away from solid fuels, and structural shifts in the sectoral composition of economic
activity.
Table B gives an overview of euro area GHG emissions in the main source categories for the
period 1990-2007. Energy is the most important source of GHG by far, accounting for 79% of total
euro area emissions in 2007. Energy-related emissions in 2007 were 1.2% above the 1990 level.
The second largest sector is agriculture (9.4%), followed by industrial processes (9.0%).
Concerning the main sub-categories of energy 3, the most important were energy industries – with
electricity and heat production the major contributors to GHG emissions – accounting jointly
for 38.0% of emissions in 2007 (994 Mt CO2-e). The second largest was transport (27.2%,
711 Mt CO2-e), followed by other sectors – mainly households – (17.6%, 460 Mt CO2-e) and
manufacturing and construction (17.0%, 444 Mt CO2-e).
European climate change policies
Because of the close links between climate change and energy policies (for instance the majority
of the total CO2-e emissions result from the production and consumption of energy), the EU
is pursuing an integrated climate change and energy strategy. Legislation was introduced in
April 2009 which envisages a reduction in EU CO2 emissions by 20% compared with 1990 (to
be scaled up to 30% under a binding global agreement), a 20% increase in energy effi ciency and
an increase in the contribution of renewable energies to 20% of total energy consumption by 2020
(the “20-20-20 agenda”). These targets are to be reached through (i) an improved and extended EU
Emission Trading Scheme with progressively stricter emission caps, (ii) stricter energy-effi ciency
standards, such as for cars and buildings, (iii) the geological storage of carbon dioxide and (iv) the
promotion of renewable energies, including a 10% biofuel target in transport.
“Cap and trade” systems, such as the ETS, play a central role in the EU’s long-term strategy
for reducing GHG emissions. The EU ETS, established in January 2005, covers around 40% of
3 The energy sector consists of fuel combustion and fugitive emissions from combustion. Fuel combustion consists of the energy
industries, manufacturing and construction, transport, other sectors and other (not elsewhere specifi ed).
Table B Total greenhouse gas (GHG) emissions 1) by main source category in the euro area
Mt CO2-e Shares (%)
1990 2000 2007 1990 2000 2007
Energy 2,621 2,630 2,652 76.6 77.9 78.8
Fuel combustion 2,559 2,581 2,615 97.6 98.1 98.6
Energy industries 913 911 994 35.7 35.3 38.0
Manufacturing and construction 531 464 444 20.8 18.0 17.0
Transport 560 684 711 21.9 26.5 27.2
Other sectors 538 515 460 21.0 19.9 17.6
Other (not elsewhere specifi ed) 18 7 5 0.7 0.3 0.2
Fugitive emissions from fuels 62 49 37 2.4 1.9 1.4
Industrial processes 318 295 303 9.3 8.7 9.0
Solvent and other product use 13 11 10 0.4 0.3 0.3
Agriculture 352 340 316 10.3 10.1 9.4
Waste 116 101 82 3.4 3.0 2.4
Total emissions 3,420 3,377 3,364 100.0 100.0 100.0
Source: DG TREN “EU energy and transport in fi gures – Statistical pocketbook 2010”.1) Excluding international bunkers and LULUCF (land use, land use change and forestry) emissions.

37ECB
Occasional Paper No 113
June 2010
I OVERVIEW
OF ENERGY
MARKETS
1.4 FUTURE TRENDS
Future developments in European energy markets will be largely shaped by two main
forces: (i) trends in global energy markets in
terms of supply, demand and technology and (ii)
the implementation of energy market policies
both at the European and global level, the
latter particularly in relation to climate change.
However, although identifying the main forces
may be straightforward, estimates of future
developments in energy markets are subject to
great uncertainty. This uncertainty stems from a
number of sources including the high volatility
in energy markets themselves, the fact that
global policies are still evolving, and lastly the
fact that global supply, demand and technology
trends may react endogenously to changes
in policy in ways that are hard to anticipate a
priori.
This section reports estimates from the European
Commission (2008a) and the IEA (2009) on
likely future trends up to 2020. Both institutions
report “baseline” scenarios, which are based on
currently agreed policies and global market
trends in terms of supply, demand and
technology, and “policy change” scenarios.23
The Commission considers the scenario of full
implementation of the EU’s current energy and
climate policy plans, whilst the IEA reports a
450 ppm scenario.24 The Commission presents
its baseline estimates for two different profi les
of oil prices (moderate and high). The IEA bases
its oil price assumption on a model which
balances forecast supply and demand.25 Different
oil prices account for some of the most salient
differences between the two baseline scenarios.
Whilst this distinction is useful, it should also be borne in mind 23
that some current market developments may be driven by an
anticipation of future policy developments. Hence the baselines
and alternative scenarios may not be completely independent.
Furthermore, the two estimates are based on different
assumptions and are thus not fully comparable.
This refers to greenhouse gas concentrations limited to 450 parts 24
per million in the atmosphere.
The IEA reports that in its model USD 100 in constant 2008 25
prices equates USD 131 in nominal terms. In terms of sensitivity
analysis the IEA also reports the impact of assuming higher
or lower GDP growth and oil prices compared to its reference
scenario.
all EU27 emissions. Applicable between 2005 and 2012, emission caps have been established
according to national allocation plans, and will be replaced from 2012 onwards by an
EU-wide cap. In 2008 more than 3 gigatons of CO2-e allowances were traded on the EU
ETS, representing a total value of €63 billion (up 87% when compared with 2007 levels) and
amounting to 73% of the global carbon market (World Bank 2009). From 2012 onwards about
half of allowances will be auctioned, rising to 80% by 2020. The proceeds of the auctioning
can be used to reduce distortionary taxes (e.g. labour taxes), reap the benefi ts of the so-called
double dividend, or to fi nance climate change policies in the EU or in developing countries.
According to the European Commission’s estimations, auction revenues could be substantial:
assuming that all sectors covered under the EU ETS would have to acquire allowances using
auctions, in 2020 revenues could represent 0.5% of GDP (assuming a price of about €40/t CO2-e)
(see EC 2008).
Current considerations on pricing carbon emissions
Whatever instrument is used, a stable, transparent and credible price signal as well as long-term
expectations of rising carbon prices are needed in order to make GHG mitigation cost effective
and politically sustainable. From this perspective, energy subsidies and other price distortions
in the developing and developed countries undermine the effectiveness of price signalling.
An international carbon market could be developed in which existing markets are linked and
integrated. Such linking and the broadening of the sectors covered would increase the possibility
of achieving a global emission target at the lowest cost.

38ECB
Occasional Paper No 113
June 2010
Although there are considerable differences
between the Commission and IEA regarding
their baseline/reference scenarios, these
differences stem more from the timing of when
the forecasts were made than from other factors
such as modelling assumptions. The impact of
fi nancial market developments on economic
activity and energy consumption was not
anticipated when the Commission compiled its
forecasts in early 2009. Thus whilst the
Commission anticipates an increase in primary
energy demand up to 2020, the IEA now
suggests a decline (see Table A2). Energy
demand is a function of many factors including
prices and general economic activity, but also
more structural determinants such as population
demographics or societal behaviour with regard
to energy effi ciency.26 With respect to the
expected decomposition by fuel type the broad
patterns are the same: i.e. a strong increase in
renewables, some increase likely in natural gas
and a decline in nuclear power. There are some
differences with respect to oil and solid fuels,
but these may, in part, be accounted for by recent
developments as well as by different oil price
assumptions. Overall, fossil fuels will remain
the dominant fuel source. Energy effi ciency
should improve arising both from structural
improvements driven by R&D and technological
change, as well as a result of the increasing
importance of services in the economy’s
structure. On the other hand, the Commission
envisages that energy dependency will increase
further as the overall reduction in primary
energy production is combined with increased
fossil fuel consumption in Europe. Regarding
greenhouse gas emissions, the Commission
forecasts suggest at best a levelling off from
2005/06 levels, which clearly would not meet
the Kyoto obligations. However, the large
uncertainty surrounding these estimates may be
underscored by the impact of the economic
slowdown in the period 2008-09 and its effects
on energy demand. In part refl ecting this,
between 2008 and 2009, the IEA revised down
estimated energy demand in the OECD countries
up to 2015 by 6% compared with its 2008 World
Energy Outlook.
Alternative policy scenarios reveal some
important differences from the baseline
scenarios. First, rather than increasing slightly,
energy demand in the EU would decrease
slightly, arising mainly from greater gains in
energy effi ciency.27 These improvements in energy
effi ciency, which arise from the assumption of
additional R&D and enhanced technological
change, underscore the interaction of likely
future trends and energy policy. There would
also be some differences in the likely fuel mix.
Demand for fossil fuels, in particular solid fuels,
would decrease owing primarily to the higher
price of carbon. Renewables would gain even
more in importance. Energy dependency would
still be likely to increase.
In terms of the possible macroeconomic impacts, a wide range of estimates exists for the
likely impact of carbon reduction measures on
economic growth. Depending on the scenario,
the underlying assumptions on how this is
achieved (for example, actions in developed and
developing economies, technology sharing, etc.)
and the model used, current estimates range
from 0.2% to 3.0% of GDP (see, for example,
IEA 2009, OECD 2008, IMF 2008, and IPCC
2007). These costs should be seen as “gross”
in the context of climate policy since damages
of climate change owing to inaction would
have to be netted out (see Box 3 for further
discussion of this issue). Regarding prices,
climate change policies will increase the price
of energy products according to their carbon
content. In its 2009 study, the IEA assumes a
price of USD 50 per ton of CO2 by 2020, which
is equivalent to adding USD 20 per barrel to the
cost of oil without carbon pricing. At the same
For instance, recent proposals to amend EU energy labelling 26
for consumer products (agreed on 17 November 2009 by the
Council, Commission and Parliament) should increase consumer
awareness of energy consumption and encourage lower energy
intensity in consumption.
The Action Plan for Energy Effi ciency suggests that the services 27
and commercial sector is that with the highest saving potential,
estimated around 30% by 2020. Other sectors have potential
savings of 25-27%. Great importance is given to the development
of a proper regulation for avoiding stand-by electricity losses from
various products, which could spare 35 TWh of the 50 consumed
yearly by residential equipment in stand-by mode.

39ECB
Occasional Paper No 113
June 2010
I OVERVIEW
OF ENERGY
MARKETStime, the price of fossil fuels excluding carbon
penalties could be lower than under baseline
scenarios owing to their dampening impact
on fossil fuel demand. Furthermore, changes
in relative prices, in particular that of carbon,
should not be confused with overall infl ation.
Given that carbon pricing will be announced in
advance (and hence anticipated by agents) and
that climate change policies may have a small
downward impact on overall activity, these
factors may counteract the upward pressure on
energy prices.
Overall at a more global level, it is likely
that energy markets will remain a source of
macroeconomic volatility. In oil markets,
although prices have declined from the peaks
reached in 2008 and overall demand has fallen,
it is likely that tightness in the supply-demand
balance will re-emerge once global economic
activity resumes its upward trajectory. This
tightness could be intensifi ed by the slowdown
in investment in oil supply as many projects
have been postponed or cancelled. Moreover,
energy dependency is expected to remain high
in the long run. On the other hand, the increasing
penetration of renewable energy and ongoing
declines in energy intensity could reduce
European energy dependency and dampen the
macroeconomic impact of energy price volatility
of international markets on euro area economic
activity and infl ation.

40ECB
Occasional Paper No 113
June 2010
2 THE IMPACT OF ENERGY PRICES
ON ECONOMIC ACTIVITY
This chapter studies the short and long-term impact of energy prices on economic activity in the euro area, in the context of the energy market features analysed in Chapter 1. The chapter starts with conceptual considerations on the main channels through which energy prices can affect output. Second, empirical evidence on the short and medium-term impact of energy prices on activity in the euro area as a whole as well as in individual Member States is discussed on the basis of simulations with macroeconometric models. Finally, the chapter turns to the long-run effects of energy price changes on output.
2.1 IMPACT ON ECONOMIC ACTIVITY –
CONCEPTUAL CONSIDERATIONS
The impact of energy prices on euro area
economic activity can be disentangled into
terms of trade, demand and supply-side effects
(see Chart 17). Terms-of-trade effects arise from
an increase in import prices of energy, which
leads to an increase in total import prices relative
to export prices. The deterioration in the terms of
trade may trigger adverse real income and wealth
effects in net energy-importing countries. Unless
savings are reduced or borrowing increases,
this will depress consumption in the domestic
economy. Demand-side effects are linked to the
impact of energy prices on infl ation. As prices
increase, real disposable income and, therefore,
consumption is reduced. Supply-side effects
arise from the importance of energy as an input
factor in the production process. As a result,
production costs increase along with increases
in energy prices.
The mechanism underlying the direct
demand-side effect is rather immediate. Chart 18
shows the evolution of real private consumption,
real disposable income and oil prices 28 since the
1970s. Oil prices seem to have had some impact
on real disposable income after the oil price
hikes in 1973 and 1999, when both real
disposable income and consumption declined
shortly after the hikes. The link is less apparent
for the oil price shock in 1979 which started
when real disposable income and consumption
were already on a declining path. The impact of
smaller increases in oil prices is more diffi cult
to detect by visual inspection.
Turning to the supply side of the economy, in
the short term, the ability of fi rms to react to oil
price increases by substituting energy with other
inputs is limited. Past investment represents sunk
costs so that the energy intensity of production is
largely given. As a result, an increase in energy
prices inevitably leads to higher production
costs. Firms may then react to this shock either
via their pricing or their production behaviour.
In terms of the former they can either buffer the
increase in energy prices by diminishing their
profi t margins, or they can pass through the
Oil prices are used as no equally long series for energy prices 28
is available. This is justifi ed as oil prices and energy prices
co-move closely together. Furthermore, as explained above,
different sources of energy are hard to substitute in the short
term.
Chart 17 Energy prices and economic activity
Shortterm
Supply-side
effects
Terms-of-trade
effects
Demand-side
effects
Longterm
Consumerprices
effects
Energy prices
te
Quantityadjustment
rm
Inputprices
Sh
Profits and/oroutput priceadjustment
LteSubstitution of
expensive energyand energy saving
Realincome
Privateconsumption
savings
InvestmentEmployment
Wages
Import prices
Source: Eurosystem staff.

41ECB
Occasional Paper No 113
June 2010
2 THE IMPACT OF
ENERGY PRICES
ON ECONOMIC
ACTIVITY
higher production costs by increasing selling
prices, thereby generating indirect effects on
infl ation. In terms of their production behaviour,
fi rms react to new market conditions by adjusting
the quantities produced, therefore reducing the
amount of energy needed for production. As a
result, investment, employment and wages tend
to go down.
To illustrate the link between profi t margins and
energy prices over time, Chart 19 shows oil
prices and profi t growth since the 1970s. After
the oil price hikes in 1973 and 1979, profi t
growth (approximated by the GDP defl ator
growth minus unit labour cost growth) declined
substantially owing to a stronger increase in unit
labour costs than in the GDP defl ator. However,
the oil price hike in 1999 did not have an effect
of similar magnitude on profi ts, given that both
the GDP defl ator and unit labour costs grew at
similar rates.29 At the same time, the oil price
decline in 1986 was accompanied by an increase
in profi t growth.
The adjustment path to a new long-run
equilibrium is smoother the less nominal
rigidities exist in the economy. The resulting
long-term decline in output depends considerably
on the overall energy intensity of production and
on the degree to which energy can be substituted
by other means of production. Producers can
exploit more and more possibilities to substitute
energy so that the energy intensity of production
will decline somewhat in response to a positive
energy price shock. Indeed, as shown in Chapter
1, the share of oil in production and the oil
intensity of consumption have declined in the
OECD countries compared with the 1970s.
These long-run trends cushion the effects of
higher production costs. Therefore, the long-term
effects on output are typically less pronounced
than the short-term effects (see Section 2.3).
Obviously, this substitutability of expensive
energy for less expensive energy can differ
across sectors and countries.
The above-mentioned effects depend also on
the expectation of the duration of energy price
changes. In general, energy price increases
which are perceived as permanent have stronger
adverse long-run impacts on output, while an
Profi t mark-ups may have been supported to some extent by the 29
depreciation of the euro around the time of its launch.
Chart 18 Oil prices, disposable income and private consumption
(annual percentage changes)
-3
-2
-1
0
1
2
3
4
5
6
7
-150
-100
-50
0
50
100
150
200
250
300
350
1970 1976 1982 1988 1994 2000 2006
real private consumption (left-hand scale)
real disposable income (left-hand scale)
oil prices (right-hand scale, in EUR, nominal)
Sources: Eurostat, IMF, Area-Wide Model (AWM) database and Eurosystem staff calculations.
Chart 19 Oil prices and profit growth
(annual percentage changes)
-6
-5
-4
-3
-2
-1
0
1
2
3
4
1972 1976 1980 1984 1988 1992 1996 2000 2004 2008
-150
-100
-50
0
50
100
150
200
250
300
350
oil prices (right-hand scale, in EUR, nominal)
profits (left-hand scale)
Sources: Eurostat, IMF, Area-Wide Model (AWM) database and Eurosystem staff calculations.

42ECB
Occasional Paper No 113
June 2010
increase in energy prices which is anticipated
to be temporary induces an inter-temporal shift
in consumption and output, decreasing current
output to a greater extent, but less so in the
long run. In addition, a fall in output could be
the consequence of uncertainty when major
disruptions in energy supply raise doubts about
the future availability of oil and its price. In such
a case, purchases of investment and durable
consumption goods which are complementary
to energy and are irreversible are likely to be put
on hold since there is a positive option value of
waiting to invest or to consume. Consequently,
the capital stock grows less or even declines,
weakens the economy’s aggregate demand
(Bernanke 1983) and consumption of energy-
intensive items, such as cars, may be depressed.
In this vein, Kilian (2008a) found evidence
for a much stronger effect of energy price
shocks on the demand for vehicles than on
the consumption of other consumption goods.
However, the overall empirical evidence in
favour of such a channel has so far been limited
(see, for example, Peersman and Robays 2009
and Edelstein and Kilian 2008).
2.2 IMPACT ON ECONOMIC ACTIVITY –
EMPIRICAL EVIDENCE
According to the results of a set of ESCB macro
econometric models, oil price increases lead to
output losses, which are quite heterogeneous
across countries. Table 3 shows the impact of a
10% permanent rise in oil prices in US dollar
terms on real GDP over three years. As these
models usually assume that oil is the only source
of energy, the simulations are done for a
change in oil prices and not a change in total
energy prices. Model simulations are largely
harmonised, but some important differences
remain.30 These simulations are based on the
assumption that the impact of energy price
changes on activity is the same independently of
whether the changes are demand or supply
driven. A 10% increase in oil prices over three
years would imply that GDP is 0.3-0.4
percentage point lower than the baseline in
Belgium, Germany, Greece and Italy, while the
impact on GDP in Ireland, France, Luxembourg,
Austria and Slovenia amounts to less than
0.1 percentage point. The other countries lie
between these two groups.
Owing to their interactions, as also refl ected
in Chart 2, it is diffi cult to clearly disentangle
demand and supply-side effects. However,
a breakdown of GDP into its expenditure
components can give insights into the source
of differences in the reaction to changes in oil
prices across countries.
The simulations were carried out on a largely harmonised 30
basis, and under the assumption that monetary policy is
exogenous (i.e. the nominal interest rate is kept constant,
except for Greece), fi scal policy is exogenous and exchange
rates are assumed not to be affected by the oil price change.
Beyond this, the models are not harmonised and may differ
with respect to their size, estimation period and theoretical
underpinning. There could also be differences in the channels
through which oil price changes affect the economy and
in particular with respect to the inclusion of supply-side
effects of a change in oil prices. In addition, the treatment
of international spillover effects may differ across models.
A detailed description of the models used is beyond the scope
of this report, but a more comprehensive overview of many of
them can be found in Fagan and Morgan 2005.
Table 3 Effect of a 10% oil price rise on real GDP according to traditional structural models
(annual averages)
Year 1 Year 2 Year 3
Belgium -0.09 -0.30 -0.40
Germany -0.16 -0.33 -0.37
Ireland 0.00 -0.03 -0.05
Greece -0.03 -0.13 -0.34
Spain -0.04 -0.21 -0.25
France -0.01 -0.02 -0.05
Italy -0.07 -0.25 -0.36
Cyprus -0.03 -0.08 -0.15
Luxembourg 0.00 -0.03 -0.03
Malta -0.27 -0.26 -0.16
Netherlands -0.03 -0.08 -0.10
Austria -0.07 -0.09 -0.07
Portugal -0.05 -0.11 -0.20
Slovenia 0.01 -0.01 -0.06
Slovakia -0.10 -0.14 -0.14
Euro area average -0.08 -0.19 -0.24
Source: Eurosystem staff calculations.Notes: This table indicates the short-run effects of a permanent increase in the price of oil by 10% on real GDP in the euro area countries. The fi gures denote cumulated deviations in percent from the respective baseline simulation with unchanged oil prices. The estimations of the macroeconometric models are based on data samples going back to the 1980s for all countries with the exceptions of Cyprus and Malta (starting in 1995), Slovenia (starting in 1996) and Slovakia (starting in 2000).

43ECB
Occasional Paper No 113
June 2010
2 THE IMPACT OF
ENERGY PRICES
ON ECONOMIC
ACTIVITY
Looking at the expenditure breakdown of GDP,
two of the countries with the strongest effects
on consumption (Germany and Slovakia,
see Chart 20) also have a relatively high energy
content of consumer demand, as refl ected
in the HICP weights and input-output tables
(see Charts 21 and 22). In addition, as real
income is an important determinant of
consumption, countries with a relatively large
simulated negative effect on real income
(for example Italy and Slovakia, see Chart 23)
also tend to experience a larger impact on
consumption, while those with a more muted
reaction of real income (Belgium, France,
Malta and Austria) have also relatively small
consumption effects.
Interestingly, the relatively strong impact
on wages for Belgium and Greece (see also
Section 3.3.3) results in a relatively larger effect
on employment, while countries with a smaller
wage reaction (e.g. Ireland and Austria) tend
to experience a smaller effect on employment
(see Chart 23). However, this relationship
between the size of the wage and employment
reactions also depends on the fl exibility of
Chart 20 Effect of a 10% oil price increase according to traditional structural models (average effect in year three)
(percentage deviation from baseline (cumulated); percentage point deviations from baseline for net exports contribution)
Consumption
-0.7
-0.6
-0.5
-0.4
-0.3
-0.2
-0.1
0.0
-0.7
-0.6
-0.5
-0.4
-0.3
-0.2
-0.1
0.0
BE DE IE GR ES FR IT CY LU MT NL AT PT SI euroarea
SK
Net exports
-0.2
-0.1
0.0
0.1
0.2
-0.2
-0.1
0.0
0.1
0.2
BE DE IE GR ES FR IT CY LU MT NL AT PT SI euroarea
SK
Investment
-2.5
-2.0
-1.5
-1.0
-0.5
0.0
0.5
-2.5
-2.0
-1.5
-1.0
-0.5
0.0
0.5
BE DE IE GR ES FR IT CY LU MT NL AT PT SI euroarea
SK
Exports
-0.5
-0.4
-0.3
-0.2
-0.1
0.0
-0.5
-0.4
-0.3
-0.2
-0.1
0.0
BE DE IE GR ES FR IT CY LU MT NL AT PT SI euroarea
SK
Imports
-1.4
-1.2
-1.0
-0.8
-0.6
-0.4
-0.2
0.0
-1.4
-1.2
-1.0
-0.8
-0.6
-0.4
-0.2
0.0
BE DE IE GR ES FR IT CY LU MT NL AT PT SI euroarea
SK
Source: Eurosystem staff calculations.
Chart 21 Weight of energy in the consumption basket
0
2
4
6
8
10
12
14
16
18
0
2
4
6
8
10
12
14
16
18
SK
total energy
fuels
HICP weights
BE DE IE GR ES FR IT CY LU MT NLAT PT SI
Source: Eurostat. Note: The horizontal lines show the respective euro area average.

44ECB
Occasional Paper No 113
June 2010
labour markets which infl uences the downward
adjustment of both wages and employment.
Overall, the strongest negative impact on
employment can be observed in Spain, followed
by Belgium, Greece and Italy, while the effect
is very small for Ireland, France, Cyprus,
Luxembourg, the Netherlands and Austria.
Regarding investment (see Chart 20), the
simulation results indicate that the negative
impact on this GDP component is substantial for
Greece, which has a very high energy content of
investment (see Chart 22). Note however that,
contrary to the other models, the Greek model
includes an interest rate reaction. Stronger than
average negative effects on investment can also
be observed for Belgium, Spain and Malta. The
negative impact on investment is small for
Ireland, France, Cyprus and Austria, where a
rather small energy content of investment can be
observed for France and Austria.31 In addition,
in France, the effect is small owing to a positive
effect on housing investment, as the French
model predicts a stronger impact stemming from
a decline in real interest rates as a result of the
increase in the HICP.
Finally, the simulations differ with respect to the
impact on the contribution of net exports to GDP
growth (see Chart 20). While some countries
seem to react to an increase in oil prices with a
decline in net exports (Belgium, Spain, Cyprus
Luxembourg and Portugal), most countries’ net
exports increase, owing to a relatively stronger
downward impact on imports than on exports.32
No input-output tables for 2005 are available for Belgium, 31
Cyprus, Luxembourg and Malta.
Indeed the impact of oil prices on international trade fl ows 32
outside the country under consideration is not explicitly
modelled in most national simulations.
Chart 22 Energy content of final demand
(2005; percentage of component of the fi nal demand)
Consumption
0
1
2
3
4
5
6
7
8
9
10
0
1
2
3
4
5
6
7
8
9
10
DE IE GR ES FR IT NL AT PT SI SK FI euro
area
Investment
-0.4
-0.2
0.0
0.2
0.4
0.6
0.8
1.0
1.2
1.4
-0.4
-0.2
0.0
0.2
0.4
0.6
0.8
1.0
1.2
1.4
DE IE GR ES FR IT NL AT PT SI SK FI euro
area
Source: Input-output tables from Eurostat.Note: Negative fi gures for investment are due to inventories.
Chart 23 Effect of a 10% oil price increase according to traditional structural models (average effect in year three) – labour market
(percentage deviation from baseline (cumulated))
Real compensation per employee
-0.5
-0.4
-0.3
-0.2
-0.1
0.0
-0.5
-0.4
-0.3
-0.2
-0.1
0.0
euro
area
BEDE IE GRES FR ITCYLUMTNLATPT SI SK
Employment
-0.4
-0.3
-0.2
-0.1
0.0
-0.4
-0.3
-0.2
-0.1
0.0
euro
area
BEDE IE GR ES FR IT CYLUMTNLAT PT SI SK
Source: Eurosystem staff calculations.

45ECB
Occasional Paper No 113
June 2010
2 THE IMPACT OF
ENERGY PRICES
ON ECONOMIC
ACTIVITY
Regarding the time taken for a change in oil
prices to manifest an effect on GDP, there are
also differences across countries (see Table 3).
Most countries experience negative impact
fading relatively gradually to the full impact
over the three years. Meanwhile, the impact is
almost nil in Slovenia in the fi rst year, mainly
owing to a strong positive effect on investment
which only becomes negative from the second
year onwards. For Malta and Austria, the impact
on GDP declines in year three compared with
year two, owing to a diminishing investment
and private consumption effect. The latter could
be attributable to a relatively small downward
impact on real wages (see Chart 23). A possible
reason for the decline in the investment reaction
is that it is assumed interest rates remain the same
following the change in oil prices. Given that the
HICP increases because of the increase in oil
prices, real interest rates decline, thereby pushing
investment up. This effect seems to be somewhat
stronger in Malta and Austria than in the other
countries. In the case of Malta, the positive
contribution of net exports (refl ecting a larger fall
in imports) also has a signifi cant impact, mainly
because of the lagged effect on output growth
of lower consumption, investment and exports,
all of which have a high import content.
The large differences across countries in terms
of trade can partly be explained by the openness of the countries, where in particular the effect
on exports appears to be relatively strong for
smaller countries (see Chart 20). Furthermore,
different simulation results for exports can arise
from differences in the degree of oil import
dependence, price elasticity of oil demand,
energy intensity of production and the sectoral
and geographical decomposition of exports and
imports. An additional element to be considered
is that countries benefi t to a different extent
from the recycling of petrodollars (see Box 4),
which is not explicitly included in the simulation
results above.
Box 4
ENERGY PRICES AND EXTERNAL IMBALANCES
Energy products represent an important share of international trade. Chart A shows that in
the period of rising energy prices between 2003 and 2007 the energy balance of the euro area
countries, which are all net energy importers in nominal terms, deteriorated signifi cantly as
compared with the period between 1994 and 1998. In particular, the net external energy defi cit of
the euro area reached 2.1% of GDP. Chart B shows that the euro area energy external balance in
the period 2003-07 almost entirely offset the surplus in the non-energy external balance.
In this box we focus on two channels through which oil price changes affect the external
accounts of oil-importing countries in the short run. First, we consider the effects associated
with international trade. A rise in oil prices directly increases the cost of imported oil,
which constitutes an adverse shock to the terms of trade, thus decreasing the current account
balance – the direct trade effect.1 However, higher oil prices increase oil revenues and demand
for goods and services by oil exporters, leading in principle to higher foreign demand of
oil-importing countries and thus to increases in their current account balances – the indirect trade effect. Second, certain effects of oil price changes on the external balance are associated
with international fi nancial markets. As the domestic economies of oil exporters are heavily
1 The analysis and simulations exclude any trade volume and price changes owing to demand-side (real disposable income) or
supply-side (production costs) effects of an oil price increase on the current accounts of oil importers. In addition, exchange rate and
policy-induced changes are not accounted for.

46ECB
Occasional Paper No 113
June 2010
reliant on oil-producing industries, part of the additional oil revenues resulting from an increase
in oil prices is usually channelled into international fi nancial markets, either by purchasing
foreign assets (in the form of the accumulation of foreign exchange reserves and other cross-
border investments) or by repaying external debt.
The empirical evidence suggests that in past episodes, roughly half of the overall petrodollar
windfall gain was spent on foreign goods, while the remainder was invested in foreign assets.
Nevertheless, there are noticeable differences across countries. In the period between 2002
and 2006, estimates suggest that 41% of the increase in the euro area’s oil defi cit and 60% of the
increase in China’s oil bill were compensated for by higher purchases of domestically-produced
goods in the oil-exporting countries, as against only 20% for the United States and 18% for
Japan (Higgins et al. 2006). At the same time, OPEC countries have signifi cantly increased net
holdings of foreign assets as a percentage of GDP in recent years. Evidence suggests that the
bulk was invested in the United States.
The table below shows the results of a simple benchmark calculation of the combined direct and indirect trade channels for two variants of an oil price increase 2: an increase of roughly
40% (from 52 USD per barrel to 70 USD per barrel) and a stronger increase of 100%
2 The direct trade effect is simulated assuming inelastic oil demand in the short term (as documented in the literature, see for example
Hamilton 2009) and a proportional response of oil balances to the change in oil prices. The indirect trade effect assumes that exports by
oil-importing countries increase in line with the rising demand for imports by the oil-exporting countries (Norway, Russia and OPEC
members excluding Iraq). We assume that the increase in imports by oil-exporting countries is distributed according to the shares of oil
importers in those countries’ total goods imports.
Chart B Energy and non-energy external trade balances
(average 2003-2007; as a percentage of GDP)
-10
-8
-6
-4
-2
0
2
4
6
8
10
-10
-8
-6
-4
-2
0
2
4
6
8
10
energy external balance
non-energy external balance
external balance
1 2 3 4 5 6 7 8 9 10 11 12 13 14 15 16
1 BE/LU
2 DE
3 IE
4 GR
5 ES
6 FR
7 IT
8 AT
9 NL
10 PT
11 FI
12 EA12
13 UK
14 CH
15 US
16 JP
Source: Eurosystem staff calculations based on CHELEM data.Note: The euro area is based on data for the composition of 12 countries (EA12).
Chart A Energy external balance
(as a percentage of GDP)
-4
-3
-2
-1
0
1
-4
-3
-2
-1
0
1
1994-1998
2003-2007
1 2 3 4 5 6 7 8 9 10 11 12 13 14 15 16
1 BE/LU
2 DE
3 IE
4 GR
5 ES
6 FR
7 IT
8 AT
9 NL
10 PT
11 FI
12 EA12
13 UK
14 CH
15 US
16 JP
Source: Eurosystem staff calculations based on CHELEM data.Note: The euro area is based on data for the composition of 12 countries (EA12).

47ECB
Occasional Paper No 113
June 2010
2 THE IMPACT OF
ENERGY PRICES
ON ECONOMIC
ACTIVITY
(to 100 USD per barrel) in 2009. Results are shown for four alternative scenarios regarding the
extent to which petrodollars are recycled. These scenarios are 0%, 20%, 60% and 100%.3
The results of the simulations broadly confi rm the fi ndings of previous empirical research. First, as
would be expected, the largest net oil importers, i.e. the euro area and the United States, experience
the most pronounced deterioration in their oil balances in the short term (as illustrated by the fi rst
scenario in the table, which assumes no “oil bill recycling”, and thus captures only the direct effect
of higher oil prices). The deterioration ranges from 0.7% to 1.8% of GDP, depending on the size
of the change in oil prices. Second, the economies with the largest export activity towards the
oil-exporting countries, i.e. the euro area and China, signifi cantly benefi t from the indirect effect
of increased import demand by the oil exporters, although in most cases it only partly offsets
the negative direct effect. As long as the propensity of oil exporters to import does not change
in favour of more saving, euro area countries should therefore benefi t from higher exports to
oil-exporting economies.4 Geographical proximity to most major oil exporters and historical ties
seem to partly explain the closer trade links between euro area countries and oil exporters and the
relatively weaker export ties of the United States. Furthermore, the structure of import demand
from oil-exporting countries, largely determined by an infrastructure and construction-led pattern
of growth, seems to create a comparative advantage for those euro area countries that specialise
in the production of capital goods, such as Germany in transport equipment and machinery. The
euro area as a whole has been gaining import market shares in a number of oil-exporting countries
3 Exploratory estimates based on a panel of 12 oil-exporting countries over the period from 1980 to 2008 indicate that an increase in oil
prices tends to result in an increase in the imports of oil exporters amounting to around 60% of additional oil revenues. Therefore, the
scenario results are ordered according to the results based on this assumption.
4 The “marginal propensity to import out of oil revenues”, defi ned as the change in imports net of non-oil exports, investment income,
and transfers over the change in oil exports, seems to have decreased in most oil-exporting countries since the 1970s, but there is some
evidence that it has started to rise again more recently (see Beck and Kamps 2009).
Combined effect on current account
(as a percentage of GDP; change in oil-exporters’ import demand as a share of the increase in their oil export revenues (scenarios 1-4))
Scenario 10%
Scenario 220%
Scenario 360%
Scenario 4100%
70 $/bbl 100 $/bbl 70 $/bbl 100 $/bbl 70 $/bbl 100 $/bbl 70 $/bbl 100 $/bbl
Netherlands -0.1 -0.2 0.1 0.3 0.4 1.1 0.8 2.0
Ireland -0.2 -0.5 -0.1 -0.3 0.0 0.1 0.2 0.4
Italy -0.5 -1.2 -0.3 -0.9 -0.1 -0.3 0.1 0.3
Germany -0.7 -1.8 -0.5 -1.4 -0.3 -0.7 0.0 0.0
Finland -1.2 -3.1 -0.9 -2.4 -0.3 -0.9 0.2 0.6
Spain -0.5 -1.4 -0.5 -1.3 -0.4 -1.0 -0.3 -0.7
France -0.8 -2.0 -0.7 -1.8 -0.5 -1.4 -0.4 -1.0
Austria -0.8 -2.3 -0.7 -2.0 -0.5 -1.4 -0.3 -0.9
Slovakia -1.2 -3.3 -1.0 -2.7 -0.6 -1.7 -0.2 -0.6
Belgium -1.4 -3.7 -1.2 -3.2 -0.8 -2.2 -0.5 -1.3
Greece -1.0 -2.7 -1.0 -2.7 -0.9 -2.5 -0.9 -2.4
Portugal -1.4 -3.8 -1.3 -3.5 -1.1 -2.9 -0.9 -2.3
Cyprus -1.2 -3.3 -1.2 -3.2 -1.1 -3.0 -1.0 -2.8
Luxembourg -1.4 -3.7 -1.3 -3.6 -1.2 -3.3 -1.1 -3.0
Slovenia -1.9 -5.2 -1.8 -4.7 -1.4 -3.7 -1.0 -2.7
Malta -1.9 -5.1 -1.7 -4.6 -1.4 -3.8 -1.1 -2.9
Euro area -0.7 -1.8 -0.6 -1.5 -0.3 -0.9 -0.1 -0.4
United States -0.7 -1.8 -0.6 -1.7 -0.6 -1.6 -0.5 -1.4
China -0.4 -1.1 -0.3 -0.8 -0.1 -0.3 0.1 0.3
Sources: Eurosystem staff estimates based on the IMF World Economic Outlook and Direction of Trade Statistics.Note: Euro area countries are ranked in descending order based on the scenario of 70 USD/barrel and 60% change in oil-exporters’ import demand as a share of the increase in oil-exporters’ oil export revenues.

48ECB
Occasional Paper No 113
June 2010
Country variations in the model results can, in
addition to different model designs and
openness of the individual countries, also stem
from differences in the sector structure.33
As shown in the input-output table analysis in
Section 3.3.1, the most affected sectors were
chemicals manufacturing and transport services
(see also Knetsch and Molzahn 2009), which
have different weights in the production of
each country. Chart 24 shows that these most
energy-intensive sectors have a relatively large
share of gross output in the Netherlands and
Slovenia for the chemicals industry, Slovenia
and Slovakia, for basic metals, and Greece,
Italy, Slovakia and Finland for transport
services. At the same time, the chemicals sector
has a high energy intensity in the Netherlands
and Slovakia, while the energy intensity in the
basic metal industry is particularly high for
Greece, Austria and Slovakia, and in transport
services for the Netherlands, Portugal, Slovenia
and Slovakia (see Chart 25). In Greece, for
example, the high energy intensity of the basic
metal industry might partly explain the large
impact of a change in oil prices on investment,
while the impact on private consumption is
below the euro area average. It is to be noted
that the impact of energy prices on investment
can also be quite different depending on
whether the models differentiate between the
Berben et al. (2004) examine the reasons for differences in 33
the estimated transmission mechanisms across countries;
in particular the extent to which these are attributable to
differences in the underlying economies or in the modelling
strategies. They similarly fi nd that the cross-country variation in
results appears to be plausible in the sense that they correspond
to other evidence or characteristics of the economies considered.
Nevertheless modelling strategies are also likely to play a role.
over the last decade, noticeably in Algeria, Saudi Arabia, the United Arab Emirates and Russia.
In the scenario analysing the effect of an increase in the oil price to USD 70 per barrel – assuming
that oil exporters spend 60% of the increase in oil revenues on additional import demand – the
overall trade balances of countries such as Germany, Ireland, Italy, the Netherlands and Finland
are likely to respond less negatively to the increase in oil price, while countries with weaker
export ties with the oil exporters such as Cyprus, Luxembourg, Malta, Portugal and Slovenia
would seem to bear the highest costs in terms of current account deterioration owing to an oil
price hike. This fi nding differs from the simulation results described in the main text as the latter
does not explicitly take into account the effect of petrodollar recycling.
Chart 24 Share of most energy-intensive sectors in gross output
(percentages)
Chemical industry
0123456789
1011
01234567891011
euro
area
DE IE GR ES FR IT NL AT PT SI SK FI
Basic metals
0
1
2
3
4
5
6
7
0
1
2
3
4
5
6
7
euro
area
DE IE GR ES FR IT NL AT PT SI SK FI
Transport
0
1
2
3
4
5
6
7
8
9
0
1
2
3
4
5
6
7
8
9
euro
area
DE IE GR ES FR IT NL AT PT SI SK FI
Sources: Input-output tables from Eurostat and Eurosystem staff calculations.

49ECB
Occasional Paper No 113
June 2010
2 THE IMPACT OF
ENERGY PRICES
ON ECONOMIC
ACTIVITY
impact on energy investment (which should be
positive), and other investment.34
Results from an oil price scenario using dynamic stochastic general equilibrium models available
in the Eurosystem illustrate the role of
expectation formation and monetary policy.35
These models allow for the introduction of
expectations which are not included in the
traditional macro models described above. As a
result, economic agents in these models react to
expected future policy actions, so that the
specifi cation of the policy reaction, which was
assumed to be zero in the previous simulations,
is crucial.36 The GDP impact is negative
everywhere (see Table 4) but the results are
quite different from the results of the traditional
macroeconometric models described above, in
particular in the fi rst year, where the interest rate
reaction to stabilise infl ation implies a larger
reduction in output for all models, except the
one for the euro area. However, the differences
between the two types of models diminish over
time.
None of the above-mentioned models have
taken explicitly into account the possibility of
asymmetric effects of changes in oil prices (i.e. where oil price increases have a bigger
impact on the economy than oil price decreases).
This is an issue which has been extensively
discussed in the literature, although there is no
clear agreement on its existence. For example,
For example, Kilian (2008a) estimates investment equations for 34
these sub-sectors for the United States and fi nds a signifi cant
positive effect for the mining sector and a signifi cant negative
impact for residential investment. His results for total
non-residential investment (including mining) are not
signifi cantly different from zero.
Results are present for the NAWM, the Aino model of Suomen 35
Pankki – Finlands Bank, Banco de España’s BEMOD model
and a calibrated DSGE model of the Deutsche Bundesbank.
Furthermore, the exchange rate and world demand and prices 36
(except in both cases for the Finnish model) also react to the
shock. All models include a direct link between oil import
prices and domestic demand prices, defi ning shares of oil in the
demand components. Excise taxes also play a role in the models.
All models except the NAWM include some supply-side effects,
i.e. fi rms use oil in production. The elasticity of substitution is
either calibrated to different values or imprecisely estimated,
which may explain some of the differences in the results. Finally,
the way the shocks are implemented also differs across models
to some extent. The German model simulates a 10% increase
on imports, generated by a shock to global oil demand, with a
dampening down effect afterwards.
Chart 25 Share of energy expenditures in total expenditures for most energy-intensive sectors
(percentages)
Chemical industry
0
5
10
15
20
25
0
5
10
15
20
25
DE IE GR ES FR IT NL AT PT SI SK FI euro
area
Basic metal
0
2
4
6
8
10
12
0
2
4
6
8
10
12
DE IE GR ES FR IT NL AT PT SI SK FI euro
area
Transport
0
2
4
6
8
10
12
14
0
2
4
6
8
10
12
14
DE IE GR ES FR IT NL AT PT SI SK FI euro
area
Sources: Input-output tables from Eurostat and Eurosystem staff calculations.
Table 4 Effect of a 10% oil price increase on GDP (annual averages) according to DSGE models
(percentage deviation from baseline – cumulated)
Year 1 Year 2 Year 3
DE -0.89 -1.13 -0.55
ES -0.20 -0.23 -0.18
FI -0.53 -0.32 -0.23
Euro area -0.01 -0.07 -0.11
Source: Eurosystem staff calculations.Note: The results for Finland are based on a version of the Aino model including a Taylor rule.

50ECB
Occasional Paper No 113
June 2010
Mork (1989) and Balke et al. (2002) fi nd
evidence of a stronger impact of oil price
increases than declines on economic output in
the United States. Jiménez-Rodríguez and
Sánchez (2005) report similar asymmetric
effects for the euro area. For a comprehensive
overview of the literature see Kilian (2008b).
Kilian and Vigfusson (2009) attribute these
results to the fact that most authors have
introduced positive and negative oil price shocks
separately into their estimation models which
biases results in favour of asymmetries. Using
alternative estimation methods not subject to
this bias, they fi nd that the impact of oil prices
on activity in the United States does not yield
any signifi cant asymmetries. An application of
this method to the euro area similarly does not
suggest any asymmetry in oil price shocks.
The evidence is somewhat more mixed for
extreme oil price fl uctuations over a longer
horizon. However, this fi nding may also be
driven by the nature of the underlying oil
price shock.37
While the model results reported above assume
that the impact of oil prices on GDP growth
has not changed over time, other evidence
suggests that it has become more muted since
the 1990s compared with the 1970s. Blanchard
and Gali (2007) fi nd for Germany, France and
Italy a negative effect of oil prices on output
in the period 1970Q1 to 1983Q4, which
becomes (close to) zero for France and Italy
and positive for Germany in the period from
1984Q1 to 2005Q4. For the United States and
the United Kingdom, they fi nd that in the fi rst
period oil prices had a stronger negative effect
on output than in the second period. Replicating
a similar exercise for the euro area gives a
similar result, i.e. the effect is larger in the fi rst
sub-sample than in the second (see Annex 2.2).
Different arguments have been put forward
to explain this result. A key factor, as will be
shown in Section 3.3.2, is that since the 1990s
there seems to have been a decline in the
pass-through of oil prices to the HICP compared
with the 1970s and early 1980s. This decline is
attributable to a combination of sources. First,
labour markets and wage setting are more fl exible
today. Social partners have arguably learned
their lessons and assume their responsibility
to reduce second-round effects, even though
some wage indexation mechanisms yielding
second-round effects, are still in place in some
countries. Second, an important factor is that
monetary policy has focused more on anchoring
infl ation expectations. Third, the recent period
of generally low levels of infl ation has also been
attributed to globalisation.
In addition to the lower pass-through into wages
and prices, other factors may have contributed.
The lack of other adverse shocks occurring at
the same time as the oil price shock may also
have played a role (see Blanchard and Gali 2007
and Nakov and Pescatori 2009). Furthermore,
as discussed previously, the higher effi ciency in
the use of oil has dampened the impact of oil
price increases on the economy. Kilian (2008a)
fi nds evidence of a lower response of US
consumption to an energy price shock since the
end of the 1980s compared with the 1970s and
the beginning of the 1980s. He attributes this
mainly to the structure of the US automobile
sector which has moved to more energy effi cient
cars and was thereby less vulnerable to energy
price shocks over the second sample.
Finally, such results can also be related to the
differences in the factors underlying oil price
movements. While the oil price increases in
the 1970s were caused by supply disruptions,
the latest oil price increases have been, at least
initially, a response to strong oil demand,
particularly from emerging countries with high
and more energy-intensive growth (see Hicks
and Kilian 2009). As a result, the latest
increases in oil prices should have a more muted
effect on activity, as they are accompanied by
stronger world activity. In fact, Kilian (2009)
fi nds that supply shocks lead to a temporary
decline in GDP growth in the United States.
Aggregate demand shocks, i.e. higher oil
The evidence was kindly provided by Lutz Kilian in an 37
unpublished research memorandum entitled “The effects of oil
price shocks on euro area real GDP”.

51ECB
Occasional Paper No 113
June 2010
2 THE IMPACT OF
ENERGY PRICES
ON ECONOMIC
ACTIVITY
prices owing to higher aggregate activity, lead
to a very small positive effect in the fi rst four
quarters, while the increase in oil prices owing
to precautionary demand (increase in stocks)
leads to a permanent negative effect on GDP
growth. The different nature of oil price shocks
may have been a further reason why the oil
price increases observed in 2005 and 2007 were
more gradual. However, it should be noted that
this may have changed since the second half of
2007. Supply-side factors, such as heightened
geopolitical uncertainty and spare capacity
concerns played an increasing role in shaping
the last oil price hike (see Box 1 on drivers
of oil price developments). On this ground,
oil prices have made a material contribution to
the recent recession (see Hamilton 2009).
2.3 LONG-RUN IMPACT ON OUTPUT
This section discusses the macroeconomic
impact of a higher energy price on euro area
output in the long run. This issue is often also
addressed with a view to assessing the potential
output of the economy. It will be shown that the
impact of energy prices on long-run or potential
output depends very much on the substitutability
of energy by other means of production inputs
and on the energy effi ciency of production. In
economic models, these technological features
are represented in the macroeconomic production
function which, simply put, usually describes
total output in the economy as an outcome of the
combination of input factors, capital and labour,
and total factor productivity.38 In the model
reported below, energy is included as a further
production factor. The impact of a change in
energy prices then depends on the fl exibility of
the production process and nominal rigidities.
While nominal rigidities do not directly affect
the level of potential output in the very long run,
the extent to which prices and wages cannot
adjust swiftly makes a substantial difference to
the adjustment path of output after the energy
supply shock over a protracted period of time
and can impact on the overall functioning of the
economy.
Different economic models conclude that energy
price hikes have a negative impact on potential
output. This result emerges in a more traditional
production-function framework as well as in the
context of a DSGE model.39 The latter model-based
approach is followed here, in line with that
undertaken in Section 2.2, to analyse the short-term
effects of energy price changes. Furthermore, this
model-based approach enables a detailed analysis
of the infl uence of rigidities in price adjustment on
the economic adjustment process after an energy
price increase. Potential output in the DSGE
framework can be understood as the long-run level
of output, after short-term adjustments to shocks
have been absorbed – the so-called steady state of
output. Similar to the other exercises, results are
derived by introducing a permanent decrease in oil
supply, which implies a permanent 10% increase
in the relative price of energy, vis-à-vis the euro
area GDP defl ator. The long-run impact of the
energy price increase depends greatly on available
technology. Therefore, in order to illustrate the
importance of technological progress, the same
supply shock has been simulated with two variants
fi rst, allowing for a more fl exible production
process – captured technically by a higher elasticity
of substitution between energy and other factors of
production – and, second, where the energy
intensity of production is 15% lower. This refl ects
developments in euro area industry between 1990
and 2005 (see Section 1.2.2).
“Total factor productivity” is a “residual” item, which is often 38
referred to as the impact of technical progress on the production
process. In fact, it captures the impact of all the factors which are
not explicitly accounted for in the macroeconomic production
function, such as varying degrees of capacity utilisation,
structural changes in the institutional design of the economy, or
changes in the scarcity of input factors other than capital and
labour, and in many cases energy.
Estrada and Hernandez de Cos (2009) provide an example of 39
the production function approach. The model analysis presented
in the text is based on Jacquinot et al. 2009. The model is
calibrated to represent three regions, the euro area, energy-
producing countries and the rest of the world, as well as three
sectors, labelled tradable, non-tradable and energy sector. The
energy sector uses crude energy, capital and labour as inputs
to deliver refi ned energy. Refi ned energy, capital, labour and
imported goods are combined to produce tradable and non-
tradable intermediate goods. The latter serve as inputs to fi nal-
goods fi rms who produce investment goods and who combine
intermediate goods with refi ned energy to produce consumption
and export goods.

52ECB
Occasional Paper No 113
June 2010
After an energy supply shock resulting in a 10%
increase in energy prices, steady-state output in
the euro area falls by almost 0.1% compared
with the baseline scenario (see Table 5). The size
of the decline may appear insignifi cant at fi rst
sight. It should be considered, however, that the
calibrated increase in the energy price by 10% is
small by historical standards. Since the model is
close to linear, the effect of a supply shock
inducing an increase in the price of energy by
50% would infl ate the macroeconomic impact
by roughly a factor of fi ve. Furthermore, while
the impact of a supply shock on GDP calibrated
to increase the price by 10% appears limited,
this is not true for all the sub-components. Thus,
the fall in output results from considerable drops
in both the long-run capital stock (-0.3%) as
well as in consumption (-0.4%). The energy
share in the production cost increases by
0.1 percentage point, as energy can only be
imperfectly substituted by other production
inputs. The decline in consumption primarily
refl ects lower real wages. Despite lower real
wages, hours worked increase compared with
the baseline. This is attributable to the loss in
real income which forces households not only to
consume fewer goods, but also to spend less
time in leisure activity and hence to increase
their supply of labour services. In the new
equilibrium, exports in the euro area are
positively affected, mainly owing to the
recycling of the proceeds from energy accruing
to energy-producing countries, as well as
considerable worsening in the terms of trade 40.
The higher price of energy passes through to an
increase in the consumer price index of
around 0.3%.
However, general equilibrium outcomes of
demand-driven shocks differ substantially from
those induced by a reduction of energy supply as
considered in the current exercise. Simulations
with the same DSGE model assessing the impact
of a demand-driven increase in energy prices
resulted, owing to the offsetting effects of the
The terms of trade is defi ned as the ratio of import to export 40
prices, both expressed in domestic currency. An increase
corresponds to a deterioration of the terms of trade.
Table 5 Long-term macroeconomic effects of an energy supply shock in the euro area
Energy supply shock Higher elasticity of substitution 1) Lower energy intensity 2)
GDP -0.09 -0.05 -0.06
Real consumption -0.38 -0.19 -0.32
Capital -0.29 -0.14 -0.24
Energy cost share 3) 0.12 0.00 -0.04
Hours worked 0.10 0.06 0.09
Real wage -0.53 -0.26 -0.45
Real exports 0.96 0.41 0.85
Real imports -0.57 -0.33 -0.51
Price of energy 10.00 6.23 10.08
Price of output (GDP defl ator) 0.31 0.10 0.27
HICP 0.31 0.15 0.28
HICP ex-energy 0.09 0.04 0.08
Import prices 1.77 0.85 1.56
Imports ex-energy 0.19 0.09 0.17
Export prices 0.24 0.11 0.21
Terms of trade 1.53 0.74 1.36
Source: DSGE model simulation by Eurosystem staff.Note: This table indicates the steady-state effects on selected macroeconomic variables in the euro area of a permanent reduction in worldwide energy supply of around 2%. All effects are reported as percentage changes relative to the initial steady state. The details of the model are discussed in Jacquinot et al. 2009.1) Combined effects of a permanent reduction in energy supply of 2% and an increase in the elasticity of substitution from 0.2 to 1 between energy and other inputs to production.2) Combined effects of a permanent reduction in energy supply of 2% and an increase in the energy effi ciency of production. The increase in energy effi ciency has been calibrated consistent with a decline in energy intensity in the production of tradable and non-tradable goods of 15%.3) Change of the cost share of refi ned energy in intermediate production in percentage points. The cost share is calculated as a weighted average of nominal outputs in the tradable and non-tradable goods production sectors.

53ECB
Occasional Paper No 113
June 2010
2 THE IMPACT OF
ENERGY PRICES
ON ECONOMIC
ACTIVITY
related higher world demand, in a reduction of
output in the euro area. This reduction was only
around one-quarter of the size of the reduction
after a similar supply-driven increase in energy
prices. In more detail, the latter simulations
assumed a permanent increase in the productivity
of labour outside the euro area, which resulted in
higher global energy demand and, thus, higher
energy prices.41
The results illustrate the importance of
technological parameters, such as the ease
with which energy can be substituted by other
means of production and the energy intensity
of production.42 If the substitution of energy
with respect to other factors of production is
higher the adverse impact of the energy supply
shock on long-run output would be more
limited. For instance, increasing the elasticity
of substitution of energy to a value of one 43
would approximately halve the impact on real
macroeconomics variables. With such a high
elasticity of substitution, the energy cost share
in production would not change as energy can be
substituted relatively easily by other production
inputs in proportion to the increase in the price
of energy. A higher degree of effi ciency in the
use of energy in production would also mitigate
the adverse effects of higher oil prices, albeit to
a lesser extent. With energy costs in production
lowered by 15%, corresponding broadly to
the decline in energy intensity over the period
1985-2005 in the euro area, the impact of a
decline in energy supply reduces the impact of
the energy supply shock on real GDP by a factor
of two-thirds.
The above analysis shows that substitutability
of energy is a key element in the assessment of
the long-run impact of energy prices on output.
The elasticity of substitution between production
factors – especially between capital and
energy – has been discussed for a long time.
Reported elasticities in past studies are highly
variable and reveal an apparent dichotomy
between cross-sectional and time-series studies.
While the former suggests that capital and
energy are complements, the latter typically
estimate them to be substitutes.44 The now
commonly held view is that energy is not easily
substitutable. Results from a range of empirical
studies (see, for example, Van der Werf 2008,
Kemfert 1998, and Thompson and Taylor 1995)
suggest that the elasticity of substitution of
energy with respect to the other factors of
production is signifi cantly below 1.45 Since it is
hard to substitute away from energy, it is
important to advance technological change and
increase productivity in the long term to mitigate
the adverse impact of higher energy prices.
The dynamic adjustment of the economy to the
long-run steady state can be associated with
signifi cantly higher output losses owing to real
and nominal rigidities. In the model used in the
present analysis, prices and nominal wages are
assumed to adjust sluggishly owing to staggered
price setting and wage contracts. These realistic
model features can be used to assess the role
The fi ve-year average of the world market price index of 41
raw energy in the euro area between the years 2004-09
increased by almost 220% compared with the average over the
years 1995-99. According to the simulation results above, such
an increase in the energy price – if fully supply driven – would
imply a reduction of output of 2.0%. However, it should be kept
in mind that, fi rst, the increase in the price of energy took place
over a period of ten years and, second and more importantly, the
upward trend in energy prices observed in the recent past has not
only been supply driven. In particular, it refl ects to a substantial
extent the increase in world demand for energy in the wake of the
considerable expansion in economic activity in emerging market
economies. For an analysis of the impact of a temporary demand-
driven energy price shock see, e.g. Jacquinot et al. 2009.
Note that in all three scenarios it is the size of the energy supply 42
shock of -2% that is held constant whereas the price of energy
increases endogenously as a response to the supply shock in all
three scenarios. Compared with the fi rst scenario, the increase in
the steady state price of energy is lower in scenario two which,
in addition to the supply shock, assumes that energy can be
substituted more easily. Scenario three which, in addition to the
supply shock assumes a lower energy intensity of production,
yields an increase in the steady state price of energy broadly in
line with that in the fi rst scenario.
The elasticity of substitution measures the impact of a change 43
in the relative price of two factors of production on their ratio
in production – a value of one implies that energy can be well
substituted.
In a review of several studies, Thompson and Taylor (1995) 44
show that the dichotomy primarily derives from the different
approaches to measuring the elasticity of substitution.
Empirical evidence based on correlation analysis for a cross-45
section of countries of a negative link between oil prices and
investment is also provided in Estrada and Hernandez de Cos
(2009). However, they fi nd that this link weakened after the
mid-1980s, which might suggest some variation in the elasticity
of substitution, but can also be linked to other factors, such as
the type of oil price shock.

54ECB
Occasional Paper No 113
June 2010
of nominal rigidities on the adjustment of the
economy after an adverse shock in energy
supply. Chart 26 depicts the adjustment
dynamics of selected macroeconomic variables
in the euro area following a permanent decrease
in the energy supply in the rest of the world
under a regime of high and low fl exibility of
wages and prices in the euro area. If prices and
nominal wages can be adjusted more easily,
the adjustment of output to the new steady
state after the energy supply shock would be
smoother. In particular, the undershooting of
output under its new equilibrium value in the
initial phase would be avoided as real wages
Chart 26 The short-run domestic effect of less nominal wage rigidity in the euro area on the transmission of a permanent, exogenous negative shock to energy supply
(percentages)
unchanged nominal rigidity
less rigid prices and nominal wages
Real GDP Capital stock
-0.14
-0.12
-0.10
-0.08
-0.06
-0.04
-0.02
0.00
-0.14
-0.12
-0.10
-0.08
-0.06
-0.04
-0.02
0.00
2007 2009 2010 2012 2013 2015 2016 2018 2019-0.30
-0.25
-0.20
-0.15
-0.10
-0.05
0.00
-0.30
-0.25
-0.20
-0.15
-0.10
-0.05
0.00
2007 2009 2010 2012 2013 2015 2016 2018 2019
Hours worked Real consumption
-0.08
-0.06
-0.04
-0.02
0.00
0.02
0.04
0.06
0.08
0.10
-0.08
-0.06
-0.04
-0.02
0.00
0.02
0.04
0.06
0.08
0.10
2007 2009 2010 2012 2013 2015 2016 2018 2019 2007 2009 2010 2012 2013 2015 2016 2018 2019-0.40
-0.35
-0.30
-0.25
-0.20
-0.15
-0.10
-0.05
0.00
-0.40
-0.35
-0.30
-0.25
-0.20
-0.15
-0.10
-0.05
0.00
Real wages Energy used
-0.60
-0.50
-0.40
-0.30
-0.20
-0.10
0.00
-0.60
-0.50
-0.40
-0.30
-0.20
-0.10
0.00
2007 2009 2010 2012 2013 2015 2016 2018 2019
-1.20
-1.00
-0.80
-0.60
-0.40
-0.20
0.00
-1.20
-1.00
-0.80
-0.60
-0.40
-0.20
0.00
2007 2009 2010 2012 2013 2015 2016 2018 2019
Source: Eurosystem staff calculations.Notes: This chart depicts the adjustment dynamics of selected variables in the euro area following a permanent decrease in the energy supply in the rest of the world for high and low fl exibility of wages and prices in the euro area. With high fl exibility, a larger fraction of wages and prices can be adjusted optimally at a certain point of time. All dynamic effects are reported as percentage deviations from the initial steady state.

55ECB
Occasional Paper No 113
June 2010
2 THE IMPACT OF
ENERGY PRICES
ON ECONOMIC
ACTIVITY
would fall almost immediately and labour
supply – as a consequence of the negative
income effect − would rise faster. Furthermore,
the capital stock would be cut back in a more
gradual manner.
2.4 SUMMARY OF IMPACT ON OUTPUT
The impact of energy price changes on economic
activity depends on a number of factors,
including the nature of the shock, the functioning
of energy markets, the time frame considered and
the structure of the economy. Shocks to energy
supply may have a stronger impact on output,
and permanent shocks may have a larger effect.
In the short run, as the scope for adjustment is
limited, an increase in energy costs increases
fi rms’ costs and reduces households’ disposable
income. In the long run, changes in the relative
price of energy will lead to a substitution away
from energy products (either via a shift towards
other, less expensive, factors of production or via
technological change leading to reduced energy
intensity of production and consumption).
The empirical evidence from macroeconometric
models suggests that the overall impact on euro
area activity of a 10% increase in energy prices
is estimated to be -0.25% after three years,
but shows considerable heterogeneity across
countries (ranging from close to zero to 0.4%).
These differing effects are partly attributable to
structural differences in the countries, such as the
energy intensity of production or consumption,
the degree of nominal rigidities in the economy,
the sector structure, and their openness. Some
countries also benefi t more than others from
the recycling of petrodollars, thereby showing
a smaller deterioration in their external balance.
The impact of energy prices on activity may
have attenuated relative to that observed in the
1970s and early 1980s. This attenuation may
be attributable to the complex interaction of a
number of factors including the nature of the
underlying energy shocks, the lower energy
intensity of developed economies, changes in
wage-setting behaviour and the role of monetary
policy in stabilising infl ation expectations.
In addition to the short and medium-term
effects, energy price developments may also
impact output in the long run. Model estimates
suggest an impact of approximately 0.1% on
output in the long run. Such losses are higher
for the long-term level of consumption and
investment. A key element affecting the long-run
vulnerability of the economy to energy prices
is the substitutability of energy. The more
fl exible the economy in terms of substituting
relatively expensive energy sources, the less
vulnerable it is to energy price fl uctuations.
Moreover, wage and price rigidities exacerbate
the adjustment costs following an energy price
shock. In particular, the losses of output and
labour input into the production process will be
less pronounced if nominal changes allow for a
more speedy adjustment process.
When considering model-based estimates
of the impact of energy prices on economic
activity, it is important to bear in mind that
macroeconometric models are, by necessity,
simplifi cations of the underlying economic
structure. Even if model builders incorporate
expectations formation and (monetary or fi scal)
policy responses into their toolkit, these are
impossible to capture in their entirety and may
change over time. Thus the estimates reported
here should be considered as indicative rather
than precise results.

56ECB
Occasional Paper No 113
June 2010
3 THE IMPACT OF ENERGY PRICES
ON INFLATION
This chapter considers the economic impact of energy prices on infl ation, with the aim of identifying the determinants of the pass-through of energy prices and drawing policy conclusions on the structural determinants of infl ationary pressures stemming from energy price movements. The fi rst section provides a conceptual framework for guidance throughout the chapter. Then the direct pass-through of energy prices into liquid fuel and non-liquid fuel consumer prices and price level differences are assessed. Subsequently, the analysis elaborates on indirect and second-round effects. In this context, particular attention is paid to the role of infl ation expectation formation, which is discussed in more detail in a box.
3.1 CONCEPTUAL FRAMEWORK
A stylised overview of the main transmission
mechanisms through which oil prices impact on
consumer price developments is presented in
Chart 27. In terms of price effects, the impact of
energy price changes is often broken down into
direct and indirect fi rst and second-round
effects.46 The direct fi rst-round effects refer to the
impact of changes in primary energy prices
(e.g. oil and gas) on consumer energy prices.
The indirect fi rst-round effects refer to the impact
of changes in consumer prices that occur as
energy prices impact on producer and distribution
costs. An oil price increase can, for example,
affect through higher producer costs the prices of
goods which may include an energy-based input
(such as chemical goods) or of transport services
(such as aviation which have a signifi cant oil
input). Higher distribution costs can affect more
broadly other consumer prices. First-round
effects, either direct or indirect, of a one-off
increase in oil prices only generate a rise in the
price level, but no lasting infl ationary effects.
So-called second-round effects capture reactions
of wage and price-setters to the fi rst-round
effects (direct and indirect) of a price shock, in
an attempt to keep their real wages and profi ts,
respectively, unchanged. Second-round effects
magnify and extend the impact of energy
price movements. The impact on wages may
be further reinforced by additional upward
pressure on the price level. Employers, being
price-setters, will seek to pass rising labour costs
on to consumer prices to try to maintain the real
value of their profi ts, which are already penalised
by the higher input prices. These dynamics can
cause higher infl ation expectations to become
embedded in the economy’s wage and price-
setting processes, eventually endangering price
stability. This dynamic makes indirect fi rst and
second-round effects interdependent and often
diffi cult to disentangle empirically, but they
remain conceptually different.
This taxonomy of the breakdown of the pass-through of 46
oil prices into different effects is drawn from ECB (2004).
The terminology is not uniform in the literature. For example,
the Reserve Bank of New Zealand (2005) refers to the impact
of oil prices via the impact on activity as a third-round effect.
Esteves and Neves (2004) refer to terms-of-trade effects, whilst
Bernanke (2006) includes indirect effects as part of second-
round effects.
Chart 27 Stylised overview of energy price pass-through channels
First-roundeffects
Second-roundeffects
Indirecteffects
Directeffects
Trade
Financialmarkets
Confidence
Economicactivity
Additionalchannels
t-
Energy price (in EUR)
ffects
Inflationexpectations
nd
effects
Consumer prices
Wages/profits
Indirect
Producerprices
Source: Drawn from European Central Bank (2004).

57ECB
Occasional Paper No 113
June 2010
3 THE IMPACT
OF ENERGY PRICES
ON INFLATIONThe following sections fi rst consider the
direct effect of consumer liquid fuel prices
(i.e. transport – petrol and diesel – and
heating fuels), which generally are the most
rapidly affected by changes in global energy
commodity prices, and consumer prices of other
energy products (primarily gas and electricity).
The indirect and second-round effects are
assessed in subsequent sections. Given the
numerous ways that energy prices may work
their way through the production chain, three
alternative approaches (input-output tables,
small-scale econometric models, and large-
scale macroeconometric models) are considered
in order to cross-check the information from
each approach.
3.2 DIRECT FIRST-ROUND EFFECTS
3.2.1 CONSUMER LIQUID FUEL PRICES
Liquid fuel prices enter the HICP in two main
components – transport fuel and home heating
fuel. In 2009 liquid fuels accounted for a
substantial proportion (4.7%) of the overall
HICP in the euro area, with considerable
variation across countries (see Table A3 in
Annex 1). As HICP weights are based on total
expenditure, and are thus a function of both
volume and price, variations in the weight of
liquid fuel prices may refl ect a combination of
factors, including living standards, the degree
of car ownership and intensity of use, climatic
conditions and fuel tourism, as well as the
impact of taxes on fi nal consumer prices.
Given the strong increase in oil prices observed
over the last decade, unsurprisingly, the average
annual rate of change in HICP liquid fuel
prices since 1996, at 4.6%, was considerably
higher than the average overall HICP infl ation
rate (2.0%) (see Table 6). The average rate of
increase in home heating fuel, at 8.5%, was
even larger than that for transport fuel (3.9%).
Much of this difference, as well as the large
cross-country differences, is attributable to
differences in excise taxes. As excise taxes are
set as a value rather than as a percentage of the
price (as is the case with VAT), a higher level
of excise tax, whilst increasing the price level,
dampens the elasticity (percentage response) to
changes in oil prices.
HICP liquid fuel prices are among the most
volatile and variable items in the HICP basket.
The average standard deviations of month-
on-month changes in transport and home
heating fuels, at 2.4 and 4.9 percentage points
respectively, are substantially above that of
the overall HICP (0.3 percentage point non-
seasonally adjusted, and 0.2 percentage point
seasonally adjusted). Liquid fuel prices tend to
change more frequently with respect to other
sub-components of the HICP. Table A6 in
Annex 1 illustrates that, even when using the
Table 6 HICP liquid fuel components, weight, inflation and volatility
Weight(2009)
Average year-on-year rate of change (1996-2009)
Standard deviation (month-on-month, non-seasonally adjusted)
euro area
Min. Med. Max. euro area
Min. Med. Max. euro area
Min. Med. Max.
HICP 100.0 100.0 100.0 100.0 2.0 1.5 2.5 6.0 0.3 0.3 0.5 1.4
HICP excl. energy 90.4 83.7 89.7 93.5 1.8 1.2 2.3 4.8 0.3 0.2 0.5 1.4
Energy 9.6 6.5 10.3 16.3 3.9 3.1 4.6 13.8 1.5 1.2 2.0 3.7
Liquid fuels 4.7 2.4 4.8 8.5 4.6 3.2 4.8 7.2 2.7 2.0 3.1 3.8
Transport 4.0 2.4 3.9 7.7 3.9 2.9 4.4 6.8 2.4 2.0 2.9 3.5
Home heating 0.7 0.0 0.7 2.1 8.5 4.4 8.8 12.6 4.9 2.2 5.8 7.1
Sources: Eurostat and Eurosystem staff calculations.Notes: For detailed country data see Tables A3 to A6 in Annex 1. Euro area denotes the euro area average; min. denotes the minimum, med. the median and max. the maximum across the euro area countries.

58ECB
Occasional Paper No 113
June 2010
relatively aggregated HICP data, liquid fuel
prices changed almost every month in most euro
area countries over the period 1996-2009.47
In this section, data from the European
Commission’s (DG-TREN) weekly Oil Bulletin
are used to consider the pass-through of oil
prices to consumer liquid fuel prices and
compare their price levels across countries.48
Combining the Oil Bulletin data with
international market data on crude and refi ned
oil prices allows us to decompose the wedge
between crude oil prices and fi nal consumer
prices into three components: refi ning margins
and costs, distribution and retail margins and
costs, and taxes.
Looking at the evolution of the components
of liquid fuel prices between 1996 and 2008
(Chart 28) it can be seen that: (i) most of the
increase in liquid fuel prices observed in the
past decade can be attributed to crude oil prices,
which rose from 10 cent per litre in 1996 to
41 cent per litre in 2008, (ii) although refi ning
costs and margins have been relatively volatile
in recent years, increases have not persisted,
(iii) the contribution of distribution costs and
margins has not changed much over time and
(iv) taxes, which generally represent the largest
portion of fi nal prices (with the exception of
heating fuels), have risen by 18 cent in the
case of petrol and diesel prices and by 12 cent
The main exceptions being Greece (heating fuel), Cyprus, 47
Malta and Portugal. In the case of Cyprus and Portugal the low
frequency of price changes is attributable to previous pricing
regimes and the frequency of price changes in the more recent
period is in line with the euro area pattern. The relatively high
frequency of price changes of oil energy products has also
been noted by Dhyne et al. (2006) using micro-level price data
as part of the Eurosystem Infl ation Persistence Network (IPN)
research project. They fi nd that the frequency of price changes
of oil energy products is 78% (i.e. 78% of prices for oil energy
products change every month), which compares to a frequency
of 28% for unprocessed food, 14% for processed food, 9% for
non-energy industrial goods and 6% for services items.
The Oil Bulletin data have features that make them suited to 48
this purpose: they are available for all euro area countries, at
a weekly frequency, with data on actual prices including and
excluding taxes. Importantly, although the Oil Bulletin data are
not collected to the same high standards as the HICP data, they
co-move quite closely (see Annex 2.3) suggesting that they could
be used for a deeper analysis of liquid fuel price developments.
Furthermore, the availability of both petrol and diesel prices
from the Oil Bulletin is particularly useful, especially in view
of the growing penetration of diesel cars in the overall passenger
car stock in Europe and in view of the strongly differing
evolution of gasoline/petrol and gasoil/diesel refi ning margins
in recent years.
Chart 28 Breakdown of consumer liquid fuel prices
(euro cent/litre, left-hand scale; percentages, right-hand scale)
0
30
60
90
120
150
0
20
40
60
80
100
petrol diesel heating oil
crude oil contribution (%)
refining cost/margin contribution (%)
taxes contribution (%)
distribution cost/margin contribution (%)
crude oil (c/l)
refining cost/margin (c/l)
taxes (c/l)
distribution cost/margin (c/l)
1994 1997 2000 2003 2006 2009 1994 1997 2000 2003 2006 2009 1994 1997 2000 2003 2006 2009
Sources: Eurostat and Eurosystem staff calculations.Note: Series in chart are cumulated starting with crude oil, then refi ning costs/margins, taxes and lastly distribution costs/margins.

59ECB
Occasional Paper No 113
June 2010
3 THE IMPACT
OF ENERGY PRICES
ON INFLATIONin the case of heating oil. Around half of these
increases were attributable to explicit changes
in excise duties, and the other half to automatic
changes in the VAT component in the face of
broadly unchanged VAT rates.49
ANALYSIS OF OIL PRICE PASS-THROUGH
INTO CONSUMER LIQUID FUEL PRICES
The following analysis focuses on developments
between refi ned prices and consumer prices
excluding taxes. It does not explicitly consider
developments in refi ning costs and margins
because fi rst, one may observe refi ned and
crude oil prices simultaneously in real time, and
second, as petroleum markets are global, refi ning
margins are most likely to be driven by global
factors rather than euro area or specifi c country
ones. Furthermore, the gap between pre-tax and
post-tax prices is not considered, as it is fully
determined by excise and VAT rates.50
The relative stability of distribution costs and
margins suggests that the pass-through should
be modelled in terms of absolute levels. Table 7
shows the amount and speed of pass-through
from refi ned oil prices to consumer prices
(excluding tax) for petrol in each country.51
At the euro area level, the amount of pass-
through is generally 100% (i.e. a 10 cent per
litre increase in refi ned oil prices results in more
or less a 10 cent per litre increase in consumer
prices before taxes). Furthermore, the speed of
pass-through is generally quite rapid, with 50%
being passed through within two weeks, and 90%
within three to six-weeks.52 For example, given
a 10 cent increase in refi ned oil prices, consumer
petrol prices increase by 6.0 cent within two
weeks, and by 9.3 cent within fi ve weeks.
The results on the pass-through for heating
fuel are broadly of the same pattern as those
for consumer petrol prices (see Table A12).
The pass-through for diesel prices, if anything,
appears even more rapid.
Considering individual country developments,
it is clear that this pattern is generally shared
by most countries.53 The pass-through to petrol
prices seems to be the quickest in Belgium,
Germany, Luxembourg and the Netherlands,
possibly refl ecting the fact that the refi ned
prices considered in the analysis above include
delivery to Rotterdam (i.e. the north-west
Europe region).54 Using Mediterranean prices
would perhaps provide a faster pass-through for
the Mediterranean countries.55
Regarding the question of whether the pass-
through has changed over time, estimates
over the entire time period for which data
are available, 1994-2008, as well as for a
number of different sub-samples (1994-99,
2000-08 and 2005-08) confi rm that the results
are largely unchanged regardless of the
estimation period.
With respect to the issue of whether there is
asymmetry in the response of pre-tax prices to
refi ned oil price changes (i.e. whether consumer
prices change by more or more quickly when
refi ned prices rise than when they fall), there is
little in the way of economically meaningful
asymmetry between the pass-through of
upstream price increases and decreases for the
euro area as an aggregate (see Table A17 in
Annex 2.4).56 Recent evidence provided by
Venditti (2010) on the four largest euro area
countries also suggests that the role of
As VAT is levied as a percentage of the selling price, an increase 49
in the pre-VAT selling price results in an increase in the amount
of VAT charged even if the VAT rate remains unchanged.
Although taxes are an important component of fi nal prices, they 50
are not modelled in the econometric analysis of the pass-through
as they are likely to be driven by government policies.
For a description of the methodology employed, see Annex 2.4.51
One feature of the weekly Oil Bulletin data may mean that the 52
estimated speed of pass-through is slightly understated. This is
because most, although not all, countries collect the data on a
Monday. However, Asplund et al (2000) fi nd that fewer price
changes are made on Mondays. Their explanation is that the
Rotterdam markets are closed over the weekend and thus any
new information that may have arrived up to the Monday is not
normally implemented until the following day.
The results for Ireland are affected by the fact that only monthly 53
average data are provided.
Rotterdam (north-west Europe or Amsterdam, Rotterdam and 54
Antwerp – ARA) prices are considered to be the benchmark
for Europe. Rotterdam is by far the biggest liquid bulk port in
Europe (see European Sea Ports Organisation – ESPO 2008).
The relatively low pass-through for Portugal may refl ect the fact 55
that full liberalisation of the liquid fuel market occurred only
in 2004.
In a small number of instances, statistically signifi cant evidence 56
of asymmetry is found; when it is quantifi ed the asymmetry
effect is marginal.

60ECB
Occasional Paper No 113
June 2010
non-linearity in the adjustment of gasoline
prices is negligible. The results and analysis
here are also broadly consistent with Rodrigues
(2009), who fi nds evidence of asymmetry in the
“international” channel (i.e. the refi ning stage in
our analysis), but only sporadic instances in the
“domestic” channel (i.e. the distribution and
retailing stage in our analysis).
In summary, the pass-through of oil prices
into consumer liquid fuel prices appears to be
complete and relatively quick, with little evidence
of substantial asymmetries – these results hold
generally across most euro area countries.
ANALYSIS OF CONSUMER LIQUID FUEL
PRICE LEVELS
Although liquid fuels are relatively homogeneous
and tradable goods, the levels of their consumer
prices appear to differ somewhat across euro
area economies. Chart 29 reports prices,
including and excluding taxes, for petrol, diesel
and heating fuel across the euro area countries
on average in 2009.57 According to these data,
consumers in Cyprus, Greece and Spain paid the
least for one litre of petrol in 2009 (€0.88, €1.00
and €1.01 respectively). By contrast, Dutch,
Finnish and German consumers paid the highest
prices (€1.35, €1.28 and €1.27 respectively).
Price level differences across countries can arise
from tax differences as well as from differences
in costs and margins which, in turn, may be
related to the degree of market concentration.
By far, the largest part of the discrepancies in
levels can be attributed to indirect taxes: the
A possible caveat to using Oil Bulletin data from the European 57
Commission is that data compilation methods have not been
unifi ed. As the discrepancies in pre-tax price levels across
countries are small (especially in proportion to price volatility),
this could also be a relevant factor in explaining the differences
in level observed.
Table 7 Pass-through rates by product and country
(euro cent)
Week 1 Week 2 Week 3 Week 4 Week 5 Week 6 Week 7 Week 8 Week 9 Week 10 Week 11 Week 12
Euro area
1.9(1.5;2.3)
6.0(5.5;6.4)
7.5(7.0;8.0)
8.4(7.9;8.4)
9.3(8.8;9.7)
9.3(8.8;9.8)
9.5(9.1;10.0)
9.7(9.2;10.2)
9.9(9.4;10.4)
9.9(9.4;10.4)
9.9(9.4;10.4)
9.9(9.5;10.3)
BE 1.8
(0.9;2.8)
7.6(6.7;8.7)
8.7
(7.8;9.7)
9.5
(8.5;10.6)
9.8
(8.8;10.8)
9.8
(8.8;10.8)
10.6
(9.6;11.7)
9.9
(8.9;10.9)
9.3
(8.3;10.4)
9.5
(8.8;10.3)
9.9
(9.3;10.6)
10.0
(9.4;10.5)
DE 1.9
(1.0;2.7)
7.4(6.4;8.3)
8.8
(7.9;9.8)
9.7
(8.8;10.6)
10.6
(9.7;11.6)
10.0
(9.1;10.9)
9.8
(8.9;10.7)
10.2
(9.2;11.2)
10.3
(9.3;11.3)
10.2
(9.4;11.0)
10.1
(9.4;10.7)
10.1
(9.5;10.6)
IE 1.2
(0.1;2.1)
0.7
(-0.6;1.8)
1.5
(0.1;2.7)
1.9
(0.5;3.2)
2.2
(0.9;3.5)
2.7
(1.3;4.1)
3.2
(1.7;4.6)
4.2
(2.7;5.7)
5.3
(3.9;6.7)
6.2
(4.9;7.5)
6.9
(5.8;8.1)
7.6
(6.5;8.9)
GR 1.2
(0.6;1.7)
6.2(5.6;6.9)
8.6
(7.9;9.3)
9.7
(9.0;10.3)
10.0 10.2
(9.6;10.9)
10.3
(9.6;11.0)
10.3
(9.6;11.0)
10.4
(9.7;11.1)
9.9
(9.3;10.6)
9.8
(9.2;10.4)
9.9
(9.4;10.4)(9.4;10.7)
ES 1.6
(1.3;2.0)
4.5
(4.0;4.9)
6.2(5.7;6.7)
7.7
(7.1;8.2)
8.6
(8.0;9.2)
9.1
(8.5;9.7)
9.3
(8.6;9.9)
9.6
(9.0;10.2)
9.7
(9.1;10.3)
9.8
(9.2;10.4)
9.8
(9.2;10.4)
9.8
(9.2;10.4)
FR 1.6
(1.2;2.0)
6.1(5.6;6.6)
8.0
(7.5;8.6)
8.9
(8.4;9.5)
9.6
(9.0;10.2)
9.6
(8.9;10.2)
9.6
(8.9;10.2)
9.7
(9.1;10.3)
10.1
(9.4;10.7)
10.0
(9.3;10.8)
9.9
(9.2;10.7)
9.9
(9.3;10.7)
IT 1.4
(1.0;1.8)
4.7
(4.1;5.2)
6.5(5.9;7.0)
7.5
(6.8;8.1)
8.6
(7.9;9.2)
8.9
(8.1;9.6)
9.7
(9.0;10.3)
9.5
(8.8;10.2)
9.8
(9.0;10.5)
9.6
(9.0;10.3)
9.7
(9.1;10.4)
9.7
(9.2;10.4)
LU 2.5
(1.8;3.1)
8.5(7.9;9.0)
9.5
(8.9;10.1)
9.8
(9.2;10.5)
10.7
(10.1;11.3)
10.4
(9.8;11.1)
10.3
(9.7;10.9)
10.0
(9.4;10.6)
10.4
(9.8;11.0)
10.4
(9.9;10.8)
10.3
(10.0;10.6)
10.3
(10.0;10.5)
NL 5.8(5.2;6.5)
9.9
(9.2;10.6)
10.6
(9.9;11.3)
10.5
(9.7;11.2)
11.0
(10.3;11.7)
10.3
(9.6;11.0)
10.1
(9.4;10.9)
10.6
(9.9;11.4)
10.4
(9.6;11.2)
10.7
(10.0;11.4)
10.6
(10.1;11.2)
10.6
(10.1;11.1)
AT 1.2
(0.6;1.8)
5.0(4.3;5.8)
6.4
(5.6;7.3)
7.5
(6.6;8.4)
8.3
(7.3;9.1)
8.6
(7.8;9.5)
8.9
(8.1;9.8)
9.1
(8.3;10.0)
9.3
(8.4;10.2)
9.5
(8.6;10.3)
9.4
(8.5;10.2)
9.3
(8.5;10.1)
PT 0.3
(-0.6;1.2)
1.3
(0.2;2.4)
2.7
(1.4;4.1)
4.5
(3.1;6.0)
6.2(4.7;7.8)
7.5
(5.9;9.1)
7.4
(5.6;9.1)
7.7
(5.8;9.7)
8.3
(6.3;10.4)
8.7
(6.6;10.8)
9.0
(6.9;11.3)
9.1
(7.0;11.5)
FI 3.3
(2.1;4.6)
5.6(4.2;7.2)
5.0
(3.4;6.4)
4.8
(3.2;6.5)
6.2
(4.7;7.7)
7.1
(5.4;8.6)
9.0
(7.3;10.5)
10.6
(9.1;12.3)
10.1
(8.5;11.7)
9.6
(8.3;10.8)
9.5
(8.3;10.8)
9.2
(8.0;10.6)
Source: Eurosystem staff calculations.Notes: Figures underlined and in italics denote 50% pass-through reached. Figures underlined denote 90% pass-through reached. Figures in parenthesis represent the 99% confi dence intervals calculated using bootstrap techniques (10,000 iterations). Results on pass-through for the latest members of the euro area (Cyprus, Malta, Slovenia and Slovakia) were not estimated as data are only available from 2005.

61ECB
Occasional Paper No 113
June 2010
3 THE IMPACT
OF ENERGY PRICES
ON INFLATION
unweighted standard deviation of consumer
prices excluding taxes was €0.03 in 2009,
compared with a standard deviation of €0.13
including taxes.58 An interesting feature of euro
area prices across countries is that, despite VAT
rates of around 20% on average levied on the
pre-tax price plus excise, there is no correlation
between prices including and excluding taxes.
An additional feature of cross-country price
differences is their relative stability in that the
ranking of price levels has varied little since the
mid-1990s. The lack of correlation is attributable
to the fact that countries with lower pre-tax
prices have higher indirect taxes (both VAT and
excise). Rietveld and Van Woudenberg (2005),
for example, fi nd the pattern that small countries
tend to be more aggressive with indirect taxes.
However, they do not address other sources of
differences in pre-tax prices.
The literature on energy markets mentions a
number of factors that shape the costs of
companies operating in liquid fuel markets.
Differences among these could therefore lead to
price differentials.59 Costs can be expected to
lower with: (i) the size and density of the market,
(ii) the availability of a pipeline infrastructure
for transporting oil as the marginal cost of
transporting liquid fuels by pipeline is much
lower than by road, rail or water, (iii) the country
refi ning capacity and (iv) the effi ciency of the
distribution sector (measured either in terms of
turnover per station, or use of self-service vs.
manned pumps and the prevalence of
cross-selling other non-petroleum products). In
turn, costs tend to increase with: (i) the distance
from Rotterdam, the most important port for the
shipping of crude and refi ned petroleum products
and (ii) the level of income or the general price
level as fi nal liquid fuel prices also incorporate
costs of non-tradable services, such as rents or
labour costs.
See also Arpa et al. 2006 for an overview of cross-country 58
price differences. It should be noted that the differences across
country averages may be much lower than differences within
countries. For example, in a study of Irish transport fuel prices,
the National Consumer Agency (2008) found differences of up
to 15 cent per litre between the maximum and minimum prices
of petrol and diesel.
See, for example, the Australian Competition and Consumer 59
Commission – ACCC 2007, Bello and Cavero 2008,
Contín-Pilart et al. 2001, Nomisma Energy 2007, and Van
Meerbeeck 2003. Bello and Cavero (2008) consider a number
of these indicators in their detailed study of the Spanish gasoline
market. More specifi cally, they fi nd signifi cant relationships
between prices and market power, station density, distance from
refi neries, income levels and the degree of cross-selling.
Chart 29 Cross-country comparison of liquid fuel prices in 2009
(in euro cent/litre)
excluding taxes
taxes
(a) Petrol
0
20
40
60
80
100
120
140
160
0
20
40
60
80
100
120
140
160
1 2 3 4 5 6 7 8 9 10 11 12 13 14 15 16 17
(b) Diesel
0
20
40
60
80
100
120
140
160
0
20
40
60
80
100
120
140
160
1 2 3 4 5 6 7 8 9 10 11 12 13 14 15 16 17
(c) Heating fuel
0
20
40
60
80
100
120
140
160
0
20
40
60
80
100
120
140
160
1 2 3 4 5 6 7 8 9 10 11 12 13 14 15 16 17
1 BE
2 DE
3 IE
4 GR
5 ES
6 FR
7 IT
8 CY
9 LU
10 MT
11 NL
12 AT
13 PT
14 SI
15 SK
17 euro area
16 FI
Sources: European Commission (DG-TREN) and Eurosystem staff calculations.

62ECB
Occasional Paper No 113
June 2010
Margins depend on the level of competition,
price regulation and scale effects. As already
mentioned (see Section 1.3.2) understanding
effective competition in the liquid fuel market
is complicated by the fact that, although there
is a very large number of individual stations,
there is a relatively small number of large-scale
retailer chains, who tend to be vertically
integrated. On this point, some of the indicators
mentioned before capture how competition
impacts on price levels, such as: (i) the degree
of market concentration, as measured by the
market share of the three largest companies
and (ii) competition from supermarkets
Chart 30 Bivariate charts of petrol prices (excluding taxes) with various indicators
Excise taxes Distance from Rotterdam
BE
DE
IE
GR
ES
FR IT
CY
LU
MT
NL
AT
PT
SI
SK
FI
275
325
375
425
475
525
575
625
675
725
275
325
375
425
475
525
575
625
675
725
620500 520 540 560 580 600
FI
SK
PT
AT
NL
MT
LU
CY
IT
FR
ES
GR
IE
DE
BE0
500
1,000
1,500
2,000
2,500
3,000
3,500
0
500
1,000
1,500
2,000
2,500
3,000
3,500
620500 520 540 560 580 600
SI
Petrol stations per capita Sales per petrol station
620500 520 540 560 580 600
FI
SKSI
PT
AT
NL
MT
LU
CYIT
FR
ES
GR
IE
DE
BE
0
100
200
300
400
500
600
700
800
0
100
200
300
400
500
600
700
800
FIAT
NL
LU
IT
FRES
GR
IE
DE
BE
0
500
1,000
1,500
2,000
2,500
3,000
3,500
0
500
1,000
1,500
2,000
2,500
3,000
3,500
620500 520 540 560 580 600
Share of self-service stations Degree of cross-selling
FI
AT
NL
LU
IT
FR
ES
GR
IE
DE
BE
0
20
40
60
80
100
120
0
20
40
60
80
100
120
620500 520 540 560 580 600
PT
AT
NL
IT
FRES
IEDE
BE
0
5
10
15
20
25
30
35
40
0
5
10
15
20
25
30
35
40
620500 520 540 560 580 600
Sources: European Commission, various national sources and Eurosystem staff calculations.Notes: Consumer petrol prices (euro cent/litre), excluding taxes, in 2008 are shown on the horizontal axes. The variable shown on the vertical axes is given by the chart title.

63ECB
Occasional Paper No 113
June 2010
3 THE IMPACT
OF ENERGY PRICES
ON INFLATIONwhich can rely either on scale economies or
loss-leading on a “known-value item”, such as
petrol, to attract customers. In addition, other
elements capturing competition and economies
of scale effects include: (i) whether fuel tourism
is an issue, (ii) density either in terms of petrol
stations per capita or population density and
(iii) the intensity of car use, which could
increase price monitoring efforts.
Euro area markets are extremely heterogeneous
in terms of market characteristics, not only with
regard to competition structures as shown in
Section 1.3.2, but also cost factors and
economies of scale. Table A11 presents some
of these structural indicators. Countries
characterised by relatively low pre-tax petrol
prices, such as Germany and France, have a
higher percentage of self-service stations, fewer
service stations per capita (and consequently a
higher sales volume per petrol station), a high
number of refi neries, and either a high degree of
cross-selling (as in Germany) or heavy
competition from supermarkets (as in France).
Countries where pre-tax prices are relatively
high, such as Italy 60 and Greece, show a much
more fragmented distribution sector (with a
consequently lower sales volume per petrol
station), as well as a percentage of self-service
stations and a degree of cross-selling well below
the average.
An illustration of the relationship between
structural indicators and liquid fuel prices is
provided by bivariate charts (see Charts A9 – A11
in Annex 1 for an overview). The limited number
of observations (a maximum of sixteen) does
not allow for more precise methods although
the link between market structure and prices is
obviously complex and multi-dimensional. Many
of these relationships have the expected sign for
indicators of effi ciency (such as sales per petrol
station or the number of petrol stations per capita)
and competition from supermarkets, as well as
for indicators of self-service pumps and cross-
selling, for which the link seems to be fairly strong.
The distance from Rotterdam also has a strong
and positive relationship with liquid fuel prices
(see Chart 30). Thus, although differences in
pre-tax transport fuel prices across the euro area
are relatively small, they do appear to be linked
to some degree to structural features of individual
country markets. The results for petrol and diesel
prices are broadly similar. Those for heating
fuel are quite distinct. However, this market is
substantially different in nature from the transport
fuel market.
Nomisma (2007) analyses Italian liquid fuel prices, which 60
have tended to be above the EU average, and ascribes this to
a combination of factors including the high degree of manned
petrol stations, relatively limited cross-selling of non-fuel
products, road density and limited competition, in particular
from supermarket retailers.
Box 5
MICRO EVIDENCE ON TRANSPORT FUEL PRICES IN FRANCE
Here we consider detailed micro data on transport fuel prices in France, using a unique dataset
comprising 8.5 million daily individual price quotes from 1 January 2007 to 31 May 2009 drawn
from over 10,000 retail stations.1 To assess the degree of price rigidity, some basic indicators are
calculated, such as the duration of prices and the frequency of price changes. Each day around
20% of gasoline prices are modifi ed (19.2% for diesel and 17.9% for petrol) with implied average
price durations ranging from fi ve to six days. Chart A plots the price duration distributions for
diesel and petrol. About one-fi fth of prices last exactly one day, with less than 20% of prices
lasting more than one week. Price duration distributions are very similar for petrol and diesel.
Chart B shows the hazard rate of diesel and petrol prices (i.e. the proportion of prices which are
1 The dataset consists of individual prices collected by the French Ministry of the Economy, Industry and Employment in petrol stations
selling more than 500 m3 of gasoline per year (see Gautier and Le Saout 2009).

64ECB
Occasional Paper No 113
June 2010
3.2.2 CONSUMER NON-OIL ENERGY PRICES
Non-oil energy prices enter the HICP in four
sub-components – electricity, gas, heat energy
and solid fuels.61 These items are used primarily
for home heating and other domestic purposes
such as cooking and appliances. Gas and solid
fuels are generally consumed in their primary
state without secondary production, whereas
electricity and heat energy are usually derived
from a primary source of energy which is then
transformed.
Non-oil energy prices accounted for 4.8%
of the overall HICP in the euro area in 2009
(see Table 8). However, the range across
euro area countries is quite large, from 1.5%
in Greece to 13.9% in Slovakia (see Table A7
Heat energy is mainly hot water and steam purchased from 61
district heating plants, but also includes associated expenditure
such as the hire of meters, reading of meters, standing charges,
as well as ice used for cooling and refrigeration purposes. Solid
fuels include coal, coke, briquettes, fi rewood, charcoal and peat.
modifi ed against those which have not been changed for X days). Peaks at seven, 14 and 21 days
reveal strong, time-dependent patterns in gasoline price re-settings.
Price durations display some heterogeneity along three dimensions. First, price durations are
shorter in stations where prices are low (on average every fi ve days) and longer in stations where
prices are higher than the median price (on average every six days).2 Second, price durations
were much shorter during the sharp decrease in oil prices (end-2008): on average around 4.5 days
between July and December 2008 compared with 5.5 days outside this period. Third, prices are
more likely to be modifi ed on a Friday (around 21% of all price changes) and Tuesday (19% of
all price changes) and are less likely to be changed during the weekend (12.5% on Saturdays and
less than 1% on Sundays). Lastly, there is some evidence that the probability of price changes
increases the further away the actual prices are from their reference prices (generally refi ned
products sold in Rotterdam).
Overall, the results from these French micro data are consistent with and complement the more
aggregated, but cross-country, data presented earlier – in particular the fi ndings on the high
frequency of price changes, the lack of substantial asymmetry, and the competitive impact of
independent (supermarket) retailers.
2 This may refl ect some differences in the number of opening days per week.
Chart B Hazard rates of gasoline prices
(in days; percentages)
0.10
0.12
0.14
0.16
0.18
0.20
0.22
0.24
0.26
0.28
0.10
0.12
0.14
0.16
0.18
0.20
0.22
0.24
0.26
0.28
diesel
petrol
1 3 5 7 9 11 13 15 17 19 21 23
Source: Eurosystem staff calculations.
Chart A Distribution of price durations
(in days; percentages)
0
5
10
15
20
0
5
10
15
20
diesel
petrol
1 3 5 7 9 11 13 15 17 19 21 23
Source: Eurosystem staff calculations.

65ECB
Occasional Paper No 113
June 2010
3 THE IMPACT
OF ENERGY PRICES
ON INFLATION
in Annex 1). Electricity and gas are by far the
most important components, with average
weights of 2.3% and 1.8% respectively. The
average euro area weights of heat energy
and solid fuels are much lower at 0.6% and
0.1% respectively.
Like liquid fuel prices, non-oil energy prices
have also risen by more than the overall average
infl ation rate over the period 1996 2009 –
by 3.5% vs. 2.0%. Gas and heat energy
prices experienced the strongest increases
at 5.5% and 5.8% respectively, whereas
electricity prices have risen on average by the
same amount as the HICP excluding energy
(i.e. 1.8% per annum). The cross-country range
of average price increases was much larger for
non-oil energy than for liquid fuel prices. By far
the strongest average annual rate of increase was
in Slovakia, at 16.5%, with the lowest average
increase recorded in France at 1.7% – see Table
A8 in Annex 1. The relatively low average rate
of increase in France primarily refl ects relatively
subdued electricity prices.
Relative to liquid fuel prices, non-oil energy
prices tend to be much less volatile and change
less frequently. The average standard deviation
of month-on-month changes in non-oil energy
prices, at 0.7 percentage point, was substantially
lower than for liquid fuels (2.7 percentage
points). Electricity prices change, on average,
every four months, against an average of one
and a half months for gas prices.
ANALYSIS OF PASS-THROUGH INTO CONSUMER
GAS AND ELECTRICITY PRICES 62
A key and well-known feature of natural gas prices is their strong co-movement with crude oil
prices (see, for example, Brown and Yücel 2009
and 2007, Bachmeier and Griffi n 2006 and
Villar and Joutz 2006). This mainly refl ects:
(i) the substitutability of, and competition
between, gas and oil for certain purposes such
as electricity generation and (ii) institutional
arrangements whereby many long-term gas
supply contracts are explicitly linked to oil
prices.63 The latter is a crucial determinant of
co-movements in gas prices since gas, being less
storable and shippable than oil, is still transmitted
by pipeline. 64 Thus, in the absence of explicit
indexing on oil prices, regional supply and
demand developments will have more impact on
gas price movements. Chart 31 shows the
evolution of crude oil prices and border prices
The analysis is based on Eurostat price level data. A detailed 62
discussion of this data source is presented in Annex 2.5.
For an economic analysis of the oil price indexing of natural gas 63
see, for example, Bartholomae and Morasch 2007.
The emergence of liquefi ed natural gas may diminish somewhat 64
the regional nature of gas markets. However, the costs of
transport mean that regional markets may remain rather
fragmented, particularly in comparison with liquid fuel markets.
See Neumann 2009 for a discussion on the impact of LNG on
the linking of natural gas markets.
Table 8 HICP non-oil energy components, weight, inflation and volatility
Weight(2009)
Year-on-year rate of change (1996-2009)
Standard deviation; month on month; non-seasonally adjusted
euro area Min. Med. Max.
euro area Min. Med. Max.
euro area Min. Med. Max.
HICP 100.0 100.0 100.0 100.0 2.0 1.5 2.5 6.0 0.3 0.3 0.5 1.4
HICP excl. energy 90.4 83.7 89.7 93.5 1.8 1.2 2.3 4.8 0.3 0.2 0.5 1.4
Energy 9.6 6.5 10.3 16.3 3.9 3.1 4.6 13.8 1.5 1.2 2.0 3.7
Oil 4.7 2.4 4.8 8.5 4.6 3.2 4.8 7.2 2.7 2.0 3.1 3.8Non-oil 4.8 1.5 3.9 13.9 3.5 1.7 3.8 16.5 0.7 0.7 1.1 4.6
Gas 1.8 0.0 1.2 4.1 5.5 4.1 6.1 18.1 1.3 0.8 2.4 6.6
Electricity 2.3 1.2 2.2 4.5 1.8 -0.3 2.6 16.5 0.6 0.4 1.3 6.0
Heat energy 0.6 0.0 0.0 4.9 5.8 2.3 5.8 15.9 0.9 0.6 1.7 7.8
Solid fuels 0.1 0.0 0.1 1.0 2.5 0.5 2.4 8.9 0.5 0.3 1.0 5.1
Sources: Eurostat and Eurosystem staff calculations.Notes: For detailed country data see Tables A7-A10 in Annex 1. Euro area denotes the euro area average; min. denotes the minimum, med. the median and max. the maximum across the euro area countries.

66ECB
Occasional Paper No 113
June 2010
for gas (i.e. mainly cross-border pipeline prices,
but also LNG), highlighting this strong co-
movement as well as the slight lag in gas prices.
Consumer gas prices tend to lag both crude oil
prices and gas border prices somewhat. For
the euro area as a whole, the peak correlation
between consumer gas prices and crude oil prices
is at a lag of eight months in level (0.97) and
year-on-year (0.79) terms and six months in
terms of month-on-month changes (0.35).
The peak correlation between consumer gas
prices and gas border prices is at three months in
level (0.95), year-on-year (0.88) and month-on-
month (0.69) terms. This correlation structure
is broadly shared across euro area countries.
The gap between the border and the pre-tax
consumer price (called the mark-up below)
refl ects the costs of processing, transmitting,
storing and distributing gas to consumers, as
well as the margins of the various operators
along the gas chain.
Chart 32 shows that movements in consumer
gas prices mainly refl ect developments in
border gas prices. Overall, the “mark-up” has
remained relatively stable, at around €5/GJ,
over the period since 1995. This suggests that
movements in gas border prices are passed
through fully into consumer prices, albeit with
some lag, and that as international gas prices
have increased, the share of consumer prices
accounted for by raw inputs has also increased.
One implication of this is that as the price
level increases, the percentage pass-through
(i.e. elasticity) increases, although the absolute
pass-through remains the same (i.e. complete).
The role of national arrangements in contracts
and the role of spot markets become more
apparent in these results when comparing gas
prices in all the main gas markets (euro area,
Japan and the United States). Although they all
co-move with oil prices, euro area and Japanese
gas prices appear much smoother and more
formally linked to oil prices. Prices in the United
States, besides being more volatile, also tend to
lead slightly those in the euro area. A key difference
between US markets on the one hand, and euro
area markets on the other, is the extent to which
Chart 31 Crude oil prices and euro area border gas prices – levels
(euro/barrel; euro/MMBtu)
0
7
13
20
27
33
40
47
53
60
67
73
80
87
93
100
0
1
2
3
4
5
6
7
8
9
10
11
12
13
14
15
1995 1997 1999 2001 2003 2005 2007 2009
crude oil (left-hand scale)
gas border prices (right-hand scale)
Sources: Datastream, Haver Analytics, Gas International Weekly and Eurosystem staff calculations.Note: Based on border prices for Belgium, Germany, Spain, France, Italy and the Netherlands.
Chart 32 Euro area consumer gas price developments and the pass-through from border prices
(euro/GJ)
01995 1997 1999 2001 2003 2005 2007 2009
2
4
6
8
10
12
14
16
18
20
0
2
4
6
8
10
12
14
16
18
20
consumer post-tax price (GJ)
consumer pre-tax price (GJ)
border gas (GJ)
mark-up
Sources: Datastream, Haver Analytics, Gas International Weekly and Eurosystem staff calculations.Note: Based on border prices for Belgium, Germany, Spain, France, Italy and the Netherlands.

67ECB
Occasional Paper No 113
June 2010
3 THE IMPACT
OF ENERGY PRICES
ON INFLATION
prices are determined by long-term contracts
with explicit indexation on oil prices 65 or in spot
markets where they are determined by local
supply and demand conditions. Spot markets
play a key function in the United States but still
play a small role in the euro area, though this is
growing rapidly relative to contracted gas.66
Chart 33, using data from 2001 onwards, shows
that the co-movement of spot market prices in
the euro area and in the United States is very
strong 67 so that if the weight of long-term
contracts in the euro area market was to diminish
over time, regional gas price dynamics could
become much more synchronised. However,
transport costs may mean that gas markets remain
regional, at least to some extent.
Turning to electricity prices, the reaction of
consumer prices to energy commodity price
changes is much less clear. However, there
are notable differences between wholesale
and consumer electricity price developments.
Chart 34 shows that there is a considerable
degree of co-movement between crude oil
and exchange-based (spot and one-year-ahead
futures) wholesale electricity prices. This co-
movement stems from the co-movement of gas
and oil prices and the key role of gas power
plants as the “swing” or marginal generator.
Notwithstanding the link between crude oil and
exchange-based wholesale electricity prices,
Japanese gas prices (generally LNG) are also linked by formula 65
to oil prices, but the formula is generally non-linear (the
so-called “S-curve”). This may help explain why Japanese gas
import prices, which were historically higher than euro area and
US prices as Japan imported LNG, have not risen by as much
in recent years.
Contracted border prices tend to be smoother than spot market 66
prices. On the other hand, although spot prices were more
volatile over the period 2001-09, they were also somewhat lower
on average by approximately USD 1/MMBtu. There have been
various arguments put forward in favour and against longer-term
contracting and indexing of natural gas prices. Those in favour
argue that given the large capital costs involved in building gas
infrastructure, longer-term contracts help reduce uncertainty. On
the other hand, those against argue that indexing on oil prices
dulls the signal coming from relative supply and demand in gas
markets. Ultimately, both sets of prices should broadly co-move.
However, this co-movement may vary over time refl ecting
market-specifi c factors in both oil and gas markets (for a more
detailed discussion, see for example, IEA 2009, Onour 2009 or
Hartley et al. 2007).
The chart shows gas prices at the Zeebrugge Hub (Belgium). 67
The picture remains the same for the Title Transfer Facility
(TTF, the Netherlands) and the National Balancing Point (NBP,
the United Kingdom) hubs.
Chart 33 International gas prices
02001 2002 2003 2004 2005 2006 2007 2008 2009
2
4
6
8
10
12
14
16
18
20
22
24
26
y-axis: USD/MMBtu
0
2
4
6
8
10
12
14
16
18
20
22
24
26
euro area (Border Price)
Belgium (Zee. Hub)
United States (Henry Hub)
Brent Crude Oil
Sources: Haver Analytics and Eurosystem staff calculations.
Chart 34 Crude oil and electricity exchange (spot and future) prices
0
20
40
60
80
100
0
20
40
60
80
100
2002 2003 2004 2005 2006 2007 2008 2009
rolling one-year Phelix Future (base)
Brent crude (euro/barrel)
European spot market electricity prices (euro/MWh)
y-axis: euro per MWh/barrel
Sources: Reuters/Bloomberg, EEX, Haver Analytics and Eurosystem staff calculations.

68ECB
Occasional Paper No 113
June 2010
the link between electricity and oil prices at the
consumer level is very weak – see Chart 35.
This is owing to a variety of factors including
taxes, different fuel mixes, and network costs
but may also in part refl ect price regulation.
When consumer electricity prices are
administered in nature, revisions in regulated
tariffs usually take place after a set interval of
either a quarter or one year, and the pass-through
of commodity price shocks will naturally be
protracted and cumulated. Regulation may also
place a limit on the price changes granted which
is likely to be much lower than the increase in
input prices. Overall this suggests that profi t
margins in some countries buffer, at least in
the short run, changes in commodity prices.
The high volatility of energy commodity prices
and the problem of disentangling transitory and
persistent price shocks may also help explain
the long lags observed.
Following liberalisation there appear to have
been changes in pricing behaviour, at least in
some countries, with a move away from
infrequent adjustments towards more frequent
ones while the importance of traditional
long-term contracts declines.68 However, higher
and more volatile energy prices in the recent
period might also have played a role. With the
opening of electricity exchanges throughout the
euro area in the wake of liberalisation, market-
based instruments to procure electricity are
beginning to replace traditional (long-term)
bilateral contracts. Some Member States report
a correlation between spot or future and
consumer prices, although the impact is hard to
quantify as trading on electricity exchanges is
still in its infancy and generally makes up only a
small proportion of a country’s total electricity
consumption.69 However, with the trading
volume fast increasing, the impact will probably
become stronger and more discernable.70
ANALYSIS OF CONSUMER GAS AND ELECTRICITY
PRICE LEVELS
Consumer gas price levels differ markedly across
countries and, with the exception of Slovakia,
are generally higher than in the United Kingdom,
a country often taken as a benchmark because
of its early liberalised and well-developed
gas market (see Chart 36). Despite tentative
evidence of price convergence, signalled by a
decline in price dispersion between 2001 and
2006, price differentials were still relatively high
in 2009, resulting in a coeffi cient of variation of
between 12% and 16% in 2009. Considering
electricity prices for households across the euro
Monthly HICP data on electricity from January 1995 to 68
July 2009 for Austria and Germany show that the frequency
of non-zero price changes per year is two-thirds higher after
deregulation than before.
According to NCB information: in Belgium some suppliers use 69
spot electricity market prices to adjust their prices (see Nationale
Bank van België/Banque Nationale de Belgique 2008); for
Germany and the Netherlands there is tentative evidence that
future electricity market prices are a good predictor of consumer
prices; in Finland an asymmetric pass-through of electricity
market prices into consumer ones is observed, with increasing
prices having a stronger impact than decreasing ones.
Fuel prices have been identifi ed as an important factor amongst 70
others infl uencing prices on electricity exchanges. Bosco et al.
(2007) fi nd evidence of long-term dynamics between prices
on a number of euro area electricity exchanges and gas prices.
Zachmann and von Hirschhausen (2008) confi rm this fi nding
and also identify the prices of CO2 certifi cates as a determining
factor of future prices. The “Quarterly Report on European
Electricity Markets” by the European Commission (2008-
2009) reports that industrial and household demand, capacity
constraints and weather conditions also play a role.
Chart 35 Crude oil and consumer electricity prices
01995 1997 1999 2001 2003 2005 2007 2009
50
100
150
200
250
0
50
100
150
200
250
Brent crude (euro/barrel, 2005 = 100)
euro area HICP electricity (index: 2005 = 100)
Sources: Eurostat, Reuters / Bloomberg and Eurosystem staff calculations.

69ECB
Occasional Paper No 113
June 2010
3 THE IMPACT
OF ENERGY PRICES
ON INFLATION
area, price dispersion is even larger than for gas
(see Chart 37) and does not show clear signs of
convergence.71
The considerable cross-country heterogeneity in
consumer gas and electricity prices, especially
in comparison with liquid fuel prices, can again
be explained by three main factors: (i) taxes,
(ii) costs and (iii) competition and margins.72
Considering the differences in consumer gas
price levels across countries, it is clear from
Charts 38 and 39 that taxes and levies play
an important role in both gas and electricity
prices – as substantial and positive correlations
are evident. However, taxes and levies still play
a more predominant role in liquid fuel prices.
Gas and electricity are industries for which a
substantial portion of costs derive from the
construction and maintenance of networks to
deliver the end product to consumers.73 In the
second half of 2008, in the euro area, energy and
supply costs accounted for around 45% of the
consumer electricity price 74, and, of those costs,
“network” costs represented around 25%. On the
other hand, taxes and levies accounted for around
35%. In terms of prices excluding taxes and
levies, the ratio of energy and supply costs to
network costs was around two-thirds (63%) to
one-third (37%).75 These differences may stem
from structural factors such as population density
and the investment required for maintaining and
upgrading the network. Alternatively, given that
some of these network activities are natural
monopolies, they could represent rent extraction.
The link between network costs and price
differentials seems, however, to be weaker for
For more formal tests of convergence in European gas and 71
electricity prices, see Robinson (2007a, b).
These factors may not be independent. For example, Brunekreeft 72
and Keller (2000) report that vertically integrated fi rms
concentrate on excessive network access charges.
The “energy and supply” price includes the costs and margins of 73
generation and of trade and customer services. “Network” costs
include transmission and distribution tariffs, distribution losses,
system operation, ancillary services costs and meter rental.
Taxes include VAT but also other levies such as environmental
taxes. For a breakdown across the euro area, see Table A13 in
Annex 1.
This fi gure is likely to overstate the portion accounted for by 74
fuel costs as data from France are not available. Given the large
share of nuclear power in that country, fuel costs are likely to
be substantially lower, as is suggested by the low selling price
(€12.3/100kWh).
Correspondingly, typical two-tier consumer tariffs differentiate 75
between a fi xed basic fee and rates for volumes consumed.
They are also refl ected in the HICP.
Chart 36 Euro area gas prices for medium-sized households
(euro/GJ)
(a) Average prices in 2008 1) (b) Gas prices on 1 January and 1 July
0
5
10
15
20
25
0
5
10
15
20
25
UK
taxes (excluding VAT)
VAT
without taxes
euro area (weighted) total price
euro area (weighted) without taxes
SK AT NL IT FR euro
area
SI IE BE ES DE PT LU0
5
10
15
20
25
0
5
10
15
20
25
euro area (weighted) – from 2008 estimated based on HICP
euro area (weighted)
min/max
1990 1992 1994 1996 1998 2000 2002 2004 2006 2008 2010
Sources: Eurostat and Eurosystem staff calculations.Notes: Post-2007 prices are computed as average prices for the period January to June (semester 1) or July to December (semester 2). The euro area is weighted according to 2009 HICP countries and item weights.1) Average of the fi rst and second semesters of 2008.

70ECB
Occasional Paper No 113
June 2010
gas than for electricity. Charts 40 and 41 show
the relationship between consumer prices
excluding taxes and network charges/costs for
gas and electricity respectively. Generally, the
network access tariffs/costs are lower for gas
than for electricity. No clear relationship is
evident concerning gas prices, although there
appears to be a clearer positive relationship in
the case of electricity, with Italy and Malta as
outliers.76
An additional element as regards electricity is
that it may be generated using a wide range of
inputs.77 The decomposition of euro area
electricity generation by fuel type (Chart 42) was
discussed in Chapter 1. One key feature was the
heterogeneity in the fuel mix used to generate
electricity. In particular, some countries were
There is some evidence that network access tariffs/costs are 76
affected to some extent by scale effects, as there is a negative
relationship between network access tariffs on the one hand, and
market size and population density on the other.
ICF International (2007) provides an overview of electricity 77
price drivers. Although its report is structured along the lines of
demand, supply and other factors, the main issues covered are
the same: fuel input mix, the load duration curve and marginal
vs. average pricing, transmission and distribution, competition,
as well as environmental and more general regulations.
See also KEMA Consulting 2005 for an overview of European
electricity prices.
Chart 37 Euro area electricity prices for medium-sized households
(euro/kWh)
(a) Average prices in 2008 (euros/kWh) 1) (b) Electricity prices on 1 January and 1 July
0.00
0.05
0.10
0.15
0.20
0.25
0.00
0.05
0.10
0.15
0.20
0.25
taxes (excluding VAT)
VAT
without taxes
euro area (weighted) total price
euro area (weighted) without taxes
1 2 3 4 5 6 7 8 9 10 11 12 13 14 15 16 17 18
1 SI
2 FR
3 FI
4 GR
5 ES
6 euro area
7 MT
8 SK
9 PT
10 AT
11 NL
12 DE
13 LU
14 IT
15 BE 18 UK
17 IE
16 CY
0.00
0.05
0.10
0.15
0.20
0.25
0.00
0.05
0.10
0.15
0.20
0.25
1990 1992 1994 1996 1998 2000 2002 2004 2006 2008 2009
euro area (weighted) – from 2007 H2
estimated based on HICP
euro area (weighted)
min/max
Sources: Eurostat and Eurosystem staff calculations.Notes: Post-2007 prices are computed as average prices for the period January to June (semester 1) or July to December (semester 2). The euro area is weighted according to 2009 HICP countries and item weights.1) Average of the fi rst and second semesters of 2008.
Chart 38 Consumer gas prices (including taxes/levies) 2008H2 and taxes/levies
(euro/GJ)
SK
SI
PTAT
NL
IT
FR
ESIE
DE
BE
euro area
12
13
14
15
16
17
18
19
20
21
22
12
13
14
15
16
17
18
19
20
21
22
8
y-axis: gas prices including taxes (2008H2)
0 1 2 3 4 5 6 7
x-axis: total taxes
Sources: Eurostat and Eurosystem staff calculations.

71ECB
Occasional Paper No 113
June 2010
3 THE IMPACT
OF ENERGY PRICES
ON INFLATION
more reliant than others on fossil fuels to produce
electricity. As prices of fossil fuels have risen
sharply over the last decade, these countries may
have experienced above average increases in
costs – especially as, in the short run, it is not
easy to substitute different fuel types. Chart 43,
which shows the relationship between consumer
electricity prices excluding taxes and the share
of electricity generated using natural gas or oil,
provides some evidence for this hypothesis.
However, it should be noted that this relationship
may not always hold true. Indeed, around the
late 1990s, gas and oil may have been relatively
cheap to use compared with other fuel types.
Indeed the results of the econometric panel
analysis of electricity prices below and in
Annex 2.6 suggest this.
Turning to the impact of competition and
deregulation on price level differences, it should
be recalled that both gas and electricity markets
in Europe have undergone a sustained process
of deregulation dating back to the mid-1990s.
However, much of this period was also
characterised by high and volatile energy
prices. Therefore, disentangling the impact of
competition and deregulation is challenging.
Nonetheless, in the empirical literature there is
some evidence in support of a largely benefi cial
impact from deregulation. Martin et al. (2005)
provide an overview of earlier studies supporting
the downward impact of liberalisation, in
particular third-party-access and unbundling,
on prices in the electricity and gas sector. Their
own estimates suggest that a reduction in public
ownership leads to lower electricity and gas
prices. Polo and Scarpa (2003) also fi nd a negative
association between electricity price levels
Chart 39 Consumer electricity prices (including taxes/levies) 2008H2 (euro cent/kWh) and taxes/levies
(euro/100kWh)
FI
SK
SI
PT
AT
MTLU
IT
ES
DE
BE
0.10
0.12
0.14
0.16
0.18
0.20
0.22
0.24
0.10
0.12
0.14
0.16
0.18
0.20
0.22
0.24
10
y-axis: electricity prices including taxes (2008H2)
0 2 4 6 8
x-axis: taxes/levies
Sources: Eurostat and Eurosystem staff calculations.
Chart 40 Consumer gas prices (excluding taxes/levies) 2008H2 and network access tariffs
(euro/GJ)
SK
SI
AT
NL ITFR
ESDE BE
10
11
12
13
14
15
16
17
10
11
12
13
14
15
16
17
10 2 3
y-axis: gas prices excluding taxes (2008H2)x-axis: network costs
Sources: DG-TREN, Eurostat and Eurosystem staff calculations
Chart 41 Consumer electricity prices (excluding taxes/levies) 2008H2 (euro cent/kWh) and network costs
(euro/100kWh)
BE
DE
ES
IT
LU
MT
AT
PT
SI
SK
FI
0.082 3 4 5 6 7 8
0.10
0.12
0.14
0.16
0.18
0.20
0.22
0.08
0.10
0.12
0.14
0.16
0.18
0.20
0.22
y-axis: electricity prices excluding taxes (2008H2)x-axis: network costs
Sources: DG-TREN, Eurostat and Eurosystem staff calculations.

72ECB
Occasional Paper No 113
June 2010
and liberalisation policies: according to their
estimates liberalisation would reduce electricity
prices by 10%. Copenhagen Economics (2007)
estimates that in EU15 networks liberalisation
stimulated a 3% growth in electricity and gas
output, with a drop in electricity prices and a
slight increase in gas prices. Finn Roar et al.
(2008) measure the effect of removing barriers
to competition in gas and electricity in western
European markets using a computable general
equilibrium (CGE) model, and fi nd benefi cial
effects for the electricity market.
Chart 42 Decomposition of euro area electricity generation by fuel type
(2007; percentages)
31
15
104
22
1
10
46
nuclear
coal
lignite
oil
gas
other non-renewable
hydro
wind
other renewable
Sources: Eurostat and Eurosystem staff calculations.
Chart 43 Consumer electricity prices (excluding taxes/levies) 2008H2 (euro cent/kWh) and share of electricity generated using natural gas or oil
(percentages)
BE
DE
IE
GR
ES
FR
IT
CY
LU
MT
NL
AT
PT
SI
SK
FI
0.08
0.10
0.12
0.14
0.16
0.18
0.20
0.22
0.08
0.10
0.12
0.14
0.16
0.18
0.20
0.22
y-axis: electricity prices excluding taxes (2008H2)
0.0 0.2 0.4 0.6 0.8 1.0
euroarea
x-axis: fuel, gas and oil
Sources: Eurostat and Eurosystem staff calculations.
Chart 44 OECD regulation/competition aggregate indicator: contribution to price levels
(percentage of price level net of taxes)
1998/1999
2006/2007
a) Electricity b) Gas
0
5
10
15
20
25
30
0
5
10
15
20
25
30
GR IE FR LU AT NL BE IT PT FI ES DE euro
area
0
2
4
6
8
10
12
14
16
18
20
0
2
4
6
8
10
12
14
16
18
20
NL LU FR IE BE AT IT DE ESeuro
area
Sources: OECD and Eurosystem staff calculations.Note: Results are based on panel estimations across the euro area countries. The OECD regulation/competition aggregate indicator for the electricity market includes three indicators, namely an indicator for entry barriers, an indicator for public ownership and an indicator for vertical integration. The OECD regulation/competition aggregate indicator for the gas market includes four indicators, namely an indicator for entry barriers, an indicator for public ownership, an indicator for vertical integration and an indicator for C1.

73ECB
Occasional Paper No 113
June 2010
3 THE IMPACT
OF ENERGY PRICES
ON INFLATIONTo confi rm and update these fi ndings, a panel
model of (pre-tax) electricity and gas prices on
the OECD regulation/competition indicators
(covering barriers to entry, the degree of vertical
integration and public ownership in both sectors,
and market structure in the gas market, as
mentioned in Section 1.3.2) was estimated.78
The empirical fi ndings further confi rm that
barriers to entry in the electricity and gas sectors,
as well as vertical integration in the electricity
sector and public or concentrated ownership in
the gas sector are associated with higher price
levels. For the sample of countries, contrary to
other studies, vertical integration in the gas
sector is found to have a negative impact on
prices. According to these estimates, the impact
of regulation on prices seemed to be more
diverse for electricity than for gas in the early
1990s before liberalisation took place
(see Chart 44). For the euro area aggregate they
would account for 10% of the electricity price
level, but the estimated contribution is
substantially higher in some countries for which
institutional indicators are available. In addition,
liberalisation has made a substantial contribution
to lower price levels. For both sectors, the euro
area average contribution of regulation to the
price level in recent years is less than one-third
of the contribution in the early 1990s.
3.2.3 SUMMARY OF THE DIRECT FIRST-ROUND
EFFECTS OF A CHANGE IN OIL PRICES
ON HICP ENERGY
Table 9 summarises the results of the fi ndings on
the direct pass-through of crude oil prices into
consumer energy prices. The highest elasticity
is for heating fuel owing to the relatively low
share of taxes in fi nal consumer prices. The level
of excise taxes impacts on the elasticity – i.e.
the percentage response to a given percentage
change in crude oil prices – of consumer oil
prices. Other things being equal, a higher level
of excise taxes increases the level of consumer
energy prices, but dampens their elasticity
and vice versa. The elasticities for petrol and
diesel are broadly similar – although slightly
lower for the former owing to somewhat higher
excise taxes on petrol compared with diesel on
average. The elasticity of natural gas (and heat
energy, which generally co-moves with natural
gas) lies between that of transport and heating
liquid fuels.
In each case, owing to the, on average, relatively
constant refi ning and distribution costs and
margins, the elasticity is a function of the crude
oil price level. The elasticity of overall HICP
energy doubles from around 15% when crude
oil prices are €20 per barrel to around 30%
when crude oil prices rise to €50 per barrel.
If crude oil prices were to reach a level of €100
per barrel, under the assumptions of broadly
constant refi ning and distribution costs and
margins and excise taxes, the elasticity would
be slightly over 40%.
For a more detailed technical discussion and presentation of the 78
results, see Annex 2.6.
Table 9 Crude oil price pass-through into HICP energy components
(summary of direct elasticity rates)
Crude oil(euro per barrel)
Weighted average pass-through 1)
Petrol(2.6%) 2)
Diesel(1.4%) 2)
Heating fuel(0.7%) 2)
Natural gas(1.8%) 2)
20 16% 15% 19% 39% 24%
50 30% 31% 37% 62% 44%
100 42% 47% 54% 76% 61%
Source: Eurosystem staff calculations.Notes: Based on taxes (VAT, excise and other) as at 19 October 2009 and median refi ning and distribution costs and margins since 1999. Assumes HICP heat energy (0.6% weight) co-moves with natural gas. 1) Weighted average probably slightly underestimates extent of elasticity as it assumes zero pass-through for electricity and solid fuels.2) Denotes weight in overall HICP.

74ECB
Occasional Paper No 113
June 2010
3.3 INDIRECT EFFECTS VIA THE PRODUCTION
CHAIN
The indirect effects of energy prices through the
production chain originate from the change in
the production cost of a consumption good or
service that uses energy in its own production
process. This use could be either direct or via
other intermediate goods or services that are
used as inputs, as well as distribution costs, and
indirectly capture the effect of changes in energy
prices. Indirect price effects arise when fi rms
pass changes in energy costs on to their selling
prices in order to maintain or restore their profi t
margin, resulting eventually in rising non-energy
consumer prices. The degree to which costs
are passed on to subsequent price stages is
affected by factors such as the business cycle
situation and the competitive pressures in the
respective market. As the transmission of a
cost increase on prices along the supply chain
is not immediate, the indirect impact of an oil
price shock on consumer prices is delayed more
and takes longer compared with the direct
effect. As indirect effects can appear along the
whole production chain from import to fi nal
demand prices, it is necessary to disentangle the
impact on both producer prices and non-energy
consumer prices, taking account of the different
degrees of energy input into production.
A particular caveat to the analysis of indirect
effects is that it is rather diffi cult to distinguish
them empirically from second-round effects, as
an adjustment in non-energy consumer prices
following an energy shock can either stem from
pass-through (cost) effects or the reaction of
wages, profi t margins and infl ation expectations
to the fi rst-round effects of the shock. A number
of factors, in particular labour market features
and wage-setting institutions, can facilitate the
appearance of second-round effects. However,
as these are generally not a function of energy
markets themselves, these institutional details
are not discussed in this report. For an extensive
analysis of wage and price-setting features that
could facilitate the emergence of second-round
effects in response to energy price movements,
see the work of the Eurosystem Infl ation
Persistence and Wage Dynamics Networks.79
3.3.1 AN ANALYSIS BASED ON INPUT-OUTPUT
TABLES
The main advantage of using input-output
tables is that they provide a refi ned sector
decomposition of the production process, based
upon the interrelationships between the different
branches of activity in the economy via the cross
consumption of intermediate inputs. This allows
the sectors likely to be impacted most by indirect
effects to be pinpointed more precisely. However
IOT should be used with some caution as they are
based on a static structure. In particular, as prices
rise, users of energy are assumed not to substitute
away from more expensive products. In addition,
this approach does not allow an assessment of
second-round effects – profi t margins and wages
are assumed to remain constant – and they do not
take into account any possible monetary policy
reaction to shocks.80
The results of the Infl ation Persistence Network are summarised 79
in Altissimo et al. 2006. Studies produced by the Wage
Dynamics Network are available on the ECB’s website at
www.ecb.europa.eu.
For a detailed overview of the methodology, see Annex 2.7.80
Table 10 Impact of a 10% increase in energy prices on producer prices: direct and indirect impact
(2005)
DE IE GR ES FR IT NL AT PT SI SK FI euro area
Direct 0.17 0.13 0.27 0.20 0.16 0.19 0.38 0.22 0.25 0.21 0.42 0.22 0.20
Indirect 0.15 0.12 0.21 0.24 0.14 0.21 0.41 0.20 0.28 0.16 0.36 0.21 0.20
Total 0.33 0.25 0.47 0.44 0.30 0.40 0.79 0.42 0.52 0.36 0.78 0.43 0.39
Share of energy in production 3.3 2.5 5.0 4.5 3.5 4.2 6.3 5.1 6.0 3.2 10.1 4.5
Source: Eurosystem staff calculations based on IOT 2005.Note: Results for the euro area are computed as the weighted average of country results.

75ECB
Occasional Paper No 113
June 2010
3 THE IMPACT
OF ENERGY PRICES
ON INFLATIONConsidering fi rst the impact on producer prices,
for the euro area in aggregate the IOTs suggest
that the overall impact of a 10% energy price
increase on producer prices would amount to
0.39% in 2005 (see Table 10). The direct and
indirect effects each contribute half to the overall
development. The direct effect emerges through
the immediate energy use, while the indirect
effect through the consumption of other products
which use energy as an intermediate input. They
refl ect the immediate and intermediate impact on
producer prices and cannot be equated with the
overall direct and indirect effects on consumer
prices discussed in other sections. Among
the 12 countries where data are available, the
lowest overall impacts are recorded by Ireland
(0.25%), France (0.30%), Germany (0.33%) and
Slovenia (0.36%), while the largest impacts are
obtained in Portugal (0.52%), Slovakia (0.78%)
and the Netherlands (0.79%). In almost all
cases, the direct and indirect impacts contribute
approximately one-half to the overall impact,
except in Greece and Slovenia where the direct
impact exceeds somewhat the indirect one.
Turning to differences across branches of
activity, unsurprisingly the branch the most
impacted is the energy sector itself, facing a
cost increase of 4.9% following a 10% rise in
energy prices in the euro area (see Table 11).
Looking at broad non-energy sectors, the
largest increase in costs after that of the energy
prices increase is recorded by agriculture and
fi shing (0.35%), followed by the manufacturing
industry (0.29%), construction (0.20%) and
services (0.16%). However, large differences
are found within these broad sectors: within
the manufacturing industry, the cost increase
appears to be especially high in the chemicals
(0.7%) and basic metal industries (0.59%). On
the other hand, the impact is found to be very
limited (lower than 0.15%) in tobacco products,
wearing apparel and furs, offi ce machinery and
computers, radio, television and communications
equipment, and medical, precision and technical
instruments. Within the services sector, the
transport sub-sector exhibits a much higher
impact than other services.
Detailed sector results by country help to
explain the overall relative position of each
country presented above. In particular, they
help to disentangle, for each country, the pure
“energy consumption effect” (stemming from
a higher energy intensity of some sectors
of production) from the “structure effect”
(stemming from the relative specialisation of
a country in high energy-consuming sectors).
It indicates, for example, that the lowest
overall impact in Germany and France is the
Table 11 Impact of a 10% increase in energy prices on producer prices: breakdownby main branch of activity
(2005)
DE IE GR ES FR IT NL AT PT SI SK FI euro area
Agriculture and fi shing 0.36 0.35 0.37 0.29 0.34 0.29 0.53 0.47 0.37 0.63 0.54 0.28 0.35
Manufacturing 0.27 0.11 0.44 0.34 0.21 0.27 0.59 0.35 0.31 0.29 0.44 0.31 0.29
of which:
Chemicals 0.70 0.03 0.36 0.92 0.50 0.38 1.86 1.11 0.91 0.38 1.61 0.80 0.70
Basic metal 0.64 2.59 0.88 0.54 0.29 0.52 0.43 1.43 0.27 0.70 1.29 0.72 0.59
Energy 4.82 4.75 5.26 5.15 4.12 4.90 7.27 4.41 5.20 3.13 4.23 4.95 4.88
Construction 0.18 0.23 0.36 0.18 0.16 0.23 0.17 0.26 0.45 0.44 0.33 0.22 0.20
Services 0.12 0.13 0.15 0.20 0.13 0.18 0.18 0.16 0.22 0.25 0.38 0.22 0.16
Trade 0.14 0.11 0.16 0.21 0.20 0.24 0.18 0.13 0.23 0.20 0.32 0.27 0.19
Transport 0.63 0.54 0.39 0.79 0.46 0.44 0.91 0.62 0.97 1.14 1.21 0.59 0.60
Land transport services 0.47 0.60 1.11 0.90 0.62 0.50 0.85 0.74 1.32 1.54 1.47 0.68 0.64
Water transport services 0.50 0.44 0.16 1.42 0.57 0.29 0.93 0.81 0.61 0.90 1.30 0.60 0.63
Air transport services 2.46 1.06 0.37 1.85 0.67 1.01 2.14 1.22 1.38 1.19 1.40 1.30 1.53
Telecommunications 0.09 0.10 0.17 0.19 0.12 0.14 0.09 0.08 0.08 0.10 0.13 0.09 0.12
Other services 0.07 0.10 0.10 0.12 0.08 0.12 0.11 0.11 0.15 0.12 0.20 0.15 0.10
Source: Eurosystem staff calculations based on IOT 2005.

76ECB
Occasional Paper No 113
June 2010
consequence of the combination of a favourable
production structure (less oriented towards
energy-intensive industries) and a relatively
moderate energy intensity in all branches of
activity, except agriculture and fi shing. On the
other hand, the high impact in the Netherlands is
explained by a structural effect (specialisation in
energy and chemicals industries) and by a higher
energy intensity in agriculture and fi shing.
The high impact in Portugal is related to a higher
energy content in the agriculture and fi shing,
construction, and services sectors, as well as by
a larger than average share of the energy industry
in the economy (which is however somewhat
compensated by a lower specialisation in other
highly energy-intensive sectors).
The overall impact on consumer prices may
be calculated by taking the results obtained
for the increase in production cost across
branches of activity and weighting them by
the corresponding share in consumption. For
the euro area in aggregate, IOT suggest that
a 10% increase in energy prices would feed
into a 0.36% increase in consumer prices
(see Table 12). Like producer prices, the rise in
consumer prices before taxes can be split into
a direct effect through the direct use of energy
products and an indirect effect through the
consumption of products which use energy as
inputs. For the euro area, the contribution of the
direct consumption of energy products amounts
to 0.22% while the indirect contribution amounts
to 0.14%. Thus around 60% of the increase
in expenditures is attributable to the direct
consumption of energy products. The dispersion
of the impact on consumer prices is lower than
for producer prices, which is consistent with a
lower heterogeneity in households’ consumption
pattern than in production structures across euro
area countries. The impact ranges from 0.32%
in Spain to 0.63% in Slovakia.
3.3.2 AN ANALYSIS BASED ON SMALL-SCALE
STRUCTURAL MODELS
Small-scale structural models, such as Structural
Vector AutoRegression models, provide a
convenient framework for analysing indirect
effects as they allow for dynamic and detailed
interrelations among prices at different stages
of the production/pricing chain. McCarthy
(2000) and Hahn (2003) provide an application
to selected industrialised countries and the euro
area respectively. In this section, SVARs both
for the euro area and for the six largest countries
are estimated and the responses of producer and
consumer prices to an oil price shock discussed.
Chart 45 presents the impulse response function,
cumulated over 12 quarters, to an oil price shock
(a 10% rise in oil prices) from the SVAR model
of Hahn (2003), updated over a relatively long
sample period (1971Q3-2009Q1). The model
includes oil prices in USD, non-energy
commodity prices in USD, the three-month
interest rate, the output gap, the nominal
effective exchange rate of the euro, the producer
price index for manufacturing and the
Table 12 Impact of a 10% increase in energy prices on consumer prices overall, direct and indirect impact
(2005)
DE IE GR ES FR IT NL AT PT SI SK FI euroarea
Direct 0.25 0.30 0.20 0.16 0.21 0.22 0.22 0.27 0.22 0.45 0.38 0.14 0.22
Indirect 0.12 0.14 0.17 0.16 0.12 0.17 0.13 0.14 0.19 0.17 0.25 0.20 0.14
Total 0.37 0.44 0.36 0.32 0.34 0.39 0.35 0.42 0.40 0.61 0.63 0.34 0.36
Share of energy in consumption 4.5 3.3 3.0 4.6 4.3 4.1 4.6 3.9 6.1 9.2 2.6
Source: Eurosystem staff calculations based on IOT 2005.

77ECB
Occasional Paper No 113
June 2010
3 THE IMPACT
OF ENERGY PRICES
ON INFLATION
HICP. To capture indirect effects, a second
model is estimated in which the HICP is replaced
with the overall index excluding energy.81
According to these models, the initial impact of
a 10% increase in oil prices on PPI is about
0.3%, which rises to a peak effect of around
0.7% after one year, decreasing
thereafter. This profi le may be related to the
sequential impact of direct effects on producer
energy prices and indirect effects on producer
prices more generally.82 The cumulated effect
after three years is 0.6%, somewhat higher than
the results for manufacturing from the static IOT
analysis (but in the latter the manufacturing sector
excludes energy while the PPI for manufacturing
covers some part of the energy sector). The effect
on the HICPX is very small in the fi rst quarter,
but rises steadily to about 0.25% after two years
without further effects thereafter.
Overall oil price shocks affect headline HICP
gradually leading to an increase in the HICP of
0.07% in the fi rst quarter, of a cumulated 0.3%
after one year and of 0.45% after three years.
This overall impact is broadly similar to the
results from the IOT analysis.
It has been suggested that the pass-through of
oil prices to producer and consumer prices
has declined over time (see, for example,
Hooker 2002 and Blanchard and Gali 2007).
Empirical evidence indicates that, among other
factors, monetary policy regimes oriented to
the maintenance of price stability contribute
to creating a more stable macroeconomic
environment (Benati and Surico 2009; Blanchard
and Riggi 2009). To check whether the oil price
pass-through has also declined in the euro
area over time, the SVAR is re-estimated over
a rolling window and impulse responses are
averaged over two sub-periods. The former
includes the 1970s and excludes the most
recent ten years, and the latter includes the most
recent decade but excludes data prior to 1980.
Results are shown in Table 13. Comparing
the results of the fi rst and second sample,
there is clear evidence that oil price changes
have, to some extent, lost their power to affect
infl ation in the euro area since the early 1980s.
The pass-through to PPI and to non-energy
items in the HICP basket has weakened by
around one-third across the two sub-samples.
The response of overall HICP has halved.83
Taking into account data properties, all variables are included 81
as log fi rst differences apart from the short-term interest rate
and the output gap which are used in levels. The output gap
is constructed by applying the Hodrick-Prescott fi lter to real
GDP data. The VAR model includes a constant and four lags.
Shocks are identifi ed by using a Choleski decomposition with
the following ordering: oil prices, non-energy commodity
prices, short-term interest rate, output gap, exchange rate, PPI
and HICP/HICPX. The original model of Hahn (2003) includes
non-oil import prices instead of non-energy commodity prices
but this change does not affect the impulse responses of the PPI,
HICP and HICPX to an oil price shock. Since the oil price is
ordered fi rst, responses to an oil price shock are invariant to
changes in the ordering of the other variables.
The reported PPI response is the one in a model that includes 82
headline HICP. This response does not differ substantially
from the one estimated in the model in which headline HICP is
replaced with HICP excluding energy.
In addition to a lower share of energy input into the economy, 83
relatively small indirect effects could also result from a shift
in the objective of monetary policy towards maintaining a low
infl ation environment (Taylor 2000). The rather limited indirect
effects of oil price changes over more recent times are confi rmed
by Landau and Skudelny (2009) who analyse in a mark-up
framework, inter alia, the transmission of energy price shocks
via the different stages of the distribution chain. They suggest a
long-run impact of a 10% rise in oil prices of about 0.1% on the
HICP excluding energy and unprocessed food. Most estimations
in this study start only in the 1990s when, as stated above, the
pass-through might have been somewhat lower than before.
Chart 45 Impact of a 10% oil price shock on euro area prices
(percentage deviation from baseline)
0.0
0.2
0.4
0.6
0.8
0.0
0.2
0.4
0.6
0.8
12
PPI
HICP
HICPX
x-axis: quarters after the shock
1 2 3 4 5 6 7 8 9 10 11
Source: Eurosystem staff calculations.

78ECB
Occasional Paper No 113
June 2010
It is also informative to consider whether
there are large differences in the transmission
process of oil prices in the individual Member
States’ infl ation rates. To investigate this,
SVARs for Belgium, Germany, Spain
France, Italy and the Netherlands have been
estimated using a similar set-up as in the case
of the euro area. Owing to data availability
constraints, the country estimates cover the
period 1985Q1-2009Q1. Table 14 shows the
effects in these countries on the PPI, the HICP
and the HICPX. To allow for comparison, the
euro area estimate over the same sample period
has been added.
Three interesting results emerge. First, in all
countries (and in the euro area) the immediate
impact on the PPI is usually larger than the
impact on HICP which, in turn, is generally
larger than that on HICPX, given the high direct
effects on HICP energy. Although this was not
the case according to the static analysis using
IOT, this was partly attributable to the fact
that in the IOT analysis, total producer prices
including services and energy were analysed.
When looking at the impact on manufacturing
producer prices only, the input-output tables
also yield stronger effects on producer prices
than on consumer prices. Second, industrial
producer prices tend to respond much more in
Spain and the Netherlands, while they respond
less in Germany and France. The relatively
strong response for the Netherlands is mainly
related to a relatively high share of energy in
total production, leading to a somewhat stronger
effect on producer prices of energy and, thereby,
on total producer prices (see Section 3.3.1).
Note that the producer prices used in this section
include the energy sector. In addition, the
results for Spain and the Netherlands could be
relatively strong because of the manufacturing
chemicals sector. Third, the effect of an oil
price shock on headline infl ation is stronger in
Spain and Italy, mainly refl ecting the behaviour
of the non-energy HICP component. This is
consistent with the fi ndings using IOT. Initially
the impacts on total and non-energy HICP are
relatively similar. However, after a period of
time, different second-round effects yield rather
heterogeneous results, with the strongest impact
for Spain. It should be noted that this result could
also partly be related to a relatively strong effect
of the transport sector (see Table 11), owing to
its energy intensity which is above the euro area
average. Overall, the ranges of estimates across
countries are of a similar magnitude as in the
input-output table analysis above.
Table 14 Impact of a 10% oil price shock on prices across euro area countries
(percentage deviation from baseline)
PPI HICPX HICPYear 1 Year 2 Year 3 Year 1 Year 2 Year 3 Year 1 Year 2 Year 3
BE 0.8 0.2 0.2 0.0 0.1 0.1 0.3 0.2 0.2
DE 0.4 0.3 0.4 0.0 0.1 0.1 0.2 0.3 0.3
ES 1.1 0.9 0.6 0.1 0.3 0.3 0.3 0.4 0.4
FR 0.3 0.5 0.4 0.0 0.1 0.1 0.2 0.3 0.3
IT 0.8 0.4 0.5 0.1 0.2 0.2 0.3 0.4 0.5
NL 1.9 1.1 1.1 0.0 0.1 0.2 0.2 0.3 0.4
euro area 0.8 0.3 0.3 0.0 0.1 0.1 0.2 0.3 0.2
Source: Eurosystem staff calculations.
Table 13 Impact of a 10% oil price shock on euro area prices
(percentage deviation from baseline after 12 quarters)
Full sample First sample Second sample
PPI 0.59 0.85 0.56
HICP 0.45 0.68 0.36
HICPX 0.25 0.29 0.20
Source: Eurosystem staff calculations.Notes: Full sample refers to 1971Q3-2009Q1. First sample is the average of 33 consecutive estimations for the sample periods 1971Q3-1995Q3 up to 1979Q4-2000Q4. Second sample is the average of 34 consecutive estimations for the sample 1980Q1-2001Q1 up to 1988Q1-2009Q1.

79ECB
Occasional Paper No 113
June 2010
3 THE IMPACT
OF ENERGY PRICES
ON INFLATION3.3.3 RESULTS FROM LARGE-SCALE
MACROECONOMETRIC MODELS
The impact of changes in energy prices, and in
particular, oil prices, on consumer prices does
not only depend on the reaction of nominal
variables (prices and costs such as wages). It also
depends on the response of the real side of the
economy to an oil price increase (as discussed
in Chapter 2) and the two-way interaction
between nominal and real variables. While
these interlinkages can be manifold, so-called
structural or large-scale macroeconometric
models are, in principle, capable of capturing
them to a signifi cant extent and should hence
provide a more complete picture of the impact
of a change in energy prices (see, for example,
Álvarez et al. 2009).
Clearly a crucial factor determining the impact
of energy price fl uctuations on infl ation is the
reaction of wages. Starting with the simulation
results which allow for wage responses, the
left-hand side of Table 15 reports the percentage
impact of an oil price increase with respect to the
baseline (unchanged oil prices). The weighted
average of the country simulation suggests
that a 10% increase in oil prices leads to a rise
in the euro area HICP of about 0.2% in the fi rst
year, increasing to 0.45% in the third year. This
is very much in line with the results from the
SVAR for the full sample and the input-output
table analysis shown above. Differences across
countries can broadly be associated with
differences in the energy share in the HICP basket,
with Greece, Slovenia and Slovakia on the high
side and France, Malta and Austria on the low
side. For the majority of countries and the euro
area as a whole, only around half (40-60%) of the
long-run effect has been passed through after one
year, which indicates that indirect effects and/or
second-round effects are at work.
The simulation results for the HICPX, also
reported in Table 15 for most of the euro area
countries, provide further evidence of important
effects on consumer prices beyond the direct
impact. For the euro area as a whole and most
of the countries (Belgium, Germany, France,
Italy, Cyprus, Luxembourg and Slovenia),the
impact on core infl ation measured by the HICPX
is very small in the fi rst year (up to 0.1%) but
increases gradually up to the third year to around
0.2%. This is again very much in line with the
VAR evidence previously shown, although with
a slightly higher dispersion across countries.
Slovakia stands out once more with a higher than
average impact (0.5% after three years) while the
effect on HICP excluding energy is below 0.2%
in Germany, France, Italy, the Netherlands and
Austria.
Wage reactions are also quite heterogeneous
across countries. Wages grow rather strongly in
Slovakia following an oil price increase: after
three years, compensation per employee is 0.6%
higher compared with the baseline. Nominal
wages in Belgium, Luxembourg and Germany
show a rather similar reaction in the longer term
(around 0.4%), but the impact in Belgium and
Luxembourg is more immediate, most likely
refl ecting the existence of formal wage
indexation 84. The adjustment in Germany, where
no formal wage indexation is in place, is more
spread out, pointing to implied nominal wage
resistance. By contrast, oil price changes are
estimated to have no effect on wages in Ireland
and a relatively small impact on wages in Italy
and Austria, with an increase in compensation
per employee of slightly more than 0.1% in the
third year.
Comparing the reactions in the HICPX to those
in the HICP, it is possible to obtain an idea of the
relative size of direct effects on the one hand, and
indirect and second-round effects on the other.
According to the macroeconometric models, at
the euro area level, the indirect/second-round
effects, at 0.2%, account for roughly half of
the impact on total HICP (0.45%). This implies
that direct effects, and indirect or possible
second-round effects, have almost the same size.
This is consistent with the results of the SVAR
(long sample). The IOT analysis suggests that
the indirect effects are somewhat smaller than
In Belgium the impact of oil price movements on wages 84
via the indexation mechanism is mitigated by the use of the
so-called health index as the reference for indexation. That index
excludes the prices of petrol and diesel from the overall index.

80ECB
Occasional Paper No 113
June 2010
Table 15 Effect of a 10% oil price increase on consumer prices according to traditional structural models
(annual averages; percentage deviation from baseline (cumulated))
Wage reaction on Wage reaction offYear 1 Year 2 Year 3 Year 1 Year 2 Year 3
HICP
Belgium 0.32 0.51 0.54 0.29 0.36 0.34
Germany 0.33 0.50 0.54 0.33 0.47 0.47
Ireland 0.09 0.20 0.22 - - -
Greece 0.08 0.36 0.65 - - -
Spain 0.30 0.47 0.46 0.27 0.34 0.26
France 0.12 0.21 0.32 0.10 0.15 0.21
Italy 0.21 0.37 0.44 0.21 0.34 0.40
Cyprus 0.33 0.52 0.56 0.30 0.37 0.32
Luxembourg 0.41 0.55 0.62 0.41 0.44 0.44
Malta 0.33 0.30 0.34 0.33 0.29 0.32
Netherlands 0.20 0.43 0.48 0.20 0.41 0.44
Austria 0.18 0.18 0.19 - - -
Portugal 0.24 0.38 0.58 0.21 0.27 0.38
Slovenia 0.59 0.78 0.82 0.55 0.55 0.55
Slovakia 0.51 0.74 0.90 0.51 0.70 0.78
Euro area average 0.24 0.39 0.45 0.23 0.34 0.36
HICP excluding energy
Belgium 0.04 0.16 0.22 0.00 0.00 0.00
Germany 0.07 0.15 0.17 0.07 0.12 0.09
Ireland - - - - - -
Greece - - - - - -
Spain 0.12 0.35 0.36 0.09 0.21 0.15
France 0.01 0.07 0.15 -0.01 0.01 0.03
Italy 0.01 0.10 0.18 0.00 0.06 0.14
Cyprus 0.08 0.23 0.34 0.04 0.07 0.08
Luxembourg 0.01 0.13 0.22 0.01 0.01 0.01
Malta 0.26 0.19 0.24 0.26 0.19 0.21
Netherlands 0.03 0.11 0.13 0.03 0.09 0.09
Austria 0.12 0.12 0.14 - - -
Portugal 0.03 0.18 0.38 0.00 0.07 0.18
Slovenia 0.05 0.26 0.30 0.00 0.01 0.01
Slovakia 0.14 0.39 0.54 0.14 0.34 0.42
Euro area average 0.05 0.15 0.20 0.03 0.09 0.10
Compensation per employee
Belgium 0.13 0.35 0.41 - - -
Germany -0.01 0.16 0.39 - - -
Ireland 0.00 0.02 0.02 - - -
Greece 0.04 0.26 0.43 - - -
Spain 0.11 0.27 0.32 - - -
France 0.06 0.15 0.25 - - -
Italy 0.03 0.12 0.13 - - -
Cyprus 0.13 0.17 0.23 - - -
Luxembourg 0.31 0.41 0.43 - - -
Malta -0.04 0.28 0.25 - - -
Netherlands 0.02 0.12 0.18 - - -
Austria 0.06 0.11 0.12 - - -
Portugal 0.06 0.17 0.29 - - -
Slovenia 0.13 0.38 0.41 - - -
Slovakia 0.16 0.37 0.56 - - -
Euro area average 0.04 0.17 0.28 - - -
Source: Eurosystem staff calculations.

81ECB
Occasional Paper No 113
June 2010
3 THE IMPACT
OF ENERGY PRICES
ON INFLATIONthe direct effects. However, this seems to be
plausible, given that the latter does not include
any wage reaction (see also below on the
simulation results when switching off the wage
channel). The models for Belgium, France,
Italy, Cyprus, Luxembourg and Slovenia also
suggest that direct effects are about the same
size as indirect (and second-round) effects, with
an impact on the HICPX in relative terms to the
HICP ranging between 40% and 60%. In the
models for Germany and the Netherlands, the
reactions of the HICPX relative to the HICP
are rather small, suggesting that direct effects
dominate. For Germany, this is congruent to the
estimate obtained on the basis of the SVAR and
the input-output table analysis. In Spain, Malta,
Austria and Portugal, indirect and second-
round effects are the main drivers behind the
response in total consumer prices. For Spain,
this is confi rmed by the SVAR analysis, but not
entirely when using input-output tables.
For a number of countries, results are also
available for an oil price scenario when
switching off the wage channel. They assume
that wages remain unchanged following an oil
price increase, which implies that there are no
second-round effects via wage changes. Such an
exercise is not without caveats. Switching off
the wage channel implies that wages cannot
respond to both the fi rst-round price effects
owing to a change in the oil price and the impact
on activity, which suggests that all the necessary
adjustment would fall on employment. This is
a very strong assumption, which can have an
impact on the stability properties of the models
and the results should therefore be interpreted
with caution. Notwithstanding this, a noteworthy
outcome of this exercise is that in most
countries, the impact of an oil price increase
on the HICPX is relatively muted once wage
reactions are not allowed. For the euro area as a
whole, the indirect effects amount to 0.1% on a
cumulative basis by the third year. This implies
that approximately half of the total impact on
HICPX (at 0.2%) comes from second-round effects via wage changes, triggered by
either explicit wage indexation or via wage
negotiations. Regarding country reactions, the
cumulative indirect effects amount to between
0.1-0.2% in the third year for seven euro area
countries (Germany, Spain, Italy, Cyprus, Malta,
the Netherlands and Portugal). Indirect effects
are on the high side in the model for Slovakia
(0.4%). There are no or very small indirect
effects in Belgium, France, Luxembourg and
Slovenia, which suggests that almost all impact
on the HICPX stems from second-round effects.
In this respect, policies aiming at overcoming
wage indexation mechanisms in the euro area
and making wages generally more fl exible are
of high importance.
Against this background, it would be of interest to
explore whether an asymmetric impact of energy
price fl uctuations exists. The risk of infl ationary
pressures emerging from second-round wage
effects is particularly likely when institutional
mechanisms, such as wage indexation, enforce
downward real wage rigidities. These rigidities
would then feed into an asymmetric reaction of
consumer prices. However, unfortunately, the
set-up of most macroeconometric models does
not allow an assessment of this issue.
Results from an oil price scenario using the
available DSGE models in the Eurosystem are
presented in Table 16. Results are shown from
the NAWM for the euro area, the Aino model of
Suomen Pankki – Finlands Bank, Banco de
España’s BEMOD model and a calibrated DSGE
model of the Deutsche Bundesbank. Since agents
in these models react to future policy actions, the
specifi cation of the monetary policy reaction is
crucial. Here we report only results of DSGE
models in which the policy rules are kept active.
Furthermore, the exchange rate and world
demand and prices (except for the Finnish model
in both cases) also react to the shock.85
All the models include a direct link between imported prices of 85
oil and domestic demand prices, in the form of shares of oil in
demand components. Excise taxes also play a role in the models.
All the models, except the NAWM, also included some supply-
side effect in that fi rms use oil in production. The elasticity of
substitution is either calibrated to different values or imprecisely
estimated, which may explain some of the differences in the
results. Last but not least, the way the shocks were implemented
also differed across models to some extent. The German model
simulates a 10% increase on impact, generated through a shock
to global oil demand, with a dampening down effect afterwards.

82ECB
Occasional Paper No 113
June 2010
Oil prices seem to have a much higher initial
impact on HICP in the Finnish and German
cases. The higher impact in the Finnish model
may be explained by higher shares of oil use
in that country, while the German results may
depend more on the calibration of the model, in
particular the low calibration for the elasticity
of substitution. While the oil price impact
fades away in the German model, the Finnish
model suggests an increasing impact over time.
By contrast, the models for Spain and the euro area
suggest a smaller initial impact compared with
traditional models with relative little dynamics,
which is attributable to the monetary policy
reaction. The models for Germany and Finland
show notable indirect/second-round effects while,
in the model for the euro area, the central bank
reaction counteracts these effects.
Table 16 Effect of a 10% oil price increase on inflation (annual averages) according to DSGE models
(percentage deviation from baseline (cumulated))
HICP HICPXYear 1 Year 2 Year 3 Year 1 Year 2 Year 3
DE 0.88 0.67 0.27 0.40 0.47 0.17
ES 0.20 0.23 0.25 - - -
FI 0.77 0.84 0.90 -0.03 0.05 0.14
Euro area 0.12 0.15 0.13 0.00 -0.01 -0.03
Source: Eurosystem staff calculations.Note: The results for FI are based on a version of the Aino model including a Taylor rule.
Box 6
MONETARY POLICY RESPONSE TO ENERGY PRICE CHANGES AND THE ROLE OF INFLATION
EXPECTATIONS
Given that energy price fl uctuations can have substantial impacts on output and infl ation, they
call for an appropriate monetary policy response that aims to maintain price stability over
the medium term. In doing so, monetary policy takes into account the nature of energy price
movements that can be temporary or refl ect more persistent, structural developments in energy
markets, as well as their impact on the formation of infl ation expectations.
As transitory energy price disturbances mainly entail short-run changes in headline infl ation, a
medium-term oriented monetary authority looks through the short-term volatility of headline
infl ation and does not attempt to fi ne-tune price and economic developments. In fact, according
to the standard view on the transmission mechanism, monetary policy affects the economy
with variable and uncertain lags and therefore any action implemented to undo the direct and
immediate impact of energy price rises on headline infl ation can at best be vain and, most likely,
harmful, as it would become effective only when the temporary infl ationary impact has already
faded away.
A more aggressive monetary policy response is however needed when there are clear signs of
second-round effects on prices. Wage and price indexation, strong bargaining power on the worker
side or high pricing power of fi rms, are features of an economy that make the impact of transitory
energy price increases on infl ation more persistent. They largely refl ect the individually rational
behaviour of economic agents attempting to reduce the impact of energy price rises on their real

83ECB
Occasional Paper No 113
June 2010
3 THE IMPACT
OF ENERGY PRICES
ON INFLATIONincomes by exerting upward pressures on nominal wages and profi t margins. Collectively such
behaviour eventually generates infl ationary pressures, makes the task of monetary policy more
challenging and delays the necessary adjustment on the real side of the economy.
Recurring energy price rises are also challenging from a monetary policy perspective as they
can lead to a permanent upward shift in energy infl ation. In general, permanent shocks produce
a larger effect on the real economy and a permanent change in relative prices calls for sizeable
sectoral reallocation. On the nominal side of the economy, the new equilibrium allocation would
require a stronger correction of wages and profi ts. In such an economic environment, maintaining
price stability entails a monetary policy stance that appropriately counterbalances the permanent
effect on infl ation over the medium term.
The monetary policy response must be tailored to the structure of the domestic economy and,
in particular, take into account the strength of the second-round effects on headline infl ation.
In this respect, the solid anchoring of medium to longer-term infl ation expectations is pivotal
to ensuring that price and wage developments remain “in sync” with the central bank’s price
stability objective.
Rational expectations versus adaptive learning: unexpected and temporary 10% increasein real oil prices, spread over a five-year period – Taylor rule policy
(euro area variables; deviation from initial steady state in percentages – time unit = quarter)
rational expectations
adaptive learning (1)
adaptive learning (2)
Output gap Consumer price infl ation
-0.10
-0.07
-0.04
-0.01
0.02
-0.10
-0.07
-0.04
-0.01
0.02
484 8 12 16 20 24 28 32 36 40 440.00
0.04
0.08
0.12
0.16
0.20
0.00
0.04
0.08
0.12
0.16
0.20
484 8 12 16 20 24 28 32 36 40 44
Nominal wages Interest rate
0.00
0.03
0.06
0.09
0.12
0.15
0.00
0.03
0.06
0.09
0.12
0.15
484 8 12 16 20 24 28 32 36 40 440.00
0.03
0.06
0.09
0.12
0.15
0.00
0.03
0.06
0.09
0.12
0.15
484 8 12 16 20 24 28 32 36 40 44
Source: Eurosystem staff calculations.Notes: Learning simulations are computed under constant gain adaptive learning, assuming that the economy is initially at the steady state and that agents start their learning process with the true parameters of the economy. The gain parameter amounts to 0.001. The simulations labelled “adaptive learning (1)” assume that private agents only learn about the variables whose expectations matter. The simulations labelled “adaptive learning (2)” assume that private agents learn about all variables. See Darracq-Pariès and Moyen 2009.

84ECB
Occasional Paper No 113
June 2010
3.4 CONCLUSION ON THE IMPACT OF ENERGY
PRICES ON INFLATION
In terms of an overall summary, estimates of
the energy price pass-through into infl ation
according to the various approaches outlined
above are reported in Table 17. Notwithstanding
the different underlying assumptions, caveats
and estimation periods used, there are some
relatively clear and consistent fi ndings.
The direct pass-through of oil prices into
pre-tax prices of liquid fuels is complete and
quick (mainly within two to three weeks),
and there is little evidence of asymmetry.
Over time, oil prices and taxes have been the
main driving forces behind price increases,
whereas distribution and refi ning margins have
remained relatively stable. Gas prices strongly
co-move with oil prices mainly owing to the
substitutability of these energy sources and
institutional arrangements. The direct pass-
through of gas price changes to consumer
prices takes approximately six to nine months.
The link between electricity prices and
oil, evident for wholesale markets, largely
disappears for consumer electricity prices
given their administered nature and different
input compositions. Even in countries where
price regulation has been largely abolished,
Insuffi ciently solid anchoring of infl ation expectations risks undermining the credibility of the
central bank. Medium to longer-term infl ation expectations can drift away from the central
bank’s objective when recurrent energy price increases exerting upward pressures on headline
infl ation tarnish the reputation of the central bank in fulfi lling its mandate. This can happen, for
example, if economic agents cannot fully assess whether the deviations from the price stability
objective are attributable to the mechanical impact of energy price rises on infl ation, or to a
loose monetary policy stance. The additional risks to price stability stemming from individuals
not having perfect knowledge can be analysed in models including further assumptions on the
mechanisms of expectation formation. Under the assumption of adaptive learning, individuals
have a limited amount of information on which to form their expectations about the future path
of the economy. Their infl ation forecasts are not rational and diverge from the central bank’s
view on the outlook for infl ation. Learning dynamics are a source of additional sensitivity of
the economy to energy price movements compared with conventional models with fully rational
expectations. The chart illustrates how departures from the rational expectations paradigm could
amplify the transmission of oil price changes throughout the economy, leading to pronounced
underlying infl ationary pressures and sizeable wage increases. In this case, a lower policy
tolerance for infl ation volatility may limit private forecast errors and contribute to the solid
anchoring of infl ation expectations.
Table 17 Summary and decomposition of impact of a 10% increase in oil prices on HICP using different approaches
Approach Specifi cation Direct Indirect Second round Total
Disaggregated energy
components 1)
€20 0.15% N/A N/A N/A
€50 0.29% N/A N/A N/A
Input-output tables 2) country avg 0.22% 0.14% N/A 0.36%
SVAR 71-09 0.20% 0.25% 0.45%
71-00 0.39% 0.29% 0.68%
80-09 0.16% 0.20% 0.36%
Macro models wage reaction on 0.25% 0.20% 0.45%
wage reaction off 0.26% 0.10% 0.36%
Source: Eurosystem staff calculations.1) Pass-through is a function of price level – estimates calculated on the basis of constant refi ning and distribution costs and margins and indirect taxes. 2) Based on 2005 values (oil averaged €47/barrel). Implicitly assumes constant margins.

85ECB
Occasional Paper No 113
June 2010
3 THE IMPACT
OF ENERGY PRICES
ON INFLATIONprice adjustments remain relatively infrequent
compared with fuels and gas. Owing to the
full pass-through into pre-tax prices, and the
broad constancy of margins and indirect taxes,
the overall direct pass-through of oil prices
into consumer energy prices is a function of
the crude oil price level. At €20 per barrel
pass-through to consumer energy prices is
around 15%, at €50 per barrel it is around 30%.
If oil prices were to increase to €100 per barrel,
elasticity (assuming broadly constant refi ning
and distribution margins and excise taxes)
would rise to above 40%.
Price levels may vary across energy markets
owing to taxes and cost structures, which may
in turn be a function of energy policy itself.
However, differences in competition and market
concentration as well as the degree of vertical
integration also undoubtedly have a role. In
this regard, pre-tax price dispersion is generally
more sizeable in electricity and gas markets
compared with liquid fuel markets. However,
there is evidence that liberalisation efforts have
had a benefi cial impact on price levels across
the euro area. In this context, further reforms
towards a more competitive environment
creating a level playing fi eld across the euro
area would diminish price dispersion and benefi t
both consumers and fi rms.
The evidence on indirect and second-round effects of energy prices from the IOT analysis
and from dynamic simulations of various model
specifi cations gives an overall internally
consistent picture. At the producer level, a 10%
oil price increase leads to an increase in output
prices in the manufacturing sector in the euro
area, not only via the energy sector itself, but
also through energy-intensive branches
(chemicals and metals). The magnitude of the
impact at the producer level is rather
homogeneous across most countries, with the
important exception of the Netherlands, where
the high share of energy-intensive sectors in
manufacturing output makes producer prices
much more responsive to oil price fl uctuations.
Services prices may also be affected by energy
shocks at the early stage of production, for
example in the air transport sector as shown by
the IOT analysis. At the consumer level, the
prices of non-energy products respond to oil
price shocks very gradually. The cumulated
effect after three years of a 10% oil price
increase is estimated to be 0.2%, half of which
seems to be a second-round effect coming from
the endogenous reaction of wages to energy
price rises.86 The overall (indirect and second-
round) effect on non-energy consumer prices
has also weakened over the past twenty years.
Models in which expectations play a more
substantial role (DSGE models) point to a
somewhat milder reaction of core infl ation to
commodity prices. At the country level, there
are important differences in the transmission of
energy commodity surprises to non-energy
consumer prices with impacts ranging from 0.1
to 0.5%. The role of second-round effects seems
to be generally higher in countries that have
automatic wage indexation schemes.
Overall, the pass-through of oil prices into
consumer prices is complex and a function of
many factors including the price level of oil,
the amount of indirect taxation (excises), other
structural aspects of the economy including
the sector specialisation of activity, and wage
and price-setting institutions. Indirect and
second-round effects appear to have moderated
compared with the 1970s and early 1980s owing,
in part, to changes in economic structure but
also, more importantly perhaps, to changes in
monetary policy and wage and price-setting
behaviour.
Ultimately, wage and price-setting behaviour
and a credible monetary policy are the key
determinants of whether infl ationary pressures
from energy prices translate into infl ation over
a medium-term horizon. Whilst there is little
monetary policy can do about the fi rst-round
effects of energy price shocks, in particular
international oil price changes, it can shape
second-round effects. Monetary policy-making
An important caveat to this result is that it is obtained by 86
switching off the wage channels of the macro models used at
national central banks; the consequences of such a modifi cation
on the models’ behaviour are unclear.
86ECB
Occasional Paper No 113
June 2010
becomes more complicated if infl ation
expectations are unanchored by energy price
changes. If the central bank is not credible,
and energy price fl uctuations strongly affect
expectation formation, more drastic monetary
policy action would be required to restore price
stability, which would imply stronger output
volatility in the short run. Thus, monetary policy
best counteracts the price and output volatility
induced by energy price fl uctuations by
implementing a credible medium-term-oriented
monetary policy strategy stabilising infl ation
expectations.

87ECB
Occasional Paper No 113
June 2010
ANNEXES
ANNEXES
1 DETAILED CROSS-COUNTRY CHARTS AND TABLES
Chart A1 Change in share of primary energy production by fuel
(percentage point variation in share of total – 1990 to 2007)
-40
-30
-20
-10
0
10
20
30
40
-40
-30
-20
-10
0
10
20
30
40
solid fuels
oil
gas
nuclear energy
other
BE DE IE GR ES FR IT CY LUMT NLAT PT SI SK FI euroarea
Sources: Eurostat and Eurosystem staff calculations.
Chart A2 Final inland consumption by product
(percentage point variation in share of total – 1990 to 2007)
-30
-20
-10
0
10
20
30
-30
-20
-10
0
10
20
30
solid fuels
oil
gas
heat
electricity
other
BE DE IE GR ES FR IT CYLUMTNLAT PT SI SK FI euroarea
Sources: Eurostat and Eurosystem staff calculations.
Chart A3 Final energy consumption by sector
(percentage point variation in share of total – 1990 to 2007)
-40
-30
-20
-10
0
10
20
30
40
-40
-30
-20
-10
0
10
20
30
40
industry
transport
households
agriculture
services
other sectors
BE DE IE GR ES FR IT CYLUMT NLAT PT SI SK FI euroarea
Sources: Eurostat and Eurosystem staff calculations.
Chart A4 Final energy consumption – households
(percentage point variation in share of total – 1990 to 2007)
-60
-40
-20
0
20
40
60
-60
-40
-20
0
20
40
60
solid fuels
oil
gas
heat
electricity
other
BE DE IE GR ES FR IT CY LU MTNLAT PT SI SK FI euroarea
Sources: Eurostat and Eurosystem staff calculations.

88ECB
Occasional Paper No 113
June 2010
Chart A5 Final energy consumption – industry
(percentage point variation in share of total – 1990 to 2007)
-50
-40
-30
-20
-10
0
10
20
30
40
50
-50
-40
-30
-20
-10
0
10
20
30
40
50
solid fuels
oil
gas
heat
electricity
other
BE DE IE GR ES FR IT CYLUMTNLAT PT SI SK FI euroarea
Sources: Eurostat and Eurosystem staff calculations.
Chart A7 Market share of the three largest companies (C3) in the liquid fuel distribution market in 2005
(percentages)
0
10
20
30
40
50
60
70
80
90
100
0
10
20
30
40
50
60
70
80
90
100
BE DE IE GR ES FR IT CY LUMT NLAT PT SI SK FI euroarea
Sources: NCBs, from national sources.
Chart A6 Market share of the three largest companies (C3) in 2007 – country breakdown
(percentages)
wholesale electricity market
retail electricity market
a) Electricity market b) Gas market
0
10
20
30
40
50
60
70
80
90
100
0
10
20
30
40
50
60
70
80
90
100
BE DE IE GR ES FR IT CYLUMTNLAT PT SI SK FI euroarea
0
10
20
30
40
50
60
70
80
90
100
0
10
20
30
40
50
60
70
80
90
100
BE DE IE GR ES FR IT CY LUMT NLAT PT SI SK FI euroarea
Sources: NCBs, European Commission and Eurosystem staff calculations.

89ECB
Occasional Paper No 113
June 2010
ANNEXES
Chart A8 OECD regulation indicator sub-indices
progress since 1990
level in 2007
Entry indicator – electricity Entry indicator – gas
-6-5-4-3-2-10123456
-6-5-4-3-2-10123456
IE ES FR IT LU NL AT FI DE euroarea
GR SK BE-6-5-4-3-2-10123456
-6-5-4-3-2-10123456
IEES FR IT LU NLAT FIDEeuroarea
GRSK BE
Public ownership indicator – electricity Public ownership indicator – gas
-6-5-4-3-2-10123456
-6-5-4-3-2-10123456
IEES FRIT LU NLATFIDE euroarea
GR SKBE-6-5-4-3-2-10123456
-6-5-4-3-2-10123456
IEES FR IT LU NLAT FIDE euroarea
GRSK BE
Vertical integration indicator – electricity Vertical integration indicator – gas
-6-5-4-3-2-10123456
-6-5-4-3-2-10123456
IEES FRIT LUNLAT FI DEeuroarea
GRSK BE-6-5-4-3-2-10123456
-6-5-4-3-2-10123456
IEES FR IT LUNLAT FIDEeuroarea
GR SK BE
Sources: OECD and Eurosystem staff calculations.Notes: The indicators are measured on a scale of 0 to 6, refl ecting the increasing restrictiveness of regulatory provisions on competition (see Conway and Nicoletti 2006) for more detail.

90ECB
Occasional Paper No 113
June 2010
Chart A9 Cross-sectional charts – petrol
(x-axis: petrol, excluding taxes)
Prices with taxes (euro cent / litre) VAT (percentages)
BEDE
IE
GRES
FR IT
CY
LU
MT
NL
AT
PT
SI
SK
FI
100
110
120
130
140
150
160
100
110
120
130
140
150
160
50 52 54 56 58 60 62
FI
SK
SIPT
AT
NL
MT
LU
IT
FR
ES
GR
IE
DE
BE
15
16
17
18
19
20
21
22
23
15
16
17
18
19
20
21
22
23
CY
50 52 54 56 58 60 62
Excise taxes (euro cent / litre) Number of cars (logarithmic scaling)
BE
DE
IE
GRES
FRIT
CY
LU
MT
NL
AT
PT
SI
SK
FI
2530354045505560657075
2530354045505560657075
50 52 54 56 58 60 62
BE
DE
IE
GR
ESFR IT
CYLU
MT
NLAT PT
SI
SK
FI
100
1,000
10,000
100,000
100
1,000
10,000
100,000
50 52 54 56 58 60 62
Geographic area (km2, logarithmic scaling) Whole economy price level (EU = 100)
BE
DE
IE GR
ESFR IT
CY
LU
MT
NLAT
PT
SISK
FI
100
1,000
10,000
100,000
1,000,000
100
1,000
10,000
100,000
1,000,000
50 52 54 56 58 60 62
FI
SK
SIPT
AT NL
MT
LU
CY
IT
FR
ESGR
IE
DEBE
0.6
0.7
0.8
0.9
1.0
1.1
1.2
1.3
0.6
0.7
0.8
0.9
1.0
1.1
1.2
1.3
50 52 54 56 58 60 62
Distance from Rotterdam (km) Petrol stations per capita
FI
SKSI
PT
AT
NL
MT
LU
CY
IT
FR
ES
GR
IEDE
BE0
500
1,000
1,500
2,000
2,500
3,000
3,500
0
500
1,000
1,500
2,000
2,500
3,000
3,500
50 52 54 56 58 60 62
FI
SKSI
PT
AT
NL MT
LU
CYIT
FR
ES
GR
IEDE
BE
0
100
200
300
400
500
600
700
800
0
100
200
300
400
500
600
700
800
50 52 54 56 58 60 62
Sources: Eurostat, European Commission, various national sources and Eurosystem staff calculations.Notes: Consumer petrol prices (euro cent/litre), excluding taxes, in 2008 are shown on the horizontal axes. The variable shown on the vertical axes is given by the chart title.
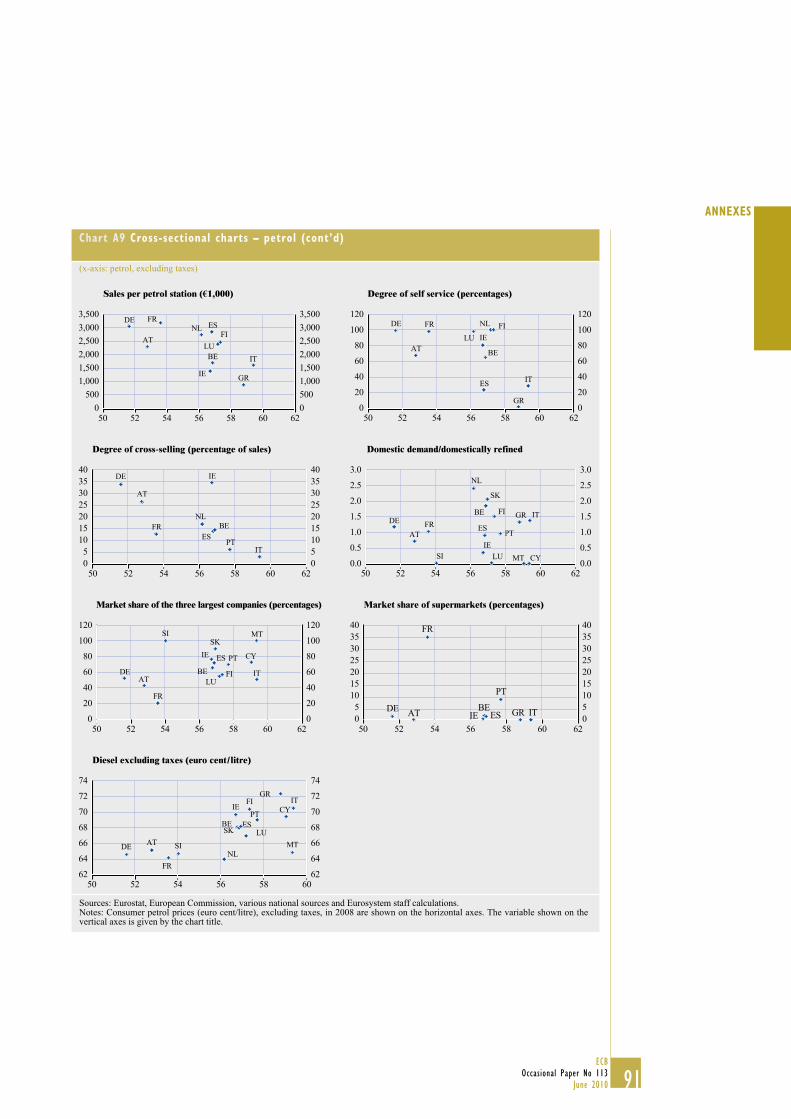
91ECB
Occasional Paper No 113
June 2010
ANNEXES
Chart A9 Cross-sectional charts – petrol (cont’d)
(x-axis: petrol, excluding taxes)
Sales per petrol station (€1,000) Degree of self service (percentages)
FIAT
NL
LU
IT
FRES
GRIE
DE
BE
0
500
1,000
1,500
2,000
2,500
3,000
3,500
0
500
1,000
1,500
2,000
2,500
3,000
3,500
50 52 54 56 58 60 62
FI
AT
NL
LU
IT
FR
ES
GR
IE
DE
BE
0
20
40
60
80
100
120
0
20
40
60
80
100
120
50 52 54 56 58 60 62
Degree of cross-selling (percentage of sales) Domestic demand/domestically refined
PT
AT
NL
IT
FR
ES
IEDE
BE
0
5
10
15
20
25
30
35
40
0
5
10
15
20
25
30
35
40
50 52 54 56 58 60 62
FI
SK
SI
PTAT
NL
MTLU CY
IT
FRES
GR
IE
DEBE
0.0
0.5
1.0
1.5
2.0
2.5
3.0
0.0
0.5
1.0
1.5
2.0
2.5
3.0
50 52 54 56 58 60 62
Market share of the three largest companies (percentages) Market share of supermarkets (percentages)
FI
SKSI
PT
AT
MT
LU
CY
IT
FR
ESIE
DE BE
0
20
40
60
80
100
120
0
20
40
60
80
100
120
50 52 54 56 58 60 62
PT
AT IT
FR
ES GRIEDE BE
0
5
10
15
20
25
30
35
40
0
5
10
15
20
25
30
35
40
50 52 54 56 58 60 62
Diesel excluding taxes (euro cent / litre)
FI
SK
SI
PT
AT
NL
MT
LU
CY
IT
FR
ES
GR
IE
DE
BE
62
64
66
68
70
72
74
62
64
66
68
70
72
74
50 52 54 56 58 60
Sources: Eurostat, European Commission, various national sources and Eurosystem staff calculations.Notes: Consumer petrol prices (euro cent/litre), excluding taxes, in 2008 are shown on the horizontal axes. The variable shown on the vertical axes is given by the chart title.

92ECB
Occasional Paper No 113
June 2010
Chart A10 Cross-sectional charts – diesel
(x-axis: diesel, excluding taxes)
Prices with taxes (euro cent/litre) VAT (%)
FI
SK
SI
PTAT
NL
MT LUCY
IT
FR
ES
GR
IE
DE
BE
100
105
110
115
120
125
130
135
140
100
105
110
115
120
125
130
135
140
7462 64 66 68 70 72
FI
SK
SIPT
AT
NL
MT
CY
ITFR
ES
GR
IE
DE
BE
14
15
16
17
18
19
20
21
22
23
14
15
16
17
18
19
20
21
22
23
LU
7462 64 66 68 70 72
Excise taxes (euro cent/litre) Number of cars (logarithmic scaling)
FI
SK
SI
PTATNL
MT
LU
CY
ITFR
ES
GR
IE
DE
BE
20
24
28
32
36
40
44
48
52
20
24
28
32
36
40
44
48
52
62 64 66 68 70 72 74
FI
SKSI
PTAT
NL
MTLU CY
ITFR ES
GR
IE
DE
BE
100
1,000
10,000
100,000
100
1,000
10,000
100,000
7462 64 66 68 70 72
Geographic area (km2, logarithmic scaling) Whole economy price level (EU = 100)
FI
SK
SI
PTAT
NL
MT
LU
CY
ITFR ES
GRIE
DE
BE
100
1,000
10,000
100,000
1,000,000
100
1,000
10,000
100,000
1,000,000
7462 64 66 68 70 72
FI
SK
SI PT
ATNL
MT
LU
CY
IT
FR
ES GR
IE
DE
BE
0.6
0.7
0.8
0.9
1.0
1.1
1.2
1.3
0.6
0.7
0.8
0.9
1.0
1.1
1.2
1.3
7462 64 66 68 70 72
Sources: Eurostat, European Commission, various national sources and Eurosystem staff calculations.Notes: Consumer diesel prices (euro cent/litre), excluding taxes, in 2008 are shown on the horizontal axes. The variable shown on the vertical axes is given by the chart title.

93ECB
Occasional Paper No 113
June 2010
ANNEXES
Chart A10 Cross-sectional charts – diesel (cont’d)
(x-axis: diesel, excluding taxes)
Distance from Rotterdam (km) Petrol stations per capita
BE
DE
IE
GR
ES
FR
IT
CY
LU
MT
NL
AT
PT
SISK
FI
0
500
1,000
1,500
2,000
2,500
3,000
3,500
0
500
1,000
1,500
2,000
2,500
3,000
3,500
7462 64 66 68 70 72
BE
DE
IE
GR
ES
FR
IT
CY
LU
MT
NL
AT
PTSI
SK
FI
0
100
200
300
400
500
600
700
800
0
100
200
300
400
500
600
700
800
7462 64 66 68 70 72
Sales per petrol station (€1,000) Degree of self service (percentages)
BE
DE
IE
GR
ESFR
IT
LUNL ATFI
0
500
1,000
1,500
2,000
2,500
3,000
3,500
0
500
1,000
1,500
2,000
2,500
3,000
3,500
7462 64 66 68 70 72
BE
DEIE
GR
ES
FR
IT
LU
NL
AT
FI
0
20
40
60
80
100
120
0
20
40
60
80
100
120
7462 64 66 68 70 72
Degree of cross-selling (percentage of sales) Domestic demand/domestically refined
BE
DE IE
ESFR
IT
NL
AT
PT
0
5
10
15
20
25
30
35
40
0
5
10
15
20
25
30
35
40
7462 64 66 68 70 72
FI
SK
SI
PTAT
NL
CY
ITFRES
GR
IE
DE
BE
0.0
0.5
1.0
1.5
2.0
2.5
3.0
0.0
0.5
1.0
1.5
2.0
2.5
3.0
74
MT LU
62 64 66 68 70 72
Sources: Eurostat, European Commission, various national sources and Eurosystem staff calculations.Notes: Consumer diesel prices (euro cent/litre), excluding taxes, in 2008 are shown on the horizontal axes. The variable shown on the vertical axes is given by the chart title.

94ECB
Occasional Paper No 113
June 2010
Chart A10 Cross-sectional charts – diesel (cont’d)
(x-axis: diesel, excluding taxes)
Market share of the three largest companies (percentages)
FISK
SI
PT
AT
MT
LU CY
IT
FR
ES
IE
DE
BE
0
20
40
60
80
100
120
0
20
40
60
80
100
120
7462 64 66 68 70 72
Market share of supermarkets (percentages)
PT
AT IT
FR
ES GRIEDE BE
0
5
10
15
20
25
30
35
40
0
5
10
15
20
25
30
35
40
7462 64 66 68 70 72
Petrol excluding taxes (euro cent/litre)
FI
SK
SI
PT
AT
NL
MT
LU
CY IT
FR
ES
GR
IE
DE
BE
50
52
54
56
58
60
50
52
54
56
58
60
7462 64 66 68 70 72
Sources: Eurostat, European Commission, various national sources and Eurosystem staff calculations.Notes: Consumer diesel prices (euro cent/litre), excluding taxes, in 2008 are shown on the horizontal axes. The variable shown on the vertical axes is given by the chart title.

95ECB
Occasional Paper No 113
June 2010
ANNEXES
Chart A11 Cross-sectional charts – heating fuel
(x-axis: heating fuel, excluding taxes)
Prices with taxes (euro cent/litre) VAT (percentages)
FI
SK
SI
PTAT
NL
LU
CY
IT
FRESGR
IEDE
BE
60
70
80
90
100
110
120
130
140
60
70
80
90
100
110
120
130
140
58 60 62 64 66 68 70 72 74 76
FI
SKSI
PT
ATNL
LU
CY
ITFR
ES
GR
IE
DE
BE
10
12
14
16
18
20
22
24
10
12
14
16
18
20
22
24
7658 60 62 64 66 68 70 72 74
Excise taxes (euro cent/litre) Population (millions, logarithmic scaling)
FI
SKSI
PT
AT
NL
LU
CY
IT
FRES
GR
IEDEBE
0
5
10
15
20
25
30
35
40
45
0
5
10
15
20
25
30
35
40
45
58 60 62 64 66 68 70 72 74 76
FISK
SI
PT
AT
NL
LUCY
ITFRES
GR
IE
DE
BE
0
1
10
100
0
1
10
100
7658 60 62 64 66 68 70 72 74
Geographic area (km2, logarithmic scaling) Whole economy price level (EU = 100)
FI
SKSI
PTAT
NL
LU
CY
ITFRES
GR IEDE
BE
100
1,000
10,000
100,000
1,000,000
100
1,000
10,000
100,000
1,000,000
58 60 62 64 66 68 70 72 74 76
FI
SK
SIPT
AT
NL
LU
CY
IT
FR
ESGR
IE
DE
BE
0.6
0.7
0.8
0.9
1.0
1.1
1.2
1.3
0.6
0.7
0.8
0.9
1.0
1.1
1.2
1.3
7658 60 62 64 66 68 70 72 74
Sources: Eurostat, European Commission, various national sources and Eurosystem staff calculations.Notes: Consumer gas (heating) oil prices (euro cent/litre), excluding taxes, in 2008 are shown on the horizontal axes. The variable shown on the vertical axes is given by the chart title.

96ECB
Occasional Paper No 113
June 2010
Chart A11 Cross-sectional charts – heating fuel (cont’d)
(x-axis: heating fuel, excluding taxes)
Distance from Rotterdam (km) Population density (logarithmic scaling)
FI
SKSI
PT
AT
NL LU
CY
IT
FR
ES
GR
IE
DE
BE0
500
1,000
1,500
2,000
2,500
3,000
3,500
0
500
1,000
1,500
2,000
2,500
3,000
3,500
58 60 62 64 66 68 70 72 74 76
FI
SKSI
PTAT
NL
LU
CY
IT
FR
ESGRIE
DE
BE
10
100
1,000
10
100
1,000
7658 60 62 64 66 68 70 72 74
Domestic demand/domestically refined Number of refineries
FI
SK
SI
PT
AT
NL
LU CY
ITFR
ES
GR
IE
DE
BE
0.0
0.5
1.0
1.5
2.0
2.5
3.0
0.0
0.5
1.0
1.5
2.0
2.5
3.0
58 60 62 64 66 68 70 72 74 76
FISKSI
PTAT
NL
LU CY
IT
FR
ES
GR
IE
DE
BE
0
2
4
6
8
10
12
14
16
18
0
2
4
6
8
10
12
14
16
18
58 60 62 64 66 68 70 72 74 76
Petrol prices excluding taxes (euro cent/litre) Diesel prices excluding taxes (euro cent/litre)
FISK
SI
PT
AT
NL
LU
CY IT
FR
ES
GR
IE
DE
BE
51
52
53
54
55
56
57
58
59
60
51
52
53
54
55
56
57
58
59
60
7658 60 62 64 66 68 70 72 74
FI
SK
SI
PT
AT
NL
LU
CYIT
FR
ES
GR
IE
DE
BE
63
64
65
66
67
68
69
70
71
72
73
63
64
65
66
67
68
69
70
71
72
73
58 60 62 64 66 68 70 72 74 76
Sources: Eurostat, European Commission, various national sources and Eurosystem staff calculations.Notes: Consumer gas (heating) oil prices (euro cent/litre), excluding taxes, in 2008 are shown on the horizontal axes. The variable shown on the vertical axes is given by the chart title.

97ECB
Occasional Paper No 113
June 2010
ANNEXES
Table A1 Overview of euro area electricity generation
euro area BE DE IE GR ES FR IT
Size (TWh) (2007) 2,318,882 88,820 637,101 28,226 63,497 303,293 569,841 313,887Growth (1990-2007)
Total 2.1 1.3 0.9 4.0 3.6 4.2 1.8 2.2
Nuclear 1.2 0.7 -0.5 - - 0.1 2.0 -Non-renew. conv. thermal
2.2 1.7 0.3 3.7 3.4 5.8 1.1 2.2
Renewables 4.4 8.7 9.3 7.3 6.2 5.3 1.5 2.8Share (2007) (%)
Nuclear 31 54 22 - - 18 77 0
Non-renew. conv. thermal 52 40 62 89 92 61 10 83
Coal 15 7 21 19 0 23 4 14Lignite 10 - 26 8 55 1 0 0Oil 4 1 2 7 15 6 1 11Gas 22 29 12 55 22 31 4 55Other 1 3 2 0 0 1 1 2
Renewables 20 10 20 11 9 22 14 20
Hydro 10 2 4 4 5 10 11 12Wind 4 1 6 7 3 9 1 1Other 6 7 10 1 1 3 2 6
Gross trade fl ows (2007) 1) 19 28 17 5 13 8 14 16Net imports (1990-2007) 1) 1 5 0 2 3 1 -12 16Inter-trading (2007) 1), 2) 9 10 7 0 3 3 2 1
Sources: Eurostat and Eurosystem staff calculations.1) As a percentage of total fi nal inland consumption of electricity.2) Measures offsetting imports and exports; calculated as the minimum of either imports or exports.
Table A1 Overview of euro area electricity generation (cont'd)
CY LU MT NL AT PT SI SK FI
Size (TWh) (2007) 4,871 4,001 2,296 103,241 63,430 47,253 15,043 28,056 81,249Growth (1990-2007)
Total 5.5 6.5 4.4 2.1 1.4 3.0 1.1 0.9 2.4
Nuclear - - - 1.1 - - 1.2 1.4 1.2Non-renew. conv. thermal
5.5 10.7 4.4 1.7 0.8 3.0 1.2 -1.3 3.3
Renewables - 1.7 - 11.8 2.0 3.4 1.0 4.8 3.1Share (2007) (%)
Nuclear - - - 4 - - 38 55 29
Non-renew. conv.
thermal0 72 0 87 30 64 40 27 41
Coal - - - 24 10 26 4 10 17Lignite - - - - 0 - 33 7 9Oil - 0 - 2 2 10 0 3 1Gas - 72 - 57 16 28 3 6 13Other 0 0 0 4 3 0 0 2 1
Renewables 0 30 0 14 76 40 23 20 42
Hydro - 23 - 0 61 22 22 16 17Wind 0 2 0 3 3 9 - 0 0Other 0 6 - 11 13 9 2 4 25
Gross trade fl ows (2007) 1) 0 243 0 28 59 25 80 91 22Net imports (1990-2007) 1) 0 293 0 16 2 5 -9 3 13Inter-trading (2007) 1), 2) 0 72 0 5 24 5 39 42 4
Sources: Eurostat and Eurosystem staff calculations.1) As a percentage of total fi nal inland consumption of electricity.2) Measures offsetting imports and exports; calculated as the minimum of either imports or exports.

98ECB
Occasional Paper No 113
June 2010
Table A2 Estimated future energy trends, baseline and policy action scenarios
European Commission (DG-TREN, 2008) IEA (2009)
Baseline scenario Action scenario Reference scenario 450 scenario
2005 2020 2020 2020 2020
Index Share Index Share Index Share Index Share Index Share
Primary energy demand 100 100 105-109 100 92-95 100 95 100 92 100Oil 100 37 97-105 34-36 85-91 34-36 84 32 77 31
Gas 100 25 100-113 23-26 78-90 21-23 104 27 96 26
Solids 100 18 106-107 17-18 68-79 13-15 81 15 64 12
Renewables 100 7 160-180 10-12 220-223 16-16 196 14 217 16
Nuclear 100 14 86-97 11-13 85-91 13-14 79 12 100 15
Final energy demand 100 100 111-116 100 98-102 100 107 100 103 100Industry 100 28 110-114 27-28 105-109 30-30 93 24 91 25
Residential 100 26 104-109 25-25 89-92 24-24 126 48 123 49
Tertiary 100 15 111-118 15-15 89-92 14-14
Transport 100 31 117-121 33-33 104-108 33-33 96 28 86 26
Other
Oil 100 42 101-110 39-40 88-94 38-39 102 40 93 38
Gas 100 25 100-109 22-23 82-89 21-22 100 23 95 23
Solids 100 5 104-106 4-4 94-94 4-4 58 2 53 2
Electricity 100 20 127-127 22-23 108-109 22-23 113 21 112 22
Heat 100 4 107-112 3-3 100-100 3-4 159 5 151 5
Other 100 5 162-191 7-8 213-220 10-11 182 8 204 9
Electricity
generation 100 100 124-125 100 105-107 100 110 100 109 100
Nuclear 100 30 87-98 21-24 85-91 25-26 77 22 99 28
Renewables 100 15 169-182 20-22 223-224 31-32 211 29 230 31
Fossil fuels 100 55 123-133 54-59 83-84 43-44 100 50 81 41
CO2 energy emiss. 98 - 98-105 - 78-80 - 88 - 77 -
Index % Index % Index %
Dependence 100 52.1 116-123 61-64 107-112 56-59Oil 100 81.6 113-114 93-93 112-113 92-92
Gas 100 57.7 129-134 75-77 123-127 71-73
Solids 100 39.2 145-149 57-59 125-128 49-50
Sources: European Commission, IEA and Eurosystem staff calculations.Notes: Dependence is defi ned as net imports as a percentage of total gross inland consumption. In the European Commission projections, the baseline scenario includes trends and policies implemented up to the end of 2006 and the action scenario assumes implementation of new policies to reach energy and climate targets. In the IEA projections, the reference scenario describes what would happen if governments take no new initiatives beyond those already adopted by mid-2009 and the 450 scenario assumes governments adopt commitments and policies to limit the long-term concentration of greenhouse gases in the atmosphere to 450 parts per million of carbon dioxide equivalent.

99ECB
Occasional Paper No 113
June 2010
ANNEXES
Table A3 HICP weights
(2009)
euro area
BE DE IE GR ES FR IT CY LU MT NL AT PT SI SK FI
HICP 100.0 100.0 100.0 100.0 100.0 100.0 100.0 100.0 100.0 100.0 100.0 100.0 100.0 100.0 100.0 100.0 100.0
HICP excl. energy 90.4 89.1 88.3 91.2 92.7 89.6 91.9 92.2 88.0 89.1 93.5 89.8 92.2 89.1 88.4 83.7 92.9
Energy 9.6 10.9 11.7 8.8 7.3 10.4 8.1 7.8 12.0 10.9 6.5 10.2 7.8 10.9 11.6 16.3 7.1
Liquid fuels 4.7 4.7 4.6 4.8 5.8 6.5 4.4 4.0 7.9 8.5 4.0 4.1 3.9 5.8 7.0 2.4 4.8
Transport 4.0 3.6 3.7 3.9 3.6 6.0 3.7 3.3 7.0 7.7 4.0 4.1 3.3 5.6 5.5 2.4 4.3
Home heating 0.7 1.1 1.0 0.9 2.1 0.5 0.7 0.7 0.8 0.8 0.0 0.0 0.6 0.2 1.5 0.0 0.5
Sources: Eurostat and Eurosystem staff calculations.
Table A4 Annual average rates of change
(percentages; 1996-2009)
euro area
BE DE IE GR ES FR IT CY LU MT NL AT PT SI SK FI
HICP 2.0 2.0 1.5 2.8 3.8 2.9 1.7 2.4 2.7 2.3 2.8 2.2 1.7 2.6 6.0 6.0 1.7
HICP excl. energy 1.8 1.7 1.2 2.7 3.8 2.8 1.6 2.4 2.3 2.2 2.6 1.8 1.5 2.6 4.4 4.8 1.5
Energy 3.9 4.5 4.6 4.8 4.1 3.6 3.1 3.2 7.1 4.6 6.7 5.9 3.5 3.6 6.7 13.8 4.0
Liquid fuels 4.6 6.2 5.1 4.9 4.7 4.6 4.3 3.2 7.2 5.9 6.2 4.2 4.7 4.6 6.9 5.2 4.4
Transport 3.9 4.4 4.2 4.4 4.4 4.3 3.7 2.9 6.5 4.8 6.2 4.2 3.9 4.6 6.8 5.1 3.8
Home heating 8.5 12.6 10.3 8.2 6.5 8.6 8.1 4.4 12.2 11.4 - - 8.9 - 8.7 - 10.3
Sources: Eurostat and Eurosystem staff calculations.
Table A5 Standard deviation of month-on-month rates of change
(percentage points; 1996-2009)
euro area
BE DE IE GR ES FR IT CY LU MT NL AT PT SI SK FI
HICP 0.3 0.8 0.4 0.5 1.2 0.5 0.3 0.4 1.1 0.6 1.4 0.5 0.3 0.4 0.5 0.9 0.4
HICP excl. energy 0.3 0.9 0.4 0.5 1.3 0.5 0.2 0.5 1.2 0.6 1.4 0.6 0.3 0.4 0.5 0.5 0.3
Energy 1.5 2.1 1.7 1.8 2.8 1.8 1.6 1.2 2.7 3.0 2.3 2.0 1.7 1.3 2.4 3.7 2.2
Liquid fuels 2.7 3.8 3.4 3.2 3.7 2.8 2.7 2.0 3.3 3.8 2.9 2.7 3.1 2.3 3.7 3.0 3.3
Transport 2.4 2.8 3.0 2.9 3.4 2.7 2.4 2.0 3.1 3.5 2.9 2.7 2.9 2.3 3.5 3.0 3.1
Home heating 4.9 7.1 6.6 5.3 6.7 4.6 5.1 2.2 5.8 7.1 - - 4.8 - 5.7 - 6.9
Sources: Eurostat and Eurosystem staff calculations.
Table A6 Frequency of change in index
(percentages; 1996-2009)
euro area
BE DE IE GR ES FR IT CY LU MT NL AT PT SI SK FI
HICP 89 95 90 90 98 93 91 90 98 93 94 95 91 94 97 94 91
HICP excl. energy 98 99 86 91 99 98 99 91 99 98 99 100 98 99 100 100 99
Energy 100 100 98 95 99 100 100 94 99 99 35 99 99 96 100 95 100
Liquid fuels 100 99 98 98 99 100 100 94 57 91 31 99 99 69 100 91 100
Transport 98 99 96 94 99 99 97 96 57 91 30 99 98 69 97 91 98
Home heating 99 98 98 98 60 99 100 96 43 85 - - 100 - 97 - 98
Sources: Eurostat and Eurosystem staff calculations.

100ECB
Occasional Paper No 113
June 2010
Table A7 HICP weights
(2009)
euro area
BE DE IE GR ES FR IT CY LU MT NL AT PT SI SK FI
HICP 100.0 100.0 100.0 100.0 100.0 100.0 100.0 100.0 100.0 100.0 100.0 100.0 100.0 100.0 100.0 100.0 100.0
HICP excl. energy 90.4 89.1 88.3 91.2 92.7 89.6 91.9 92.2 88.0 89.1 93.5 89.8 92.2 89.1 88.4 83.7 92.9
Energy 9.6 10.9 11.7 8.8 7.3 10.4 8.1 7.8 12.0 10.9 6.5 10.2 7.8 10.9 11.6 16.3 7.1
Non-oil 4.8 6.2 7.0 4.0 1.5 3.9 3.7 3.8 4.2 2.5 2.5 6.2 3.9 5.1 4.6 13.9 2.3
Gas 1.8 3.0 2.0 1.0 0.1 1.3 1.4 2.4 0.6 1.0 0.3 4.1 0.8 1.6 0.9 4.0 0.0
Electricity 2.3 3.1 3.1 2.1 1.2 2.6 2.1 1.3 3.4 1.3 2.2 2.0 1.9 3.4 2.3 4.5 2.2
Heat energy 0.6 0.0 1.8 0.0 0.0 0.0 0.2 0.0 0.0 0.1 0.0 0.0 0.6 0.0 0.8 4.9 0.1
Solid 0.1 0.1 0.1 1.0 0.3 0.0 0.1 0.1 0.2 0.0 0.0 0.0 0.6 0.1 0.7 0.4 0.0
Sources: Eurostat and Eurosystem staff calculations.
Table A8 Annual average rates of change
(percentages; 1996-2009)
euro area
BE DE IE GR ES FR IT CY LU MT NL AT PT SI SK FI
HICP 2.0 2.0 1.5 2.8 3.8 2.9 1.7 2.4 2.7 2.3 2.8 2.2 1.7 2.6 6.0 6.0 1.7
HICP excl. energy 1.8 1.7 1.2 2.7 3.8 2.8 1.6 2.4 2.3 2.2 2.6 1.8 1.5 2.6 4.4 4.8 1.5
Energy 3.9 4.5 4.6 4.8 4.1 3.6 3.1 3.2 7.1 4.6 6.7 5.9 3.5 3.6 6.7 13.8 4.0
Non-oil 3.5 3.3 4.4 5.4 2.6 1.9 1.7 3.3 7.1 3.5 7.3 7.4 2.6 2.6 6.6 16.5 4.0
Gas 5.5 6.2 6.2 6.4 5.6 4.5 5.2 4.1 9.1 5.9 5.6 8.7 4.6 6.1 10.1 18.1 -
Electricity 1.8 1.7 2.8 5.2 2.2 0.8 -0.3 2.3 7.7 2.5 7.8 5.5 2.1 1.5 5.3 16.5 3.8
Heat energy 5.8 - 6.2 5.4 - - 4.4 - - 8.0 - - 2.3 - 10.1 15.9 4.7
Solid 2.5 1.5 1.7 5.3 4.6 - 2.3 - 0.6 1.1 - - 2.6 0.5 7.0 8.9 7.3
Sources: Eurostat and Eurosystem staff calculations.
Table A9 Standard deviation of month-on-month rates of change
(percentage points; 1996-2009)
euro area
BE DE IE GR ES FR IT CY LU MT NL AT PT SI SK FI
HICP 0.3 0.8 0.4 0.5 1.2 0.5 0.3 0.4 1.1 0.6 1.4 0.5 0.3 0.4 0.5 0.9 0.4
HICP excl. energy 0.3 0.9 0.4 0.5 1.3 0.5 0.2 0.5 1.2 0.6 1.4 0.6 0.3 0.4 0.5 0.5 0.3
Energy 1.5 2.1 1.7 1.8 2.8 1.8 1.6 1.2 2.7 3.0 2.3 2.0 1.7 1.3 2.4 3.7 2.2
Non-oil 0.7 1.4 0.9 1.5 1.1 1.1 0.7 1.2 2.9 1.1 3.6 2.5 0.9 0.7 1.1 4.6 0.9
Gas 1.3 2.5 1.8 3.7 0.8 2.7 1.7 1.2 3.8 2.4 3.0 3.1 1.9 1.2 2.2 6.6 -
Electricity 0.6 1.1 1.2 2.2 1.3 0.9 0.4 1.5 3.5 1.4 4.4 2.7 1.1 0.9 1.6 6.0 0.9
Heat energy 0.9 - 0.8 1.4 - - 7.8 - - 1.8 - - 0.6 - 2.8 4.8 1.6
Solid 0.5 1.1 0.3 1.2 0.6 - 0.4 - 0.7 1.0 - - 1.0 1.9 2.4 1.0 5.1
Sources: Eurostat and Eurosystem staff calculations.

101ECB
Occasional Paper No 113
June 2010
ANNEXES
Table A10 Frequency of change in index
(percentages; 1996-2009)
euro area
BE DE IE GR ES FR IT CY LU MT NL AT PT SI SK FI
HICP 89 95 90 90 98 93 91 90 98 93 94 95 91 94 97 94 91
HICP excl. energy 98 99 86 91 99 98 99 91 99 98 99 100 98 99 100 100 99
Energy 100 100 98 95 99 100 100 94 99 99 35 99 99 96 100 95 100
Non-oil 100 99 86 50 98 48 90 80 99 94 27 52 96 95 100 83 87
Gas 91 92 83 45 96 46 80 82 37 80 23 37 45 77 92 59 -
Electricity 72 87 60 17 12 10 17 35 98 60 11 50 41 15 18 7 68
Heat energy 96 - 93 91 - - 8 - - 93 - - 39 - 89 35 28
Solid 95 81 83 55 79 - 90 - 28 21 - - 94 94 61 98 97
Sources: Eurostat and Eurosystem staff calculations.

102ECB
Occasional Paper No 113
June 2010
Table A11 Key structural features of European transport fuel markets
Stock of passenger cars (000s)
Passenger cars per 1,000 capita
1,000 passenger car km travelled
per capita
Number of petrol stations
Petrol stations per (1,000,000)
capita
Sales per petrol station (€1,000)
2006 2006 2006 2007 2007 2007
euro area 166,255 507 10.1 83,408 256 2,600
BE 4,976 468 10.4 3,295 310 1,689
DE 46,570 567 10.6 14,902 181 3,058
IE 1,779 401 6.6 1,092 251 1,400
GR 4,543 405 8.1 8,200 733 876
ES 20,637 453 7.7 8,668 193 2,848
FR 31,002 483 11.4 12,929 203 3,180
IT 35,297 589 11.8 21,879 368 1,618
CY 373 471 6.5 252 321 -
LU 315 645 14.8 235 490 2,385
MT 218 529 4.9 91 222 -
NL 7,230 440 9.1 3,610 220 2,743
AT 4,205 504 8.7 2,810 338 2,299
PT 4,290 404 6.8 2,200 207 -
SI 980 480 11.5 410 203 -
SK 1,334 247 4.8 860 159 -
FI 2,506 472 11.8 1,975 373 2,470
Sources: European Commission, various national sources and Eurosystem staff calculations.
Table A11 Key structural features of European transport fuel markets (cont'd)
Share of self-service
stations (%)
Degree of cross-selling
(% of sales)
Number of refi neries
Share of demand covered by domestic
refi neries (%)
Market share of the three largest
companies (%)
Share of supermarket
retailers (%)2007 2005 2008 2005 2005 2007
euro area 72 18 74 122 49 8.8
BE 65 14 4 185 72 2.0
DE 99 34 14 118 53 2.0
IE 81 35 1 36 77 1.0
GR 1 - 4 133 - 0.3
ES 24 14 10 91 66 2.1
FR 98 13 12 103 21 35.0
IT 29 3 16 139 51 0.4
CY - - 0 0 73 -
LU 100 - 0 0 55 -
MT - - 0 0 100 -
NL 98 17 6 241 - 0.3
AT 68 26 1 72 43 0.0
PT - 6 2 97 70 9.0
SI - - 1 0 100 -
SK - - 1 206 90 -
FI 100 - 2 151 57 -
Sources: European Commission, various national sources and Eurosystem staff calculations.

103ECB
Occasional Paper No 113
June 2010
ANNEXES
Table A12 Pass-through of refined gas oil prices into consumer prices (excl. taxes) for diesel and heating fuel (from models estimated over the period 2000-2009)
(euro cent)
Diesel Heating fuelWeek 1 Week 2 Week 3 Week 4 Week 8 Week 12 Week 1 Week 2 Week 3 Week 4 Week 8 Week 12
Euro area 3.3 7.8 9.0 9.3 10.1 10.5 1.6 5.6 7.5 8.3 9.9 10.2BE 2.4 8.1 9.0 9.3 10.1 10.9 2.2 7.9 9.0 10.1 10.5 10.4
DE 4.1 9.1 9.8 9.5 10.0 10.5 1.5 7.5 9.4 9.5 11.2 11.0
IE -0.3 3.0 4.5 7.1 8.8 9.9 0.1 -0.0 0.7 1.2 2.7 6.5
GR 1.0 5.3 8.1 9.9 10.9 11.9 1.1 5.6 8.2 9.1 10.7 10.3
ES 1.2 3.2 6.9 8.8 10.1 9.7 1.5 4.0 5.8 6.9 8.7 9.3
FR 2.6 7.1 8.8 9.3 10.0 10.4 1.7 6.6 8.7 9.6 10.9 11.1
IT 3.5 6.5 7.6 8.5 9.6 9.8 1.0 3.6 5.9 7.2 9.1 9.3
LU 2.1 8.3 10.1 10.1 10.4 10.4 1.7 8.0 9.9 9.9 11.3 11.1
NL 4.9 8.9 10.2 9.4 9.8 10.7 4.7 9.2 9.9 9.4 10.4 10.5
AT 3.0 7.8 9.3 9.6 9.6 9.8 1.3 5.1 7.0 8.0 9.7 9.8
PT -0.1 0.9 3.4 5.1 5.9 6.4 -0.2 0.7 2.0 3.4 6.1 7.7
FI 4.0 7.5 7.5 8.2 10.5 10.5 3.7 6.7 5.2 5.2 8.6 8.5
Sources: Eurosystem staff calculationsNotes: Figures underlined and in italics denote 50% pass-through reached. Figures underlined denote 90% pass-through reached. Results on pass-through for the most recent members of the euro area (Cyprus, Malta, Slovenia and Slovakia) were not estimated as data are only available from 2005. The models used are described in Annex 2.4.
Table A13 Disaggregated prices for household consumers, 2008 H2
(consumer band Dc – annual consumption between 2,500 and 5,000 kWh)
Composition of household prices in euro per 100 kWh Share in price without tax (%)Total price Energy
and supplyNetwork costs Taxes and levies Energy
and supplyNetwork costs
Euro area 18.2 - - - - -
Euro area 1) 19.8 8.5 5.1 6.1 63 37
BE 20.8 9.0 6.9 3.6 56 44
DE 22.0 8.0 5.4 8.5 60 40
IE 20.3 - - - - -
GR 11.0 - - - - -
ES 15.6 8.9 3.8 2.8 70 30
FR 12.3 - - - - -
IT 22.0 11.1 4.9 5.4 70 30
CY 20.4 - - - - -
LU 15.6 6.2 7.5 1.9 45 55
MT 15.4 12.4 2.2 0.8 85 15
NL 17.8 - - - - -
AT 17.7 6.8 5.9 5.0 53 47
PT 15.3 7.0 4.0 4.3 64 36
SI 11.6 4.6 4.6 2.4 50 50
SK 15.3 6.5 6.3 2.4 51 49
FI 12.7 5.5 4.1 3.2 58 42
Source: European Commission (2009a), Eurostat and Eurosystem staff calculations. 1) Denotes euro area aggregate calculated on the basis of available country data (i.e. excluding Ireland, Greece, France, Cyprus and the Netherlands – approximately 25% of the euro area coverage). Italics denote Eurostat/Eurosystem estimates.

104ECB
Occasional Paper No 113
June 2010
Table A14 Simulation results for the expenditure components of GDP
(percentage point deviation from baseline)
Real private consumption Investment EmploymentYear 1 Year 2 Year 3 Year 1 Year 2 Year 3 Year 1 Year 2 Year 3
Belgium -0.04 -0.11 -0.12 -0.11 -0.45 -0.72 0.01 -0.04 -0.14
Germany -0.31 -0.53 -0.60 -0.17 -0.31 -0.34 0.04 0.00 -0.06
Ireland 0.00 -0.09 -0.19 0.00 -0.07 -0.09 0.00 0.00 -0.01
Greece -0.04 -0.11 -0.20 -0.26 -1.06 -2.31 -0.01 -0.05 -0.14
Spain -0.06 -0.12 -0.21 -0.10 -0.43 -0.55 0.00 -0.15 -0.34
France -0.04 -0.07 -0.10 -0.01 0.01 0.02 0.00 -0.01 -0.02
Italy -0.09 -0.31 -0.40 -0.04 -0.21 -0.42 -0.01 -0.08 -0.16
Cyprus -0.01 -0.06 -0.16 -0.02 -0.05 -0.07 0.00 -0.01 -0.02
Luxembourg -0.01 -0.04 -0.08 0.00 -0.15 -0.24 0.00 0.00 -0.01
Malta -0.12 -0.21 -0.14 -0.41 -0.93 -0.81 0.00 -0.17 -0.10
Netherlands -0.03 -0.13 -0.15 -0.05 -0.19 -0.24 -0.01 -0.02 -0.01
Austria -0.17 -0.19 -0.13 -0.08 -0.08 -0.02 -0.04 -0.05 -0.03
Portugal -0.07 -0.13 -0.20 -0.09 -0.11 -0.17 -0.01 -0.03 -0.04
Slovenia -0.11 -0.08 -0.13 0.40 -0.01 -0.20 0.01 -0.02 -0.06
Slovakia -0.34 -0.42 -0.39 -0.05 -0.08 -0.07 -0.02 -0.04 -0.06
Weighted average -0.14 -0.27 -0.33 -0.09 -0.24 -0.35 0.01 -0.04 -0.11
Minimum -0.34 -0.53 -0.60 -0.41 -1.06 -2.31 -0.04 -0.17 -0.34
Maximum 0.00 -0.04 -0.08 0.40 0.01 0.02 0.04 0.00 -0.01
Exports Imports Net exportsYear 1 Year 2 Year 3 Year 1 Year 2 Year 3 Year 1 Year 2 Year 3
Belgium -0.08 -0.31 -0.46 -0.04 -0.18 -0.26 -0.04 -0.12 -0.14
Germany -0.02 -0.07 -0.09 -0.18 -0.22 -0.24 0.07 0.05 0.06
Ireland 0.00 0.00 -0.01 0.01 -0.04 -0.10 -0.01 0.03 0.07
Greece 0.00 -0.04 -0.13 -0.19 -0.65 -1.24 0.07 0.18 0.14
Spain -0.03 -0.14 -0.11 -0.11 0.12 0.00 0.03 -0.08 -0.04
France -0.01 -0.03 -0.07 -0.06 -0.09 -0.10 0.02 0.02 0.01
Italy 0.00 -0.02 -0.05 -0.06 -0.17 -0.19 0.02 0.04 0.04
Cyprus 0.00 -0.03 -0.07 0.03 0.02 -0.04 -0.02 -0.02 -0.01
Luxembourg 0.00 -0.02 -0.04 -0.01 -0.04 -0.08 0.02 0.03 0.05
Malta -0.21 -0.33 -0.35 -0.08 -0.38 -0.45 -0.11 0.13 0.07
Netherlands -0.09 -0.15 -0.16 -0.10 -0.25 -0.26 0.00 0.06 0.04
Austria 0.00 -0.01 -0.01 -0.07 -0.06 -0.03 0.04 0.03 0.01
Portugal -0.03 -0.13 -0.26 -0.06 -0.12 -0.17 0.02 0.01 -0.02
Slovenia 0.00 -0.03 0.00 0.04 -0.08 -0.10 -0.03 0.04 0.07
Slovakia -0.07 -0.16 -0.23 -0.22 -0.34 -0.39 0.13 0.12 0.06
Weighted average -0.03 -0.09 -0.12 -0.10 -0.15 -0.19 0.03 0.02 0.02
Minimum -0.21 -0.33 -0.46 -0.22 -0.65 -1.24 -0.11 -0.12 -0.14
Maximum 0.00 0.00 0.00 0.04 0.12 0.00 0.13 0.18 0.14
Source: Eurosystem staff calculations.Notes: The simulations assume exogenous monetary and fi scal policy. Beyond this, the models are not harmonised and can differ with respect to their size, estimation period and theoretical underpinning. For a more detailed discussion, see Section 2.2 and Fagan and Morgan (2005).

105ECB
Occasional Paper No 113
June 2010
ANNEXES
2 TECHNICAL ANNEXES
2.1 TECHNICAL ANNEX TO BOX 2:
SECURITY OF ENERGY SUPPLY
Energy security is a multifaceted concept.
In order to outline its various facets, this box
makes use of a synthetic indicator, known as
an energy security index, which incorporates
information from a number of relevant variables.
The indicator draws from and develops on the
methodology proposed by Avedillo and Muñoz
(2007). The variables used, and the reasons for
choosing them, are as follows:
1. Degree of self-suffi ciency of primary
energies: it is assumed that greater control
over energy resources provides greater
assurance that the economy will keep
functioning in the event of an interruption
in supply. This variable is defi ned as the
proportion of consumption covered by
a country’s primary energy production,
that is:
primary energy production j
primary energy consumption j
where j is the euro area, each euro area
Member State or the United States.
2. Reliability of imports: assuming equality in
the share accounted for by primary energy
production, the impact of an interruption
in external supply is reduced by higher
diversifi cation of imports and by higher
political stability of the supplying countries.
The variable has been calculated by
multiplying the share of each source in the
supply of a given fuel (oil or gas) by the
political security of that country:
∑i[
[sigi∑i[
[si pi* g / M + * p / M
where si =7-r
i and r
i is the risk of each source
country i with values between 0 and 7 87; gi is
the proportion of gas imported by country j
from country i; pi is the proportion of crude
oil imported by country j from country i;
M=g+p.
3. Negotiating power in gas markets:
sometimes an exporting country may be
as dependent on its exports to a consumer
country as vice versa, and this endows the
latter with much negotiating power thereby
reducing the risk of interruption in supply.
This variable is defi ned as each country’s
share of the purchases from its main supplier
of gas, since this fuel causes the greatest
energy security confl icts in Europe:
natural gas exports
j
i
total natural gas exportsi
where i is the primary supplier of natural gas
to country j.
4. Imports of liquefi ed natural gas :
LNG imports afford the sector fl exibility
because they enable the importer to use
different suppliers or import routes if the
need arises. This variable consists of LNG
imports as a proportion of total natural gas
imports:
liquefied natural gas imports
j
total natural gas imports j
5. Degree of electrical connectivity: provides
fl exibility to the electricity sector in the event
of unforeseen occurrences. It is calculated
as imports plus exports as a fraction of
electricity consumption:
electricity consumption j
electricity imports j
electricity exports j+
6. Self-suffi ciency in electricity generation:
the vulnerability of the electricity system
to international shocks decreases with
increasing domestic electricity production.
For more details on the risk variable, see the country 87
risk classifi cations available on the OECD’s website at
www.oecd.org

106ECB
Occasional Paper No 113
June 2010
The variable is the proportion of total
electricity that is produced with domestic
energy (renewable and nuclear):
electricity production with renewable and nuclear
j
total electricity production j
7. Degree of diversifi cation of primary energies:
diversifi cation mitigates the vulnerability
of energy systems by reducing the impact
of a possible interruption in the supply
of any of the raw materials in a country’s
energy basket. It is defi ned as one minus the
Herfi ndahl index.
∑1-
i
e2
i
where i is primary energy consumption
(petroleum, natural gas, coal, nuclear and
renewables).
The foregoing variables were calculated for
the various Member States of the euro area and
the United States. The euro area is measured
in two different ways: fi rst, assuming that it
is an integrated single market and, therefore,
subtracting energy exchanges within the area.
The variable thus constructed is denoted
“euro area (aggregated)”. Second, the euro
area is measured as a simple mean of the
countries, denoted “euro area (average)”. Owing
to lack of information, the euro area is taken
as being formed by the 16 countries currently
composing it, less Cyprus, Luxembourg and
Malta. For this reason, the period considered
is 1993-2006. The sources used to construct
these variables are Eurostat, the EIA and the
OECD. These variables are represented in
Charts A12 to A18.
As can be seen in the charts, the situation and
behaviour of each country in respect of the
different variables considered is fairly
heterogeneous, although some general trends
can be identifi ed. Specifi cally, the degree of
self-suffi ciency in primary energies decreased
over time as a result of consumption growing
faster than production. In this respect,
the situation of the euro area countries differs
somewhat from that of the United States.
However, in general, the euro area countries
have increased the reliability of their imports,
owing to the more stable socio-economic
situation of their suppliers and to the replacement
of some of these suppliers by countries with
lower geopolitical risk. The negotiating power
of the euro area countries in the gas market has
not changed much, given that the source
of the bulk of these countries’ gas imports has,
with some exceptions such as the Netherlands 88,
remained the same. Similarly, the degree of
electrical connectivity has also increased,
although the growth in the fl ow of electricity
between countries has taken place within the
euro area, so this trend is not observed in the
euro area in aggregate. LNG imports continue to
be low, although they represent a substantial
volume in Spain. The differences in the levels of
self-suffi ciency in electricity generation refl ect
the different national energy policies followed.
Thus France, which clearly espouses nuclear
energy, and Austria, which embraces renewable
energies, are notable for their self-suffi ciency in
electricity generation. Ireland, however, has no
nuclear power stations and generates little power
from renewable sources. That said, the
variability of this variable increases with the
increasing weight of renewable energies.
Since self-suffi ciency in electricity generation is
generally higher in the larger countries than in
the smaller ones, the level for the aggregate
euro area is higher than that for the average
euro area. Moreover, this is one of the variables
in which the euro area is less vulnerable
than the United States. Finally, the degree of
diversifi cation of primary energy has increased
in seven of the euro area countries but has fallen
in Belgium and Ireland, the fi nal result
being very slight growth in the euro area as a
whole. Chart A19 gives the energy security
indices thus calculated for the United States and
For the Netherlands, this variable is higher than one because of 88
intra-EU statistical discrepancies (the use of different methods
for calculating the statistical value of dispatches – f.o.b. value –
arrivals – c.i.f. value – and triangular trade). Nevertheless,
the aggregated euro area variable is not affected by these
discrepancies because its main supplier of gas is Russian.

107ECB
Occasional Paper No 113
June 2010
ANNEXES
the two defi nitions of the euro area. The fi gure
for the aggregate euro area is higher than that
for the average euro area because the structure
for the euro area as a whole is more balanced
than that of the Member States individually.
Principal factor analysis was used to calculate
the weights of the above variables in the
synthetic indicator. This procedure requires all
the variables to be expressed in the same units
of measurement, so the seven variables were
fi rst normalised using the min./max. method. In
keeping with standard practice, the factors
meeting the following three criteria were
selected: having associated eigenvalues larger
than one; individually contributing to the
explanation of the overall variance by more than
10%; and cumulatively contributing to the
explanation of the overall variance by more than
60%. Based on these criteria and assuming the
euro area to be an integrated single market,
a single factor is selected, which explains 82%
of the overall variance. The weight of each
variable in the energy security index is equal to
the square of its factor loading divided by the
overall variance explained by that factor.89
The weights thus obtained are given in Table
A15. These same weights were used to calculate
the euro area (average) index.90
Charts A20 and A21 show how the situation of
the euro area (aggregated) has been changing
with respect to the United States. It can be
seen from the charts that the euro area has
progressively lost comparative advantage in
respect of the proportion of LNG in natural gas
imports, owing to the faster growth of this kind
of import in the United States. However, the
electricity sector continues to be less vulnerable
in the euro area than the United States, given
the euro area’s higher self-suffi ciency and
connectivity.
For more details about methodology, see OECD 2005.89
The euro area (average) is also calculated by averaging the 90
security indices of each of the 13 Member States which result
from applying factoral analysis to these countries and the United
States. Despite the fact that in this case the weights of the various
variables in the index are somewhat different, the index for the
average euro area is practically the same.

108ECB
Occasional Paper No 113
June 2010
Chart A12 Degree of self-sufficiency of primary energies
1.0
19932006
0.8
0.6
0.4
0.2
0.0
1.0
0.8
0.6
0.4
0.2
0.01 2 3 4 5 6 7 8 9 10 11 12 13 14 15 16
1 DE
2 BE
5 FI
6 GR
7 NL
8 FR
9 IE
10 ES
11 PT
12 SI
13 SK
14 euro area (aggregated)
15 euro area (average)
16 United States
3 IT
4 AT
Source: Eurosystem staff calculations.
Chart A13 Reliability of imports
8.0
19932006
6.0
4.0
2.0
0.0
8.0
6.0
4.0
2.0
0.01 2 3 4 5 6 7 8 9 10 11 12 13 14 15 16
1 DE
2 BE
5 FI
6 GR
7 NL
8 FR
9 IE
10 ES
11 PT
12 SI
13 SK
14 euro area (aggregated)
15 euro area (average)
16 United States
3 IT
4 AT
Source: Eurosystem staff calculations.
Chart A14 Negotiating power in gas market
1.6
1.2
0.8
0.4
0.0
1.6
1.2
0.8
0.4
0.0
1993
2006
1 2 3 4 5 6 7 8 9 10 11 12 13 14 15 16
1 DE
2 BE
5 FI
6 GR
7 NL
8 FR
9 IE
10 ES
11 PT
12 SI
13 SK
14 euro area (aggregated)
15 euro area (average)
16 United States
3 IT
4 AT
Source: Eurosystem staff calculations.
Chart A15 Imports of liquefied natural gas
1 2 3 4 5 6 7 8 9 10 11 12 13 14 15 16
1 DE
2 BE
5 FI
6 GR
7 NL
8 FR
9 IE
10 ES
11 PT
12 SI
13 SK
14 euro area (aggregated)
15 euro area (average)
16 United States
3 IT
4 AT
1.0
0.8
0.6
0.4
0.2
0.0
1.0
0.8
0.6
0.4
0.2
0.0
19932006
Source: Eurosystem staff calculations.

109ECB
Occasional Paper No 113
June 2010
ANNEXES
Chart A17 Self-sufficiency in electricity generation
1.0
19932006
0.8
0.6
0.4
0.0
0.2
1.0
0.8
0.6
0.4
0.0
0.2
1 2 3 4 5 6 7 8 9 10 11 12 13 14 15 16
1 DE
2 BE
5 FI
6 GR
7 NL
8 FR
9 IE
10 ES
11 PT
12 SI
13 SK
14 euro area (aggregated)
15 euro area (average)
16 United States
3 IT
4 AT
Source: Eurosystem staff calculations.
Chart A18 Degree of diversification of primary energies
0.8
0.6
0.4
0.2
0.0
0.8
0.6
0.4
0.2
0.0
1993
2006
1 2 3 4 5 6 7 8 9 10 11 12 13 14 15 16
1 DE
2 BE
5 FI
6 GR
7 NL
8 FR
9 IE
10 ES
11 PT
12 SI
13 SK
14 euro area (aggregated)
15 euro area (average)
16 United States
3 IT
4 AT
Source: Eurosystem staff calculations.
Chart A19 Energy security index
United States
euro area (aggregated)
euro area (average)
0.8
0.6
0.4
0.01994 1996 1998 2000 2002 2004 2006
0.2
0.8
0.6
0.4
0.0
0.2
Source: Eurosystem staff calculations.
Chart A16 Degree of electrical connectivity
1.2
19932006
1.0
0.8
0.6
0.4
0.0
0.2
1.2
1.0
0.8
0.6
0.4
0.0
0.2
1 2 3 4 5 6 7 8 9 10 11 12 13 14 15 16
1 DE
2 BE
5 FI
6 GR
7 NL
8 FR
9 IE
10 ES
11 PT
12 SI
13 SK
14 euro area (aggregated)
15 euro area (average)
16 United States
3 IT
4 AT
Source: Eurosystem staff calculations.

110ECB
Occasional Paper No 113
June 2010
Table A15
Variable Weight in energy security index
Degree of self-suffi ciency of primary energies 0.168
Reliability of imports 0.142
Negotiating power in gas markets 0.170
Imports of liquefi ed natural gas 0.156
Degree of electrical connectivity 0.108
Self-suffi ciency in electricity generation 0.165
Degree of diversifi cation of primary energies 0.090
Source: Eurosystem staff calculations.
Chart A20 Energy security
(1994)
euro area
United States = 1
Self-sufficiency
DiversificationImports
reliability
Negotiating
power in gas
market
Self-
sufficiency
in electricity
Electric
interconnectionsLiquefied
natural gas
imports
8
6
4
2
0
Source: Eurosystem staff calculations.
Chart A21 Energy security
(2006)
Importsreliability
Negotiatingpower in gas
market
Electricinterconnections
Liquefiednatural gas
imports
Self-sufficiency
in electricity
Diversification
Self-sufficiency
euro area
United States=1
8
6
4
2
0
Source: Eurosystem staff calculations.

111ECB
Occasional Paper No 113
June 2010
ANNEXES
2.2 OIL PRICE SHOCKS AND EURO AREA
OUTPUT IN THE BLANCHARD-GALI (2007)
FRAMEWORK
In the past decade a broad consensus over the
diminishing importance of oil price shocks
on output fl uctuations has emerged, mainly
motivated by the muted response of GDP in
the industrialised economies to the oil shocks
observed since the late 1990s compared with the
1970s.
In an infl uential paper Blanchard and Gali
(2007), using a SVAR, show that the output
reaction to an oil price shock for a set of
industrialised economies lessened substantially
after the mid-1980s. In some cases, the GDP
response has even become positive, lending
support to the view that recent oil price shocks
have been driven by a global demand expansion
that has lifted global output together with
commodity prices.
In their contribution, Blanchard and Gali analyse
separately the three largest euro area countries
(Germany, France and Italy) but not the euro
area as a whole. Here we report the results
obtained by fi tting their VAR model to euro area
data. The variables in the VAR are the log of the
dollar price of oil 91, consumer infl ation, GDP
infl ation, the wage rate, real GDP and
employment. The last fi ve variables enter the
model in quarterly rates of growth. The deviation
of labour productivity from a quadratic trend
enters each equation as an exogenous variable.
This exercise differs from that carried out
by Blanchard and Gali in two respects. First,
Blanchard and Gali identify only the oil shock
by assuming that the oil price is not affected
contemporaneously by any other variable in the
system (which is equivalent to assuming that
the oil price shock is equal to the residuals of
the oil price equation). Here we adopt a slightly
different approach, as we identify all the shocks
by using a Choleski factorisation of the residual
variance matrix. Oil prices are ordered fi rst
so that the defi nition of an oil price shock is
consistent with that used by Blanchard and Gali.
Second, rather than splitting the sample in two,
we use two windows containing, respectively,
36 and 35 samples of 85 observations and
then average responses across these two sets
of estimates. The former sample includes the
1970s, while the latter excludes them.
The results, presented in Table A16, are broadly
consistent with those of Blanchard and Gali.
The negative impact of oil price shocks on GDP
falls signifi cantly when one excludes the 1970s
from the analysis: the cumulated impact on GDP
falls from four to less than two decimal points.
Note that the full sample effects are very much
in line with those reported in the main text for
the euro area weighted average.92
The oil price is not converted into euros for consistency with 91
Blanchard and Gali’s specifi cation where the price of oil is not
converted into domestic currencies.
The results for infl ation, not shown here in the interest of 92
brevity, are consistent with those in Chapter 3 documenting the
diminished infl ationary effect of oil price shocks.
Table A16 Effect of a 10% oil price increase on GDP over different sample periods
(annual averages)
Year 1 Year 2 Year 3
First sub-sample -0.04 -0.23 -0.38
Second sub-sample 0.03 -0.05 -0.18
Full sample -0.03 -0.25 -0.32
Weighted average from structural models -0.08 -0.19 -0.24
Notes: This table indicates the short-run effects of a permanent increase in the price of oil by around 10% on annual real GDP in the euro area. Data are from the euro area-wide model. The fi gures denote cumulated deviations in percentage points from the respective baseline simulation with unchanged oil prices. The estimations of the model over the full sample are based on data from 1970Q1 to 2008Q4. The results for the different sub-samples refer to averages of results over two overlapping periods. The former period consists of 36 samples starting with 1970Q3-1991Q3 and ending with 1979Q2-2000Q2. The latter consists of 35 samples starting with 1979Q3-2000Q3 and ending with 1987Q4-2008Q4.

112ECB
Occasional Paper No 113
June 2010
2.3 COMPARISON OF WEEKLY OIL BULLETIN
AND HICP DATA
Although HICP data are the offi cial consumer
price data for the European Union and are
compiled to a very high standard in order to
ensure maximum comparability, they involve
some drawbacks when used for the purposes
of analysing consumer liquid fuel prices. First,
HICP data are only available in index form
and not in terms of actual price levels. This
has important implications for the analysis of
oil price pass-through and for the comparison
of price levels. Second, they are only available
inclusive of tax which, combined with the fi rst
point, prevents the calculation of pre-tax prices.
Lastly, HICP data are only available at a monthly
frequency. Given the high volatility of oil prices
and the high frequency of changes in consumer
liquid fuel prices, it is possible that data at a
higher frequency could provide better insight
into very short-term developments in consumer
liquid fuel prices.
Fortunately, data available from the European
Commission’s weekly Oil Bulletin on consumer
liquid fuel prices do not suffer many of these
drawbacks. First, these data are available in
terms of absolute prices (i.e. cent per litre).
Second, they are available both in terms of
pre-tax and post-tax prices and information is
provided on excise taxes and VAT rates. Third,
they are available at a weekly frequency –
the data are generally collected on the Monday
of each week. Furthermore, data are also
available in a very timely fashion, usually within
two to three days of the reference period
(at present, the data are released by the European
Commission on the Wednesday evening of the
same week that the data are collected).
In addition, the weekly Oil Bulletin data are
available for both petrol (euro 95) and diesel
prices and have been publicly available since
1994 – a similar period to the HICP liquid fuel
data. The availability of diesel prices is very
important given the growing relevance of diesel
cars for the euro area market – see Chart A23.
On the other hand, it should be noted that the
data are not compiled with the same degree of
harmonisation and assurance of quality as the
HICP data. This may particularly be an issue
when we come to consider price level
differences.93
Chart A22 below illustrates that the weekly
Oil Bulletin and HICP data for transport and
For an overview of methodologies and cross-country differences 93
in the collection of the weekly Oil Bulletin data, see European
Commission 2009b. Countries differ in the source of data used, the
degree of market coverage obtained and, in a number of instances,
data are not collected on the Monday as is the case for most
countries. A potentially more substantial difference, particularly
when it comes to comparing price levels, is that some countries
report prices with fi delity discounts while the Netherlands only
reports “advised” rather than actual pump prices.
Chart A22 Weekly Oil Bulletin (WOB) and HICP data
(a) Transport fuel (b) Heating fuel
70
80
90
100
110
120
130
140
150
70
80
90
100
110
120
130
140
150
2000 2001 2002 2003 2004 2005 2006 2007 2008 2009
HICP transport energy
WOB 95 octane petrol
WOB diesel
40
60
80
100
120
140
160
180
200
40
60
80
100
120
140
160
180
200
2000 2001 2002 2003 2004 2005 2006 2007 2008 2009
HICP liquid heating fuel
WOB heating fuel
Sources: Eurostat, European Commission (DG-TREN) and Eurosystem staff calculations.

113ECB
Occasional Paper No 113
June 2010
ANNEXES
heating fuels for the euro area co-move very
closely indeed. For heating fuels, the correlation
coeffi cient is 0.998 in level terms and 0.956
when considering month-on-month changes.
For transport fuels, the respective correlation
coeffi cients are 0.999 and 0.985. The high
degree of correlation is observed across most
countries for which data are available with some
exceptions. In Ireland, the correlation in levels is
quite high but relatively low in terms of month-
on-month changes; this is because the Irish Oil
Bulletin data are only collected at a monthly
frequency. The correlation of data for Greece
is very low for heating fuel, as the Oil Bulletin
data are quite seasonal owing to seasonal
variations in excise rates which are not evident
in the HICP data. Overall, notwithstanding
some country-specifi c caveats, the very close
co-movement of the weekly Oil Bulletin and
HICP data suggest that conclusions made based
on the analysis of weekly Oil Bulletin data will
most likely hold for offi cial HICP also.
2.4 ECONOMETRIC ASSESSMENT OF OIL PRICE
PASS-THROUGH INTO CONSUMER LIQUID
FUEL PRICES
The pass-through from oil to gasoline prices
has been extensively studied in a variety of
countries, with the bulk of papers written on US
data and some recent interest in the largest euro
area countries. The existing empirical evidence
is, however, extremely heterogeneous in terms
of the underlying research question, data and
methodology used. For instance, most studies
have focused on testing the hypothesis that
gasoline prices in a specifi c country respond
more promptly to upward than to downward
oil price changes. However, very few have
tackled the question whether the pass-through
is complete or not, and whether there exist
substantial cross-country differences in the
speed of adjustment of downstream prices to
oil price fl uctuations. Some studies have used
monthly data, while others have focused on
changes at a weekly or even daily frequency.
Some papers have argued that the adjustment is
non-linear, but few have explicitly clarifi ed the
value added of modelling non-linearity against
simpler linear alternatives. Critical assessments
of the existing evidence can be found in Geweke
(2004) and Manera and Frey (2007). However,
even these relatively recent overviews have
been made somewhat outdated by revived
interest and research on the topic, sustained by
the effect of volatility of oil prices in the past
decade on consumer price infl ation, particularly
across euro area countries.
Given the diversity of methodologies and
datasets covered, it is not surprising that the
fi ndings of this literature have been mixed.
In the United States, a number of studies based
on weekly data and on error correction models
(Karrenbock 1991, Borenstein et al. 1997, Balke
et al. 1998, Borenstein et al. 2002, Lewis 2003,
Ye et al. 2006) have tended to fi nd some
asymmetry in the response of gasoline prices to
various measures of upstream costs (oil prices
or wholesale gasoline prices) with some support
for non-linear adjustment (Radchenko 2005
and Al Gudhea et al. 2007). Notable exceptions
Chart A23 Relative importance of diesel across euro area countries
Diesel cars as a percentage of total new passenger car registrations
0
10
20
30
40
50
60
70
80
0
10
20
30
40
50
60
70
80
1990 1992 1994 1996 1998 2000 2002 2004 2006 2008
Belgium
Luxembourg
France
Spain
Portugal
Ireland
euro area
Finland
Austria
Italy
Germany
Netherlands
Greece
Sources: Eurostat, ACEA (European Automobile Manufacturers’ Association), ANFA (the Spanish association of car manufacturers) and Eurosystem staff calculations.

114ECB
Occasional Paper No 113
June 2010
are given by the GAO report (1993), Burdette
and Zyren (2002 and 2003) and Bachmaier and
Griffi n (2003). Bachmaier and Griffi n not only
fi nd little support for the asymmetry hypothesis
but also, specifying their model in absolute
price differences rather than log differences,
report impulse responses showing a full
pass-through to both negative and positive
oil price changes. Studies on the euro area
aggregate and on euro area countries confi rm
that the choice of working in levels rather than
log differences has important consequences for
the results – see, for example, Meyler 2009 and
Rodriguez 2009.
The (symmetric) pass-through from refi ned oil
prices to pre-tax prices is modelled using the
framework of the equation below.
∆Pi,t = ci,j + ∑αi,j,k ∆Pi,t-k + ∑ βi,j,k ∆Pj,t-k
+ γi,j (Pi,t-1 − θi, j P I ) k=1 k=0
Inn C
C
C
j,t-1
where, Pi
C is the consumer price (excluding
taxes) of oil energy type i (petrol, diesel or
heating fuel), Pj
I is the spot price of oil input j
(refi ned gasoline or refi ned gas oil). In addition,
we allow for, and test, a time trend variable in
the error correction term.
The model we use to test for asymmetry is
shown in the equation below.94 This is similar to
the fi rst, with the exception that allowance is
made for when refi ned prices are rising or
falling.
ΔP Δ+=k=1
K1
∑+ +Ci,t ΔPCi,t-ki,t
Δ+i,t
c+i, j α+
i, j,kk=0
K2
∑ ΔPIj,t-kβ +i, j,k
−CPi,t-1 Pj,t-1θi, jγ+ + +
i,jI
(
(
−++CPi,t-1 Pj,t-1θi, jγ+ − −
i,jI
(
(
−CPi,t-1 Pj,t-1θi, jγ−+ +
i,jI
(
(
−++CPi,t-1 Pj,t-1θi, jγ− − −
i,jI
(
(
−1(
(+k=1
K1
∑ +ΔPCi,t-kα−i, j,kk=0
K2
∑ ΔPIj,t-kβ −i, j,k+ci,j −
2
Generally, the results suggest little evidence
of economically meaningful asymmetry
(in a small number of cases, there is some
evidence of statistically signifi cant asymmetry,
however, when this is quantifi ed the effect is
quite marginal – see Table A17). Furthermore,
the statistically signifi cant results should
be interpreted with caution as they may be
misleading in one of two ways. First, in some
of the models with tight confi dence intervals,
coeffi cients are signifi cantly different in a
statistical sense but not in an economic sense
(i.e. the degree of apparent asymmetry while
statistically signifi cant is very small). Second,
in some of the models with wide confi dence
intervals, coeffi cients are not statistically
signifi cantly different owing to large standard
errors, but if the point estimates are taken
at face value, they may imply economically
meaningful differences in response to oil price
rises and decreases. Ultimately, the fact that
no statistically signifi cant asymmetric effects
are found across all fuel types in any of the
countries would lend further support to the view
that the power of these tests is relatively low and
the evidence for asymmetry is not compelling.
Note that the long-term coeffi cient in the error correction term 94
is the same for increases and decreases in upstream prices. This
is because it does not make sense that the long-term coeffi cient
would vary according to short-term price changes. In any case,
we tested the euro area results allowing for different long-run
coeffi cients and found that they were broadly similar.
Table A17 Summary of results of Wald tests for asymmetry in pass-through of refined oil prices into petrol, diesel and heating fuel prices
Petrol Diesel Heating fuel
euro area 0.52 0.37 0.16
BE 0.59 0.54 0.25
DE 0.39 0.52 0.38
IE 0.94 0.19 0.26
GR 0.11 0.26 0.24
ES 0.88 0.81 0.10
FR 0.02* 0.43 0.06*IT 0.19 0.00* 0.00*LU 0.02* 0.81 0.55
NL 0.21 0.00* 0.07*AT 0.82 0.03* 0.09*PT 0.30 0.13 0.89
FI 0.39 0.03* 0.15
Note: * denotes statistically signifi cant at standard levels.

115ECB
Occasional Paper No 113
June 2010
ANNEXES
2.5 GAS AND ELECTRICITY PRICE LEVELS
(HICP INDEX VS. PRICE LEVEL DATA)
Gas and electricity price level data (with and
without taxes, in euro per unit of energy) are
collected by Eurostat on a semi-annual basis.
Prices valid on the fi rst day of January and July
of each year were recorded until 2007, when the
methodology was substantially changed. That
change implied a new defi nition of the standard
consumption 95 used and a focus on six-month
average prices, so pre and post-2007 data are
not directly comparable. Focusing on pre-2007
data allows a comparison of these price level
data with HICP index data with a relatively
large sample.
Considering gas prices, a high degree of
correlation can be seen between year-on-year
price changes between the two datasets for
the euro area as whole, suggesting that these
data are representative of prices faced by
“typical” consumers. However, this is not
systematically the case at the country level. For
Germany, Ireland, France, Italy, Luxembourg,
the Netherlands and Slovenia, a high correlation
between the two data sources is found. In Belgium
and Spain, the correlation between HICP index
and price level data is weaker because there is an
additional lag in the HICP index data compared
with the price level data.96 In Austria the HICP
index and price level data are weakly correlated.
For Portugal and Slovakia not enough data are
available to draw strong conclusions: although
correlation appears weak in Slovakia where the
HICP seems to refl ect a regulated price.
Defi nition of the standard consumptions (selected as structural 95
or so-called Lisbon indicator).
Gas: Households pre-2007: type D3 (annual consumption
83.70 GJ); post-2007: type band D2 (annual consumption between
20 and 200GJ). Industry pre-2007: type I3-1 (annual consumption
41,860 GJ; load factor 200 days, 1,600 hours); post-2007: band I3
(annual consumption between 10,000 and 100,000 GJ).
Electricity: Households pre-2007: Dc (annual consumption
3,500 kWh of which night 1,300); post-2007: band Dc
(annual consumption between 2,500 and 5,000 kWh). Industry
pre-2007: Ie (annual consumption 2,000 MWh; maximum
demand 500 kW; annual load 4,000 hours); post-2007: band Ic
(annual consumption between 500 and 2,000 MWh).
In Spain this is the case particularly in the period 2000-05, 96
but not thereafter. In Belgium no lag can be found after 2007:
from 2007 the HICP only refl ects current price evolutions,
whereas before 2007 prices were recorded as 12-month averages
to refl ect an annual bill approach.
Chart A24 Euro area gas and electricity prices: comparison of HICP index and medium-sized household-level data1)
(annual rates of change on 1 January and 1 July; percentages)
price level database (weighted)
HICP index
a) Gas prices b) Electricity prices
-10
-5
0
5
10
15
20
25
-10
-5
0
5
10
15
20
25
1996 1998 1999 2001 2003 2005 2007-4
-2
0
2
4
6
8
10
-4
-2
0
2
4
6
8
10
1996 1998 1999 2001 2003 2005 2007
Sources: Eurostat and ESCB calculations.1) Price level data according to the pre-2007 methodology: prices valid on the fi rst of January and the fi rst of July. The same standard medium-sized household is used for each country. The euro area is weighted according to 2009 HICP countries and item weights, for countries for which data are available.

116ECB
Occasional Paper No 113
June 2010
As to electricity prices, the correlation between
year-on-year price changes according to the
HICP database and the price level database is
weaker than for gas prices, the euro area and at
the country level. Although the relationship is
relatively strong for some countries (Germany,
Spain, Cyprus, Portugal and Finland) it is rather
weak for others (Belgium, Italy, Luxembourg and
the Netherlands). The weak result for Belgium
is attributable to an additional lag in the HICP
which has the same methodological origin as for
gas prices. For other countries, a more general
possible explanation could be that electricity
prices vary more across different consumer
types than is the case for gas (for example,
inclusion of night tariffs). Thus, the Eurostat
defi nition of a standard consumer (according to
the Lisbon structural indicator database) may not
be as representative for all consumers. Indeed,
preliminary results considering the alternative
household defi nitions tend to indicate that the
standard consumer can differ from country
to country (i.e. the correlation between HICP
index and price level data can differ according
to the standard consumer used, and the HICP
is supposed to refl ect the national consumption
pattern very closely). This caveat should be kept
in mind when analysing electricity price levels.
2.6 ECONOMETRIC ASSESSMENT OF THE IMPACT
OF THE LIBERALISATION OF ELECTRICITY
AND GAS MARKETS ON CONSUMER PRICES
The effect of the liberalisation of European
gas and electricity markets on consumer prices
has been estimated using a panel framework
(see equation below).
N
j=1
γDtPi,t + ++= αi ∑ βj Xj,t εi,t
where Pi, t
is the level of consumer electricity (gas)
price net of all taxes, αi is a country, i fi xed effect,
Dt is a common time effect which captures a
common trend across countries 97 and Xj, t
is a set
of j explanatory variables, for j = 1, ..., N.
They include competition/regulation indicators,
consumption intensity and dependency indicators,
international gas and oil prices and a set of control
variables such as population and its density.
The model computes structural coeffi cients
common across countries for the set of Xt
explanatory variables. The sample is based on the
available data for 16 euro area countries analysed
over 16 years – from 1991 to 2007. In order
to obtain estimated coeffi cients that refl ect a
euro area average, the estimation procedure
should account for country differences other
than the differences already explained in the
control variables and in fi xed-term parameters.
The baseline model outlined in the equation
above has been augmented with weights – GDP
weights specifi cally. These weights should help
to capture and ameliorate a possible problem of
heteroskedasticity in the dataset.
Four models for electricity prices and fi ve
models for gas prices have been estimated
since the availability of different regulation and
competition indicators provided by the OECD,
namely: an aggregate indicator for competition
and regulation, an entry barrier indicator, a
vertical integration indicator, a public ownership
indicator and a concentration indicator – C1,
available for the gas market only. The indicators
have a “descending interpretation” – in other
words, the higher the level of the index, the
more the market is concentrated, entry is
diffi cult and/or, in general, competition is
lacking or regulation tight. Hence, an estimated
positive coeffi cient is expected for most of the
indicators, with the possible exception of the
vertical integration indicators, as discussed
further below. The indicators are regressed
separately for two reasons. First, most of them
follow a common trend over time. This may
give rise to a problem of collinearity, which
could result in wrongly estimated coeffi cients
if indicators are considered jointly. Second,
separate regressions can be considered as a
robustness check for variables other than the
A Levin, Lin and Chu’s (2002) panel unit root test has been 97
performed including individual fi xed effects and a common
trend. The null hypothesis of unit root is not accepted with
probability less or equal to fi ve per cent for both gas and
electricity prices. As counterfactual evidence, a common trend
has been estimated and subtracted from the price variables.
Hence, the same panel unit root test – excluding common trend
and constant – has been performed. The test does not accept the
null hypothesis of unit root.
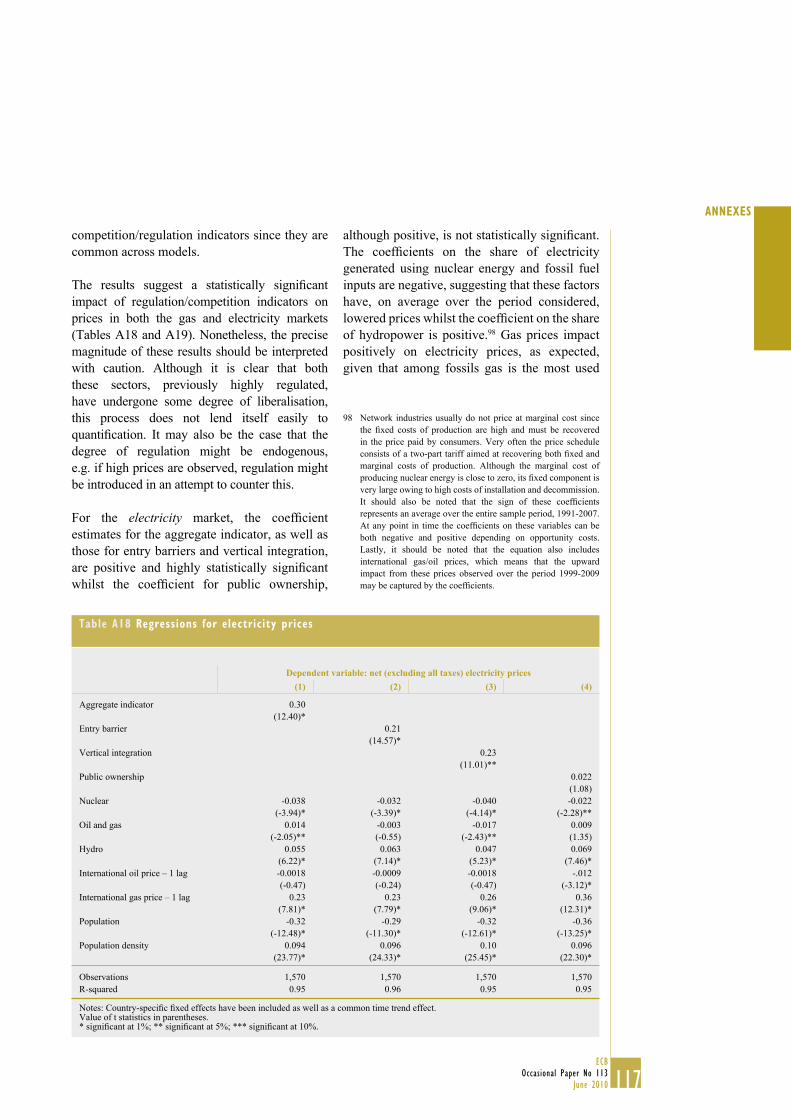
117ECB
Occasional Paper No 113
June 2010
ANNEXES
competition/regulation indicators since they are
common across models.
The results suggest a statistically signifi cant
impact of regulation/competition indicators on
prices in both the gas and electricity markets
(Tables A18 and A19). Nonetheless, the precise
magnitude of these results should be interpreted
with caution. Although it is clear that both
these sectors, previously highly regulated,
have undergone some degree of liberalisation,
this process does not lend itself easily to
quantifi cation. It may also be the case that the
degree of regulation might be endogenous,
e.g. if high prices are observed, regulation might
be introduced in an attempt to counter this.
For the electricity market, the coeffi cient
estimates for the aggregate indicator, as well as
those for entry barriers and vertical integration,
are positive and highly statistically signifi cant
whilst the coeffi cient for public ownership,
although positive, is not statistically signifi cant.
The coeffi cients on the share of electricity
generated using nuclear energy and fossil fuel
inputs are negative, suggesting that these factors
have, on average over the period considered,
lowered prices whilst the coeffi cient on the share
of hydropower is positive.98 Gas prices impact
positively on electricity prices, as expected,
given that among fossils gas is the most used
Network industries usually do not price at marginal cost since 98
the fi xed costs of production are high and must be recovered
in the price paid by consumers. Very often the price schedule
consists of a two-part tariff aimed at recovering both fi xed and
marginal costs of production. Although the marginal cost of
producing nuclear energy is close to zero, its fi xed component is
very large owing to high costs of installation and decommission.
It should also be noted that the sign of these coeffi cients
represents an average over the entire sample period, 1991-2007.
At any point in time the coeffi cients on these variables can be
both negative and positive depending on opportunity costs.
Lastly, it should be noted that the equation also includes
international gas/oil prices, which means that the upward
impact from these prices observed over the period 1999-2009
may be captured by the coeffi cients.
Table A18 Regressions for electricity prices
Dependent variable: net (excluding all taxes) electricity prices(1) (2) (3) (4)
Aggregate indicator 0.30
(12.40)*
Entry barrier 0.21
(14.57)*
Vertical integration 0.23
(11.01)**
Public ownership 0.022
(1.08)
Nuclear -0.038
(-3.94)*
-0.032
(-3.39)*
-0.040
(-4.14)*
-0.022
(-2.28)**
Oil and gas 0.014
(-2.05)**
-0.003
(-0.55)
-0.017
(-2.43)**
0.009
(1.35)
Hydro 0.055
(6.22)*
0.063
(7.14)*
0.047
(5.23)*
0.069
(7.46)*
International oil price – 1 lag -0.0018
(-0.47)
-0.0009
(-0.24)
-0.0018
(-0.47)
-.012
(-3.12)*
International gas price – 1 lag 0.23
(7.81)*
0.23
(7.79)*
0.26
(9.06)*
0.36
(12.31)*
Population -0.32
(-12.48)*
-0.29
(-11.30)*
-0.32
(-12.61)*
-0.36
(-13.25)*
Population density 0.094
(23.77)*
0.096
(24.33)*
0.10
(25.45)*
0.096
(22.30)*
Observations 1,570 1,570 1,570 1,570
R-squared 0.95 0.96 0.95 0.95
Notes: Country-specifi c fi xed effects have been included as well as a common time trend effect.Value of t statistics in parentheses.* signifi cant at 1%; ** signifi cant at 5%; *** signifi cant at 10%.

118ECB
Occasional Paper No 113
June 2010
input. When included alongside gas, the oil
coeffi cient is not signifi cant.
In the gas market all indicators are signifi cant
with the expected positive sign, except for the
vertical integration indicator which has a negative
sign. However, as indicated above, a priori,
the sign on the vertical integration variable is not
clear. It should carry a positive sign if a reduced
competition effect prevails, or a negative sign if
an effi ciency effect dominates. The results suggest
that the second interpretation is correct. By
contrast, the fi rst interpretation seems to be more
relevant for the electricity market. An alternative
interpretation could be that since upstream gas
supplies are quite integrated (coming mainly from
Russia and Norway), downstream integration is
required to offset the upstream negotiation
position. It should also be noted that, based on the
analysis contained in the main part of the text, the
coeffi cient on international gas prices was
expected to be close to one on average for the euro
area. In Table A19, the estimated coeffi cient is
generally around 0.4. Together with the coeffi cient
on the lagged dependent variable 99 of roughly 0.5,
this suggests an estimated long-run coeffi cient on
lagged international gas prices of around 0.8. The
coeffi cient may be biased downward owing to
effects already attributed to the country-specifi c
fi xed effects.
2.7 INPUT-OUTPUT TABLES
Input-output tables provide a refi ned
decomposition of the production process, based
upon the interrelationships between different
branches of activity in the economy via the
cross consumption of intermediate inputs.
Applying the cumulative approach, i.e. by
going back up the production chain of a branch
in order to take into account all the direct and
A lagged dependent variable has been included in the gas market 99
models because autocorrelation of fi rst order has been detected
(i.e. LM test) for some single country regressions.
Table A19 Regressions for gas prices
Dependent variable: net (excluding all taxes) gas prices(1) (2) (3) (4) (5)
Aggregate indicator 0.11
(3.75)*
Entry barrier 0.074
(5.29)*
Public ownership 0.082
(3.23)*
C1 0.09
(2.65)*
Vertical integration
-0.057
(-2.15)**
Gas dependency -0.020
(-7.78)*
-0.019
(-7.17)*
-0.02
(-7.65)*
-0.022
(-8.11)*
-0.027
(-7.55)*
Gas consumption intensity -0.001
(-3.84)*
-0.001
(-4.41)*
-0.0007
(-2.71)*
-0.001
(-3.78)*
-0.0007
(-2.85)*
International gas price – 1 lag 0.37
(21.45)*
0.35
(14.95)*
0.49
(16.59)*
0.40
(16.56)*
0.40
(16.42)*
Population -0.192
(-5.87)*
-0.18
(-5.83)*
-0.24
(-8.43)*
-0.20
(-5.99)*
-0.28
(-8.92)*
Population density 0.017
(10.53)*
0.017
(11.18)*
0.018
(12.55)*
0.018
(11.63)*
0.021
(13.17)*
Dep. lagged (-1) 0.51
(20.41)*
0.53
(21.93)*
0.49
(20.45)*
0.50
(20.71)*
0.49
(20.24)*
Observations 1,542 1,542 1,542 1,542 1,542
R-squared 0.95 0.94 0.93 0.95 0.96
Notes: Country-specifi c fi xed effects have been included as well as a common time trend effect. Value of t statistics in parentheses.* signifi cant at 5%; ** signifi cant at 1%.

119ECB
Occasional Paper No 113
June 2010
ANNEXES
indirect inputs necessary for that production, it
is possible to derive not only the direct use of
energy inputs but also the indirect use, through
consumption of other products which use energy
as an intermediate input. Then, by introducing
a change in the price of energy inputs, we can
calculate the overall effect it has on the cost
structure (producer prices), and on consumer
prices. The overall impact can be decomposed
into a direct impact (through direct energy
use) and an indirect one (through consumption
of other products which use energy as an
intermediate input).
A cross-country comparison is possible using
the IOT standardised across EU countries,
collected by Eurostat. These tables are available
with details of 59 branches, following the NACE
classifi cation. We dispose of IOT for 12 euro area
countries in 2005, namely Germany, Ireland,
Greece, Spain, France, Italy, the Netherlands,
Austria, Portugal, Slovenia, Slovakia and
Finland. The euro area results are obtained by
a weighted average of available country results
(the weights correspond to the country shares in
the producer/consumer expenditures, as derived
from IOT).
The main drawback of using IOT is their static
character. The production and fi nal demand
structure and the corresponding technical
coeffi cients are fi xed: as prices rise, users
of energy do not substitute away from more
expensive products. Similarly, there are no
second-round effects – the value of wages
and profi t margins remain constant – and no
monetary policy response to the rise in consumer
prices. These underlying assumptions suggest
that the results will tend to overestimate the
effects of an energy price increase.
A second limitation of this approach is that it is
not possible to take into account the fact that the
initial price level is not the same across countries
(and across branches). A related important
caveat is that IOT provide only fairly broad
energy categories. Categories of energy inputs
available in IOT and to which a direct impulse
is given according to the energy shock are the
following 100:
– Coal and lignite; peat (NACE 10).
– Crude petroleum and natural gas; services
incidental to oil and gas extraction
(NACE 11).
– Coke, refi ned petroleum products and
nuclear fuels (NACE 23).
– Electrical energy, gas, steam and hot water
(NACE 40).
As we can see, electricity and gas belong to the
same category. Even though gas and electricity
prices may not move simultaneously, they
must be modelled together when using the
IOT to understand the impact of an energy
price shock. Even if some co-movements are
generally observed in the prices of energy
inputs, especially internationally traded raw
energy products, assuming perfect simultaneity
constitutes a simplifi cation.
Third, without information on the production
structure for imported products, we are not able
to model the indirect effects of energy price
increases on import prices. We can account for
the price effects of imported raw energy products
or production inputs but not for the effect
energy price rises might have on other imported
products. Not taking into consideration increases
in non-energy imported products suggests that
our calculations of the impact of energy price
increases could be on the down side.
To sum up, the 10% energy price increase we
model is made up of three “components”:
– a 10% increase in the price of imports of raw
energy inputs;
Uranium and thorium ores (NACE 12) are not included in our 100
defi nition of energy inputs, although they are included in the
category “energy producing materials” according to the NACE
classifi cation.

120ECB
Occasional Paper No 113
June 2010
– a 10% increase in the price of domestically
produced raw energy inputs;
– a 10% increase in the price of imports of
refi ned energy products.
Raw energy inputs refer to “Coal and lignite;
peat” (NACE 10) and “Crude petroleum and
natural gas” (NACE 11); refi ned energy inputs
refer to “Coke, refi ned petroleum products
and nuclear fuels” (NACE 23) and “Electrical
energy, gas, steam and hot water” (NACE 40).
Finally, the choice of the reference year could
clearly affect the results. If energy prices are
particularly high in the reference year, then the
share of energy costs in the overall cost structure
will be high. The effect of the energy price
increase on the overall costs will also be high,
compared with a similar exercise conducted in a
year with lower energy prices. The calculations
presented in Section 3.3.1 mostly refer to 2005,
which corresponds to the year of the last
available dataset for a majority of euro area
countries.

121ECB
Occasional Paper No 113
June 2010
REFERENCES
REFERENCES
Al - Gudhea, S., Kenc, T., Dibooglu, S., 2007. “Do retail gasoline prices rise more readily than they
fall? A threshold cointegration approach”, Journal of Economics and Business 59, pp. 560–574.
Altissimo F., M. Ehrmann and F. Smets (2006), “Infl ation persistence and price-setting
behaviour in the euro area – a summary of the IPN evidence”, Occasional Paper Series 46,
European Central Bank.
Álvarez, L. J., S. Hurtado, I. Sánchez and C.Thomas (2009), “The impact of oil price changes on
Spanish and euro area consumer price infl ation”, Occasional Paper 0904, Banco de España.
Arpa M., Cuaresma J. C., Gnan E and Silgoner M. A, “Oil price shock, energy prices and infl ation –
a comparison of Austria and the EU”. Oesterreichische Nationalbank (ONB) Monetary Policy
and the Economy 2006; Q1/06; 53-77.
Asplund, M., Eriksson, R., Friberg, R., 2000. “Price adjustments by a gasoline retail chain”,
Scandinavian Journal of Economics 102(1), pp. 101–121.
Australian Competition and Consumer Commission – ACCC (2007), “Petrol prices and Australian
consumers: Report of the ACCC inquiry into the price of unleaded petrol”, December.
Avedillo, M. and M. A. Muñoz (2007), “Seguridad energética en Europa”, Boletín Económico de
ICE, No 2928, 16-31 December 2007, pp. 43-47.
Bachmeier, L. and J. Griffi n (2006). “Testing for Market Integration: Crude oil, coal and natural
gas”, The Energy Journal, 27:2, pp 55-72.
Bachmeier, L. and Griffi n, J. (2003) “New Evidence on Asymmetric Gasoline Price Responses”,
Review of Economics and Statistics, 85, pp. 772-776.
Balke, N. S., S. P. A. Brown and M. K. Yücel (2002), “Oil Price Shocks and the U.S. Economy:
Where Does the Asymmetry Originate?”, The Energy Journal, 23(3):27-52.
Balke, N., S. Brown, and M. Yücel, (1998), “Crude oil and gasoline prices: An asymmetric
relationship?”, Federal Reserve Bank of Dallas Economic Review, First Quarter, pp. 2-11.
Bartholomae F. and K. Morasch (2007). “Oil price indexing of natural gas prices: An economic
analysis”, Review of Economics, 58 Vol. 3, pp. 250-264.
Beck, R. and A. Kamps (2009), “Petrodollars and imports of oil exporting countries”, ECB Working
Paper, No 1012, February.
Bello, A., and S. Cavero (2008), “The Spanish Retail Petroleum Market: New Patterns of Competition
Since the Liberalization of the Industry”, Energy Policy Vol. 36, Issue 2, pp. 612-626.
Benati, L. and Surico, P., (2009), “VAR Analysis and the Great Moderation”, American Economic
Review, 99, pp. 1636-52, September.

122ECB
Occasional Paper No 113
June 2010
Berben, R.-P., A. Locarno, J. Morgan and J. Vallés (2004), “Cross-country differences in monetary
policy transmission”, ECB Working Paper Series No 400, October.
Bernanke, B., (2006) “Energy and the economy”, Speech made before the Economic Club of
Chicago, Chicago, Illinois, June 15, 2006.
Bernanke B., (1983), “Irreversibility, Uncertainty and Cyclical Investment”, Quarterly Journal of
Economics, 98(1), pp. 86-106.
Blanchard, O. J. and M. Riggi (2009), “Why are the 2000s so Different from the 1970s? A Structural
Interpretation of Changes in the Macroeconomic Effects of Oil Prices”, NBER Working Paper
No 15467.
Blanchard, O. J. and J. Gali (2007), “The Macroeconomic Effects of Oil Price Shocks: Why are the
2000s so different from the 1970s?”, NBER Working Paper 13368.
Bohi D. R., M. A. Toman (1996), “The Economics of Energy Security”, Kluwer Academic
Publishers, Norwell, Massachusetts, USA.
Borenstein, S. and Shepard, A. (2002) “Sticky Prices, Inventories, and Market Power in Wholesale
Gasoline Markets”, RAND Journal of Economics, Vol. 33 ,pp. 116-139.
Borenstein, S., Cameron, A. C., Gilbert, R., 1997. “Do gasoline prices respond symmetrically to
crude oil price changes?”, Quarterly Journal of Economics 112, pp. 305-339.
Bosco, B., L. Parisio, M. Pelagatti and F. Baldi (2007), “A robust multivariate long run analysis of
European electricity prices”, Fondazione Eni Enrico Mattei Working Papers, No 162.
Breitenfellner, A., J. Crespo Cuaresma (2008), “Crude oil prices and the USD/EUR exchange rate”,
Monetary Policy & the Economy Q4/08.
Brown, S. and M. Yücel (2009), “Market arbitrage: European and North American natural gas
prices”, The Energy Journal, Vol. 30, Special Issue, May, pp. 167-168.
Brown, S. and M. Yücel (2007), “What drives natural gas prices?”, Working Paper 0703, Federal
Reserve Bank of Dallas.
Brunekreeft, G. and K. Keller (2000), “The electricity supply industry in Germany: market power
or power of the market”, Utilities Policy, Vol. 9, No. 1, March, pp. 15-29.
Buchan, D. (2009), “Energy and Climate Change: Europe at the Crossroads”, Oxford University Press.
Burdette M. and Zyren J., “Gasoline price pass through”. US Energy Information Administration, mimeo
2003; January.
Burdette M. and Zyren J., “Diesel fuel price pass through”. US Energy Information Administration,
mimeo 2002; July.
Commodity Futures Trading Commission, (2008), “Interim Report on Crude Oil”.

123ECB
Occasional Paper No 113
June 2010
REFERENCES
Contín-Pilart, I., Correljé, A., and Palacios, M.B., 2006, “Competition, Regulation, and Pricing
Behavior in the Spanish Retail Gasoline Market”, Working Paper BILTOKI DT2006.02,
University of the Basque Country.
Conway P. and G. Nicoletti, 2006, “Product market regulation in the non-manufacturing sectors of
OECD countries: measurement and highlights”, OECD Economics Department Working Papers
No 530, December.
Council of European Energy Regulators (CEER) (2007), Fact Sheet on Unbundling, May.
Criqui, P. and S. Mima (2009) “Exploring the Energy Security – Climate Policy Nexus with
the POLES Model”, LEPII, CNRS-Université de Grenoble, France, paper presented at 2009
International Energy Workshop, Venice, Italy, June 17-19, 2009.
Darracq-Pariès, M. and S. Moyen (2009), “Monetary policy and infl ationary shocks under imperfect
credibility”, ECB Working Paper Series No 1065.
Dhyne E., L. J. Alvarez, H. Le Bihan, G. Veronese, D. Dias, J. Hoffmann, N. Jonker, P. Lunnemann,
F. Rumler and J. Vilmunen, 2006. “Price Changes in the Euro Area and the United States: Some
Facts from Individual Consumer Price Data,” Journal of Economic Perspectives, American
Economic Association, vol. 20(2), pp. 171-192, Spring.
Edelstein, P. and L. Kilian (2008), “How Sensitive are Consumer Expenditures to Retail Energy
Prices?”, mimeo, University of Michigan.
Energy Information Administration, EIA (2003). The Global Liquefi ed Natural Gas Market: Status
and Outlook, December.
ERGEG (2009), “Status Review of End-User Price Regulation as of 1 July 2008”, Brussels:
ERGEG.
ERGEG (2008) “ERGEG 2008 Status Review of the Liberalisation and Implementation of the
Energy Regulatory Framework”, Brussels.
Esteves, P. Soares, and P. Duarte Neves, (2004) “Oil prices and the economy”, Banco de Portugal
Economic Bulletin, December 2004, pp. 51-62.
Estrada, A. and P. Hernandez de Cos (2009), “Oil prices and their effect on potential output”, Banco
de España Occasional Paper Series, No 0902.
European Central Bank – ECB (2004), “Oil prices and the euro area economy”, ECB Monthly
Bulletin article, November 2004, pp. 51-63.
European Commission, 2009b. “Survey on the petroleum products’ price data collection published
in the weekly Oil Bulletin”, mimeo Market Observatory for Energy, DG-TREN, February.
European Commission, 2009a. “Progress in creating the internal gas and electricity market” 2008
Benchmarking Report and Technical Annex (COM/2009/0115). Brussels.

124ECB
Occasional Paper No 113
June 2010
European Commission (2009). “Report on progress in creating the internal gas and electricity
market”, Communication from the Commission to the Council and the European Parliament,
Brussels, 11.3.2010, COM(2009) 0115 fi nal.
European Commission (2008-2009), “Quarterly Report on European Electricity Markets”,
Volumes 1 and 2, Brussels.
European Commission (2008a). “An EU Energy Security and Solidarity Action Plan”, COM(2008)
781 fi nal, mimeo.
European Commission (2008). Impact assessment, SEC (2008)85, mimeo.
European Commission (2007a). “European Technology Platform SmartGrids: Strategic research
agenda for Europe’s electricity networks of the future”, document prepared on behalf of the
Advisory Council of the European Technology SmartGrids.
European Commission (2007). “Inquiry pursuant to Article 17 of Regulation (EC) No 1/2003 into
the European gas and electricity sectors (Final Report)”, Communication from the Commission,
Brussels, 10.1.2007, COM(2006) 851 fi nal.
European Sea Ports Organisation – ESPO (2008). “Annual Report 2007-2008”.
Fagan, G. and Morgan (2005), “Econometric models of the Euro-Area Central Banks”, Edward
Elgar, Cheltenham.
Finon D. and Glachant J. M. (2004), “Competition and Market Integration in Europe: Towards
a multi-energy and multidomestic oligopoly”, in “Reshaping of European Electricity and
Gas Industry: Regulation, Markets and Business Strategies”, Finon D. and Midttun A. (eds.),
Elsevier, 2004, chapter 8, pp. 237-255.
Frankel, J. A. (2006), “The effect of monetary policy on real commodity prices”, in “Asset prices
and monetary policy”, edited by J. Campbell, University of Chicago Press.
Frey G. and M. Manera, 2007. “Econometric Models Of Asymmetric Price Transmission,” Journal
of Economic Surveys, Blackwell Publishing, vol. 21(2), pp. 349-415, 04.
GAO (General Accounting Offi ce), 1993, “Energy security and policy: Analysis of the pricing of
crude oil and petroleum products”, GAO/RCED-93-17, March.
Gautier, E., and R. Le Saout (2009), “Price Rigidity: Evidence from French Gasoline Daily Price
Quotes”, mimeo Banque de France.
Geweke, J., 2004. “Issues in the ‘Rockets and Feathers’ gasoline price literature”. Report to the
Federal Trade Commission. March.
Hahn, E. (2003), “Pass-Through of External Shocks to Euro Area Infl ation”, ECB Working Paper
Series, 243, July.

125ECB
Occasional Paper No 113
June 2010
REFERENCES
Haigh, M. S., J. Hranaiova and J. A. Overdahl (2005), “Price Dynamics, Price Discovery and Large
Futures Trader Interactions in the Energy Complex”, CFTC Working paper, April.
Hamilton, J. (2009), “Causes and Consequences of the Oil Shock of 2007-08”. Brooking Papers on
Economic Activity, Spring 2009.
Hamilton, J. D. (2008), “Understanding Crude Oil Prices”, NBER Working Paper 14492.
Hartley, P., K. B. Medlock III, and J. Rosthal (2007), “The relationship between crude oil and
natural gas prices”, mimeo, The James A. Baker III Institute for Public Policy, November.
Hastings, J., 2004, “Vertical Relationships and Competition in Retail Gasoline Markets: Empirical
Evidence from Contract Changes in Southern California,” American Economic Review 94:1,
pp. 317-328.
Hicks, B. and Kilian, L. (2009), “Did Unexpectedly Strong Economic Growth Cause the Oil Price
Shock of 2003-2008?”, CEPR Discussion Paper, No 7265.
Higgins, M., T. Klitgaard and R Lerman (2006), “Recycling Petrodollars”, Current Issues Federal
Reserve Bank of New York, Vol. 12, No 9, December 2006.
Hooker, M. A. (2002), “Are Oil Shocks Infl ationary? Asymmetric and Nonlinear Specifi cations
versus Changes in Regime”, Journal of Money, Credit and Banking, Vol. 34:2, pp. 540-561.
Hotelling, H. (1931), “The economics of exhaustible resources”, Journal of Political Economy
39(2): 137-175.
ICF International (2007), “Analysis of the economic impact of energy product prices on
competitiveness of the energy and manufacturing sectors in the EU: comparison between EU
and US”, Report submitted to the European Commission, DG Transport and Energy, July.
International Energy Agency, OECD/IEA (2009b). World Energy Outlook 2009, Paris.
International Energy Agency (2009a), Medium-Term Oil Market Report, June 2009.
International Energy Agency, IEA/OECD (2009), World Energy Outlook, Paris.
International Energy Agency, OECD/IEA (2008c). World Energy Outlook 2008, Paris.
International Energy Agency, OECD/IEA (2008b). Electricity Information 2008, Paris.
International Energy Agency, OECD/IEA (2008a). IEA Energy Policy Reviews: The European
Union 2008, Paris.
International Energy Agency (2007). Energy Security and Climate Policy, OECD/IEA, Paris.
International Energy Agency, OECD/IEA (2003). World Energy Investment Outlook 2003, Paris.

126ECB
Occasional Paper No 113
June 2010
International Monetary Fund (2006), “World Economic Outlook, Chapter 5: The Boom in Nonfuel
Commodity Prices – Can It Last?”, September 2006.
IPCC – Intergovernmental Panel on Climate Change (2007). Fourth Assessment Report: Climate
Change (AR4).
Jacquinot, P., M. Kuismanen, R. Mestre and M. Spitzer (2009), “An Assessment of the Infl ationary
Impact of Oil Shocks in the Euro Area”, The Energy Journal, 30(1), pp. 45-83.
Jiménez-Rodríguez, R. and M. Sánchez (2005), “Oil price shocks and real GDP growth: empirical
evidence from some OECD countries”, Applied Economics, 37 (2), pp. 201-208.
Karrenbrock, J. “The behavior of retail gasoline prices: symmetric or not?” Federal Reserve Bank
of St. Louis, July/August 1991, pp.19-29.
Kaufmann, R. K. and B. Ullman (2009), “Oil Prices, Speculation and Fundamentals: Interpreting
Causal Relations among Spot and Futures Prices”. Energy Economics, 31, Issue 4, pp. 550-558.
Kaufmann, R. K. and L.D. Shiers (2008), “The effect of resource uncertainty on the peak in global
oil production and the production of alternatives”, Ecological Economics, 67: pp. 405-411.
Kaufmann, R. K., Karadeloglou, P. and F. di Mauro (2008), “Will oil prices decline over the long
run?”, ECB Occasional Paper, No 98.
KEMA Consulting (2005), “Review of European Electricity Prices”, A report carried out on behalf
of EURELECTRIC (Union of the Electricity Industry), November.
Kemfert, C. (1998), “Estimated substitution elasticities of a nested CES production function
approach for Germany”, Energy Economics,Vol 20, pp. 249-264.
Khan, M. S. (2009), “The 2008 oil price bubble”, Policy Brief No 09-19, Peterson Institute for
International Economics.
Kilian, L. (2009), “Not all price shocks are alike: disentangling demand and supply shocks in the
crude oil market”, American Economic Review, 99:3, pp. 1053-1069.
Kilian, L. (2008b), “The economic effects of energy price shocks”, Journal of Economic Literature,
46(4): 871-909.
Kilian, L., 2008a. “Exogenous Oil Supply Shocks: How Big Are They and How Much Do They
Matter for the U.S. Economy?”, The Review of Economics and Statistics, MIT Press, vol. 90(2),
pp. 216-240, 03.
Kilian, L. and R. J. Vigfusson (2009), “Pitfalls in Estimating Asymmetric Effects of Energy Price
Shocks”, Board of Governors of the Federal Reserve System, International Finance Discussion
Papers, No 970.
Knetsch, T. A. and A. Molzahn (2009), “Supply-side effects of strong energy price hikes in German
industry and transportation”, Deutsche Bundesbank, Discussion Paper 26/2009.

127ECB
Occasional Paper No 113
June 2010
REFERENCES
Krautkraemer, J. A. (1998), “Nonrenewable resource scarcity”, Journal of Economic Literature
36(4): 2065-2107.
Kroes N, European Commissioner for Competition Policy (2007), “A new European Energy Policy;
reaping the benefi ts of open and competitive markets”, Energy conference: E-world energy &
water, Essen, 5 February.
Kruyt, B., D. P. van Vuuren, H.J.M. de Vries and H. Groenenberg (2009), Indicators for energy
security, Energy Policy, Volume 37, Issue 6, June 2009, pp. 2166-2181.
Landau, B. and F. Skudelny (2009), “Pass-Through of external shocks along the pricing chain –
a panel estimation approach for the euro area”, ECB Working Paper Series, 1104.
Lewis, M., 2003, “Asymmetric price adjustment and consumer search: An examination of the retail
gasoline market”, University of California-Berkeley Working Paper, Nov. 2003.
Market Observatory for Energy (2008). “Europe’s energy position: present and future”,
Luxembourg: Offi ce for Offi cial Publications of the European Union.
Martin, R., M. Roma and I. Vansteenkiste, (2005). “Regulatory reforms in selected EU network
industries”, European Central Bank Occasional Paper Series 28.
McCarthy, J. (2000), “Pass-Through of Exchange Rates and Import Prices to Domestic Infl ation in
Some Industrialized Economies”, Federal Reserve Bank of New York, Staff Report, No 3.
Meyler A. 2009. “The pass through of oil prices into euro area consumer liquid fuel prices in an
environment of high and volatile oil prices”. Energy Economics, Issue 6, Energy Sector Pricing
and Macroeconomic Dynamics, November, pp. 867-881.
Miller, J. I. and R. A. Ratti (2009), “Crude Oil and Stock Markets: Stability, Instability and
Bubbles”. Energy Economics, 31, Issue 4, pp. 559-568.
Mork, K. A. (1989), “Oil and the Macroeconomy When Prices Go Up and Down: An Extension of
Hamilton’s Results”, The Journal of Political Economy, 97(3): 740-744.
Nakov, A. and G. Nuño (2009), “A general equilibrium model of oilgopoly”, Banco de España
Working Paper, forthcoming.
Nakov, A. and A. Pescatori (2009), “Monetary Policy Tradeoffs with a Dominant Oil Producer”,
Journal of Monetary Credit and Banking, 42(1), pp. 1-32. Banco de España Working Paper, 0723.
National Bank van Belgiё/Banque Nationale de Belgique (2008), “Annex C: Consumer prices of
electricity and gas for households”, in “The trend in infl ation in Belgium: an analysis by the
NBB at the request of the federal government”, Economic Review April 2008, special edition.
National Consumer Agency (2008) “Investigation into Petrol and Diesel Price Movements”,
December.

128ECB
Occasional Paper No 113
June 2010
Neumann, A. (2009) “Linking Natural Gas Markets: Is LNG doing its job?” The Energy Journal,
Special Issue of the International Association for Energy Economics, pp. 187-200.
Nomisma Energy (2007) “La rete carburanti: Il confronto con l’Europa”, July. Study conducted by
Nomisma Energia on behalf of Unione Petrolifera.
Nordhaus, W. (2009), “The Economics of an Integrated World Oil Market”, Keynote Address,
International Energia Workshop, Venice, Italy, June 17-19, 2009.
OECD (2009). “Competition Policy for Vertical Relations in Gasoline Retailing 2008” OECD
Policy Roundtables.
OECD (2006). “Product market regulation in the non-manufacturing sectors of OECD countries:
measurement and highlights”, Economics Department Working Paper, No 530.
OECD (2005), “Handbook on constructing composite indicators: methodology and user guide”,
Statistics Working Paper No 13, STD/DOC (2005)3.
Onour, I. (2009), “Natural gas markets: How sensitive to crude oil price changes?”, mimeo, Arab
Planning Institute, April.
Peersman, G. and I. Van Robays (2009), “Oil and the Euro Area Economy”, Economic Policy,
Volume 24, Issue 60, pp. 603-651.
Polo M. and C. Scarpa (2007), “Take or Pay Contracts and Market Segmentation”, Working Papers
5, IEFE, Bocconi University.
Polo M. and C. Scarpa, (2003). “The liberalization of energy markets in Europe and Italy”,
Working Papers 230, IGIER (Innocenzo Gasparini Institute for Economic Research), Bocconi
University.
Radchenko, S. “Oil price volatility and the asymmetric response of gasoline prices to oil price
increases and decreases”, Energy Economics, Vol. 27(2005), pp. 708-730.
Reserve Bank of New Zealand (2005), “Oil prices and the New Zealand economy”, Bulletin, Vol.
68, No. 4, December, pp. 5-15.
Rietveld P and van Woudenberg S. “Why fuel prices differ”. Energy Economics 2005; Vol. 27,
Issue 79-92.
Robinson, T. (2007b), “The convergence of electricity prices in Europe”, Applied Economics
Letters, Vol. 14, No. 7, pp. 473-476.
Robinson, T. (2007a), “Have European gas prices converged?”, Energy Policy, Vol. 35, Issue 4,
April, pp. 2347-2351.
Rodrigues, J. (2009), “Asymmetries in the adjustment of motor diesel and gasoline pump prices in
Europe”, Portuguese Competition Authority (AdC), Working Paper Series No 37, July.
129ECB
Occasional Paper No 113
June 2010
REFERENCES
Stern N. (2007), “The Economics of Climate Change: The Stern Review”, Cambridge University Press.
Taylor, J. B. (2000), “Low Infl ation, Pass-Through, and the Pricing Power of Firms”, European
Economic Review, Vol. 44/7, pp. 1389-1408.
Thompson, P. and T. G. Taylor (1995), “The Capital-Energy Substitutability Debate: A New Look”,
The Review of Economics and Statistics 77(3): 565-569.
Tol R. S. J. (2008), “The Economic Effects of Climate Change”, Journal of Economic Perspectives,
23, pp. 29-51.
United Nations Framework Convention on Climate Change, UNFCC (2008), Investment and
fi nancial fl ows to address climate change. Technical paper.
Van der Werf, E. (2008), “Production functions for climate policy modelling: An empirical
analysis”, Energy Economics,Vol. 30, No 6, pp. 2964-2979.
Van Meerbeeck, W. 2003. “Competition and local market conditions on the Belgian retail gasoline
market”, De Economist, Vol. 151, No. 4.
Venditti, F., 2010. “Down the non-linear road from oil to consumer energy prices: no much
asymmetry along the way”, Banca d’Italia Temi di Discussione No 751, March.
Villar, J. and F. Joutz (2006) “The relationship between crude oil and natural gas prices” mimeo.
Walsh, P. P. and C. Whelan, 1999. “Loss leading and price intervention in multiproduct retailing:
welfare outcomes in a second-best world1”, International Review of Law and Economics,
Elsevier, vol. 19(3), pp. 333-347, September.
World Bank (2009), State and Trends of the Carbon Market, May.
Ye, M., Zyren, J., Shore, J., Burdette, M., 2005. “Regional comparisons, spatial aggregation,
and asymmetry of price pass through in U.S. gasoline markets”. Atlantic Economic Journal 33,
pp. 179–192.
Zachmann G. and C. von Hirschhausen, (2008) “First evidence of asymmetric cost pass-through
of EU emissions allowances: Examining wholesale electricity prices in Germany”, Economic
Letters 99(3), pp. 465-469.

130ECB
Occasional Paper No 113
June 2010
EUROPEAN CENTRAL BANK
OCCASIONAL PAPER SERIES SINCE 2009
100 “Survey data on household fi nance and consumption: research summary and policy use” by the
Eurosystem Household Finance and Consumption Network, January 2009.
101 “Housing fi nance in the euro area” by a Task Force of the Monetary Policy Committee of the
European System of Central Banks, March 2009.
102 “Domestic fi nancial development in emerging economies: evidence and implications”
by E. Dorrucci, A. Meyer-Cirkel and D. Santabárbara, April 2009.
103 “Transnational governance in global fi nance: the principles for stable capital fl ows and fair debt
restructuring in emerging markets” by R. Ritter, April 2009.
104 “Fiscal policy challenges in oil-exporting countries – a review of key issues” by M. Sturm,
F. Gurtner and J. Gonzalez Alegre, June 2009.
105 “Flow-of-funds analysis at the ECB – framework and applications” by L. Bê Duc and
G. Le Breton, August 2009.
106 “Monetary policy strategy in a global environment” by P. Moutot and G. Vitale, August 2009.
107 “The collateral frameworks of the Eurosystem, the Federal Reserve System and the Bank of
England and the fi nancial market turmoil” by S. Cheun, I. von Köppen-Mertes and B.Weller,
December 2009.
108 “Trade consistency in the context of the Eurosystem projection exercises – an overview”
by K. Hubrich and T. Karlsson, March 2010.
109 “Euro area fi scal policies and the crisis” by editor Ad van Riet, April 2010.
110 “Protectionist responses to the crisis: global trends and implications” by M. Bussière,
E. Pérez-Barreiro, R. Straub and D. Taglioni, April 2010.
111 “Main drivers of the ECB fi nancial accounts and ECB fi nancial strength over the fi rst 11 years”
by O. Vergote, W. Studener, I. Efthymiadis and N. Merriman, May 2010.
112 “Public wages in the euro area towards securing stability and competitiveness” by F. Holm-Hadulla,
K. Kamath, A. Lamo, J. J. Pérez and L. Schuknecht, June 2010.
113 “Energy markets and the euro area macroeconomy” by a Task Force of the Monetary Policy
Committee of the European System of Central Banks, June 2010.

Occas iOnal PaPer ser i e snO 111 / May 2010
Main DriVers OF
THe ecB Financial
accOUnTs anD
ecB Financial
sTrenGTH OVer
THe FirsT 11 years
by Olivier Vergote,Werner Studener,Ioannis Efthymiadisand Niall Merrimani