observe your system - linuxdays.cz
TRANSCRIPT


3
Agenda
● Motivations● Tracepoints● Perf● ftrace● eBPF● SystemTap

4
Motivations
● system administrators vs application developers

5
Motivations
● These tools requires root (often)● Allows injection of code directly in kernel space● Debugging the kernel● Troubleshooting systems in production● Performance analysis
6
Tracepoints
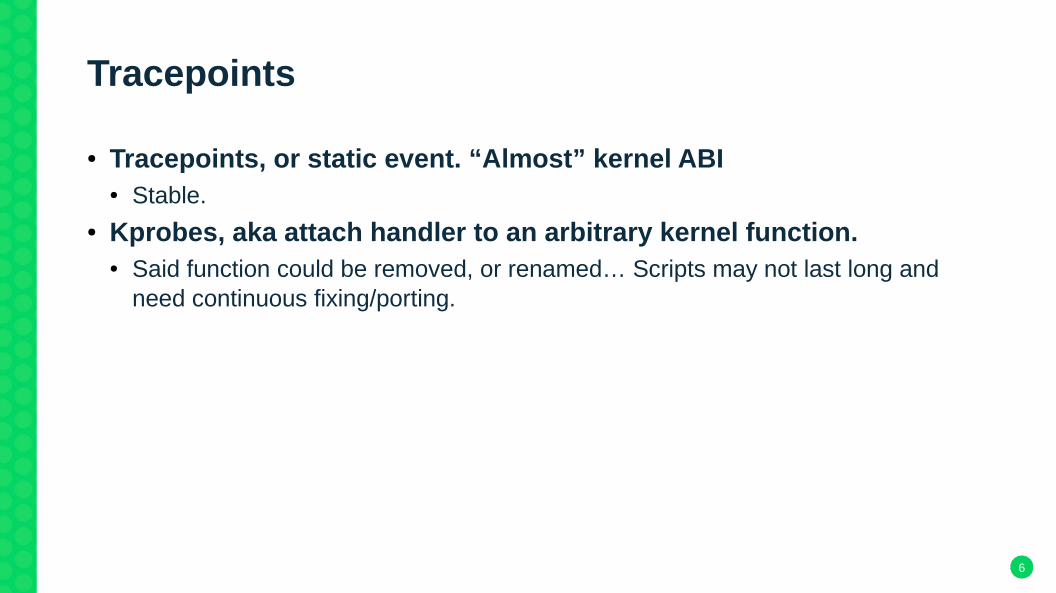
● Tracepoints, or static event. “Almost” kernel ABI● Stable.
● Kprobes, aka attach handler to an arbitrary kernel function.● Said function could be removed, or renamed… Scripts may not last long and
need continuous fixing/porting.

7
Tracepoints
● block:block_rq_insert: who is creating I/O, what type, how much● block:block_rq_complete: to correlate insert w/ completions● block:block_dirty_buffer: in case of excessive amount of writeback● block:block_plug/block:block_unplug: why requests merge or not● compaction:mm_compaction_try_to_compact_pages: trying to allocate
continuous ranges● compaction:mm_compaction_begin/compaction:mm_compaction_end: for
how long compaction lasted● filemap:mm_filemap_add_to_page_cache/filemap:mm_filemap_delete_fro
m_page_cache: track what pages are resident in memory and for how long ● kmem:*alloc*/kmem:*free*: slab allocations and frees

8
Tracepoints
● migrate:mm_migrate_pages: numa balancing● net:* network latencies● sched:sched_process_exec: a process starts execution● sched:sched_stat*: a process stalled● sched:sched_migrate_task/sched:sched_move_numa: process migration● syscalls:*● vmscan:mm_vmscan_kswapd_wake: model page behaviour● vmscan:mm_vmscan_direct_reclaim_begin/vmscan:mm_vmscan_direct_re
claim_end: heavy memory pressure

9
Tracepoints
● writeback:balance_dirty_pages: generate stalls● writeback:writeback_congestion_wait/writeback:writeback_wait_iff_conges
ted: excessive amount of writeback

10http://www.brendangregg.com/linuxperf.html

11
perf & perf_events
● perf_events is the kernel infrastructure, perf is the userspace tool● Lives in tree at tools/perf● The primary developers are Ingo Molnar and Peter Zijlstra● Supports CPU performance counters, software events, tracepoints,
kprobes and uprobes● Manpages are provided, see man -k perf● Require kernel built with appropriate configuration options for
some functionalities

12
perf & perf_events
bench General framework for benchmark suites
evlist List the event names in a perf.data file
inject Filter to augment the events stream with additional information
kmem Tool to trace/measure kernel memory properties
kvm Tool to trace/measure kvm guest os
list List all symbolic event types
lock Analyze lock events
mem Profile memory accesses
record Run a command and record its profile into perf.data
report Read perf.data (created by perf record) and display the profile
sched Tool to trace/measure scheduler properties (latencies)
script Read perf.data (created by perf record) and display trace output
stat Run a command and gather performance counter statistics
top System profiling tool.
trace strace inspired tool
probe Define new dynamic tracepoints

13
perf & perf_events
$ perf record -a sleep 5
$ perf report
# Samples: 2K of event 'cycles:ppp'
# Event count (approx.): 1043962924
# Overhead Command Shared Object Symbol
24.05% swapper [kernel.kallsyms] [k] 0xffffffff813da762
1.16% mplayer mplayer [.] 0x0000000000260028
1.03% soffice.bin libc-2.22.so [.] __memmove_avx_unaligned
0.55% emacs-gtk emacs-gtk [.] 0x000000000015c976
0.55% mplayer mplayer [.] 0x0000000000260015
0.55% gnome-terminal- libc-2.22.so [.] __memset_sse2
0.50% mplayer libavcodec.so.57.48.101 [.] 0x00000000006a48d0
0.46% soffice.bin libpixman-1.so.0.34.0 [.] 0x000000000008dc3a
0.40% mplayer mplayer [.] 0x0000000000260012
14
perf & perf_events
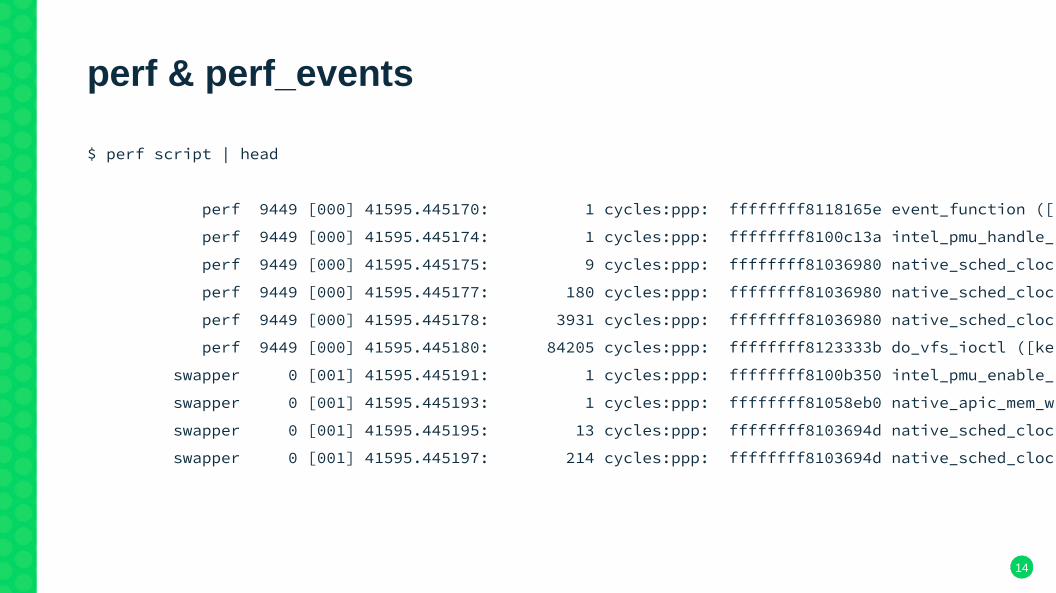
$ perf script | head
perf 9449 [000] 41595.445170: 1 cycles:ppp: ffffffff8118165e event_function ([kernel.kallsyms])
perf 9449 [000] 41595.445174: 1 cycles:ppp: ffffffff8100c13a intel_pmu_handle_irq ([kernel.kallsyms])
perf 9449 [000] 41595.445175: 9 cycles:ppp: ffffffff81036980 native_sched_clock ([kernel.kallsyms])
perf 9449 [000] 41595.445177: 180 cycles:ppp: ffffffff81036980 native_sched_clock ([kernel.kallsyms])
perf 9449 [000] 41595.445178: 3931 cycles:ppp: ffffffff81036980 native_sched_clock ([kernel.kallsyms])
perf 9449 [000] 41595.445180: 84205 cycles:ppp: ffffffff8123333b do_vfs_ioctl ([kernel.kallsyms])
swapper 0 [001] 41595.445191: 1 cycles:ppp: ffffffff8100b350 intel_pmu_enable_all ([kernel.kallsyms])
swapper 0 [001] 41595.445193: 1 cycles:ppp: ffffffff81058eb0 native_apic_mem_write ([kernel.kallsyms])
swapper 0 [001] 41595.445195: 13 cycles:ppp: ffffffff8103694d native_sched_clock ([kernel.kallsyms])
swapper 0 [001] 41595.445197: 214 cycles:ppp: ffffffff8103694d native_sched_clock ([kernel.kallsyms])
15
perf & perf_events
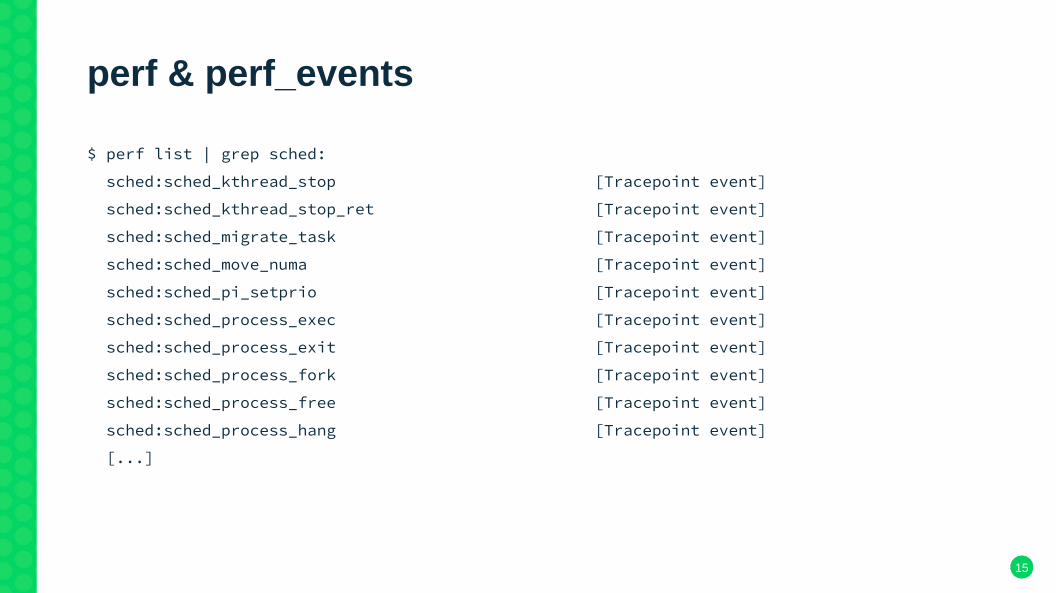
$ perf list | grep sched:
sched:sched_kthread_stop [Tracepoint event]
sched:sched_kthread_stop_ret [Tracepoint event]
sched:sched_migrate_task [Tracepoint event]
sched:sched_move_numa [Tracepoint event]
sched:sched_pi_setprio [Tracepoint event]
sched:sched_process_exec [Tracepoint event]
sched:sched_process_exit [Tracepoint event]
sched:sched_process_fork [Tracepoint event]
sched:sched_process_free [Tracepoint event]
sched:sched_process_hang [Tracepoint event]
[...]

16
perf & perf_events
$ perf record -e sched:sched_stat_sleep -e sched:sched_switch -g
$ perf report
# Samples: 2M of event 'sched:sched_switch'
# Event count (approx.): 4246430127764
#
# Children Self Samples Command Shared Object Symbol 70.67% 0.00% 0 httpd [kernel.kallsyms] [k] schedule
|
---schedule
__schedule
70.67% 70.67% 1629298 httpd [kernel.kallsyms] [k] __schedule
|
|--67.92%-- pthread_cond_wait@@GLIBC_2.3.2
| entry_SYSCALL_64_fastpath
| sys_futex
| do_futex
| futex_wait

17
perf & perf_events
$ perf top
PerfTop: 644 irqs/sec kernel:45.2% exact: 100.0% [4000Hz cycles:ppp], (all, 4 CPUs)
-------------------------------------------------------------------------------
4.74% libz.so.1.2.8 [.] 0x0000000000002f36
3.88% [kernel] [k] module_get_kallsym
2.43% [kernel] [k] format_decode
2.17% perf [.] symbols__insert
1.73% perf [.] rb_next
1.65% [kernel] [k] number
1.43% [kernel] [k] kallsyms_expand_symbol.constprop.1
1.27% perf [.] hex2u64
1.12% [kernel] [k] string
1.10% perf [.] rb_insert_color

18
perf & perf_events
$ perf stat -a
^C
Performance counter stats for 'system wide':
7786.772339 task-clock (msec) # 4.001 CPUs utilized
742 context-switches # 0.095 K/sec
18 cpu-migrations # 0.002 K/sec
7 page-faults # 0.001 K/sec
81,834,321 cycles # 0.011 GHz
<not supported> stalled-cycles-frontend
<not supported> stalled-cycles-backend
31,909,569 instructions # 0.39 insns per cycle
6,976,025 branches # 0.896 M/sec
326,023 branch-misses # 4.67% of all branches
1.946330553 seconds time elapsed

19
perf & perf_events
$ perf sched record -a
$ perf sched map
*. 41428.284823 secs . => swapper:0
*A0 . 41428.287425 secs A0 => rcu_sched:7
*. . 41428.287429 secs
. . *B0 41428.289945 secs B0 => gnome-terminal-:2127
. . *. 41428.289983 secs
*A0 . . 41428.291418 secs
*. . . 41428.291420 secs
*A0 . . 41428.295423 secs
*. . . 41428.295426 secs
. *C0 . . 41428.296136 secs C0 => Timer:8743
. *. . . 41428.296149 secs
. *C0 . . 41428.297198 secs

20
perf & perf_events
Flame Graph Search
os..
internal_getent
n..
h..
apr_m..
tl..
ap_core_output_f..ap..
_IO_default_uflowa..
smp_cal..
__GI___munmap
_IO_file_doallocate
__GI_..
do_munmap
rwse..
en..
rwsem_down_write_failed
st..cpuidle_enter_state
send_brigade_no..write..
osq_lock
__..
rwse..
_IO_getline_info
cr.._nss_files_gethostbyname3_r
start_secondary
tl..tlb_fini..
cp..
vm..
entry_SY..
__..
httpd
li..
x8..start_thread
__GI___fgets_unlocked
sys_munmap
unmap_re..
file_..
__G..
flush_tl..
_IO_setb
_IO_doallocbufqueu..
st..new_socket
mma..
swapper
cp..
__GI___mmap64do..
ap..
fl..
call_rwsem_down_write_failedun..
tlb_flus..
fclose@@GLIBC_2.2.5
_IO_file_underflow@@GLIBC_2.2.5
__clone
in.._IO_file_close_it@@G..
call_rws..
st..
vm_munmapnati..
r..
worker_threadgethostbyname_r@@GLIBC_2.2.5
h..
native_f..
intel_idle
sy..rwsem_do..
_nss_files_gethostbyname_r
call..
a..mma..
cpu_startup_entry
siege
http://www.brendangregg.com/FlameGraphs/cpuflamegraphs.html#perf
21
perf & perf_events
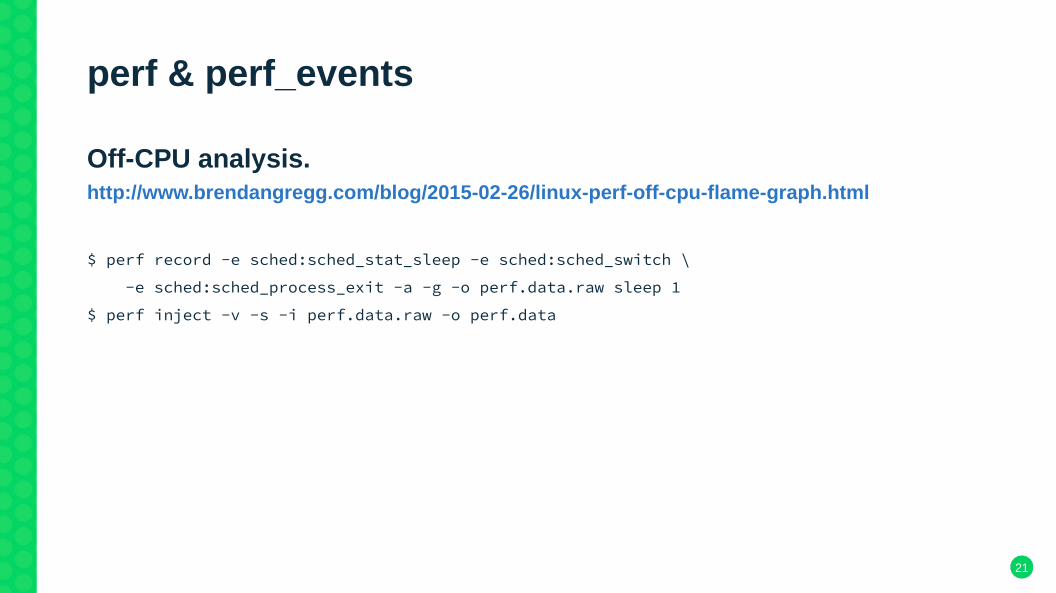
Off-CPU analysis.http://www.brendangregg.com/blog/2015-02-26/linux-perf-off-cpu-flame-graph.html
$ perf record -e sched:sched_stat_sleep -e sched:sched_switch \
-e sched:sched_process_exit -a -g -o perf.data.raw sleep 1
$ perf inject -v -s -i perf.data.raw -o perf.data

22
perf & perf_events
Examples of analysis carried out with perf (by Ingo Molnar):
● “The problem with prefetch” https://lwn.net/Articles/444336/● “Software prefetches considered harmful”
https://lwn.net/Articles/444346/

23
ftrace
● Kernel tracer, available since ~2008● Originated from the -rt kernel● Maintained by Steven Rostedt● Exposes tracepoints as files under /sys/kernel/debug/tracing● Programmable via shell and unix tools● Kernel needs to be compiled with specific options● Documentation in tree at Documentation/trace/ftrace.txt● Requires knowledge of kernel tracepoints● Allows tracing of arbitrary kernel functions with kprobes● Has CLI (trace-cmd) and GUI (kernelshark)

24
ftrace: kernel config
$ make allyesconfig
$ grep FTRACE .config
CONFIG_KPROBES_ON_FTRACE=y
CONFIG_HAVE_KPROBES_ON_FTRACE=y
CONFIG_PSTORE_FTRACE=y
CONFIG_HAVE_DYNAMIC_FTRACE=y
CONFIG_HAVE_DYNAMIC_FTRACE_WITH_REGS=y
CONFIG_HAVE_FTRACE_MCOUNT_RECORD=y
CONFIG_FTRACE=y
CONFIG_FTRACE_SYSCALLS=y
CONFIG_DYNAMIC_FTRACE=y
[...]

25
ftrace: tracepoints
$ mount -t debugfs nodev /sys/kernel/debug
/sys/kernel/debug/tracing # head available_events
kvmmmu:kvm_mmu_pagetable_walk
kvmmmu:kvm_mmu_paging_element
kvmmmu:kvm_mmu_set_accessed_bit
[...]
/sys/kernel/debug/tracing$ cat available_events | wc -l
1832
26
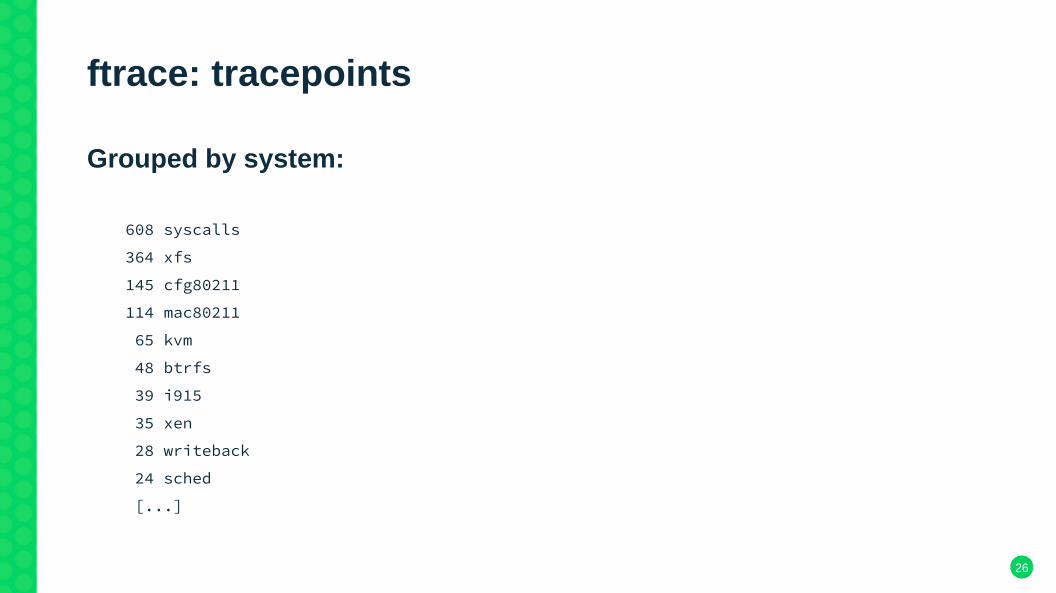
ftrace: tracepoints
Grouped by system:
608 syscalls
364 xfs
145 cfg80211
114 mac80211
65 kvm
48 btrfs
39 i915
35 xen
28 writeback
24 sched
[...]

27
ftrace example: I/O
$ echo nop > current_tracer
$ echo 1 > events/block/block_rq_issue/enable
$ echo 1 > events/block/block_rq_complete/enable
$ cat trace_pipe
dd-6195 [000] d..2 24591.455048: block_rq_issue: 8,0 W 0 () 414091752 + 1344 [dd]
dd-6195 [000] d..2 24591.455078: block_rq_issue: 8,0 W 0 () 414093096 + 704 [dd]
dd-6195 [000] d..2 24591.455211: block_rq_issue: 8,0 W 0 () 414093800 + 1344 [dd]
dd-6195 [000] d..2 24591.455219: block_rq_issue: 8,0 W 0 () 414095144 + 704 [dd]
dd-6195 [000] d..2 24591.455345: block_rq_issue: 8,0 W 0 () 414095848 + 1368 [dd]
dd-6195 [000] d..2 24591.455353: block_rq_issue: 8,0 W 0 () 414097216 + 680 [dd]
dd-6195 [000] d..2 24591.455476: block_rq_issue: 8,0 W 0 () 414097896 + 1344 [dd]
dd-6195 [000] d..2 24591.455488: block_rq_issue: 8,0 W 0 () 414099240 + 704 [dd]
dd-6195 [000] d..2 24591.455594: block_rq_issue: 8,0 W 0 () 414099944 + 1352 [dd]
dd-6195 [000] d..2 24591.455601: block_rq_issue: 8,0 W 0 () 414101296 + 456 [dd]

28
ftrace canned scripts: perf-tool
https://github.com/brendangregg/perf-tools
bitesize - show disk I/O size as a histogram.cachestat - Measure page cache hits/misses.execsnoop - trace process exec() with arguments.funccount - count kernel function calls matching specified wildcards.iolatency - summarize block device I/O latency as a histogram.iosnoop - trace block I/O events as they occur.killsnoop - trace kill() syscalls with process and signal details.kprobe - trace a given kprobe definition. Kernel dynamic tracing.opensnoop - trace open() syscalls with file details.tcpretrans - show TCP retransmits, with address and other details.

29
ftrace CLI: trace-cmd$ man -k trace-cmdtrace-cmd (1) - interacts with Ftrace Linux kernel internal tracertrace-cmd-check-events (1) - parse the event formats on local systemtrace-cmd-extract (1) - extract out the data from the Ftrace Linux tracer.trace-cmd-hist (1) - show histogram of events in trace.dat filetrace-cmd-list (1) - list available plugins, events or options for Ftrace.trace-cmd-listen (1) - listen for incoming connection to record tracing.trace-cmd-mem (1) - show memory usage of certain kmem eventstrace-cmd-options (1) - list available options from trace-cmd pluginstrace-cmd-profile (1) - profile tasks running livetrace-cmd-record (1) - record a trace from the Ftrace Linux internal tracertrace-cmd-report (1) - show in ASCII a trace created by trace-cmd recordtrace-cmd-reset (1) - turn off all Ftrace tracing to bring back full performancetrace-cmd-restore (1) - restore a failed trace recordtrace-cmd-show (1) - show the contents of the Ftrace Linux kernel tracing buffer.trace-cmd-snapshot (1) - take, reset, free, or show a Ftrace kernel snapshottrace-cmd-split (1) - split a trace.dat file into smaller filestrace-cmd-stack (1) - read, enable or disable Ftrace Linux kernel stack tracing.trace-cmd-start (1) - start the Ftrace Linux kernel tracer without recordingtrace-cmd-stat (1) - show the status of the tracing (ftrace) systemtrace-cmd-stop (1) - stop the Ftrace Linux kernel tracer from writing to the ring buffer.trace-cmd-stream (1) - stream a trace to stdout as it is happeningtrace-cmd.dat (5) - trace-cmd file format

30
ftrace GUI: kernelshark
http://people.redhat.com/srostedt/kernelshark/HTML/

31
ftrace: resources
● Documentation/trace/ftrace.txt● http://lwn.net/Kernel/Index/ (search for “ftrace”, “tracing”)● https://github.com/brendangregg/perf-tools● [email protected] mailing list

32
eBPF
● extended Berkeley Packet Filter● BPF is kernel since a long time. Foundation for tcpdump● eBPF merged in 4.1, ~2015● Primary developer is Alexei Starovoitov● In-kernel data aggregation● Programs are statically verified, “safe” and low overhead● Programs can be interpreted or Just-In-Time compiled (as opposed
to a separate kernel module)● C syntax, but reduced functionality (no loops, etc)● Supported as backend by perf and soon SystemTap
33
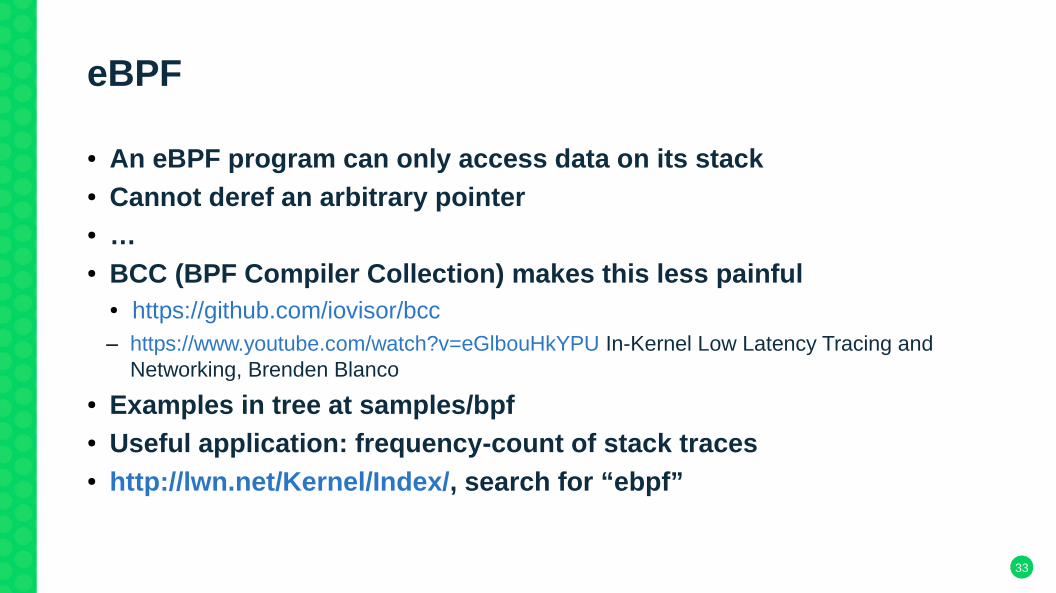
eBPF
● An eBPF program can only access data on its stack● Cannot deref an arbitrary pointer● …● BCC (BPF Compiler Collection) makes this less painful
● https://github.com/iovisor/bcc– https://www.youtube.com/watch?v=eGlbouHkYPU In-Kernel Low Latency Tracing and
Networking, Brenden Blanco
● Examples in tree at samples/bpf● Useful application: frequency-count of stack traces● http://lwn.net/Kernel/Index/, search for “ebpf”

34
SystemTap
● Available since 2005● The most powerful in terms of expressivity● Out of tree● Requires kernels debug symbols● Maintained by Frank Ch. Eigler et al.● Great care is needed● Supports tracepoints, kprobes, uprobes● Can even do live patching!
● See “Applying band-aids over security wounds with systemtap” https://archive.fosdem.org/2016/schedule/event/systemtap/
35
SystemTap
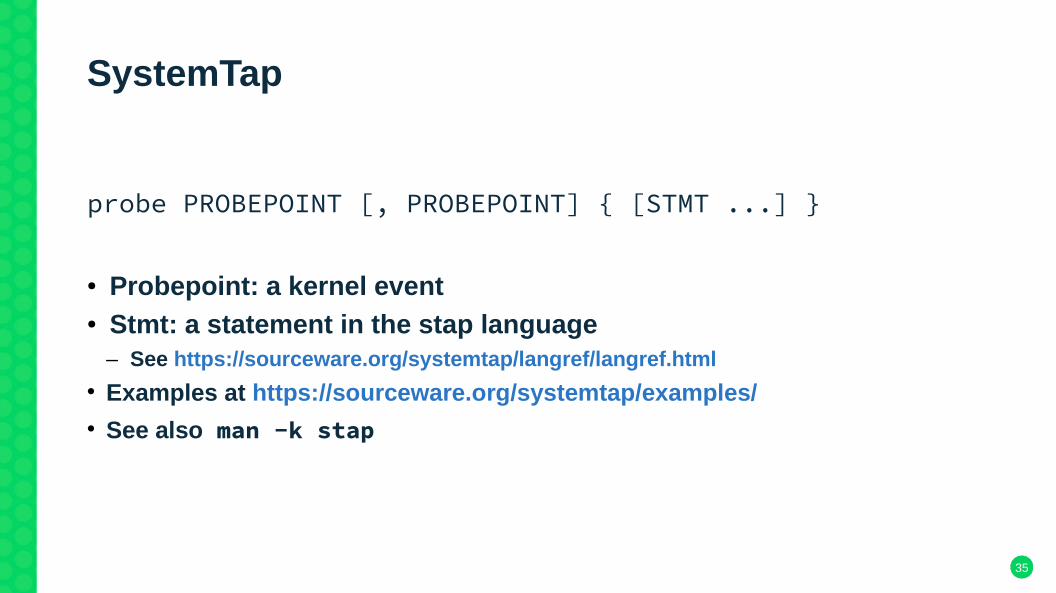
probe PROBEPOINT [, PROBEPOINT] { [STMT ...] }
● Probepoint: a kernel event● Stmt: a statement in the stap language
– See https://sourceware.org/systemtap/langref/langref.html
• Examples at https://sourceware.org/systemtap/examples/
• See also man -k stap

36
● perf: robust and reliable. Limited flexibility.● ftrace: available on all kernels, highly programmable. Requires
knowledge of tracepoints.● eBPF: safe, low overhead. Not easy to program. Needs recent
kernel.● SystemTap: best programmability. Overhead can be hard to predict.
Questions!
http://www.suse.com/jobs