observations on the flow characteristics of blood flow in arteriovenous fistulae (experimental)
TRANSCRIPT
ORIGINAL PAPER
Observations on the Flow Characteristics of Blood Flowin Arteriovenous Fistulae (Experimental)
Vidyasagar Casikar • G. S. Ramaswamy •
Vyshnavi Vidyasagar
Published online: 5 March 2010
� Springer Science+Business Media, LLC 2010
Abstract Hemodynamic play a very significant role in
the pathophysiology of intracranial arteriovenous malfor-
mation. The surgical decisions are based on the under-
standing of the complexities of the flow. Quantification of
the abnormal flow is difficult. The mathematical models
provide limited information due to the simplicity of the
design of these models. Flow of fluid in a tube is very
sensitive to small changes in the diameter. We studied the
flow characteristics of a fistula by introducing accurately
machined acrylic fistulae between the femoral arteries and
veins of dogs. The influences of systemic arterial pressure,
diameter of the arterial feeders, volume of blood flow,
velocity of flow and the diameter of the shunt on the flow
of blood across the shunt were studied. Our experiments
suggest that the flow characteristics of an arteriovenous
fistulae are complex and are influenced by small changes in
the diameters of the fistula and the feeding artery. Our
model demonstrates the occurrence of the anomalous flow
reduction in the fistula and steal phenomenon and is
therefore a more realistic representation of the clinical
situation. The design of a mathematical model should
include the diameter of the fistula if it is intended to
replicate the hemodynamic characteristics of an arteriove-
nous malformation more faithfully.
Keywords Arteriovenous malformation �Diameter of fistula � Experimental findings �Hemodynamic � Steal
Introduction
Despite extensive clinical and experimental investigations
in the management of Cerebral Arteriovenous malforma-
tion (AVM) the fundamental question, when does a clini-
cally silent lesion declares its presence either by
haemorrhage (perhaps due to a sudden increase in the flow)
or by neurological manifestation suggestive of deprivation
of blood to normal areas of brain (Steal phenomenon),
(Buis et al. 2004; Constantiono and Vintners 1986; Homan
et al. 1986) remain unanswered.
Traditionally AVMs and Arteriovenous fistulae are seen
as two distinct types of malformations. Streeter (1918)
speculated that AVF occur normally in the developing
brain and that persistence of these lead to AVMs. Refuting
this claim Padget (1948) demonstrated that AVF occur
between segmental pial arteries and veins as accidental
communications. Vidyasagar (1978, 1979a, b, c, d) and
Deshpande and Vidyasagar (1980) who demonstrated
specific segmental embryonic veins in these vascular
malformations further elaborated this concept. The authors
believe notwithstanding the controversy that both AVMs
and AVFs have a common factor and that is communica-
tion between two vascular systems conducting fluid under
different pressures. Plexiform vascular structures are fre-
quently seen in both vitro and experimental conditions but
are not mandatory to define the vascular malformation. The
V. Casikar (&)
Nepean Hospital, P. O. Box. 63, Kingswood, NSW 2751,
Australia
e-mail: [email protected]
G. S. Ramaswamy
University of Agricultural Sciences, 196/1 7th cross I N Block
Rajajinagar, Bangalore 560010, India
e-mail: [email protected]
V. Vidyasagar
Qantas Airways Ltd, 203, Coloard St, Mascot, NSW 2020,
Australia
e-mail: [email protected]
123
Cardiovasc Eng (2010) 10:66–77
DOI 10.1007/s10558-010-9095-y
venous pattern in AVF or AVM is determined by the
period in the development when the fistula occurs. In the
present paper we wish to use the terminology AVF to
indicate a fistulous communication between an artery and a
vein namely both AVF and AVM.
It is well known that the hemodynamics of fistula are the
primary cause for the erratic behaviour of this lesion; the
role of the physiological factors, which influence the blood
flow, is unclear. Systemic blood pressures, regional blood
flow, velocity of the flow (Duong et al. 1998), size of the
arterial channels and the size of the fistula (Lindegaard
et al. 1986) have been implied in various earlier studies.
Krumhar and Schulz (1970) reported that a 2 cm large
fistula in the iliac artery and vein of a dog caused retro-
grade flow. Louge et al. (1975) reported on the flow pattern
in fistulae of different sizes, which he described as small,
medium and large based on the length of the incision
between the arteries and veins. Shi and Chen (1986) graded
AVMs based on the location, arterial supply and venous
drainage. Pietila et al. (2000) described an animal model by
connecting a segment of temporal artery between the
branches of middle cerebral artery and dorsal sagittal sinus.
We feel that such models do not reflect the complex flow
pattern accurately.
We have attempted to create an animal model that
incorporates as many biological conditions as possible, to
assess the relative contribution of parameters such as size
of the arterial feeders, the size of the fistula, systemic blood
pressure, and volume and velocity of blood flow, to the
flow in the fistula. We believe that the fraction of the
arterial blood that is shunted is central to the pathology of
the lesion. Our experiment was designed to examine this
concept.
Materials and Methods
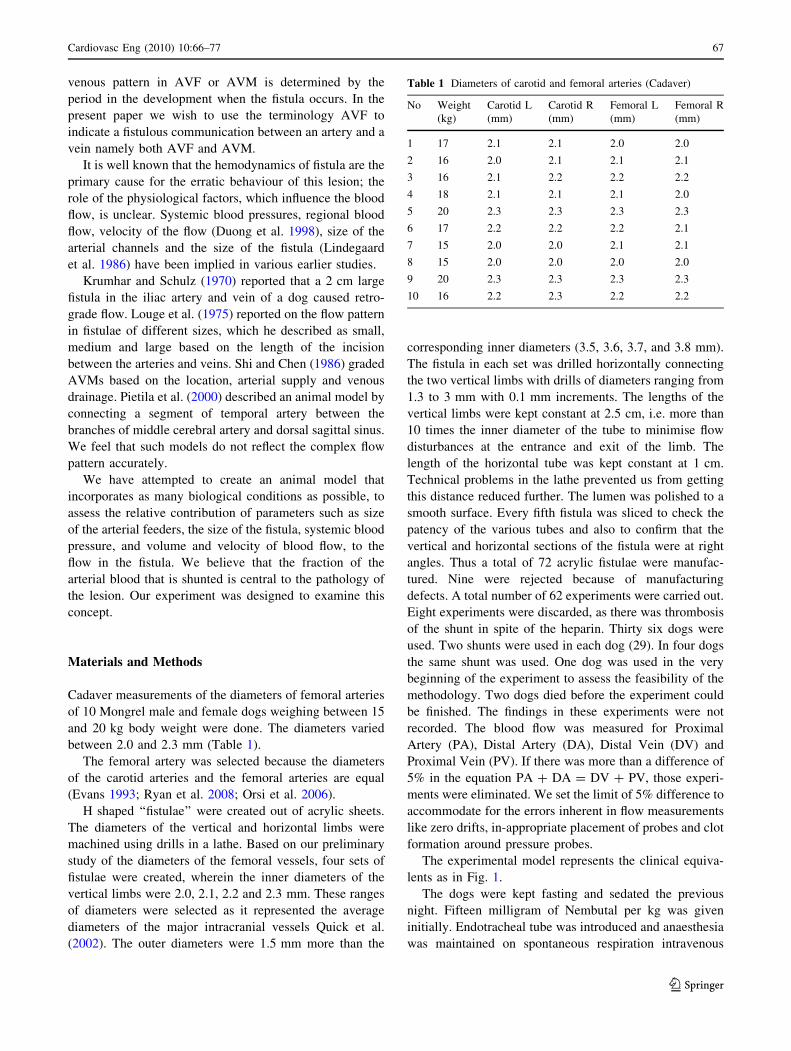
Cadaver measurements of the diameters of femoral arteries
of 10 Mongrel male and female dogs weighing between 15
and 20 kg body weight were done. The diameters varied
between 2.0 and 2.3 mm (Table 1).
The femoral artery was selected because the diameters
of the carotid arteries and the femoral arteries are equal
(Evans 1993; Ryan et al. 2008; Orsi et al. 2006).
H shaped ‘‘fistulae’’ were created out of acrylic sheets.
The diameters of the vertical and horizontal limbs were
machined using drills in a lathe. Based on our preliminary
study of the diameters of the femoral vessels, four sets of
fistulae were created, wherein the inner diameters of the
vertical limbs were 2.0, 2.1, 2.2 and 2.3 mm. These ranges
of diameters were selected as it represented the average
diameters of the major intracranial vessels Quick et al.
(2002). The outer diameters were 1.5 mm more than the
corresponding inner diameters (3.5, 3.6, 3.7, and 3.8 mm).
The fistula in each set was drilled horizontally connecting
the two vertical limbs with drills of diameters ranging from
1.3 to 3 mm with 0.1 mm increments. The lengths of the
vertical limbs were kept constant at 2.5 cm, i.e. more than
10 times the inner diameter of the tube to minimise flow
disturbances at the entrance and exit of the limb. The
length of the horizontal tube was kept constant at 1 cm.
Technical problems in the lathe prevented us from getting
this distance reduced further. The lumen was polished to a
smooth surface. Every fifth fistula was sliced to check the
patency of the various tubes and also to confirm that the
vertical and horizontal sections of the fistula were at right
angles. Thus a total of 72 acrylic fistulae were manufac-
tured. Nine were rejected because of manufacturing
defects. A total number of 62 experiments were carried out.
Eight experiments were discarded, as there was thrombosis
of the shunt in spite of the heparin. Thirty six dogs were
used. Two shunts were used in each dog (29). In four dogs
the same shunt was used. One dog was used in the very
beginning of the experiment to assess the feasibility of the
methodology. Two dogs died before the experiment could
be finished. The findings in these experiments were not
recorded. The blood flow was measured for Proximal
Artery (PA), Distal Artery (DA), Distal Vein (DV) and
Proximal Vein (PV). If there was more than a difference of
5% in the equation PA ? DA = DV ? PV, those experi-
ments were eliminated. We set the limit of 5% difference to
accommodate for the errors inherent in flow measurements
like zero drifts, in-appropriate placement of probes and clot
formation around pressure probes.
The experimental model represents the clinical equiva-
lents as in Fig. 1.
The dogs were kept fasting and sedated the previous
night. Fifteen milligram of Nembutal per kg was given
initially. Endotracheal tube was introduced and anaesthesia
was maintained on spontaneous respiration intravenous
Table 1 Diameters of carotid and femoral arteries (Cadaver)
No Weight
(kg)
Carotid L
(mm)
Carotid R
(mm)
Femoral L
(mm)
Femoral R
(mm)
1 17 2.1 2.1 2.0 2.0
2 16 2.0 2.1 2.1 2.1
3 16 2.1 2.2 2.2 2.2
4 18 2.1 2.1 2.1 2.0
5 20 2.3 2.3 2.3 2.3
6 17 2.2 2.2 2.2 2.1
7 15 2.0 2.0 2.1 2.1
8 15 2.0 2.0 2.0 2.0
9 20 2.3 2.3 2.3 2.3
10 16 2.2 2.3 2.2 2.2
Cardiovasc Eng (2010) 10:66–77 67
123

with Nembutal as and when required. A single dose of
50001 U of heparin was given at the beginning of the
experiment.
The animals were positioned in prone position. Femoral
artery and vein were exposed in the groin. The magnetic
flow meter was calibrated with an excised artery (preserved
from the animal sacrificed after the previous experiment)
for flow of saline as recommended by the manufacturer
(Micron instruments, USA). Calibration was also checked
for flow of blood after the experiment before sacrificing the
animal. If there was an error in excess of 10% between the
calibrations, the experiment was rejected.
The shunt was opened to the circulation by releasing the
vascular clamps. An approximate period of 15 min was
allowed to stabilise the circulation and parameters like PO2
and PCO2. Systemic arterial blood pressure (SAP) and heart
rate were not corrected to any specific level, except when
SAP and blood flow were manipulated as deliberate pro-
cedures. Drop in the blood pressure was achieved by
intravenous administration of Pentothal sodium in doses
sufficient to produce the desired drop in the pressure. PO2
and PCO2levels were adjusted when necessary to exclude
the effects of hypoxia and pH on SAP. Regional decrease
in blood flow was achieved by partially occluding the
femoral artery in the groin. Otherwise the circulatory dis-
turbances occurring when the AV fistula was opened were
allowed to stabilise on their own. This was intended to
simulate biological conditions.
In addition to the length and diameter of the limb of the
fistula the blood flow in the artery and in the vein at
proximal artery (PA), distal artery, (DA), proximal vein
(PV), distal vein (DV), intraluminal pressure at artery fis-
tula junction (AFJ) and vein fistula junction (VFJ), were
recorded. Each parameter was recorded 3 times at intervals
of 15 min and the average values were taken into consid-
eration. The flow values at the arterial and venous limbs
were calculated. Only those experiments where the dif-
ference in these values were less than ±5% were included.
Side branches and tributaries away from the site of the
shunt were used to introduce capillary tubes that were
connected to pressure transducers located at the level of the
heard (Gould Inc., USA). Arterial and venous lines in one
of the limbs were used to measure SAP, pH, PO2and PCO2
(Simousen and Weil, Sweden) and to administer fluids and
drugs respectively. After the experiment was over the shunt
was removed and examined for evidence of any clot
occlusion in the lumen. If this was present, the experiment
was rejected. The animals were sacrificed by a large dose
of Pentothal Sodium.
The following values were recorded after deliberate
manipulations of blood flow, diameter of feeding artery and
fistulae.
Diameter of feeding artery (DFA)
Diameter of the shunt (DFS)
Flow in shunt (FS)
Flow in PA before shunt is opened (FPAB)
Flow in PA after shunt is opened (FPA)
Flow in distal artery (FDA)
SAP after opening the shunt at artery fistula junction
(SAPA)
Systemic venous pressure at vein fistula junction
(SVPA)
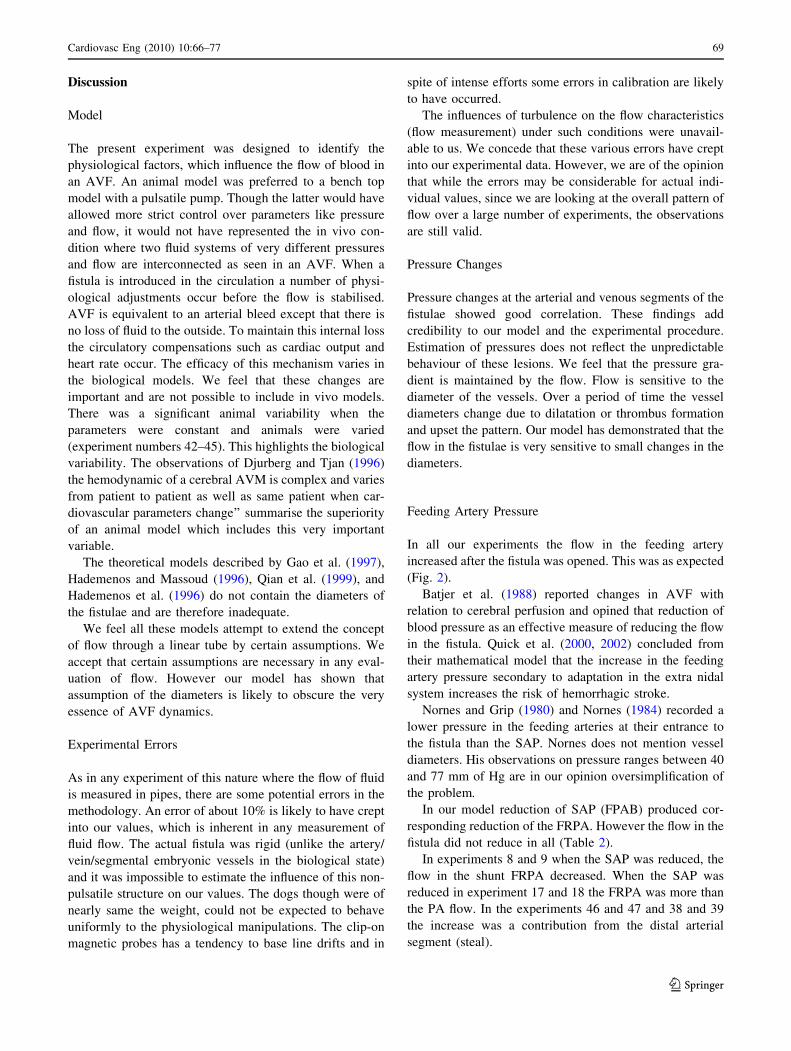
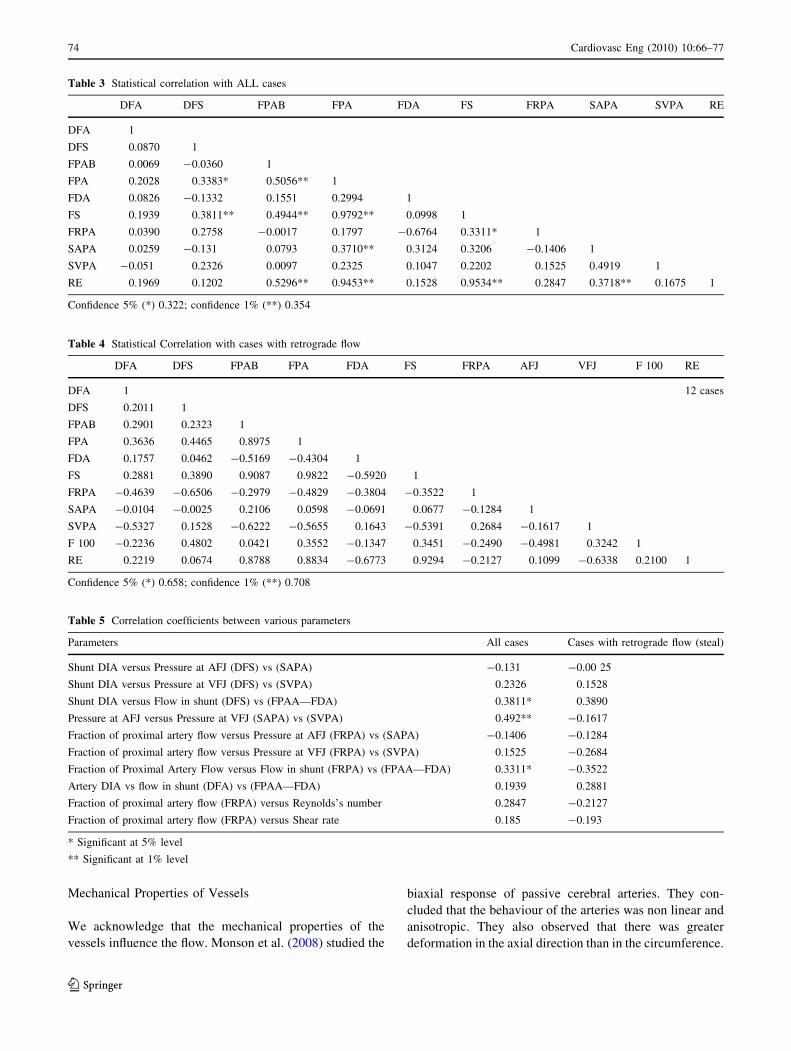
Results
Parameters such as arterial flow, systemic arterial pressure,
velocity and diameters of the feeding artery and the shunt,
did not show sufficient correlation to hypothesise gener-
alizations (Table 2). The flow in the fistula increased as its
diameter increased. However beyond a certain range the
flow actually reduced with incremental increases in the
diameter in those experiments where the fraction was more
than 100%, there was reverse flow from the distal arterial
segment.
Fig. 1 The experimental model
(Diagrammatic). PA—Proximal
Artery. DA—Distal Artery.
PV—Proximal Vein. DV—
Distal Vein. AFJ—Artery fistula
junction. VFJ—Vein fistula
Junction. FS—Flow through the
shunt. FPA—Flow through
proximal artery. FDA—Flow
through distal vein. FPV—Flow
through proximal vein. FDV—
Flow through distal vein
68 Cardiovasc Eng (2010) 10:66–77
123
Discussion
Model
The present experiment was designed to identify the
physiological factors, which influence the flow of blood in
an AVF. An animal model was preferred to a bench top
model with a pulsatile pump. Though the latter would have
allowed more strict control over parameters like pressure
and flow, it would not have represented the in vivo con-
dition where two fluid systems of very different pressures
and flow are interconnected as seen in an AVF. When a
fistula is introduced in the circulation a number of physi-
ological adjustments occur before the flow is stabilised.
AVF is equivalent to an arterial bleed except that there is
no loss of fluid to the outside. To maintain this internal loss
the circulatory compensations such as cardiac output and
heart rate occur. The efficacy of this mechanism varies in
the biological models. We feel that these changes are
important and are not possible to include in vivo models.
There was a significant animal variability when the
parameters were constant and animals were varied
(experiment numbers 42–45). This highlights the biological
variability. The observations of Djurberg and Tjan (1996)
the hemodynamic of a cerebral AVM is complex and varies
from patient to patient as well as same patient when car-
diovascular parameters change’’ summarise the superiority
of an animal model which includes this very important
variable.
The theoretical models described by Gao et al. (1997),
Hademenos and Massoud (1996), Qian et al. (1999), and
Hademenos et al. (1996) do not contain the diameters of
the fistulae and are therefore inadequate.
We feel all these models attempt to extend the concept
of flow through a linear tube by certain assumptions. We
accept that certain assumptions are necessary in any eval-
uation of flow. However our model has shown that
assumption of the diameters is likely to obscure the very
essence of AVF dynamics.
Experimental Errors
As in any experiment of this nature where the flow of fluid
is measured in pipes, there are some potential errors in the
methodology. An error of about 10% is likely to have crept
into our values, which is inherent in any measurement of
fluid flow. The actual fistula was rigid (unlike the artery/
vein/segmental embryonic vessels in the biological state)
and it was impossible to estimate the influence of this non-
pulsatile structure on our values. The dogs though were of
nearly same the weight, could not be expected to behave
uniformly to the physiological manipulations. The clip-on
magnetic probes has a tendency to base line drifts and in
spite of intense efforts some errors in calibration are likely
to have occurred.
The influences of turbulence on the flow characteristics
(flow measurement) under such conditions were unavail-
able to us. We concede that these various errors have crept
into our experimental data. However, we are of the opinion
that while the errors may be considerable for actual indi-
vidual values, since we are looking at the overall pattern of
flow over a large number of experiments, the observations
are still valid.
Pressure Changes
Pressure changes at the arterial and venous segments of the
fistulae showed good correlation. These findings add
credibility to our model and the experimental procedure.
Estimation of pressures does not reflect the unpredictable
behaviour of these lesions. We feel that the pressure gra-
dient is maintained by the flow. Flow is sensitive to the
diameter of the vessels. Over a period of time the vessel
diameters change due to dilatation or thrombus formation
and upset the pattern. Our model has demonstrated that the
flow in the fistulae is very sensitive to small changes in the
diameters.
Feeding Artery Pressure
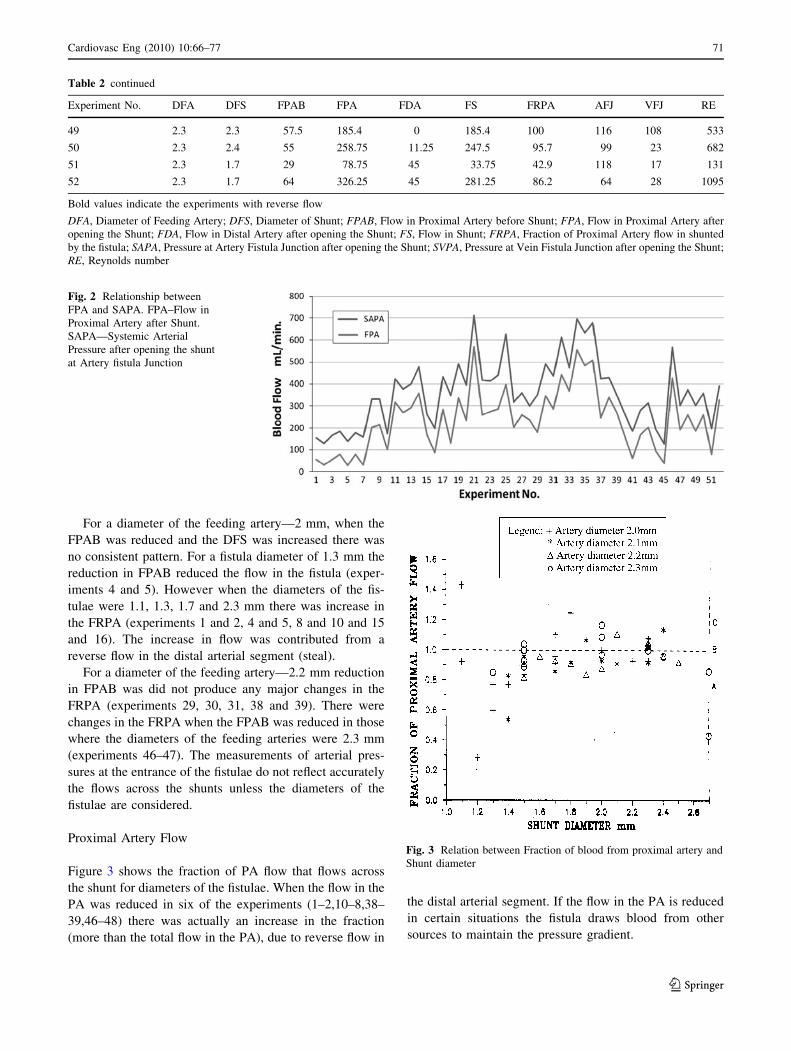
In all our experiments the flow in the feeding artery
increased after the fistula was opened. This was as expected
(Fig. 2).
Batjer et al. (1988) reported changes in AVF with
relation to cerebral perfusion and opined that reduction of
blood pressure as an effective measure of reducing the flow
in the fistula. Quick et al. (2000, 2002) concluded from
their mathematical model that the increase in the feeding
artery pressure secondary to adaptation in the extra nidal
system increases the risk of hemorrhagic stroke.
Nornes and Grip (1980) and Nornes (1984) recorded a
lower pressure in the feeding arteries at their entrance to
the fistula than the SAP. Nornes does not mention vessel
diameters. His observations on pressure ranges between 40
and 77 mm of Hg are in our opinion oversimplification of
the problem.
In our model reduction of SAP (FPAB) produced cor-
responding reduction of the FRPA. However the flow in the
fistula did not reduce in all (Table 2).
In experiments 8 and 9 when the SAP was reduced, the
flow in the shunt FRPA decreased. When the SAP was
reduced in experiment 17 and 18 the FRPA was more than
the PA flow. In the experiments 46 and 47 and 38 and 39
the increase was a contribution from the distal arterial
segment (steal).
Cardiovasc Eng (2010) 10:66–77 69
123
Table 2 Experimental data
Experiment No. DFA DFS FPAB FPA FDA FS FRPA AFJ VFJ RE
1 2 1.1 67.5 56.25 4.5 51.75 92 99 15 311
2 2 1.1 20 31.5 213.5 45 142.8 98 71 271
3 2 1.2 51 56.25 40.5 15.75 28 110 22 87
4 2 1.3 67.5 78.75 18 60.75 77.143 105 24 309
5 2 1.3 38 28.12 11.25 16.87 60 111 25 86
6 2 1.4 58.5 79.2 18.5 60.7 76.6 98 11 287
7 2 1.5 37.5 31.25 5 26.25 84 128 36 116
8 2 1.7 51.5 202.5 222.5 225 111.1 128 30 876
9 2 1.7 21 213.75 19 194.75 91.1 117 30 758
10 2 1.7 106.5 101.25 4.5 96.75 95.6 73 36 377
11 2 1.8 63 317.5 279.2 396.7 124.9 105 53.5 1458
12 2 2 51 270 0 270 100 107 38.5 893
13 2 2 51 292.5 0 292.5 100 107 38.5 968
14 2 2.2 64 357.3 23.9 333.4 93.31 120 99 1003
15 2 2.3 67.5 168.5 11.25 157.25 93.3 93 58.5 452
16 2 2.3 21 87.4 26.75 94.15 107.7 111 98 271
17 2.1 1.4 20.5 283.6 49.09 234.51 82.7 150 50 1108
18 2.1 1.4 51.5 132 60 72 54.5 215 100 340
19 2.1 1.5 66.5 336 12 324 96.4 155 35 1429
20 2.1 1.7 20.5 234.55 32.72 201.83 86 160 55 785
21 2.1 1.8 71 570 45 525 92.1 142 50 1930
22 2.1 1.9 53.5 258 218 276 107 160 25 961
23 2.1 2 51 273.9 19.56 254.34 92.9 140 45 841
24 2.1 2.1 51.5 286 26.08 259.92 90.9 155 65 819
25 2.1 2.3 20.5 396 30 366 92.4 230 125 1053
26 2.1 2.4 39 202 227.75 229.75 113.76 115 55 633
27 2.1 3 30 258.75 22.5 236.25 91.3 100 20 521
28 2.1 3 30.5 236.25 28.12 208.13 88 64 48 459
29 2.2 1.5 29 180 15 165 91.6 170 45 728
30 2.2 1.5 106 345 30 315 91.3 145 70 1389
31 2.2 1.5 51.5 286.9 50.69 236.21 82.3 150 40 1042
32 2.2 1.6 106 443.5 19.56 423.94 95.6 170 85 1753
33 2.2 1.7 64 368.12 27.27 340.85 92.6 106 25 1326
34 2.2 1.8 64 555 52.5 502.5 90.5 140 45 1847
35 2.2 1.9 106 482.6 78.29 404.31 83.7 150 45 1408
36 2.2 2 82 508 58.69 449.31 88.4 170 65 1486
37 2.2 2.1 51 245.45 227.27 272.72 111.1 180 55 859
38 2.2 2.3 66 337.5 29 346.5 102.6 91 42 997
39 2.2 2.3 37.5 270 213.5 283.5 105 80 47 815
40 2.2 2.4 24 167 6.4 160.6 96.1 100 53 443
41 2.3 1.3 21 61.9 9 52.9 85.5 123 71 269
42 2.3 1.5 24 168.75 11.25 157.5 93.3 111 56 695
43 2.3 1.5 39 202.5 29 211.5 104.4 111 21 933
44 2.3 1.5 21 92.7 10.6 82.1 88.5 99 15 362
45 2.3 1.5 21 38.57 0 38.57 100 88 15 170
46 2.3 2 108 427 11.25 415.75 97.4 140 45 1375
47 2.3 2 47 191.25 218 209.25 109.4 110 53 692
48 2.3 2 57.5 258.75 245 303.75 117.4 115 12 1005
70 Cardiovasc Eng (2010) 10:66–77
123
For a diameter of the feeding artery—2 mm, when the
FPAB was reduced and the DFS was increased there was
no consistent pattern. For a fistula diameter of 1.3 mm the
reduction in FPAB reduced the flow in the fistula (exper-
iments 4 and 5). However when the diameters of the fis-
tulae were 1.1, 1.3, 1.7 and 2.3 mm there was increase in
the FRPA (experiments 1 and 2, 4 and 5, 8 and 10 and 15
and 16). The increase in flow was contributed from a
reverse flow in the distal arterial segment (steal).
For a diameter of the feeding artery—2.2 mm reduction
in FPAB was did not produce any major changes in the
FRPA (experiments 29, 30, 31, 38 and 39). There were
changes in the FRPA when the FPAB was reduced in those
where the diameters of the feeding arteries were 2.3 mm
(experiments 46–47). The measurements of arterial pres-
sures at the entrance of the fistulae do not reflect accurately
the flows across the shunts unless the diameters of the
fistulae are considered.
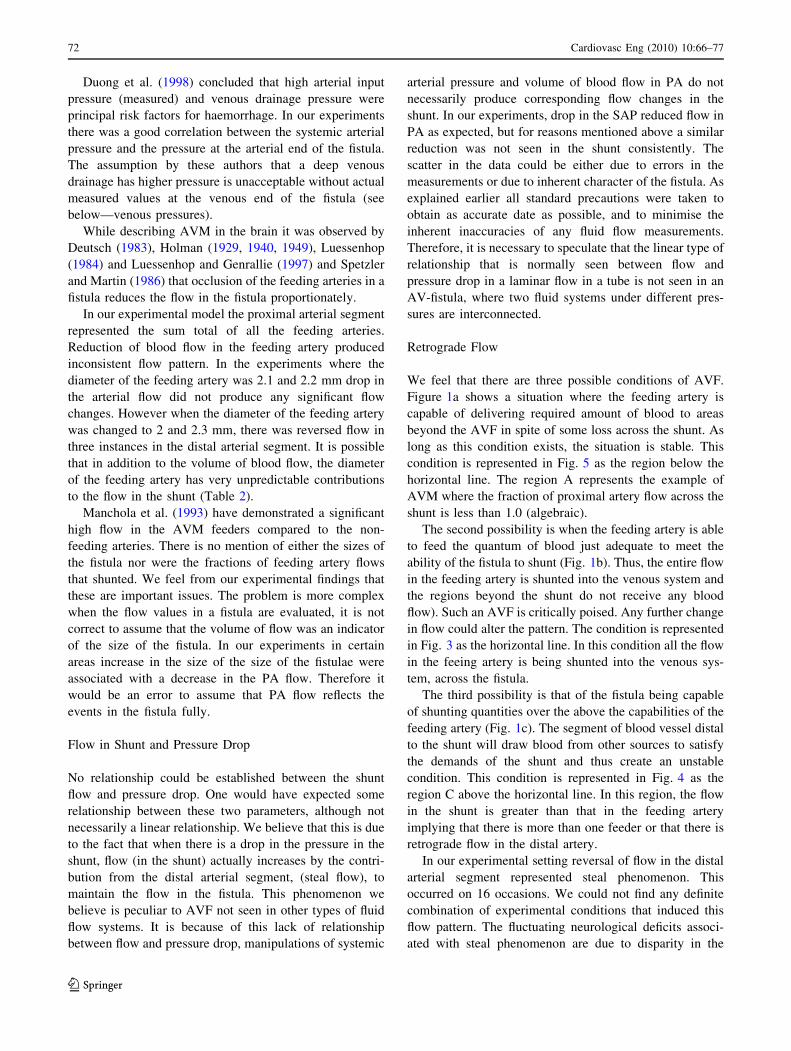
Proximal Artery Flow
Figure 3 shows the fraction of PA flow that flows across
the shunt for diameters of the fistulae. When the flow in the
PA was reduced in six of the experiments (1–2,10–8,38–
39,46–48) there was actually an increase in the fraction
(more than the total flow in the PA), due to reverse flow in
the distal arterial segment. If the flow in the PA is reduced
in certain situations the fistula draws blood from other
sources to maintain the pressure gradient.
Table 2 continued
Experiment No. DFA DFS FPAB FPA FDA FS FRPA AFJ VFJ RE
49 2.3 2.3 57.5 185.4 0 185.4 100 116 108 533
50 2.3 2.4 55 258.75 11.25 247.5 95.7 99 23 682
51 2.3 1.7 29 78.75 45 33.75 42.9 118 17 131
52 2.3 1.7 64 326.25 45 281.25 86.2 64 28 1095
Bold values indicate the experiments with reverse flow
DFA, Diameter of Feeding Artery; DFS, Diameter of Shunt; FPAB, Flow in Proximal Artery before Shunt; FPA, Flow in Proximal Artery after
opening the Shunt; FDA, Flow in Distal Artery after opening the Shunt; FS, Flow in Shunt; FRPA, Fraction of Proximal Artery flow in shunted
by the fistula; SAPA, Pressure at Artery Fistula Junction after opening the Shunt; SVPA, Pressure at Vein Fistula Junction after opening the Shunt;
RE, Reynolds number
Fig. 2 Relationship between
FPA and SAPA. FPA–Flow in
Proximal Artery after Shunt.
SAPA—Systemic Arterial
Pressure after opening the shunt
at Artery fistula Junction
Fig. 3 Relation between Fraction of blood from proximal artery and
Shunt diameter
Cardiovasc Eng (2010) 10:66–77 71
123
Duong et al. (1998) concluded that high arterial input
pressure (measured) and venous drainage pressure were
principal risk factors for haemorrhage. In our experiments
there was a good correlation between the systemic arterial
pressure and the pressure at the arterial end of the fistula.
The assumption by these authors that a deep venous
drainage has higher pressure is unacceptable without actual
measured values at the venous end of the fistula (see
below—venous pressures).
While describing AVM in the brain it was observed by
Deutsch (1983), Holman (1929, 1940, 1949), Luessenhop
(1984) and Luessenhop and Genrallie (1997) and Spetzler
and Martin (1986) that occlusion of the feeding arteries in a
fistula reduces the flow in the fistula proportionately.
In our experimental model the proximal arterial segment
represented the sum total of all the feeding arteries.
Reduction of blood flow in the feeding artery produced
inconsistent flow pattern. In the experiments where the
diameter of the feeding artery was 2.1 and 2.2 mm drop in
the arterial flow did not produce any significant flow
changes. However when the diameter of the feeding artery
was changed to 2 and 2.3 mm, there was reversed flow in
three instances in the distal arterial segment. It is possible
that in addition to the volume of blood flow, the diameter
of the feeding artery has very unpredictable contributions
to the flow in the shunt (Table 2).
Manchola et al. (1993) have demonstrated a significant
high flow in the AVM feeders compared to the non-
feeding arteries. There is no mention of either the sizes of
the fistula nor were the fractions of feeding artery flows
that shunted. We feel from our experimental findings that
these are important issues. The problem is more complex
when the flow values in a fistula are evaluated, it is not
correct to assume that the volume of flow was an indicator
of the size of the fistula. In our experiments in certain
areas increase in the size of the size of the fistulae were
associated with a decrease in the PA flow. Therefore it
would be an error to assume that PA flow reflects the
events in the fistula fully.
Flow in Shunt and Pressure Drop
No relationship could be established between the shunt
flow and pressure drop. One would have expected some
relationship between these two parameters, although not
necessarily a linear relationship. We believe that this is due
to the fact that when there is a drop in the pressure in the
shunt, flow (in the shunt) actually increases by the contri-
bution from the distal arterial segment, (steal flow), to
maintain the flow in the fistula. This phenomenon we
believe is peculiar to AVF not seen in other types of fluid
flow systems. It is because of this lack of relationship
between flow and pressure drop, manipulations of systemic
arterial pressure and volume of blood flow in PA do not
necessarily produce corresponding flow changes in the
shunt. In our experiments, drop in the SAP reduced flow in
PA as expected, but for reasons mentioned above a similar
reduction was not seen in the shunt consistently. The
scatter in the data could be either due to errors in the
measurements or due to inherent character of the fistula. As
explained earlier all standard precautions were taken to
obtain as accurate date as possible, and to minimise the
inherent inaccuracies of any fluid flow measurements.
Therefore, it is necessary to speculate that the linear type of
relationship that is normally seen between flow and
pressure drop in a laminar flow in a tube is not seen in an
AV-fistula, where two fluid systems under different pres-
sures are interconnected.
Retrograde Flow
We feel that there are three possible conditions of AVF.
Figure 1a shows a situation where the feeding artery is
capable of delivering required amount of blood to areas
beyond the AVF in spite of some loss across the shunt. As
long as this condition exists, the situation is stable. This
condition is represented in Fig. 5 as the region below the
horizontal line. The region A represents the example of
AVM where the fraction of proximal artery flow across the
shunt is less than 1.0 (algebraic).
The second possibility is when the feeding artery is able
to feed the quantum of blood just adequate to meet the
ability of the fistula to shunt (Fig. 1b). Thus, the entire flow
in the feeding artery is shunted into the venous system and
the regions beyond the shunt do not receive any blood
flow). Such an AVF is critically poised. Any further change
in flow could alter the pattern. The condition is represented
in Fig. 3 as the horizontal line. In this condition all the flow
in the feeing artery is being shunted into the venous sys-
tem, across the fistula.
The third possibility is that of the fistula being capable
of shunting quantities over the above the capabilities of the
feeding artery (Fig. 1c). The segment of blood vessel distal
to the shunt will draw blood from other sources to satisfy
the demands of the shunt and thus create an unstable
condition. This condition is represented in Fig. 4 as the
region C above the horizontal line. In this region, the flow
in the shunt is greater than that in the feeding artery
implying that there is more than one feeder or that there is
retrograde flow in the distal artery.
In our experimental setting reversal of flow in the distal
arterial segment represented steal phenomenon. This
occurred on 16 occasions. We could not find any definite
combination of experimental conditions that induced this
flow pattern. The fluctuating neurological deficits associ-
ated with steal phenomenon are due to disparity in the
72 Cardiovasc Eng (2010) 10:66–77
123
feeding artery flow and the fraction of this flow that shunts
across Spetzler et al. (1992).
Diameter of the Fistula
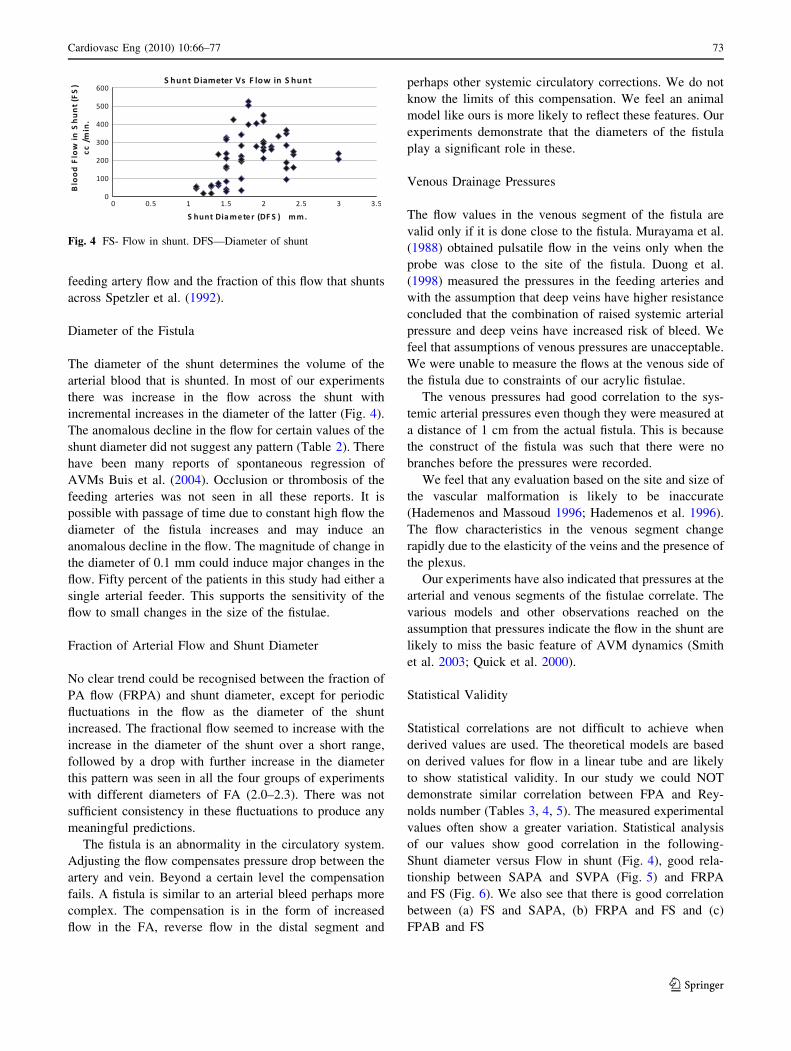
The diameter of the shunt determines the volume of the
arterial blood that is shunted. In most of our experiments
there was increase in the flow across the shunt with
incremental increases in the diameter of the latter (Fig. 4).
The anomalous decline in the flow for certain values of the
shunt diameter did not suggest any pattern (Table 2). There
have been many reports of spontaneous regression of
AVMs Buis et al. (2004). Occlusion or thrombosis of the
feeding arteries was not seen in all these reports. It is
possible with passage of time due to constant high flow the
diameter of the fistula increases and may induce an
anomalous decline in the flow. The magnitude of change in
the diameter of 0.1 mm could induce major changes in the
flow. Fifty percent of the patients in this study had either a
single arterial feeder. This supports the sensitivity of the
flow to small changes in the size of the fistulae.
Fraction of Arterial Flow and Shunt Diameter
No clear trend could be recognised between the fraction of
PA flow (FRPA) and shunt diameter, except for periodic
fluctuations in the flow as the diameter of the shunt
increased. The fractional flow seemed to increase with the
increase in the diameter of the shunt over a short range,
followed by a drop with further increase in the diameter
this pattern was seen in all the four groups of experiments
with different diameters of FA (2.0–2.3). There was not
sufficient consistency in these fluctuations to produce any
meaningful predictions.
The fistula is an abnormality in the circulatory system.
Adjusting the flow compensates pressure drop between the
artery and vein. Beyond a certain level the compensation
fails. A fistula is similar to an arterial bleed perhaps more
complex. The compensation is in the form of increased
flow in the FA, reverse flow in the distal segment and
perhaps other systemic circulatory corrections. We do not
know the limits of this compensation. We feel an animal
model like ours is more likely to reflect these features. Our
experiments demonstrate that the diameters of the fistula
play a significant role in these.
Venous Drainage Pressures
The flow values in the venous segment of the fistula are
valid only if it is done close to the fistula. Murayama et al.
(1988) obtained pulsatile flow in the veins only when the
probe was close to the site of the fistula. Duong et al.
(1998) measured the pressures in the feeding arteries and
with the assumption that deep veins have higher resistance
concluded that the combination of raised systemic arterial
pressure and deep veins have increased risk of bleed. We
feel that assumptions of venous pressures are unacceptable.
We were unable to measure the flows at the venous side of
the fistula due to constraints of our acrylic fistulae.
The venous pressures had good correlation to the sys-
temic arterial pressures even though they were measured at
a distance of 1 cm from the actual fistula. This is because
the construct of the fistula was such that there were no
branches before the pressures were recorded.
We feel that any evaluation based on the site and size of
the vascular malformation is likely to be inaccurate
(Hademenos and Massoud 1996; Hademenos et al. 1996).
The flow characteristics in the venous segment change
rapidly due to the elasticity of the veins and the presence of
the plexus.
Our experiments have also indicated that pressures at the
arterial and venous segments of the fistulae correlate. The
various models and other observations reached on the
assumption that pressures indicate the flow in the shunt are
likely to miss the basic feature of AVM dynamics (Smith
et al. 2003; Quick et al. 2000).
Statistical Validity
Statistical correlations are not difficult to achieve when
derived values are used. The theoretical models are based
on derived values for flow in a linear tube and are likely
to show statistical validity. In our study we could NOT
demonstrate similar correlation between FPA and Rey-
nolds number (Tables 3, 4, 5). The measured experimental
values often show a greater variation. Statistical analysis
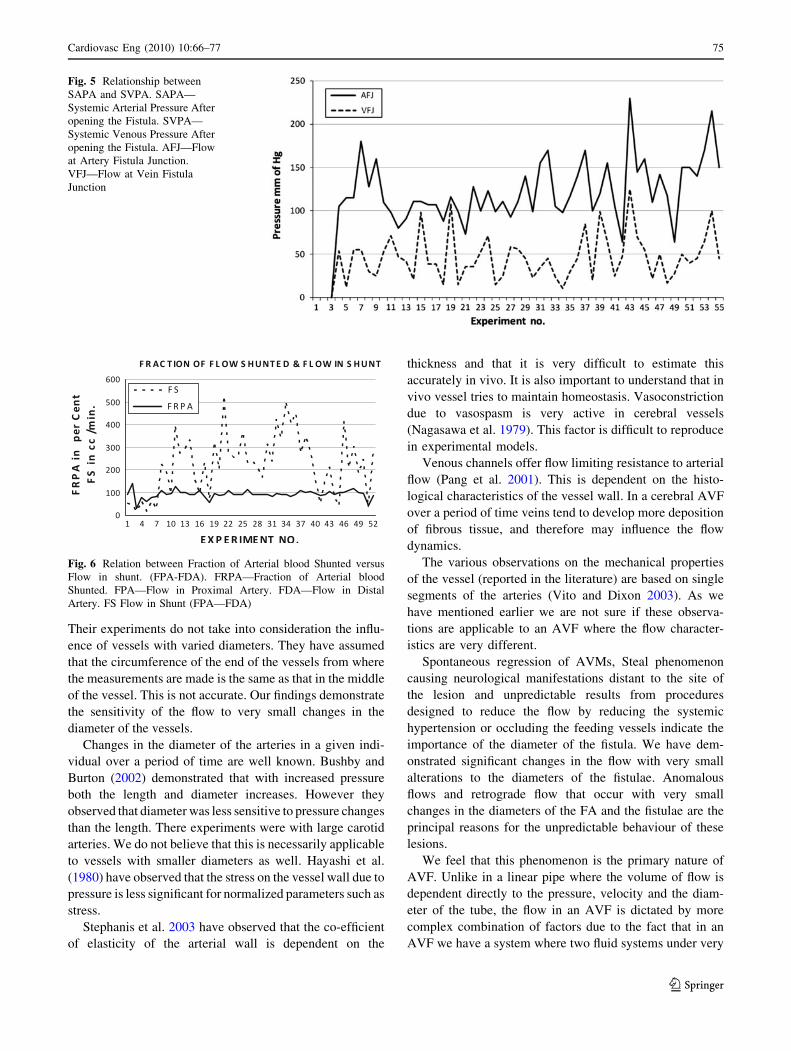
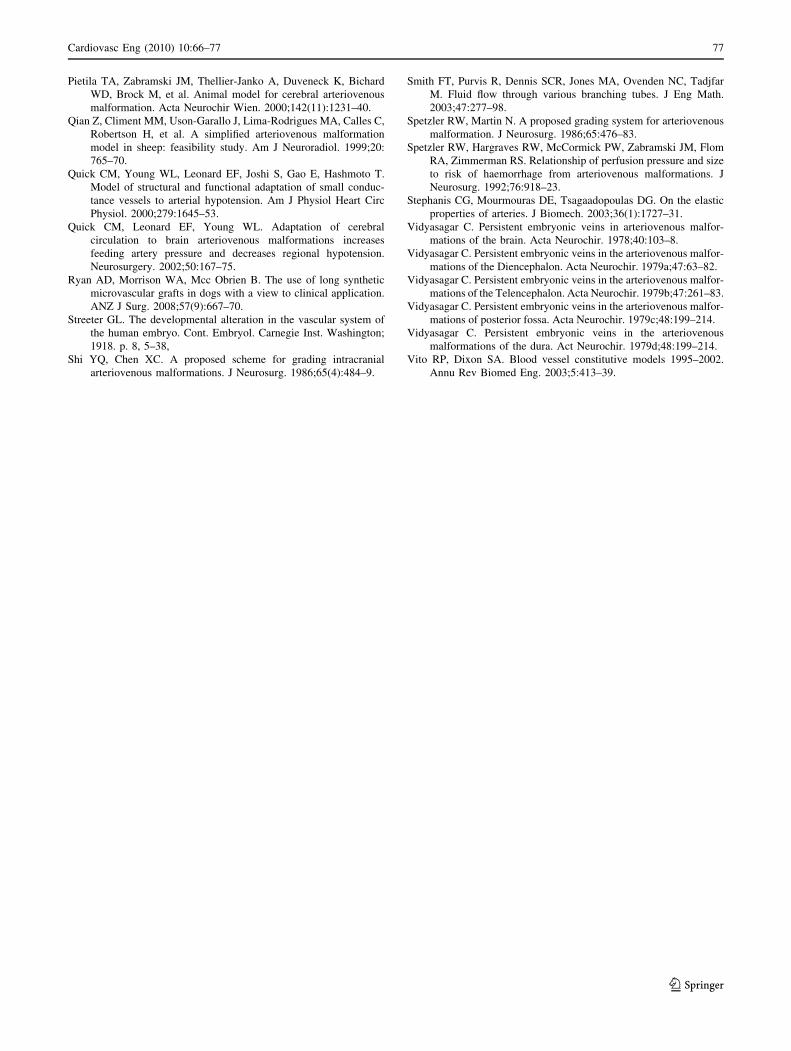
of our values show good correlation in the following-
Shunt diameter versus Flow in shunt (Fig. 4), good rela-
tionship between SAPA and SVPA (Fig. 5) and FRPA
and FS (Fig. 6). We also see that there is good correlation
between (a) FS and SAPA, (b) FRPA and FS and (c)
FPAB and FS
Fig. 4 FS- Flow in shunt. DFS—Diameter of shunt
Cardiovasc Eng (2010) 10:66–77 73
123
Mechanical Properties of Vessels
We acknowledge that the mechanical properties of the
vessels influence the flow. Monson et al. (2008) studied the
biaxial response of passive cerebral arteries. They con-
cluded that the behaviour of the arteries was non linear and
anisotropic. They also observed that there was greater
deformation in the axial direction than in the circumference.
Table 3 Statistical correlation with ALL cases
DFA DFS FPAB FPA FDA FS FRPA SAPA SVPA RE
DFA 1
DFS 0.0870 1
FPAB 0.0069 -0.0360 1
FPA 0.2028 0.3383* 0.5056** 1
FDA 0.0826 -0.1332 0.1551 0.2994 1
FS 0.1939 0.3811** 0.4944** 0.9792** 0.0998 1
FRPA 0.0390 0.2758 -0.0017 0.1797 -0.6764 0.3311* 1
SAPA 0.0259 -0.131 0.0793 0.3710** 0.3124 0.3206 -0.1406 1
SVPA -0.051 0.2326 0.0097 0.2325 0.1047 0.2202 0.1525 0.4919 1
RE 0.1969 0.1202 0.5296** 0.9453** 0.1528 0.9534** 0.2847 0.3718** 0.1675 1
Confidence 5% (*) 0.322; confidence 1% (**) 0.354
Table 4 Statistical Correlation with cases with retrograde flow
DFA DFS FPAB FPA FDA FS FRPA AFJ VFJ F 100 RE
DFA 1 12 cases
DFS 0.2011 1
FPAB 0.2901 0.2323 1
FPA 0.3636 0.4465 0.8975 1
FDA 0.1757 0.0462 -0.5169 -0.4304 1
FS 0.2881 0.3890 0.9087 0.9822 -0.5920 1
FRPA -0.4639 -0.6506 -0.2979 -0.4829 -0.3804 -0.3522 1
SAPA -0.0104 -0.0025 0.2106 0.0598 -0.0691 0.0677 -0.1284 1
SVPA -0.5327 0.1528 -0.6222 -0.5655 0.1643 -0.5391 0.2684 -0.1617 1
F 100 -0.2236 0.4802 0.0421 0.3552 -0.1347 0.3451 -0.2490 -0.4981 0.3242 1
RE 0.2219 0.0674 0.8788 0.8834 -0.6773 0.9294 -0.2127 0.1099 -0.6338 0.2100 1
Confidence 5% (*) 0.658; confidence 1% (**) 0.708
Table 5 Correlation coefficients between various parameters
Parameters All cases Cases with retrograde flow (steal)
Shunt DIA versus Pressure at AFJ (DFS) vs (SAPA) -0.131 -0.00 25
Shunt DIA versus Pressure at VFJ (DFS) vs (SVPA) 0.2326 0.1528
Shunt DIA versus Flow in shunt (DFS) vs (FPAA—FDA) 0.3811* 0.3890
Pressure at AFJ versus Pressure at VFJ (SAPA) vs (SVPA) 0.492** -0.1617
Fraction of proximal artery flow versus Pressure at AFJ (FRPA) vs (SAPA) -0.1406 -0.1284
Fraction of proximal artery flow versus Pressure at VFJ (FRPA) vs (SVPA) 0.1525 -0.2684
Fraction of Proximal Artery Flow versus Flow in shunt (FRPA) vs (FPAA—FDA) 0.3311* -0.3522
Artery DIA vs flow in shunt (DFA) vs (FPAA—FDA) 0.1939 0.2881
Fraction of proximal artery flow (FRPA) versus Reynolds’s number 0.2847 -0.2127
Fraction of proximal artery flow (FRPA) versus Shear rate 0.185 -0.193
* Significant at 5% level
** Significant at 1% level
74 Cardiovasc Eng (2010) 10:66–77
123
Their experiments do not take into consideration the influ-
ence of vessels with varied diameters. They have assumed
that the circumference of the end of the vessels from where
the measurements are made is the same as that in the middle
of the vessel. This is not accurate. Our findings demonstrate
the sensitivity of the flow to very small changes in the
diameter of the vessels.
Changes in the diameter of the arteries in a given indi-
vidual over a period of time are well known. Bushby and
Burton (2002) demonstrated that with increased pressure
both the length and diameter increases. However they
observed that diameter was less sensitive to pressure changes
than the length. There experiments were with large carotid
arteries. We do not believe that this is necessarily applicable
to vessels with smaller diameters as well. Hayashi et al.
(1980) have observed that the stress on the vessel wall due to
pressure is less significant for normalized parameters such as
stress.
Stephanis et al. 2003 have observed that the co-efficient
of elasticity of the arterial wall is dependent on the
thickness and that it is very difficult to estimate this
accurately in vivo. It is also important to understand that in
vivo vessel tries to maintain homeostasis. Vasoconstriction
due to vasospasm is very active in cerebral vessels
(Nagasawa et al. 1979). This factor is difficult to reproduce
in experimental models.
Venous channels offer flow limiting resistance to arterial
flow (Pang et al. 2001). This is dependent on the histo-
logical characteristics of the vessel wall. In a cerebral AVF
over a period of time veins tend to develop more deposition
of fibrous tissue, and therefore may influence the flow
dynamics.
The various observations on the mechanical properties
of the vessel (reported in the literature) are based on single
segments of the arteries (Vito and Dixon 2003). As we
have mentioned earlier we are not sure if these observa-
tions are applicable to an AVF where the flow character-
istics are very different.
Spontaneous regression of AVMs, Steal phenomenon
causing neurological manifestations distant to the site of
the lesion and unpredictable results from procedures
designed to reduce the flow by reducing the systemic
hypertension or occluding the feeding vessels indicate the
importance of the diameter of the fistula. We have dem-
onstrated significant changes in the flow with very small
alterations to the diameters of the fistulae. Anomalous
flows and retrograde flow that occur with very small
changes in the diameters of the FA and the fistulae are the
principal reasons for the unpredictable behaviour of these
lesions.
We feel that this phenomenon is the primary nature of
AVF. Unlike in a linear pipe where the volume of flow is
dependent directly to the pressure, velocity and the diam-
eter of the tube, the flow in an AVF is dictated by more
complex combination of factors due to the fact that in an
AVF we have a system where two fluid systems under very
Fig. 5 Relationship between
SAPA and SVPA. SAPA—
Systemic Arterial Pressure After
opening the Fistula. SVPA—
Systemic Venous Pressure After
opening the Fistula. AFJ—Flow
at Artery Fistula Junction.
VFJ—Flow at Vein Fistula
Junction
Fig. 6 Relation between Fraction of Arterial blood Shunted versus
Flow in shunt. (FPA-FDA). FRPA—Fraction of Arterial blood
Shunted. FPA—Flow in Proximal Artery. FDA—Flow in Distal
Artery. FS Flow in Shunt (FPA—FDA)
Cardiovasc Eng (2010) 10:66–77 75
123

different pressures are interconnected. Simple manipula-
tions of SAP or blood flow in the feeding artery may create
more problems by destabilising the flow patterns. We were
unable to demonstrate any definite predictable patterns.
Our experiments in spite of their inherent defects strongly
suggest that the flow characteristics of an AVF are too
complex, to be influenced entirely simple physiological
parameters such as blood pressure, velocity of flow and
volume of blood flow in the feeding arteries. Our model has
demonstrated that pressure studies alone do not reflect the
flow characteristics of the fistula and that the diameters of
the fistula and the feeding arteries play a very significant
role in the hemodynamics of the malformation. Perhaps
there is a very significant relationship between the shunt
diameter and a non-dimensional factor such as the fraction
of arterial flow shunted across (Goldberger and West 1990,
1987). More experimental work with a model that incor-
porates the diameters of the fistula and FA is needed to
elucidate this very complex problem.
Acknowledgments We are grateful to the director of The National
Institute of Mental Health And Neurosciences, the Vice chancellor of
University of agricultural Sciences and the Director of St. John’s
Medical College for their support. The secretarial services of Mr.
James were invaluable in preparing this manuscript. Mr. A. Bolar’s
input into the design of the acrylic fistulae is much appreciated.
References
Batjer HH, Devous MD, Seiber GB, Purdy P, Ajmani AK, Delarosa
M, et al. Intracranial arteriovenous malformation. Relationships
between clinical and radiographic factors and ipsilateral steal
severity. Neurosurgery. 1988;23(3):322–7.
Buis DR, van den Gerg R, Lycklama G, van der Worp HB, Driven
CM, vandertop WP. Spontaneous regression of brain arteriove-
nous malformations—a clinical study and a sytematic review of
the literature. J Neurol. 2004;251(11):1375–82.
Bushby D, Burton A. The effect of age on the elasticity of the major
brain arteries. Can J Physiol Pharmocol. 2002;43:185–90.
Constantiono A, Vintners HV. A pathogenic correlate of the ‘‘Steal’’
phenomenon in a patient with cerebral arteriovenous malforma-
tion. Stroke. 1986;17:103–6.
Deshpande DH, Vidyasagar C. Histology of persistent embryonic
veins in arteriovenous malformations of brain. Acta Neurochir.
1980;52:227–36.
Deutsch G. Blood flow changes in arteriovenous malformation during
behavioural activities. Ann Neurol. 1983;13:38–43.
Djurberg HG, Tjan GT. Anaesthesia for super selective embolisation
of cerebral arterio-venous malformations. Pan Arab—J.
1996;12:1–17.
Duong DH, Vang MC, Sciacca RR, Mast H, Koennecke H, Hartman
A, et al. Feeding artery pressure and venous drainage pattern are
primary determinants of haemorrhage from cerebral arteriove-
nous malformations. Stroke. 1998;29:1167–76.
Evans HE. Miller’s anatomy of the dog. 3rd ed. Saunders: Philadel-
phia; 1993.
Gao E, Young WL, Ornstein E, Pile-Spellman J, Qiyuan MA.
Theoretical model of cerebral haemodynamics. Application to
the study of arteriovenous malformations. J Cereb Blood Flow
Metab. 1997;17:905–18.
Goldberger AL, West BJ. Fractals in physiology and medicine. Yale J
Biol Med. 1987;60:421–35.
Goldberger AL, West BJ. Chaos and fractals in human physiology.
Sci Am. 1990;262:36–41.
Hademenos GJ, Massoud TF, Vinuela F. A biomathematical model of
intracranial arteriovenous malformations based on electrical
network analysis: theory and hemodynamics. Neurosurgery.
1996;38(5):1005–15.
Hademenos GJ, Massoud TF. Risk of intracranial arteriovenous
malformation rupture due to venous drainage impairment.
Stroke. 1996;27:1072–83.
Hayashi K, Handa H, Nagasawa S, Okumura A, Moritaki K. Stiffness
and elastic behaviour of human intracranial and extra cranial
arteries. J Biochem. 1980;13:175–9.
Homan RW, Devous MD, Strokely EM, Bonte FJ. Quantification of
intracerebral steal in patients with arteriovenous malformations.
Arch Neurol. 1986;13(8):779–85.
Holman E. Arteriovenous fistula, dilatation of the artery distal to
abnormal communication. Arch Surg. 1929;18:1672–80.
Holman E. The anatomic and physiological effects of an arteriove-
nous fistula. Surgery. 1940;8:362–8.
Holman E. Problems encountered in the dynamics of blood flow me.
Conditions controlling collateral circulation in the presence of an
arteriovenous fistula following the ligation of an artery. Surgery.
1949;26:889–94.
Krumhar D, Schulz U. Quantitative evaluation of retrograde arterial
flow in chronic experimental AVFs. Basic Res Cardiol.
1970;70:29–45.
Lindegaard KF, Grolimund P, Aaslid R, Nornes H. Evaluation of
cerebral AVM’s using transcranial Doppler ultrasound. J Neu-
rosurg. 1986;65(3):335–44.
Louge FC, Giobano JM, Hobson RW. Regional haemodynamics of
large and small femoral arteriovenous fistulae in dogs. Surgery.
1975;79(3):346–9.
Luessenhop AJ, Genrallie TA. Anatomical grading of supratentorial
arteriovenous malformations through internal carotid and verte-
bral arteries, Long term results. J Neurosurg. 1997;42:443–51.
Luessenhop AJ. Natural history of cerebral arteriovenous malforma-
tion. In: Wilson CV, Stein BM, editors. Intracranial arteriovenous
malformation. Baltimore: Williams and Wilkins; 1984. p. 12–23.
Manchola IF, De Sallesa AA, Kok FT, Ackerman RH, Candia GT,
Kjellberg RN. Arteriovenous malformation haemodynamics: a
transcranial Doppler study 1. Neurosurgery. 1993;33(4):556–62.
Monson KL, Barbaro NM, Manley GT. Biaxial response to passive
human cerebral arteries. Ann Biomed Eng. 2008;36(12):2028–41.
Murayama Y, Usami S, Hata Y, Ganaha F, Hasegawa Y, Terao T,
et al. Transvenous hemodynamic assessment of arteriovenous
malformations and fistulas. Stroke. 1988;29:1167–76.
Nagasawa S, Handa H, Okumura A, Naruo Y, Moritake K, Hayashi
K. Mechanical properties of human cerebral arteries. Part 1:
effects of age and vascular smooth muscle activation. Surg
Neurol. 1979;12(4):297–304.
Nornes H, Grip A. Haemodynamic aspects of cerebral arteriovenous
malformations. J Neurosurg. 1980;53:456–65.
Nornes H. Quantification of altered haemodynamics. In: Wilson CB,
Stein BM, editors. Intracranial arteriovenous malformations.
Baltimore: Williams and Wilkins; 1984. p. 32–43.
Orsi MA, Domeniconi FR, Artoni BSM, Filho J. Carotid arteries in
the dog: structure and histopathology. Int J Morphol.
2006;24(2):239–44.
Padget DH. Contributions to Embryology, vol 32, Carnegie Institute
of Washington Pub. No. 575, The development of cranial arteries
in human embryology. Washington, DC; 1948. 205–261.
Pang Q, Lu X, Gregerson H, von Oettinger G, Astrup J. Biomechan-
ical properties of porcine cerebral bridging veins with reference
to the zero- stress state. J Vas Res. 2001;38(1):83–90.
76 Cardiovasc Eng (2010) 10:66–77
123
Pietila TA, Zabramski JM, Thellier-Janko A, Duveneck K, Bichard
WD, Brock M, et al. Animal model for cerebral arteriovenous
malformation. Acta Neurochir Wien. 2000;142(11):1231–40.
Qian Z, Climent MM, Uson-Garallo J, Lima-Rodrigues MA, Calles C,
Robertson H, et al. A simplified arteriovenous malformation
model in sheep: feasibility study. Am J Neuroradiol. 1999;20:
765–70.
Quick CM, Young WL, Leonard EF, Joshi S, Gao E, Hashmoto T.
Model of structural and functional adaptation of small conduc-
tance vessels to arterial hypotension. Am J Physiol Heart Circ
Physiol. 2000;279:1645–53.
Quick CM, Leonard EF, Young WL. Adaptation of cerebral
circulation to brain arteriovenous malformations increases
feeding artery pressure and decreases regional hypotension.
Neurosurgery. 2002;50:167–75.
Ryan AD, Morrison WA, Mcc Obrien B. The use of long synthetic
microvascular grafts in dogs with a view to clinical application.
ANZ J Surg. 2008;57(9):667–70.
Streeter GL. The developmental alteration in the vascular system of
the human embryo. Cont. Embryol. Carnegie Inst. Washington;
1918. p. 8, 5–38,
Shi YQ, Chen XC. A proposed scheme for grading intracranial
arteriovenous malformations. J Neurosurg. 1986;65(4):484–9.
Smith FT, Purvis R, Dennis SCR, Jones MA, Ovenden NC, Tadjfar
M. Fluid flow through various branching tubes. J Eng Math.
2003;47:277–98.
Spetzler RW, Martin N. A proposed grading system for arteriovenous
malformation. J Neurosurg. 1986;65:476–83.
Spetzler RW, Hargraves RW, McCormick PW, Zabramski JM, Flom
RA, Zimmerman RS. Relationship of perfusion pressure and size
to risk of haemorrhage from arteriovenous malformations. J
Neurosurg. 1992;76:918–23.
Stephanis CG, Mourmouras DE, Tsagaadopoulas DG. On the elastic
properties of arteries. J Biomech. 2003;36(1):1727–31.
Vidyasagar C. Persistent embryonic veins in arteriovenous malfor-
mations of the brain. Acta Neurochir. 1978;40:103–8.
Vidyasagar C. Persistent embryonic veins in the arteriovenous malfor-
mations of the Diencephalon. Acta Neurochir. 1979a;47:63–82.
Vidyasagar C. Persistent embryonic veins in the arteriovenous malfor-
mations of the Telencephalon. Acta Neurochir. 1979b;47:261–83.
Vidyasagar C. Persistent embryonic veins in the arteriovenous malfor-
mations of posterior fossa. Acta Neurochir. 1979c;48:199–214.
Vidyasagar C. Persistent embryonic veins in the arteriovenous
malformations of the dura. Act Neurochir. 1979d;48:199–214.
Vito RP, Dixon SA. Blood vessel constitutive models 1995–2002.
Annu Rev Biomed Eng. 2003;5:413–39.
Cardiovasc Eng (2010) 10:66–77 77
123