observations of weekday-weekend activity patterns for area
TRANSCRIPT
Observations of Weekday-Weekend Activity Patterns for Area Sources in the Los Angeles Area
Dana L. Coe, Courtney A. Gorin, Lyle R. Chinkin, and Stephen R. Reid Sonoma Technology, Inc.; 1360 Redwood Way, Suite C; Petaluma, California 94954-1169
[email protected], [email protected], [email protected], [email protected]
ABSTRACT
Over the past 10 years, average peak ozone concentrations in Los Angeles were as much as 55% higher on weekends than on weekdays (under comparable meteorological conditions), even though weekend ozone precursor emissions are low relative to weekday emissions. During the summer of 2002, Sonoma Technology, Inc., (STI) extended previous research into weekday-weekend (WD-WE) emissions activity patterns. The objectives were (1) to corroborate our previous research, (2) to formulate improved diurnal and weekly emissions activity profiles for additional source categories, which are used as inputs to air quality models, and (3) to contribute (in conjunction with other concurrent research efforts) to the general understanding of weekday-to-weekend variability in air quality, which has been noted in Los Angeles and other urban areas. The project scope encompassed an array of emissions source categories: on-road mobile, off-road mobile, major point, residential area, and small commercial area sources. However, to suit the interests of the 2003 International Emission Inventory Conference, this paper focuses exclusively on residential and small-commercial area sources.
Data collection consisted of surveys of southern California residences and small businesses during the summer of 2002 regarding the frequency and timing of various emissions-related activities. These activities included uses of barbecues, recreational boats, off-road vehicles, energy for water heating, various types of volatile chemicals, and various types of commercial equipment (such as lawn and garden equipment and heavy-duty construction equipment). Combined, these sources are estimated to contribute about 70% of area and non-road mobile reactive organic gases (ROG) emissions and 50% of area and non-road mobile nitrogen oxides (NOx) emissions in the South Coast Air Basin’s year-2000 annual emission inventory.
The results of the surveys indicated that some residential activities increase on weekends relative to weekdays by as much as 25% to 165%, while business activities decrease by 60% to 99%. These findings corroborate earlier results and cover additional important emission source categories. Therefore, these latest findings confirm previous preliminary conclusions, and with the inclusion of recreational boats, off-road vehicles, and construction equipment, are likely to further strengthen the following previously stated hypotheses:1
1) WD-WE variabilities in activity patterns have quantifiable impacts on ROG and NOx emissions in Los Angeles.
2) When these quantifiable impacts are considered together with WD-WE patterns for mobile and point sources, it appears that overall weekend emissions patterns favor ozone formation in Los Angeles to a greater extent than do weekday emission patterns.
3) This phenomenon is due to increased ROG:NOx ratios toward a more efficient ozone production regime and a reduced morning titration capacity of ozone by NOx.
INTRODUCTION
In recent years, Los Angeles has experienced peak ozone concentrations on weekends that are greater than weekday peaks.2,3,4 This phenomenon, the “weekend ozone effect”, is counter-intuitive because emissions of ozone precursors on weekends are, at most locations and times of day, lower than those for weekdays.5,6 During the summer of 2002, we extended our previous research projects, which
were conducted during 2000 and 2001 as components of coordinated field studies of air quality and emissions-related activity patterns. 3,4,7,8 The purpose of our past and most recent studies was to generate information to improve our general understanding of the weekend ozone effect.
During the summer of 2002, we surveyed Los Angeles residences and small businesses about frequency and timing of various emission-related activities. The objectives of the surveys were to corroborate and extend our findings determined in 2000 and 2001 and to characterize weekday-to-weekend (WD-WE) activity patterns for additional seasons and types of area sources. The surveys were concurrent and coordinated with other data collection efforts, such as monitoring of traffic volumes on surface streets, monitoring of individual volunteers’ travel activity patterns with the use of in-vehicle instruments, acquisition of freeway-based traffic volume data, and acquisition of data from the continuous emissions monitoring systems (CEMS) of major stationary point sources. Partly to corroborate our previous work, some of the surveys targeted five specific neighborhoods of Los Angeles, while the remainder of the surveys was administered to a randomly selected sample of residents and businesses throughout the South Coast Air Basin (SoCAB). We extrapolated the survey results to represent the SoCAB and arrived at several conclusions:
• Certain residential activities increase from 25% to 165% from weekdays to weekends, such as the use of barbecues, recreational boats, recreational off-road vehicles, and paints or solvents. Other residential activities vary to a much lesser degree.
• Diurnal distributions of some residential activities vary by day of week. For example, weekday use of barbecues occurs primarily in the evening. However, afternoon use increases from 8% to 12% of total daily use, Monday through Thursday, to 25% to 35% on weekends. Diurnal patterns for other residential activities vary little by day of week.
• Business activities, such as construction and commercial use of lawn and garden equipment, decline substantially on weekends (from 60% to 99%). Generally, business activities peak in the 8:00 a.m. to 4:00 p.m. time frame on weekdays and Saturdays but remain flat on Sundays. Exceptions are lawn and garden services and construction activities, which peak earlier on all days of the week, and businesses that use gas ovens, which peak slightly later on weekdays and sustain high levels of activity through the evening.
Previously, we reported that weekend NOx reductions appear to be disproportionately larger than corresponding ROG reductions; the expected effects of this are (1) less available NOx for titration and removal of morning ambient ozone; and (2) increased ambient ROG:NOx ratios, which correlate with increased rates of ambient ozone formation.1 Thus, weekend emissions patterns seem to favor ozone formation in Los Angeles to a greater extent than do weekday emission patterns. Our most recent research corroborates our earlier findings and strengthens them by including important additional source categories: recreational boats, recreational off-road vehicles, and construction equipment. Because activities of recreational boats and off-road vehicles—significant sources of VOCs—increase on weekends, and activities of heavy construction equipment—significant sources of NOx—decrease on weekends, it appears that the differences between weekday and weekend ratios of ROG:NOx emissions are larger than we previously reported.
APPROACH
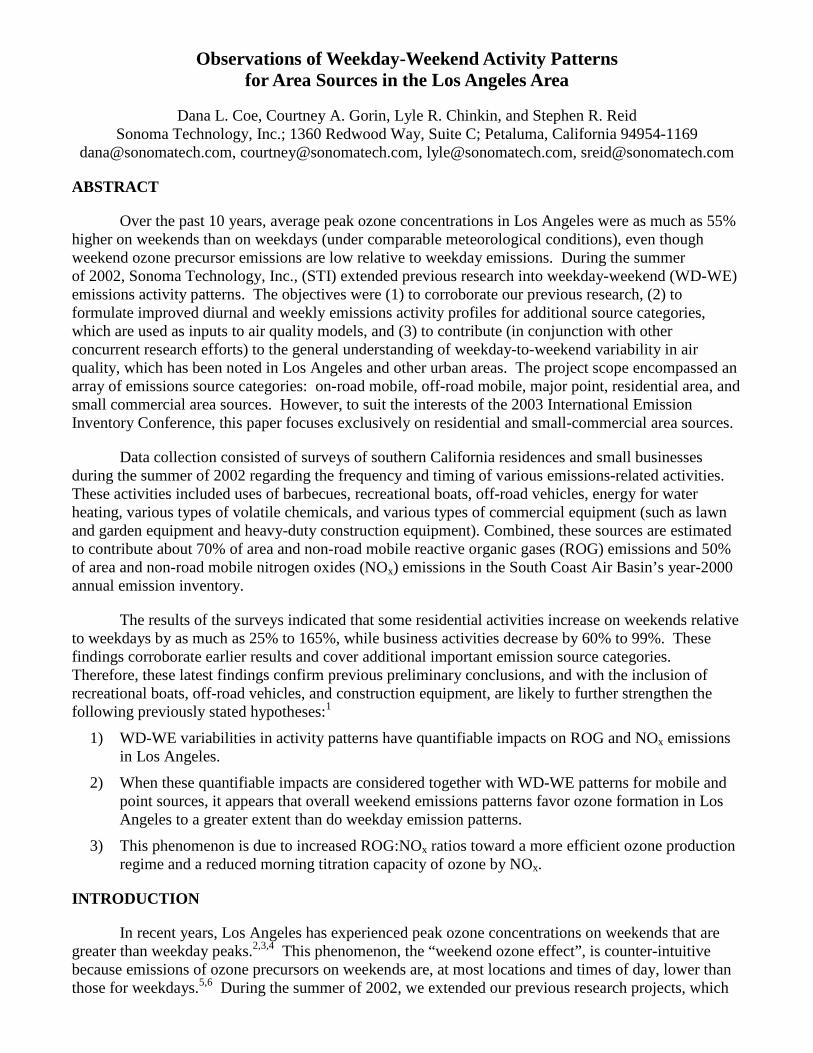
The May 17, 2002 through September 16, 2002 study period was coordinated with other WD-WE data collection efforts in the Los Angeles area.9 Data collection included telephone and mail surveys of households and commercial entities in five specific neighborhoods of Los Angeles (see Figure 1) and throughout the SoCAB, which includes Los Angeles County, Orange County, and portions of Riverside and San Bernardino Counties. We did not collect data during the weeks of Memorial Day, Independence Day, and Labor Day.
Figure 1. Locations of five neighborhoods—Burbank, Azusa, downtown Los Angeles, Lynwood, and Rubidoux—targeted for extra attention for the surveys.
Households were recruited in advance by telephone and by mail. After initial telephone recruitment, each residential survey participant received a letter; a daily activity diary in the form of a booklet of 10 postcards (which were date-stamped and postage-paid); and a nicely packaged one-dollar coin in mint condition (to encourage continued participation). Each participant was asked to complete one postcard per day for return by mail, beginning on a Friday and finishing 10 days later on a Sunday. Thus, each household completed postcards for two Fridays, two Saturdays, two Sundays, and the interceding Monday through Thursday. Participants checked off responses to queries about daily and periodic household activities, including uses of barbecues, recreational boats, recreational off-road vehicles, paints or solvents, personal care products, showers or baths (as a surrogate of water heating), and automatic appliances (also as a surrogate of water heating). Response options included “yes or no” (to ascertain any use that day); as well as “check all that apply: morning, afternoon, evening” (to determine the time periods when use occurred).
In addition, household participants responded at the time of initial recruitment to a telephone survey that established the following household characteristics: (1) number of persons in the household; (2) number of household members who regularly attend work or school outside the home; (3) number of males, females, legal adults, and legal minors who are members of the household; (4) total number of passenger cars, RVs, trucks, SUVs, vans, and/or motorcycles owned by household members; (5) ownership of any off-road recreational vehicles with corresponding counties where typically used; (6) ownership of any recreational boats or other watercraft with corresponding counties where typically used; (7) presence of a barbeque grill in the home with corresponding fuel types; (8) type of home heating and type of water heating with corresponding fuel types; (9) type of residence (e.g., single-family, multi-family); (10) status of home ownership versus rental; and (11) household income.
Commercial entities were contacted for participation in a short telephone-only survey. Business entities were asked a series of detailed questions about the number of employees typically on duty during specific time periods. The numbers of employees on duty were established for each day of a seven-day week and for six four-hour work shifts starting at midnight. Numbers of employees on duty were taken as indicators of business activity levels. The telephone recruitment and interview of commercial entities included a series of questions to determine the following business characteristics: (1) type of workplace (office or other); (2) total number of employees; (3) business hours of operation by day of week; (4) use of gas ovens or commercial charbroilers; (5) use of paints or solvents; (6) use of
light-duty off-road industrial equipment with internal combustion (IC) engines; or (7) use of heavy-duty off-road equipment with IC engines; (8) use of motor oils (including gear oils, gear fluids, or brake fluids); or (9) use of pesticides or fertilizers.
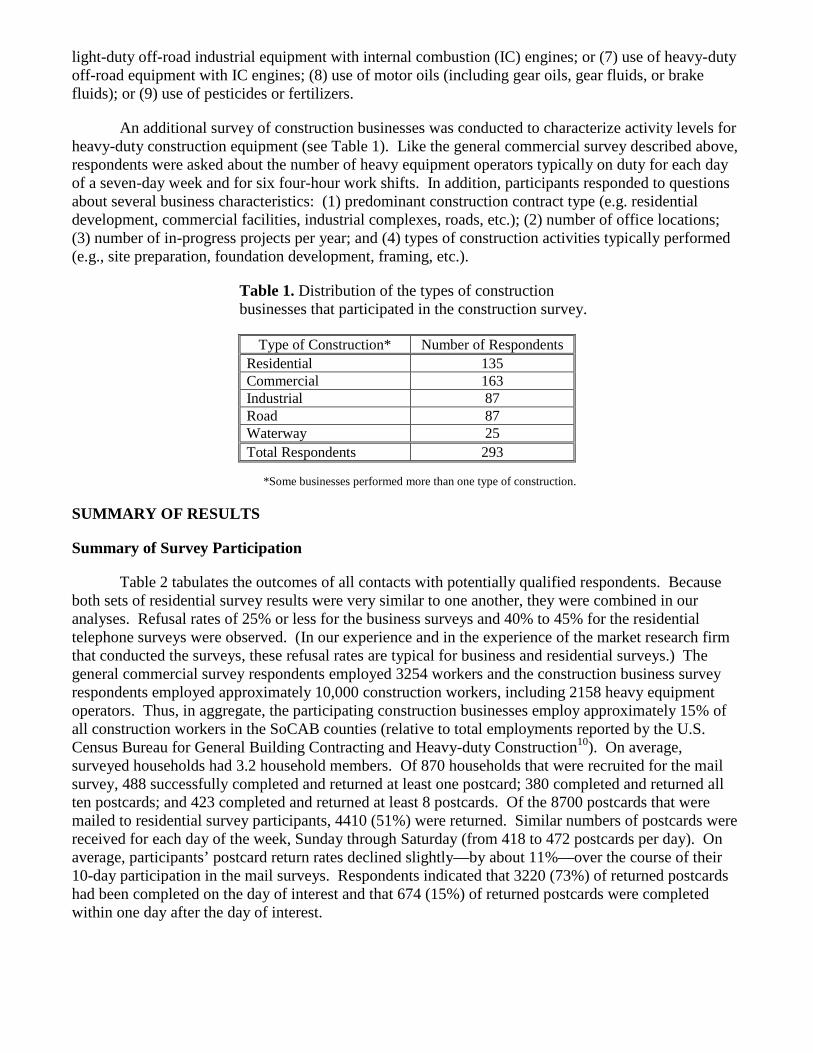
An additional survey of construction businesses was conducted to characterize activity levels for heavy-duty construction equipment (see Table 1). Like the general commercial survey described above, respondents were asked about the number of heavy equipment operators typically on duty for each day of a seven-day week and for six four-hour work shifts. In addition, participants responded to questions about several business characteristics: (1) predominant construction contract type (e.g. residential development, commercial facilities, industrial complexes, roads, etc.); (2) number of office locations; (3) number of in-progress projects per year; and (4) types of construction activities typically performed (e.g., site preparation, foundation development, framing, etc.).
Table 1. Distribution of the types of construction businesses that participated in the construction survey.
Type of Construction* Number of Respondents Residential 135 Commercial 163 Industrial 87 Road 87 Waterway 25 Total Respondents 293
*Some businesses performed more than one type of construction.
SUMMARY OF RESULTS
Summary of Survey Participation
Table 2 tabulates the outcomes of all contacts with potentially qualified respondents. Because both sets of residential survey results were very similar to one another, they were combined in our analyses. Refusal rates of 25% or less for the business surveys and 40% to 45% for the residential telephone surveys were observed. (In our experience and in the experience of the market research firm that conducted the surveys, these refusal rates are typical for business and residential surveys.) The general commercial survey respondents employed 3254 workers and the construction business survey respondents employed approximately 10,000 construction workers, including 2158 heavy equipment operators. Thus, in aggregate, the participating construction businesses employ approximately 15% of all construction workers in the SoCAB counties (relative to total employments reported by the U.S. Census Bureau for General Building Contracting and Heavy-duty Construction10). On average, surveyed households had 3.2 household members. Of 870 households that were recruited for the mail survey, 488 successfully completed and returned at least one postcard; 380 completed and returned all ten postcards; and 423 completed and returned at least 8 postcards. Of the 8700 postcards that were mailed to residential survey participants, 4410 (51%) were returned. Similar numbers of postcards were received for each day of the week, Sunday through Saturday (from 418 to 472 postcards per day). On average, participants’ postcard return rates declined slightly—by about 11%—over the course of their 10-day participation in the mail surveys. Respondents indicated that 3220 (73%) of returned postcards had been completed on the day of interest and that 674 (15%) of returned postcards were completed within one day after the day of interest.
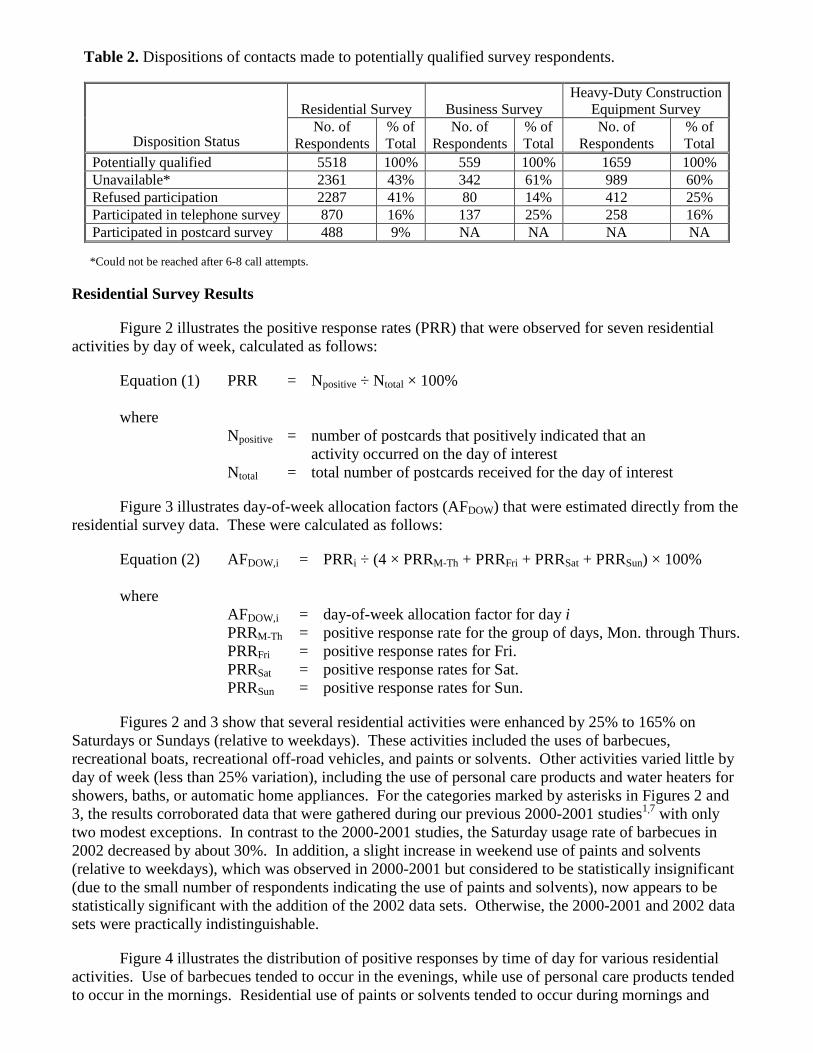
Table 2. Dispositions of contacts made to potentially qualified survey respondents.
Residential Survey Business Survey Heavy-Duty Construction
Equipment Survey
Disposition Status No. of
Respondents % of Total
No. of Respondents
% of Total
No. of Respondents
% of Total
Potentially qualified 5518 100% 559 100% 1659 100% Unavailable* 2361 43% 342 61% 989 60% Refused participation 2287 41% 80 14% 412 25% Participated in telephone survey 870 16% 137 25% 258 16% Participated in postcard survey 488 9% NA NA NA NA
*Could not be reached after 6-8 call attempts.
Residential Survey Results
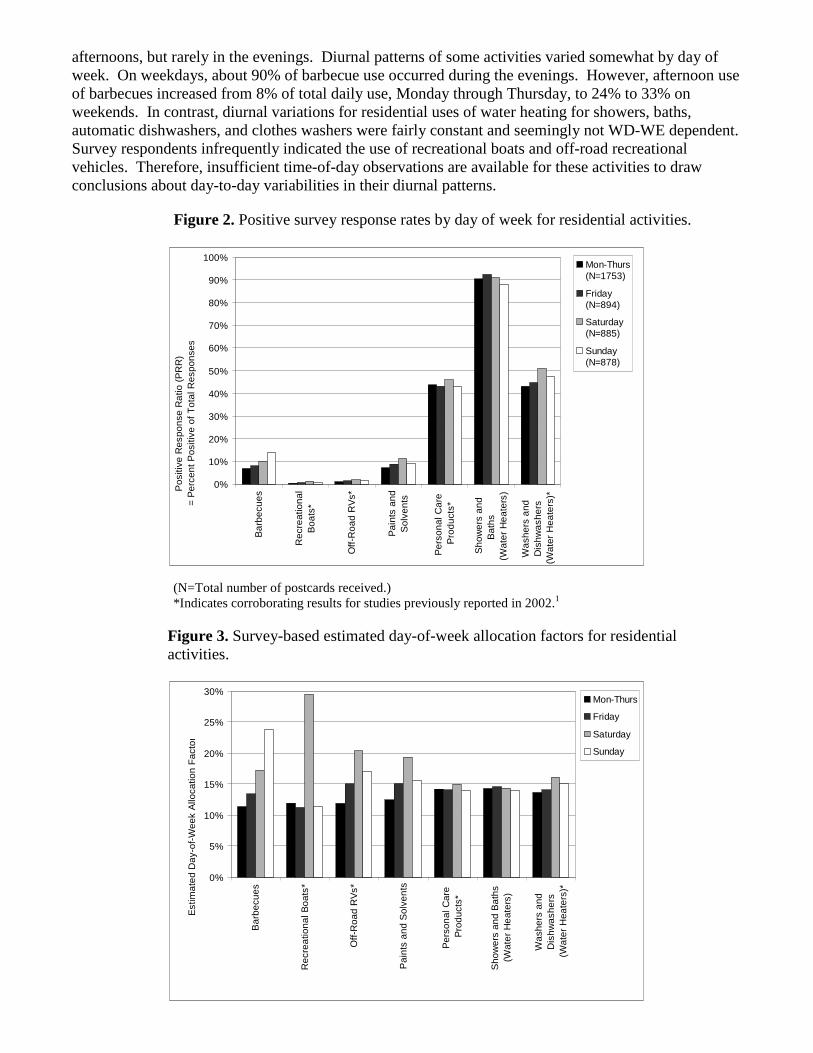
Figure 2 illustrates the positive response rates (PRR) that were observed for seven residential activities by day of week, calculated as follows:
Equation (1) PRR = Npositive ÷ Ntotal × 100% where
Npositive = number of postcards that positively indicated that an activity occurred on the day of interest
Ntotal = total number of postcards received for the day of interest
Figure 3 illustrates day-of-week allocation factors (AFDOW) that were estimated directly from the residential survey data. These were calculated as follows:
Equation (2) AFDOW,i = PRRi ÷ (4 × PRRM-Th + PRRFri + PRRSat + PRRSun) × 100% where
AFDOW,i = day-of-week allocation factor for day i PRRM-Th = positive response rate for the group of days, Mon. through Thurs. PRRFri = positive response rates for Fri. PRRSat = positive response rates for Sat. PRRSun = positive response rates for Sun.
Figures 2 and 3 show that several residential activities were enhanced by 25% to 165% on Saturdays or Sundays (relative to weekdays). These activities included the uses of barbecues, recreational boats, recreational off-road vehicles, and paints or solvents. Other activities varied little by day of week (less than 25% variation), including the use of personal care products and water heaters for showers, baths, or automatic home appliances. For the categories marked by asterisks in Figures 2 and 3, the results corroborated data that were gathered during our previous 2000-2001 studies1,7 with only two modest exceptions. In contrast to the 2000-2001 studies, the Saturday usage rate of barbecues in 2002 decreased by about 30%. In addition, a slight increase in weekend use of paints and solvents (relative to weekdays), which was observed in 2000-2001 but considered to be statistically insignificant (due to the small number of respondents indicating the use of paints and solvents), now appears to be statistically significant with the addition of the 2002 data sets. Otherwise, the 2000-2001 and 2002 data sets were practically indistinguishable.
Figure 4 illustrates the distribution of positive responses by time of day for various residential activities. Use of barbecues tended to occur in the evenings, while use of personal care products tended to occur in the mornings. Residential use of paints or solvents tended to occur during mornings and
afternoons, but rarely in the evenings. Diurnal patterns of some activities varied somewhat by day of week. On weekdays, about 90% of barbecue use occurred during the evenings. However, afternoon use of barbecues increased from 8% of total daily use, Monday through Thursday, to 24% to 33% on weekends. In contrast, diurnal variations for residential uses of water heating for showers, baths, automatic dishwashers, and clothes washers were fairly constant and seemingly not WD-WE dependent. Survey respondents infrequently indicated the use of recreational boats and off-road recreational vehicles. Therefore, insufficient time-of-day observations are available for these activities to draw conclusions about day-to-day variabilities in their diurnal patterns.
Figure 2. Positive survey response rates by day of week for residential activities.
0%
10%
20%
30%
40%
50%
60%
70%
80%
90%
100%B
arbe
cues
Rec
reat
iona
lB
oats
*
Off
-Roa
d R
Vs*
Pai
nts
and
Sol
vent
s
Per
sona
l Car
e P
rodu
cts*
Sho
wer
s an
dB
aths
(W
ater
He
ater
s)
Was
hers
and
D
ishw
ashe
rs
(Wat
er H
eate
rs)*
Pos
itive
Res
pons
e R
atio
(P
RR
) =
Per
cent
Pos
itive
of T
otal
Res
pons
es
Mon-Thurs(N=1753)
Friday(N=894)
Saturday(N=885)
Sunday(N=878)
(N=Total number of postcards received.) *Indicates corroborating results for studies previously reported in 2002.1
Figure 3. Survey-based estimated day-of-week allocation factors for residential activities.
0%
5%
10%
15%
20%
25%
30%
Bar
becu
es
Rec
reat
iona
l Boa
ts*
Off-
Roa
d R
Vs*
Pai
nts
and
Sol
ven
ts
Per
son
al C
are
Pro
duct
s*
Sho
wer
s an
d B
aths
(W
ater
He
ater
s)
Was
hers
and
D
ishw
ashe
rs
(Wat
er H
eate
rs)*
Est
imat
ed D
ay-o
f-W
eek
Allo
catio
n F
acto
r
Mon-Thurs
Friday
Saturday
Sunday
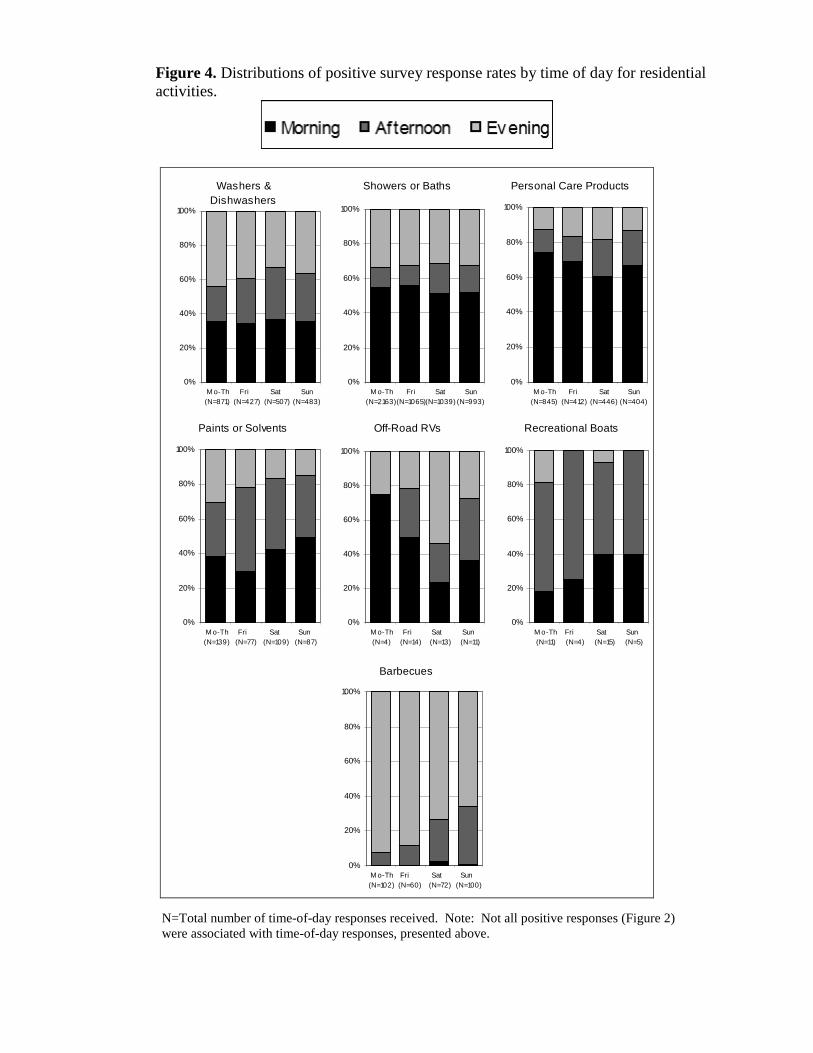
Figure 4. Distributions of positive survey response rates by time of day for residential activities.
Washers & Dishwashers
0%
20%
40%
60%
80%
100%
M o-Th(N=871)
Fri (N=427)
Sat (N=507)
Sun(N=483)
Showers or Baths
0%
20%
40%
60%
80%
100%
M o-Th(N=2163)
Fri (N=1065)
Sat(N=1039)
Sun(N=993)
Personal Care Products
0%
20%
40%
60%
80%
100%
M o-Th(N=845)
Fri (N=412)
Sat(N=446)
Sun(N=404)
Paints or Solvents
0%
20%
40%
60%
80%
100%
M o-Th(N=139)
Fri (N=77)
Sat (N=109)
Sun (N=87)
Off-Road RVs
0%
20%
40%
60%
80%
100%
M o-Th(N=4)
Fri (N=14)
Sat (N=13)
Sun (N=11)
Recreational Boats
0%
20%
40%
60%
80%
100%
M o-Th(N=11)
Fri (N=4)
Sat (N=15)
Sun (N=5)
Barbecues
0%
20%
40%
60%
80%
100%
M o-Th(N=102)
Fri (N=60)
Sat (N=72)
Sun (N=100)
N=Total number of time-of-day responses received. Note: Not all positive responses (Figure 2) were associated with time-of-day responses, presented above.
Business Survey Results
The results from the 2002 general business survey concurred with previous survey results reported in 2002.1 Corroborated information included (1) WD-WE distributions of work performed throughout the typical workweek, and (2) distributions of work performed throughout the typical workday. Results demonstrated that business activities decline from 60% to 99% on weekends. Because the 2002 general business survey and its results were so similar to the 2000-2001 surveys, data sets were combined to yield a greater degree of statistical confidence and to facilitate analyses of the subgroups for which numbers of respondents were very small, such as businesses that operate gas ovens or perform other specific operations. The results of the combined surveys show that, in general, business activities peak in the 8:00 a.m.-to-4:00 p.m. time frame on weekdays, while weekend activities are more evenly distributed throughout the day. Sundays show the most even distribution of business activity throughout the day. Exceptions include companies that operate garden equipment or heavy-duty construction equipment, which peak early, and businesses that use gas ovens, which peak late on weekdays and sustain high levels of activity through the evening.
Figure 5 illustrates business activity levels, or estimated person-hours worked, by day of week and time of day or various types of businesses, including all surveyed businesses, workplaces that reported specific types of equipment in use, and businesses that responded to the survey of construction activities. The number of person-hours worked (W) was estimated as follows:
Equation (3) W = E × t where
E = number of employees on duty for the time period of interest T = length of the time period of interest (hours)
For all types of businesses in aggregate, weekend activity levels declined from weekday levels by 74% and 82% on Saturdays and Sundays (see Table 3). However, weekend declines in activity levels varied somewhat by type of business. At one extreme, construction companies experience reductions in activity levels from 90% to 99% on Saturdays and Sundays. At the other extreme, businesses that operate gas ovens had activity levels that were only 61% lower on Saturdays. Figure 6 illustrates day-of-week allocation factors (AFDOW) that were developed for commercial activities and calculated as follows:
Equation (4) AFDOW,i = Wi ÷ (5 × WM-F + WSat + WSun) × 100% where
AFDOW,i = day-of-week allocation factor for day i WM-F = average no. of person-hrs. worked for Mon. through Fri. WSat = average no. of person-hrs. worked for Sat. (Sun., Wsun)
Figures 7 and 8 show distributions of person-hours worked by time of day for the general business surveys and for the construction business surveys, with information provided for specific types of equipment and construction activities. On weekdays, daily business activity levels peak from 8:00 a.m. to 4:00 p.m. However, individual types of businesses differ from the aggregate pattern. Businesses that use gas ovens peak in activity levels later in the day, from noon to 4:00 p.m., and have relatively large proportions (between 15% and 30%) of daily activity during evening hours. Activity levels for both lawn and garden care services and construction companies peak much earlier in the day with over 90% of their activities occurring between 4:00 a.m. and 4:00 p.m. With the exception of companies that perform lawn and garden services, Saturdays and Sundays show a more consistent level of activity throughout the 24-hr day compared to the peak observed for most businesses during a typical weekday. In contrast, Sunday levels for lawn and garden activities are dominated almost entirely by two shifts from 8:00 a.m. until 4:00 p.m.
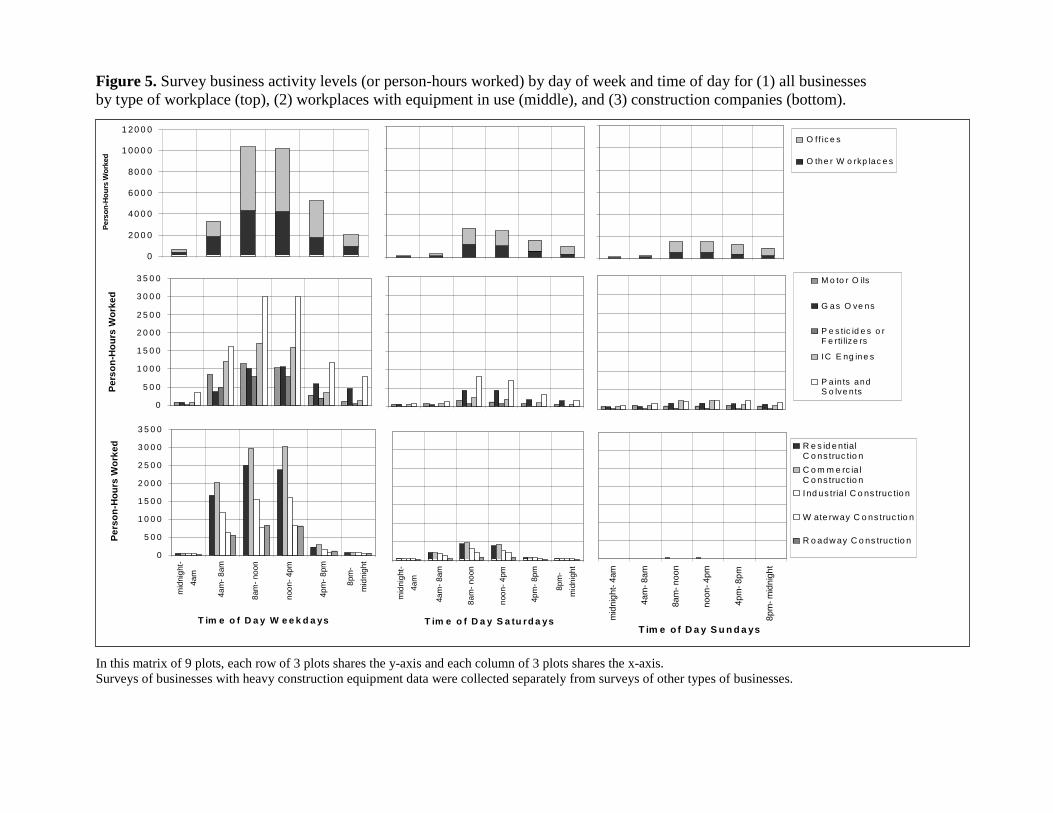
Figure 5. Survey business activity levels (or person-hours worked) by day of week and time of day for (1) all businesses by type of workplace (top), (2) workplaces with equipment in use (middle), and (3) construction companies (bottom).
In this matrix of 9 plots, each row of 3 plots shares the y-axis and each column of 3 plots shares the x-axis. Surveys of businesses with heavy construction equipment data were collected separately from surveys of other types of businesses.
0
5 0 0
1 0 0 0
1 5 0 0
2 0 0 0
2 5 0 0
3 0 0 0
3 5 0 0
Per
son
-Ho
urs
Wo
rked
M o to r O ils
G a s O ve ns
P e s tic id e s o rF e rti lize rs
IC E ng in e s
P a in ts andS o lve n ts
0
20 0 0
40 0 0
60 0 0
80 0 0
1 00 0 0
1 20 0 0
Per
son
-Ho
urs
Wo
rked
O ff ic e s
O the r W o rkp lac e s
mid
nigh
t-
4am
4am
- 8a
m
8am
- no
on
noon
- 4p
m
4pm
- 8p
m
8pm
-
mid
nigh
t
T im e o f D a y S a tu rd a ys mid
nig
ht- 4
am
4am
- 8am
8am
- noo
n
noon
- 4pm
4pm
- 8p
m
8pm
- mid
nigh
t
T im e o f D a y S u n d a ys
R e s id e ntialC o ns truc tio n
C o m m e rc ia lC o ns truc tio n
I nd us tria l C o ns truc tio n
W ate rway C o ns truc tio n
R o adw ay C o ns truc tio n
0
5 0 0
1 0 0 0
1 5 0 0
2 0 0 0
2 5 0 0
3 0 0 0
3 5 0 0
mid
nigh
t-
4am
4am
- 8a
m
8am
- no
on
noon
- 4p
m
4pm
- 8p
m
8pm
-
mid
nigh
t
T im e o f D a y W e e k d a ys
Per
son
-Ho
urs
Wo
rked
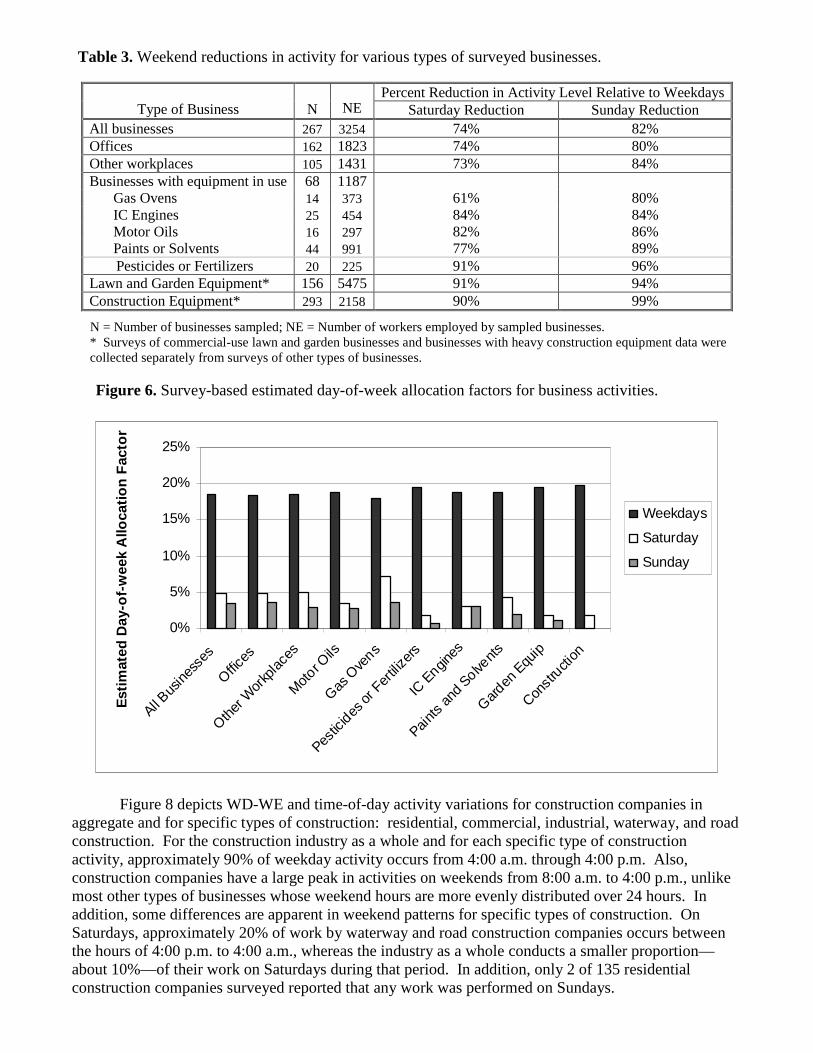
Table 3. Weekend reductions in activity for various types of surveyed businesses.
Percent Reduction in Activity Level Relative to Weekdays Type of Business
N NE Saturday Reduction Sunday Reduction
All businesses 267 3254 74% 82% Offices 162 1823 74% 80% Other workplaces 105 1431 73% 84% Businesses with equipment in use 68 1187
Gas Ovens 14 373 61% 80% IC Engines 25 454 84% 84% Motor Oils 16 297 82% 86% Paints or Solvents 44 991 77% 89%
Pesticides or Fertilizers 20 225 91% 96% Lawn and Garden Equipment* 156 5475 91% 94% Construction Equipment* 293 2158 90% 99%
N = Number of businesses sampled; NE = Number of workers employed by sampled businesses. * Surveys of commercial-use lawn and garden businesses and businesses with heavy construction equipment data were collected separately from surveys of other types of businesses.
Figure 6. Survey-based estimated day-of-week allocation factors for business activities.
0%
5%
10%
15%
20%
25%
All Bus
iness
es
Offic
es
Other W
orkp
laces
Motor O
ils
Gas O
vens
Pestic
ides o
r Fer
tilize
rs
IC E
ngines
Paints
and S
olvents
Gard
en E
quip
Const
ructi
on
Est
imat
ed D
ay-o
f-w
eek
Allo
cati
on
Fac
tor
Weekdays
Saturday
Sunday
Figure 8 depicts WD-WE and time-of-day activity variations for construction companies in aggregate and for specific types of construction: residential, commercial, industrial, waterway, and road construction. For the construction industry as a whole and for each specific type of construction activity, approximately 90% of weekday activity occurs from 4:00 a.m. through 4:00 p.m. Also, construction companies have a large peak in activities on weekends from 8:00 a.m. to 4:00 p.m., unlike most other types of businesses whose weekend hours are more evenly distributed over 24 hours. In addition, some differences are apparent in weekend patterns for specific types of construction. On Saturdays, approximately 20% of work by waterway and road construction companies occurs between the hours of 4:00 p.m. to 4:00 a.m., whereas the industry as a whole conducts a smaller proportion—about 10%—of their work on Saturdays during that period. In addition, only 2 of 135 residential construction companies surveyed reported that any work was performed on Sundays.
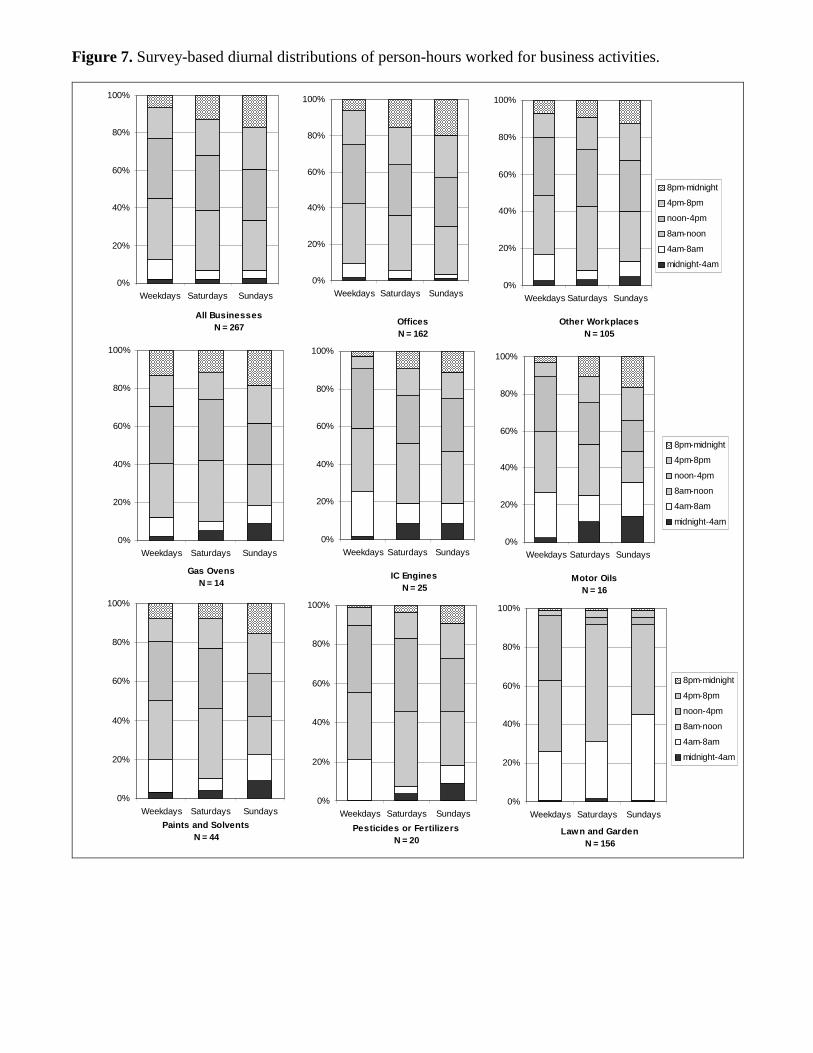
Figure 7. Survey-based diurnal distributions of person-hours worked for business activities.
All BusinessesN = 267
0%
20%
40%
60%
80%
100%
Weekdays Saturdays Sundays
Gas OvensN = 14
0%
20%
40%
60%
80%
100%
Weekdays Saturdays Sundays
IC EnginesN = 25
0%
20%
40%
60%
80%
100%
Weekdays Saturdays Sundays
Motor Oils N = 16
0%
20%
40%
60%
80%
100%
Weekdays Saturdays Sundays
8pm-midnight
4pm-8pm
noon-4pm
8am-noon
4am-8am
midnight-4am
Paints and SolventsN = 44
0%
20%
40%
60%
80%
100%
Weekdays Saturdays Sundays
Pesticides or FertilizersN = 20
0%
20%
40%
60%
80%
100%
Weekdays Saturdays Sundays
Lawn and Garden N = 156
0%
20%
40%
60%
80%
100%
Weekdays Saturdays Sundays
8pm-midnight
4pm-8pm
noon-4pm
8am-noon
4am-8am
midnight-4am
OfficesN = 162
0%
20%
40%
60%
80%
100%
Weekdays Saturdays Sundays
Other WorkplacesN = 105
0%
20%
40%
60%
80%
100%
Weekdays Saturdays Sundays
8pm-midnight
4pm-8pm
noon-4pm
8am-noon
4am-8am
midnight-4am
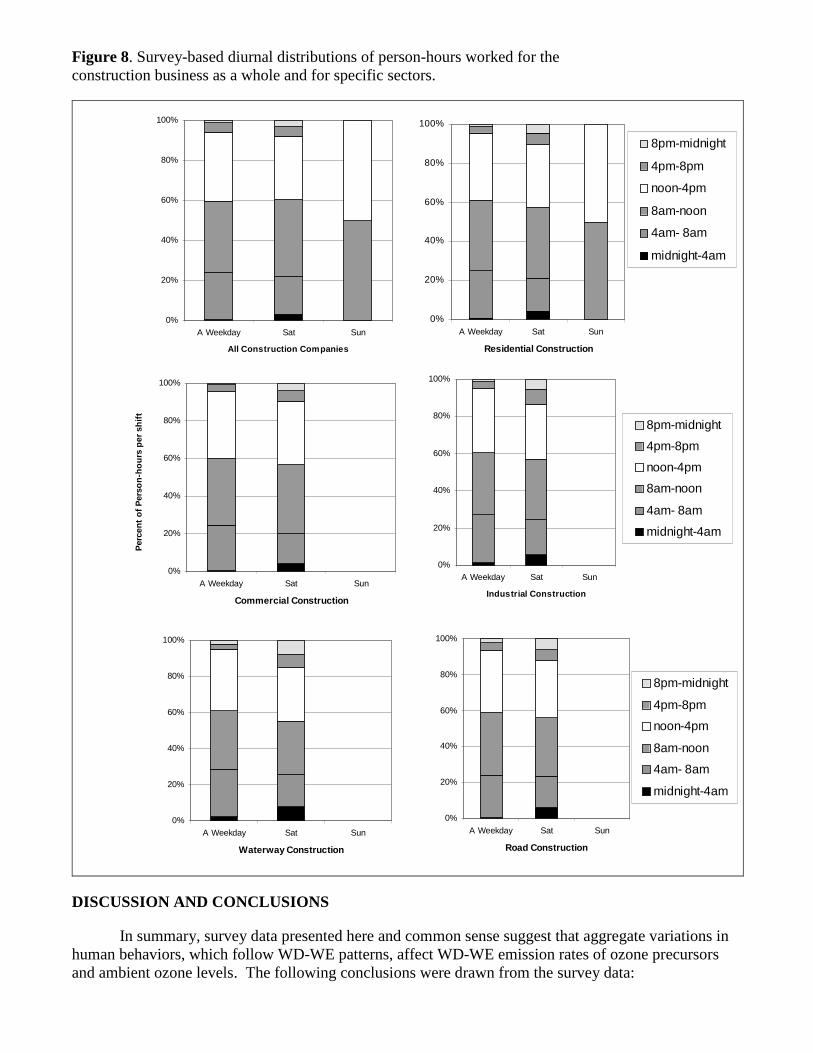
Figure 8. Survey-based diurnal distributions of person-hours worked for the construction business as a whole and for specific sectors.
0%
20%
40%
60%
80%
100%
A Weekday Sat Sun
All Construction Companies
0%
20%
40%
60%
80%
100%
A Weekday Sat Sun
Residential Construction
8pm-midnight
4pm-8pm
noon-4pm
8am-noon
4am- 8am
midnight-4am
0%
20%
40%
60%
80%
100%
A Weekday Sat Sun
Industrial Construction
8pm-midnight
4pm-8pm
noon-4pm
8am-noon
4am- 8am
midnight-4am
0%
20%
40%
60%
80%
100%
A Weekday Sat Sun
Waterway Construction
0%
20%
40%
60%
80%
100%
A Weekday Sat Sun
Road Construction
8pm-midnight
4pm-8pm
noon-4pm
8am-noon
4am- 8am
midnight-4am
0%
20%
40%
60%
80%
100%
A Weekday Sat Sun
Commercial Construction
Per
cen
t o
f P
erso
n-h
ou
rs p
er s
hif
t
DISCUSSION AND CONCLUSIONS
In summary, survey data presented here and common sense suggest that aggregate variations in human behaviors, which follow WD-WE patterns, affect WD-WE emission rates of ozone precursors and ambient ozone levels. The following conclusions were drawn from the survey data:
• Some residential activities increased from 25% to 165% from weekdays to weekends, which corroborates previously presented data.1 This included residential use of barbecues, recreational boats and off-road vehicles, and paints or solvents. Other types of activities varied less than 25% by day of week, including residential uses of personal care products and water heating for showers, baths, and automatic home appliances.
• Diurnal distributions for some residential activities varied by day of week. For example, on weekdays, approximately 88% or more of barbecue use occurred during the evenings. But on weekends, afternoon use of barbecues increased from 25% to 35% of total daily use. Little or no WD-WE dependence was observed in the diurnal patterns for water heating.
• Business activities declined substantially on weekends, from 60% to 99%. Most types of businesses experienced peak activities levels from 8:00 a.m. to 4:00 p.m. on weekdays, a leveling off of peak activities on Saturday, and a relatively flat distribution on Sundays. Exceptions are lawn and garden businesses and construction businesses, which peak from 4:00 a.m. to 4:00 p.m. on weekdays and conduct almost no work on Sundays. Exceptions also include businesses that use gas ovens, which on weekdays peak slightly later in the day and sustain high levels of activity through the evening hours and weekends.
Previously, we reported that weekend emissions patterns in Los Angeles favor ozone formation to a greater extent than do weekday emission patterns, despite predicted weekend reductions in total emissions of ozone precursors. The reason is that weekend NOx reductions are larger than the corresponding ROG reductions, which lead to lessened early-morning titration of ozone by fresh NOx emissions and increased ambient ROG:NOx ratios. (Higher ROG:NOx ratios tend to favor ozone production.) However, we also reported that our analyses were limited by several factors:
1) The previous study was conducted for specific neighborhoods of Los Angeles, which might not have been representative of the entire Los Angeles Air Basin.
2) The previous study was conducted in September and October of 2000 or 2001, which might not have been representative of summertime conditions.
3) Sample sizes were small for businesses in some cases.
4) No WD-WE activity patterns were available for several important source categories: recreational off-road equipment, recreational boats, and heavy-duty construction equipment.
The results we present in this paper remedy each of these limitations and strengthen our previous preliminary conclusions. We surveyed (1) respondents who were selected randomly throughout the SoCAB and (2) respondents who were located in two of the neighborhoods previously studied in 2000-2001 and in three additional neighborhoods. In addition, our latest study occurred during the summer. By cross-comparing the various results, we have confirmed that our earlier results were reasonably representative of summertime activity patterns throughout the SoCAB. Because all surveys were comparable and produced similar results, we are able to combine data sets, increase the sample sizes, and therefore increase confidence in our earlier findings. In addition, because our latest studies produced new information about WD-WE activity patterns for recreational off-road equipment, recreational boats, and heavy-duty construction equipment, it appears that when our analyses are finalized, the WD-WE shifts in ROG:NOx ratios will be more pronounced than we previously reported. We can expect this result because activity levels for recreational vehicles and boats, which emit more ROG than NOx, increase on weekends compared to weekdays, while activity levels for heavy-duty construction equipment, which emit more NOx than ROG, decrease on weekends compared to weekdays. Thus, it appears that the ROG:NOx ratio will increase on weekends relative to weekdays to an even greater extent than STI previously estimated.
ACKNOWLEDGMENTS
The authors gratefully acknowledge the contributions of Leon Dolislager of the California Air Resources Board (ARB), the ARB technical contact and Project Officer; Population Research Systems of San Francisco, the firm that conducted surveys and recruited study volunteers; and our colleagues at Sonoma Technology, Inc. This research project is being completed under contract with the ARB. However, the opinions expressed do not necessarily reflect the views of the ARB.
REFERENCES
1. Coe D.L.; Ryan P.A.; Chinkin L.R. “Weekday/Weekend Activity Patterns for Residential and Small Commercial Area Sources in Los Angeles.” Presented at the International Emission Inventory Conference, Atlanta, GA, April 15 to 18, 2002; paper.
2. Austin, J.; Tran, H. “A Characterization of the Weekend/Weekday Behavior of Ambient Ozone Concentrations in California”. Draft staff report prepared by the Technical Support and Planning Division, California Air Resources Board, Sacramento, CA. 1999.
3. Fujita, E.M.; Stockwell, W.R.; Campbell, D.E.; Chinkin, LR.; Main, H.H.; Roberts, P.T. “Weekend/Weekday Ozone Observations in the South Coast Air Basin: Volume I – Executive Summary”. Final report prepared for the National Renewable Energy Laboratory, Golden, CO, by the Desert Research Institute, Reno, NV, and Sonoma Technology, Inc., Petaluma, CA. 2000.
4. Fujita, E.M.; Campbell, D.E.; Stockwell, W.; Keislar, R.E.; Zielinska, B.; Sagebiel, J.C.; Goliff, W.; Keith, M.; Bowen, J.L. “Weekend/Weekday Ozone Observations in the South Coast Air Basin: Volume II – Analysis of Air Quality Data.” Final report prepared for the National Renewable Energy Laboratory, Golden, CO, and the Coordinating Research Council, Alpharetta, CA, by the Desert Research Institute, Reno, NV. 2002.
5. Chinkin L.R.; Main H.H.; Roberts P.T. “Weekday/Weekend Ozone Observations in the South Coast Air Basin: Volume III – Analysis of Summer 2000 Field Measurements and Supporting Data.” Final report STI-999670-2124-FR, Prepared for National Renewable Energy Laboratory, Golden, CO, by Sonoma Technology, Inc., Petaluma, CA. April 2002.
6. Glover, E.; Brzezinski, D. “Trip Length Activity Factors for Running Loss and Exhaust Running Emissions”. Draft Report M6.FLT.005, Prepared for the U.S. Environmental Protection Agency, Assessment and Modeling Division, Ann Arbor, MI. February 1998.
7. Chinkin L.R.; Coe D.L.; Funk T.H.; Hafner H.R.; Roberts P.T.; Ryan P.A.; Lawson D.R. “Weekday Versus Weekend Emissions Activity Patterns for Ozone Precursor Emissions in California's South Coast Air Basin.” In Journal of Air & Waste Management Association STI-999679-2225. Air and Waste Management Association, 2003.
8. California Air Resources Board (ARB). “ARB Weekend Effect Research Group Homepage”, last updated March 1, 2002. http://www.arb.ca.gov/aqd/weekendeffect/weekendeffect.htm.
9. Chinkin L.R.; Roberts P.T. “A Proposal for Collection and Analysis of Weekend/Weekday Activity Data in the South Coast Air Basin, Volume II.” Technical proposal submitted to the California Air Resources Board, Sacramento, CA, by Sonoma Technology, Inc., Petaluma, CA, February 2001.
10. U.S. Census Bureau. “CenStats Database: County Business Patterns Data (NAICS).” Database last updated on January 27, 2003. http://censtats.census.gov/cbpnaic/cbpnaic.shtml; last accessed on April 1, 2003.

KEY WORDS AND PHRASES Ozone Los Angeles Weekend Ozone Effect Temporal Profiles Diurnal Profiles Weekly Profiles, or Day-of-week Profiles Surveys, Telephone Surveys, Mail Area Sources Lawn and Garden Equipment, Commercial Gas Ovens, Commercial Barbecues, Residential Construction Solvents Paints (or Surface Coatings) Personal Care Products Recreational Boats Recreational Off-road Vehicles Motor Oils, Commercial Garden Chemicals (or Pesticides and Fertilizers), Commercial Residential Water Heating Internal Combustion Engines, Commercial