observations of water, air and soil pollution in israel and vicinity from the erts-1 imagery
TRANSCRIPT
O B S E R V A T I O N S OF WATER, AIR AND SOIL
P O L L U T I O N IN ISRAEL AND VICINITY FROM
THE ERTS-1 IMAGERY
JOSEPH OTTERMAN, AVIHU GINZBURG, GEORGE OHRING, and YURI MEKLER
Dept. of Environmental Sciences, Tel-Aviv University, Ramat Aviv, Israel
(Received 2 August, 1973)
Abstract. Israel is a participant in the Earth Resources Technology Satellite Program (ERTS). The imagery of Israel and vicinity taken by the Multi Spectral Scanner of the ERTS-1 Satellite has been the subject of analysis in a multidisciplinary research program. The objectives of the program are mapping of agricultural crops, mainly wheat and orange groves, mapping of natural vegetation, and studies for Israeli hydrology, arid regions research, geology, and oceanography.
Cases of water, air, and soil pollution have been observed in the imagery on several dates, and are reported in this paper. These are: oil slicks in the Gulf of Suez and possibly near Haifa; smoke plumes, extending over some 100 km in a nearly straight line along the Gulf of Suez, and soil pollution caused by copper mine effluents in the Arava Valley in Israel The images of these cases of pollution are presented and 'space signatures', i.e., the radiometric spectral characteristics of these cases of pollution as seen from space are also given.
1. Introduction
The possibilities of monitoring air and sea pollution remotely from satellites have been analyzed and reviewed by Ludwig et al. (1969), NASA (1971), and Ohring et al.
(1973a). Among the possible observing techniques are those based upon imaging techniques. Although imagery does not generally provide the type of quantitative information usually required for pollution monitoring (e.g., pollutant composition
and concentration), it may be useful for certain pollution problems. In particular, mapping the actual extent of land, sea, and air pollution episodes may be feasible in some instances through the imaging techniques.
Prior to the launch of ERTS-1, the only available imagery of the Earth from space had been obtained from the meteorological satellites and manned spacecraft missions. Due primarily to poor horizontal resolution, observations of pollution in meteorologi- cal satellite pictures are rare. Anomalous cloud lines in the form of plumes up to 500 km long and up to 25 km wide have been observed on weather satellite cloud pictures, their most likely cause being exhaust from the stacks of ocean ships (Conover, 1966, 1969; Parmenter, 1972). Some of the pictures taken by the astronauts on Earth orbiting missions show smoke plumes (see for example, picture $66-54560 in NASA (1968)).
The ERTS-1 with its high spatial resolution imagery has already provided evidence of pollution. Copeland et al. (1972) have analyzed imagery of the Chesapeake Bay Region and found evidence of plumes from power plants, open burning, and jet contrails. Ohring et al. (1973b) have analyzed jet contrails on ERTS-1 imagery of the
Water, Air, and Soil Pollution 3 (1974) 53-61. All Rights Reserved Copyright © 1974 by D. Reidel Publishing Company, Dordreeht-Holland
54 JOSEPH OTTERMAN ET AL.
area near Cyprus. In the present paper, we present examples of ERTS-1 imagery de- picting cases of water, air and soil pollution in the vicinity of Israel.
2. The ERTS-1 Imagery
The ERTS Program is a NASA project, with international cooperation, whose main object is to repeatedly map the surface of the Earth. The first satellite of the program (ERTS-1) was launched on 1972, July 23, into a nearly polar orbit at an altitude of 915 kin. The orbit was selected to provide nearly global coverage from the satellite imaging sensors. The imaging payload consisted of a scanner, operating in four spectral bands, and three Return Beam Cameras (RBV System), shuttering syn- chronously and operating in three spectral bands. The RBV became inoperative some two weeks after the launch, and currently our only source of imagery is the scanner.
The satellite orbit is sun-synchronous, and thus it operates at an essentially fixed local time. For the region of Israel it is approximately 9: 50 AM. The imaging swath is 185 km (100 n mi), and orbital geometry is such that one day ERTS-1 can pass over the Rift Valley, from the sources of the Jordan to the Tiran Straits, and next day, it can provide us with a coverage along a parallel 185 km swath (with some 60 km over- lap) from the Galilee to the Gulf of Suez. The coverage is repeated every eighteen days.
The normal ground resolution is essentially determined by the instantaneous field of view of the scanner optics - and it is calculated to be 79 in. Even much narrower linear features are recognizable if characterized by high contrast, except that such features are 'bloated up' to the dimension equal to the nominal resolution. The scanner imagery is formed into 185 k m x 185 km individual images, i.e., the length of the image is made arbitrarily equal to the width of the swath.
The four bands of the scanner are designated MSS-4 through MSS-7 (the designa- tion 1 to 3 is assigned to the RBV system). The wavelengths of the bands are as follows:
MSS-4:0.5 to 0.6 #m, green-yellow MSS-5:0.6 to 0.7 #m, orange-red MSS-6:0.7 to 0.8 #m, red-infrared MSS-7:0.8 to 1.1 #m, infrared.
The bands MSS-6 and MSS-7 provide the best contrast for general viewing of imagery, since the atmospheric scattering is smaller in those bands than in MSS-4 and MSS-5. The band MSS-4 is very useful for urban area studies in our region, since these areas are much brighter in this band than the surrounding agricultural or natural vegetation.
Bodies of water are basically dark in all the bands, since coefficients of reflection at the surface are low at all the wavelengths; the brighter areas that show up are caused by light that penetrates the surface and is reflected either from a shallow bottom or from particulate matter suspended in the water. The intensity of such reflection from depth depends on the transmission through the water, and is thus greatest in the green-yellow band, MSS-4, where transmission is high. This is the most useful band

ERTS-1 OBSERVATIONS OF WATER~ AIR AND SOIL POLLUTION IN ISRAEL 55
for underwater studies and mapping of surface currents carrying particulate matter (Otterman, 1974). The infrared band MSS-7 is best for delineating shore lines or extent of flooding, since bodies of water, even quite shallow, are uniformly dark in this band, due to extremely low transmission.
Oil slicks, a main source of ocean pollution, show up darker than the surrounding, unpolluted ocean in all the MSS bands.
3. W a t e r Po l lu t ion - Oi l S l i cks
A comprehensive survey of methods of detecting oil spills is given by Estes and Senger (1972). They present scanner imagery of an oil slick taken with the University of Michigan multispectral scanner. In the UV and the blue spectral intervals, the slick shows up brighter in the imagery, while in the imagery above 0.52 #m there is essen- tially no contrast.
In view of the above, there was no expectation to monitor oil spills in the Israeli program of the ERTS-1 imagery analysis. And it was quite unexpected, when, in examining an MSS-5 positive print of the Gulf of Suez (Image number E-1091-07491, 1972, October 22), dark spots were observed in two locations around the oil produc- tion platforms in the Gulf, some 6 to 12 km off the shore of Sinai. These dark spots could not be interpreted in any other way except as oil slicks. Subsequent check with the operating crew confirmed that a break occurred in an underwater pipe prior to that date, between October 15 and October 21. The slicks are partially obscured by smoke (see Figure 1).
Further examination of the same image showed an elongated dark spot near the Egyptian shore in the vicinity of E1 Morgan oil field. This was also interpreted as an oil slick some 12 km long, even in the absence of collaborative information.
Analysis of the subsequent image of the same area (Image number E-1109-07493, 1972, November 9), again showed dark spots in the same location around the Israeli production platforms, but the slick near the Egyptian shore cleared up.
No further images of this area were obtained. Analysis of the Mediterranean waters showed only one possible oil slick in a plausible location stretching for some 40 km southwest of Haifa harbor. However, the contrast is weak and, in the absence of collaborative information, it is difficult to draw definite conclusions (Image number E-1091-07480, 1972, October 22).
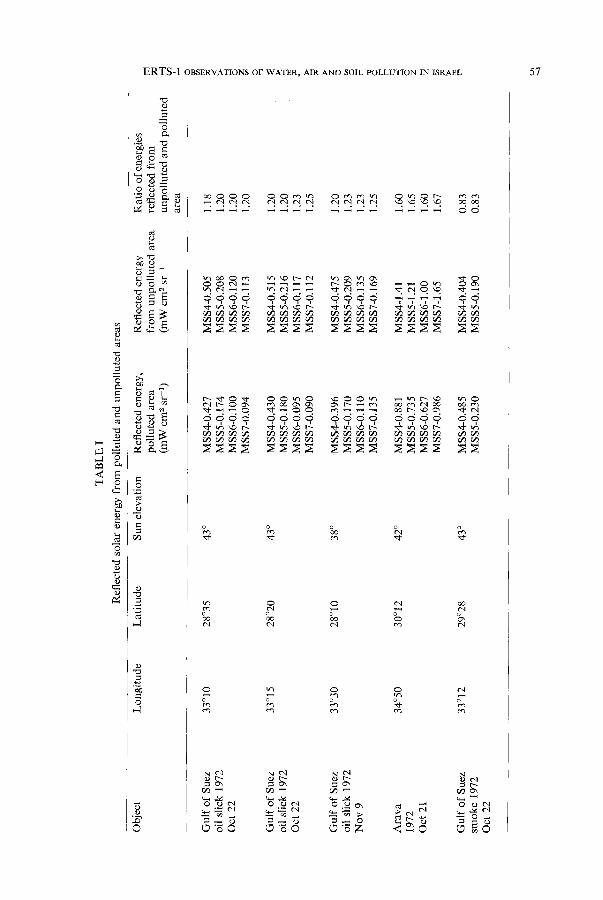
The radiometric characteristics of the oil slicks vs the unpolluted ocean are shown in Table I. It is not known whether the darkening is due to spectral reflection charac- teristics of oil film vs sea water, or to the mechanical effect of smoothing the surface.
4. A ir Po l lu t ion - S m o k e P l u m e s
Brighter areas over the ocean in band MSS-4 only indicate subaquous features. Areas brighter in all four bands indicate atmospheric phenomena, such as clouds, dust, contrails or smoke.

56 JOSEPH OTTERMAN ET AL.
Fig. 1. Multi spectral scanner image, Band 5, of the Gulf of Suez, 1972, October 22.
ERTS-1 O B S E R V A T I O N S OF WATER~ AIR A N D SO I L P O L L U T I O N I N I SRA EL 5 7
0
<
0 ~
¢d
c~
7
b~L
0
0 ,-1
©
. . . . ~ q ~ q ~ q ~ ' ~ ' " o d
NN~N NNNN NNNN NNNN N~
% % 0 ~.
. ~ ¢,q
~_~ ~ _ ~ ~_o ~"~ ~ ~ ~ ~ ~ z <-~ o
58 JOSEPH OTTERMAN El" AL.
The same ERTS-1 image presented here as Figure 1 shows a clear case of air pollu- tion over the Gulf of Suez: very long smoke plumes. Near the northernmost oil pro- duction platforms, one can readily observe two smoke plumes originating from two points some 3 km apart, which merge and spread downwind for about 100 km, and broaden to some 2 to 3 km. The direction of the plumes follows the prevalent wind direction, from azimuth 310 ° to 340 ° .
The smoke obviously originates from flaring off. Another plume, some 20 km long, originates from a flare at a southern production platform.
The contrast between the plume and the ocean is tabulated for the MSS bands in
Table I.
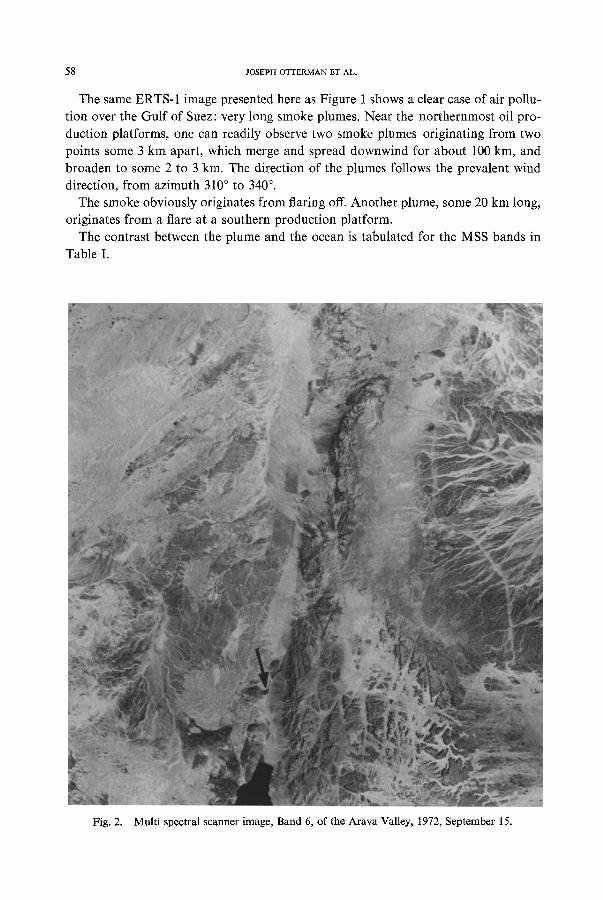
Fig. 2. Multi spectral scanner image, Band 6, of the Arava Valley, 1972, September 15.
ERTS-1 OBSERVATIONS OF WATER, AIR AND SOIL POLLUTION IN ISRAEL 59
5. Soil Pollution - COpper Mine Effluents
The Arava Valley, on the border between Israel and the Kingdom of Jordan, which extends from the Dead Sea in the North to the Gulf of Akaba (Solomon's Gulf) in the south, stands out very bright against the dark granites of the mountains of Edom in Jordan. The MSS-6 image of the area of 1972, September 15, is presented as Figure 2. The black area in the center at the bottom of the image is a section of the Gulf. The bright floor of the valley shows a very dark spot (dark in all the bands) 25 km north of the shore of the Gulf. The spot is some 2 km north to south and 3 km east to west, with an elongated strip towards the northeast. The spot is located east of the Timna copper mines and corresponds, in location, to the region where the effluents of the mine are dumped. An arrow points to this spot in Figure 2.
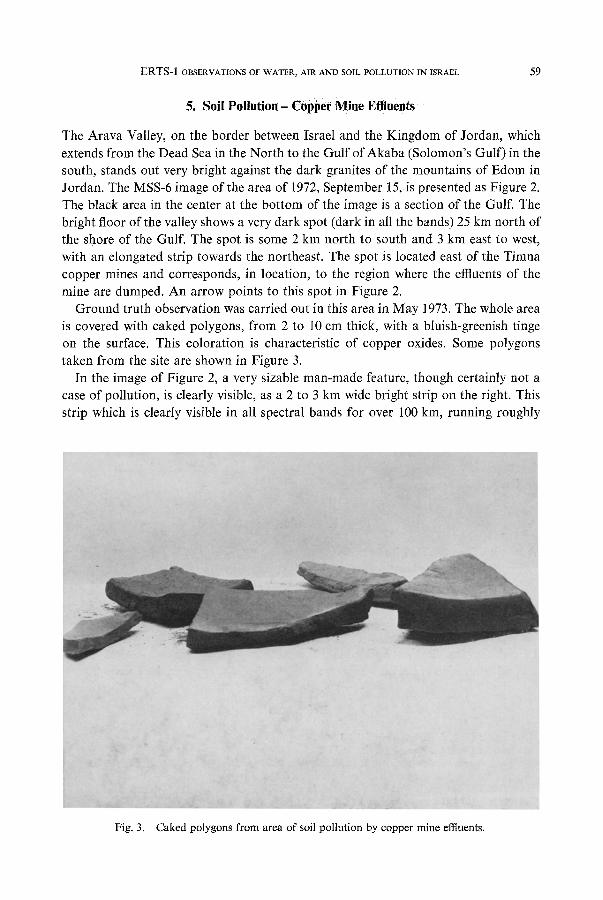
Ground truth observation was carried out in this area in May 1973. The whole area is covered with caked polygons, from 2 to 10 cm thick, with a bluish-greenish tinge on the surface. This coloration is characteristic of copper oxides. Some polygons taken from the site are shown in Figure 3.
In the image of Figure 2, a very sizable man-made feature, though certainly not a case of pollution, is clearly visible, as a 2 to 3 km wide bright strip on the right. This strip which is clearly visible in all spectral bands for over 100 km, running roughly
Fig. 3. Caked polygons from area of soil pollution by copper mine effluents.

60 JOSEPH OTTERMAN ET AL.
from north to south, is the principal way the pilgrims travel to Mecca from the north towards this Moslem holy city. This imprint of one of the world's great religions shows cumulative effects possibly over the last fourteen centuries and is one of the larger permanent man-made imprints on the ERTS-1 imagery.
6. Radiometric Space Signatures of Pollution Cases
The space signatures of pollution cases were obtained for the four spectral bands of the Multi Spectral Scanner by means of an Iris Densitometer. This instrument was chosen because of its availability rather than suitability.
The method of operation is as follows. The transparency is placed in a beam of light, which passes through an iris into a photocell. This beam, the measuring beam, is one of the two beams incident in turns, on the photocell, switched by a chopper. The other beam is called the reference beam. The diameter of the iris opening is adjusted until tl=e intensity of the measuring beam is equal to that of the reference beam. When this equality exists, the diameter of the iris opening is a measure of the film density in the location examined. The disadvantages of the instrument are the relatively large spot size of the measuring beam, and also the possibility of a burn in the trans- parency by prolonged exposure to the beam.
The ERTS-1 imagery contains on its margin grey scale for calibration of density. This scale is in 15 steps, enabling one to translate the density into absolute radiance levels (Goldberg, 1972). Table I shows the radiances for the polluted and unpolluted regions and the computed contrasts for each MSS band.
7. Conclusions
Analysis of the ERTS-1 imagery has revealed the possibility of monitoring and map- ping of water, air, and soil pollution. Based on the cases presented, it appears that the extent of pollution incidents can be accurately delineated.
The great weakness of pollution monitoring through ERTS-1 imagery is that an accurate spectral 'signature' of the polluted area could not be determined- and identification of the pollutant could not be made through signature analysis only. Indeed, the identifications claimed in this paper are based in each case on the fact that such identification is the only explanation possible for that particular location.
References
Conover, J. : 1966, J. Atmospheric Sci. 23, 778. Conover, J. : 1969, 3. Atmospheric Sci, 26, 1153. Copeland, G., Ludwick, J., Marshall, H., Bandy, A., and Fleischer, P. : 1972, 'Use of ERTS Imagery
in Air Pollution and Marine Biology Studies', Tasks 1 through 3, NASA-CR-129800, 22 pp. Estes, J. E. and Senger, L. W. : 1972, Remote Sensing Environ. 2, 141. Goldberg, I. L. : 1972, private communication. Ludwig, C., Bartle, R., and Griggs, M. : 1969, Study of Air Pollutant Detection by Remote Sensors,
NASA CR-1380, 97 pp.

ERTS-I OBSERVATIONS OF WATER, AIR AND SOIL POLLUTION IN ISRAEL 61
NASA: 1968, Earth Photographs from Gemini VI through XI1, NASA Sp-171,327 pp. NASA: 1971, Remote Measurements of Air Pollution, NASA Sp-285, 253 pp. Ohring, G., Otterman, J., and Joseph, J. : 1973a, Water, Ah' and Soil Pollution 2, 191. Ohring, G., Otterman, J., Joseph, J., and Levin, Z. : 1973b, 'Contrails Study from ERTS-1 Imagery of
Eastern Mediterranean', Proc. 4th Sci. Conf. of lsrael Ecological Society, p. I15-I36. Otterman, J. : 1974, Deep-Sea Research 21, 163-165. Parmenter, F. : 1972, Monthly Weather Rev. 100, 646.