observational determinations of the proton to electron mass ratio ( ) in the early universe rodger...
TRANSCRIPT

Observational Determinations of the Proton to Electron Mass Ratio () in the Early Universe
Rodger Thompson- Steward Observatory, University of Arizona

Collaborators
Jill BechtoldJohn BlackDaniel EisensteinXiaohui FanRobert KennicuttCarlos MartinsXavier ProchaskaYancey ShirleyWim Ubachs

Fundamental Constants
Fundamental Constants are pure numbers whose value determines the nature of our physical universe.
Any civilization that can count will come up with the same values for the fundamental constants.
ce
2
e
p
mm

Motivation
Pure intellectual interest in establishing the value of a fundamental “constant” in the early universeInput and information to guide our way through the vast landscape (10500?) of elementary particle and dark energy theories

This Talk
A bit of historyConcept for measuring A sense of the advantages and problems of the conceptA sense of the accuracy of the measurementWhat can we do in the future and is it relevant?

History of Rolling Constants
Dirac in 1937 appears to be the first to discuss the possible time variation of fundamental constants although was not one of them since its value is not near unity.Dirac was followed by Teller (1948) and Gamow (1967) who both speculated that the ratio of the fine structure constant to the dimensionless gravitational constant would vary. c
GmP
2

Possibility of measuring in the early universe
In 1975 Thompson proposed a method for measuring the fundamental constant = mp/me in the early universe using molecular spectra. In particular the redshifted absorption lines of the Lyman and Werner bands of H2 in Damped Lyman Alpha Absorber (DLA) clouds.(Note: No picture of Thompson was found in the archives of famous physicists!)

Molecular Spectra and
20
2
0
2
amaeE
eel
0
22
amee
elvibp Eam 202
Following a treatment in Shu (1991) we can write thebinding energy of a molecule as
where we used
and a0 is the Bohr radius. If we displace the nuclei by a0
then they will vibrate in the potential well with an energy
The frequency is then 40
2
20
2
ammamE
pep
elvib
but elp
ev
pevvibvvib Em
mnmma
nnE 20
2
For rotation the moment of inertia is20amp
The angular momentum is Rrotp nam 20 so 20am
np
Rrot
Then elp
eR
pRrotrot Em
mnam
nE 20
2

DLA Concept
Quasar
DLA containing cold H2
Observer The light is absorbed from the first fewrotational levels of the electronic and vibrational ground state to vibrational androtational levels of the first (Lyman) and second (Werner) excited electronic state.
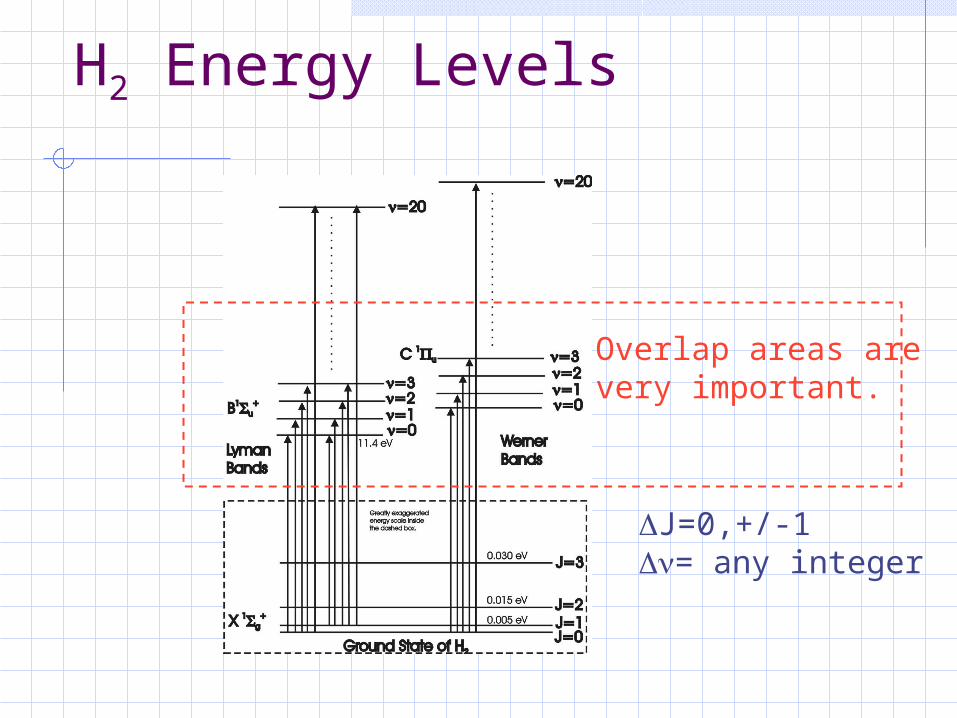
H2 Energy Levels
Overlap areas arevery important.
J=0,+/-1= any integer

Sensitivity Constants
Although implicit in previous work, Varshalovich and Levshakov (1993) explicitly developed the sensitivity constant which for a line i is defined as
The rest frame wavelengths are related to the observed wavelengths by
Each line has a unique sensitivity constant Ki which can be slightly negative, zero or positive.The higher the vibrational quantum number the larger the sensitivity constant.The overlap of the Lyman and Werner bands places lines with very different sensitivity constants in close proximity to each other.
ln
lni i i
ii i
d d dK
d d d
0 (1 )(1 )ii
i
z K

Sensitivity Constants cont.
In principle one can match the wavelengths of the H2 absorption lines against the pattern of shifts predicted by the sensitivity constants.In practice the available signal to noise and resolution allows only a fit to the trend of the predicted shifts.

Redshift vs. Sensitivity Coefficients
From Reinhold et al. 2006

Observational History
Historically there have been 3 types of observations Optical observations of redshifted
absorption lines of the electronic transitions of H2 in DLAs.
Radio observations of rotational and inversion transitions of molecules in molecular clouds.
Laboratory measurement of the current rate of change of .

H2 Observations
When first proposed in 1975 the method required 3 advances to be practical Larger telescopes More sensitive and higher resolution
astronomical spectrometers More accurate measurements of the rest
wavelengths of the transitions
All of these have now occurred

H2 Difficulties
Very few DLAs contain measurable amounts of H2. Only about a dozen known
The Lyman and Werner lines lie in the Ly alpha Forest of atomic absorption linesThe primary shift is in the vibrational and rotational levels. These shifts are diluted by the electronic energy. Typical Ki are about 10-2.

Sample Spectrum and Difficulties
Wavelength in Å
Q0347-383

H2 Advantages
Potential for many lines from the same ground stateWell measured rest wavelengths (Ubachs et al. 2007)
Lines with significantly different sensitivity factors in close spectral proximity Mix of Lyman and Werner lines

The Common Gas Problem
Kinetic motions can mimic wavelength shifts due to fundamental constant variations.Spatial variations in excitation temperature can also mimic shifts.The solution is to only compare transitions of the same species in the same lower level.

Some OpportunitiesLow Shift Lines
High Shift Lines
All 4 lines have the same ground state.
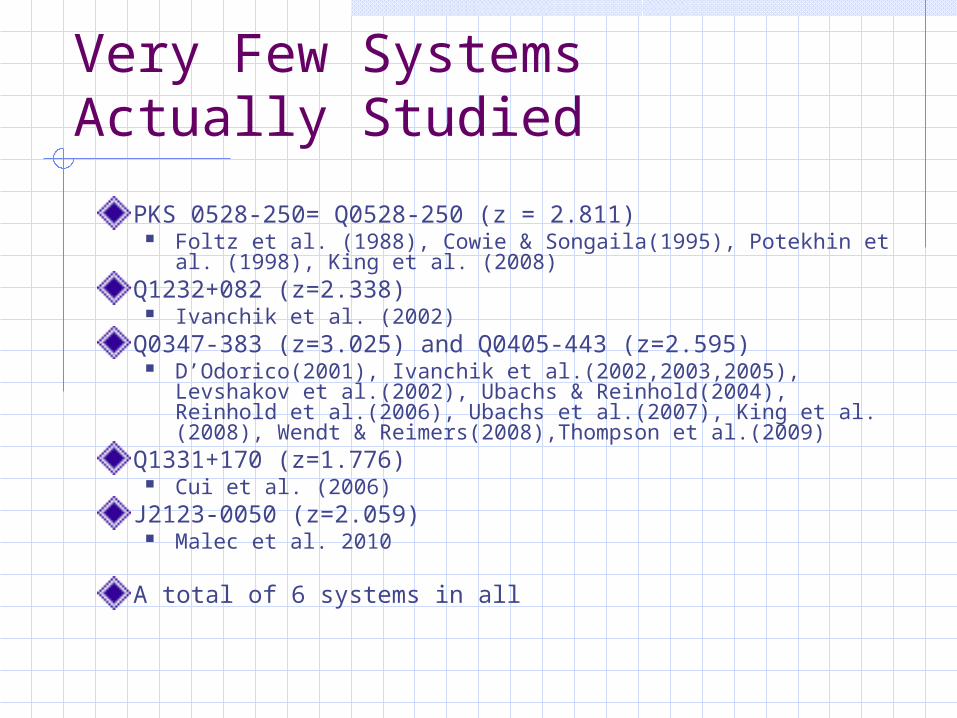
Very Few Systems Actually Studied
PKS 0528-250= Q0528-250 (z = 2.811) Foltz et al. (1988), Cowie & Songaila(1995), Potekhin et al. (1998),
King et al. (2008)Q1232+082 (z=2.338)
Ivanchik et al. (2002)Q0347-383 (z=3.025) and Q0405-443 (z=2.595)
D’Odorico(2001), Ivanchik et al.(2002,2003,2005), Levshakov et al.(2002), Ubachs & Reinhold(2004), Reinhold et al.(2006), Ubachs et al.(2007), King et al. (2008), Wendt & Reimers(2008),Thompson et al.(2009)
Q1331+170 (z=1.776) Cui et al. (2006)
J2123-0050 (z=2.059) Malec et al. 2010
A total of 6 systems in all

Sources of Systematic Errors
Systematic errors in the wavelength calibration The sensitivity factors Ki are roughly
proportional to the vibrational quantum number of the upper state (ground state is always v = 0)
The higher the upper vibrational quantum number the shorter the wavelength
Systematic wavelength errors therefore translate into positive or negative changes in
Partially mitigated by the mixture of Lyman and Werner bands.


Application to the Positive Detection
Systematic wavelength errors in the old UVES reduction pipeline may be the source of the previous positive result for a
change in . New results from the same data (Thompson et al. 2009)
See also King et al. (2008)/ = (-7 +\- 8) x 10-6

Bootstrap Statistics
10,000 bootstrap realizations have a Gaussian Distribution

Lyman Werner Pairs
The superposition of Lyman and Werner lines produces closely spaced pairs with very different sensitivity factors.We looked at the / values for these pairs in Q0347-383 and Q0405-443.The negative /for Q0347-383 is marginally significant.

z values for Lyman-Werner Pairs

Instrument Systematics
In most spectrometers the light path of the calibration lamp is not the same as the object light path Different angles between the object
and calibration lamp principal rays can introduce systematic wavelength differences.
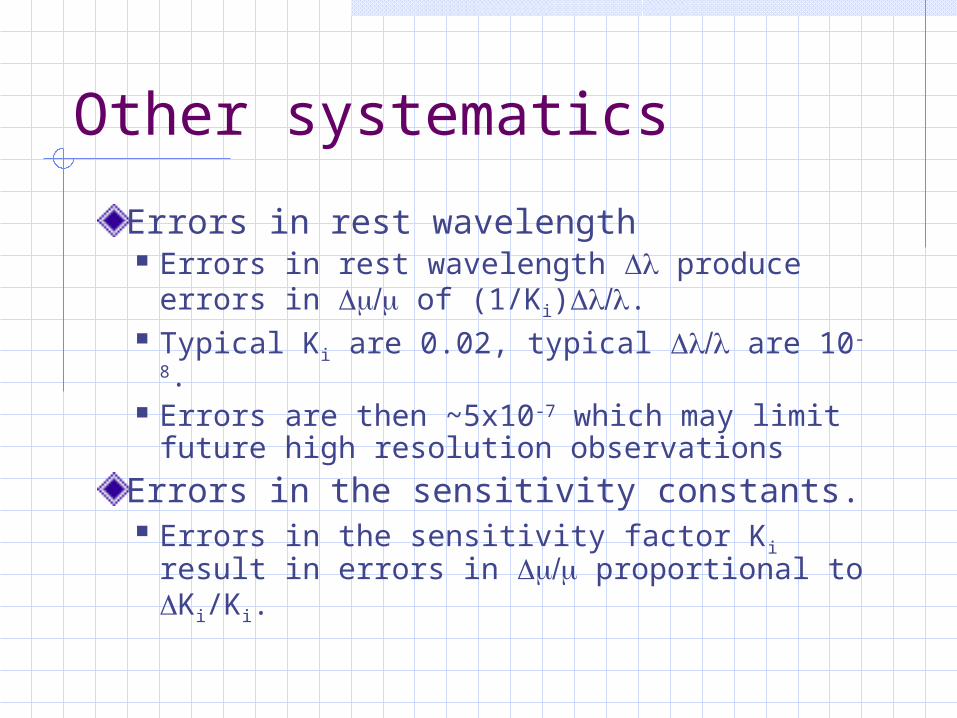
Other systematics
Errors in rest wavelength Errors in rest wavelength produce
errors in of (1/Ki). Typical Ki are 0.02, typical are 10-8. Errors are then ~5x10⁻⁷ which may limit
future high resolution observations
Errors in the sensitivity constants. Errors in the sensitivity factor Ki result
in errors in proportional to Ki/Ki.

Systematics Continued
Mixing of different rotational quantum number lower states Cold and hot gas can have different
kinematics. The effect would be slight since the
lower rotational J levels do not have a large influence on the sensitivity factors.

Summary of the State of H2 Studies
Except for Q0347-383 and Q0405-443 there have been no claims of a detected shift in .Reanalysis of the Q0347-383 and Q0405-443 data by two groups find no shift.From H2 data < 10-5 for a lookback time of 10.5 gigayears (z~3.1).

Implications of the Current State of Observations
Most Super Symmetry (SUSY) models predict a rolling of the fundamental constants Rolling is a change with time as opposed
to running which is a change with energy
Theories of dark energy that evoke a rolling scalar potential also predict rolling fundamental constants

Implications of the Current State of Observations
Quantitative predictions from either SUSY or dark energy are hard to achieve.Inversely, accurate determination of the values of the fundamental constants in the early universe determines the proper parameter space for these theories
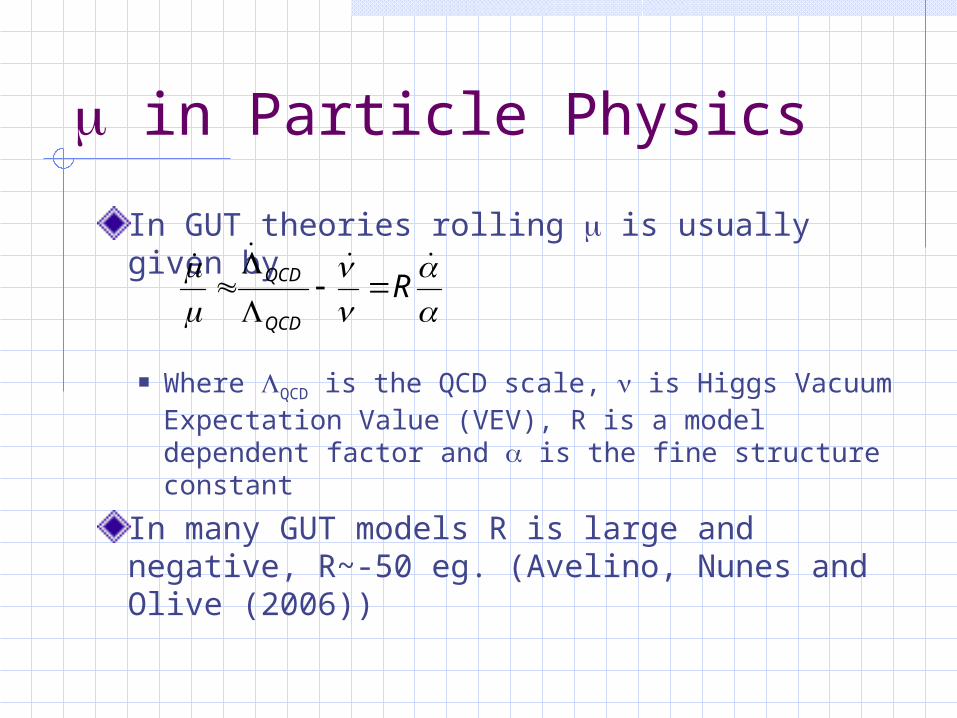
In GUT theories rolling is usually given by
Where QCD is the QCD scale, is Higgs Vacuum Expectation Value (VEV), R is a model dependent factor and is the fine structure constant
In many GUT models R is large and negative, R~-50 eg. (Avelino, Nunes and Olive (2006))
in Particle Physics
RQCD
QCD

in Dark Energy
Quintessence is usually expressed in terms of a potential V() that is a function of the rolling scalar then
Where is , mPl is the Planck mass and is a model dependent parameter
A non-rolling or rolling is therefore a discriminator between a cosmological constant and quintessence
),( 0
Plm8
Nunes & Lidsey (2004)
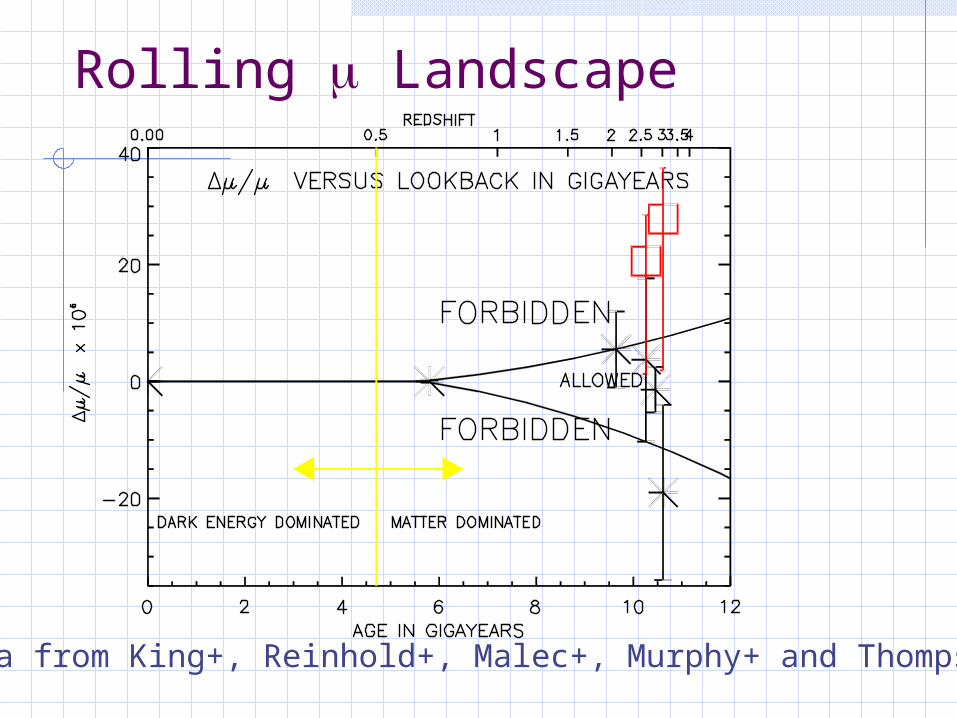
Rolling Landscape
Data from King+, Reinhold+, Malec+, Murphy+ and Thompson+

Current Constraints at 11 Gyr
Particle Physics
Dark Energy
510
RQCD
QCD
510

H2 Optical Observation Status
is constant at the < 10-5 level for look back times up to 11 gigayears.This limit is a legitimate constraint on high energy and cosmological physics.The measurement can be improved by a factor ~10 with existing or nearly complete instrumentation.Further improvement relies on
Larger, 30m class telescopes Higher throughput, higher resolution spectrometers. More precise molecular wavelength measurements Precision laser frequency combs
Measurement of fundamental constants in the early universe is a low cost and powerful tool for the study of cosmology and high energy physics.

History of Radio Molecular Studies
Radio studies of are much more recent than the first optical studies of H2
Studies have concentrated on the inversion transition of ammonia
(ignore colors)

Radio Concept
NH3, CO, CCS, HCN, HCO+
Direct Emission LinesAs Well As Absorption

Advantages of Radio Measurements
Radio telescopes are capable of high frequency resolution < 10-7
Radio molecular transitions have high sensitivity factors KNH3 = 4.46 for inversion transitions Ki ~ 1. for rotational transitions

Disadvantages of Radio Observations
In general there are not multiple lines from the same ground state Often a different molecule is used as the
reference This is a particular problem in systems that have
multiple close spaced velocity components. If the abundance ratios between the two components is different between the two molecules, errors occur.
To date observations have been limited to redshifts less than 1

Observations of NH3 to Determine
Absorption system in the spectrum of B0218+357 at z = 0.68466 Flambaum and Kozlov (2007), Murphy et al.
(2008)
Find || < 1.8 x 10⁻⁶ at z=0.68466 From Murphy et al. 2008 who used HCN and
HCO+ as the wavelength standard The universe is ~1/2 its present age at this
point and in the transition between matter dominated and dark energy dominated epochs.

Spatial variations of within the Milky Way
Levshakov, Molaro and Kozlov (2008) find values of (4-14)x10-8 for various locations in the Milky WayThey compare NH3 emission lines with those of HC3N and N2H+

OH Observations
Four observed transitions that have different dependencies on and gp (the proton g factor).

State of Radio Observations
Most accurate limits on but at redshifts below 1H2 not available at radio wavelengthsThe lower abundance of other molecules is a limiting factorHard to find transitions from a common ground state to eliminate kinematic effects

CMB constraints on me and
Changes in me and produce changes in amplitude and position of the CMB acoustic peaks through changes in the Thomson cross section and other parameters.Statistical modeling of the changes, eg. Landau & Scoccola (2010) give 0=0.986+/0.009 and me/me0=0.999+/-0.035 at a redshift of ~1000

Combination of Atomic and Molecular Measures
The combination of HI 21 cm absorption and Atomic resonance dipole absorptions puts constraints on X=gp2/
New work by Kanekar et al. (arXiv:1003.0444v1) using UV CI line give X/X =(6.8+/-7)x10-6 where systematics dominate the error.

Implications
Current =(-5.7 +/- 1.1)x10-6
Murphy et al. (2004)
Current = (-7 +/- 8)x10-6
Several
X/X=2() + gp/gp – <7x10⁻⁶ Slightly out of the box, consistent with no change in and implies no change in gp at the ~10-5 level.

Options for the future
Very high resolution spectrometers on large telescopes. PEPSI on the LBT at R=300,000 Next generation of telescopes
GMT, TMT, ELT
Dedicated facilities to increase the available observing time.These options are cost effective compared with space borne facilities. Herschel?

PEPSI on the LBT
PEPSI is the Postdam Echelle Polarimetric and Spectroscopic Instrument.Will be installed on the Large Binocular Telescope and is fiber fed from both primary mirrors.Can achieve resolutions of 300,000. 4 times the resolution of UVES on VLT.

PEPSI Layout
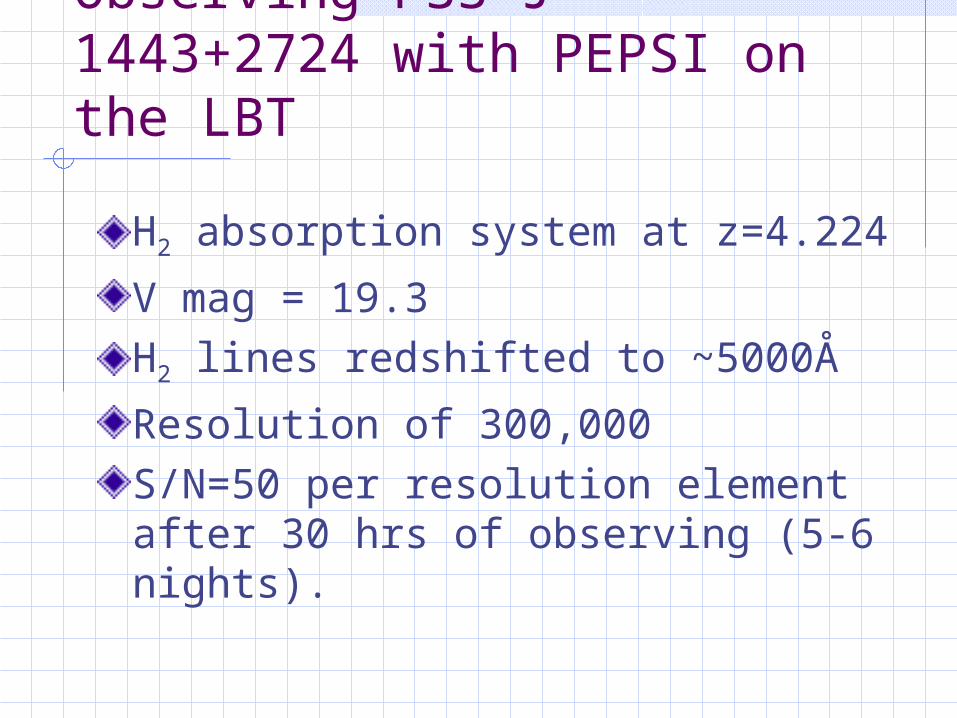
Observing PSS J 1443+2724 with PEPSI on the LBT
H2 absorption system at z=4.224
V mag = 19.3H2 lines redshifted to ~5000Å
Resolution of 300,000S/N=50 per resolution element after 30 hrs of observing (5-6 nights).

GMT Example

Relevant Instruments
Qspec R= 20,000 – 200,000 = 3000 – 10,000 Angstroms
GMT CfA Large Earth Finder (GCLEF) “Precision” = 10 cm/sec, R? Temperature controlled vacuum
enclosure Laser comb wavelength reference